Article

Scenarios for New Mobility Policies and Automated Mobility in Beijing

1
Institute for Transport Studies, University of Leeds, Leeds LS2 9JT, UK
2
Institute of Transport Studies, University of Natural Resources and Life Science (BOKU), 1180 Vienna, Austria
3
School of Systems Science, Beijing Jiaotong University, Beijing 100044, China
4
Institute for Transport and Municipal Administration, Shanghai Urban Planning and Design Co., Ltd. of Shanghai Planning Institute, Shanghai 200011, China
*
Author to whom correspondence should be addressed.
Future Transp. 2024, 4(3), 697-721; https://doi.org/10.3390/futuretransp4030033
Submission received: 22 September 2023 / Revised: 11 April 2024 / Accepted: 11 June 2024 / Published: 3 July 2024

Abstract

:
In this study, we consider the introduction of new mobility services and technologies into the megacity of Beijing, China, as per developed strategy and action plans, in order to investigate their potential contribution to sustainable mobility. This includes population relocation (decentralization), the construction of new rail lines, the introduction of shared bike services as a feeder to subway stations, the electrification of passenger vehicles and the adoption of automated and shared vehicles. The well-established, system dynamics-based MARS model is adapted to Beijing and further improved via the inclusion of these new services, technologies and policies. We find that decentralization can have a profound effect on overall sustainability if not considered in conjunction with other policies and that new rail lines and shared bikes may only have benefits in specific zones. Shared and automated vehicles could increase VKT by 60% and reduce active and public transport trips by a quarter. As such, nuanced integrated policy approaches will be required that are similar to those currently in place, such as imposed car shedding and taxi fleet control.

1. Introduction

In a time of growing concerns about climate change, local air pollution, livability and sustainability, developing megacities such as Beijing, China, face significant challenges, particularly concerning how urban design and mobility interact and impact on priorities such as air quality [1], energy transition [2], carbon mitigation [3] and access to employment [4]. Furthermore, shifts towards electro, automated, shared or active mobility are changing mobility patterns and affecting transportation systems, which has an impact on industry, society and urban governance [5], particularly in megacities [6,7,8,9]. For example, in 2018, Beijing had a population of around 22 million and a private vehicle fleet of nearly 6 million, and it exceeded local pollution standards on average five times per week [10]. Large, diverse populations require safe, efficient and affordable mobility modes for both local travel and across the city region, which relies on a flexible approach to land use and transport integration [11]. Alongside these growing needs and the existing or traditional transport infrastructure are new mobility technologies, services and policies that are thought to be more suitable to the needs of today’s society and to make the best use of technological and social innovations [6].
Such interventions being implemented and considered in megacities such as Beijing include, but are not limited to, population relocation, the construction of new rail lines, the introduction of shared bike services, the electrification of passenger vehicles and the adoption of automated and shared mobility [12]. In this study, we focused on these strategies related to personal mobility since they are viewed as having the greatest potential to contribute to sustainable urban development in Beijing and, in particular, a focus on reducing traffic congestion. Our findings are not only transferable to other megacities but also offer insights into conventional cities. Automated and shared mobility is in the early stages of development and implementation compared to other options, and it is thought to offer many potential benefits, but it is deeply affected by uncertainties [13,14,15,16]. As one of the first demonstration cities, Beijing actively promotes the construction of road testing and an AV application area, having been included in the first batch of demonstration cities for the coordinated development of smart city infrastructure and automated vehicles (AVs) in May 2021 [17].
In this paper, we consider the following interventions that are being implemented and considered as having the most potential in Beijing to realize sustainable mobility: population relocation, the construction of new rail lines, the introduction of shared bike services as a feeder to subway stations, the electrification of passenger vehicles and the adoption of automated and shared mobility as noted by [12]. This study is the first instance of adapting the established land use and transport system dynamics model, MARS (Metropolitan Activity Relocation Simulator) [18], for the municipality of Beijing, reflecting developed strategy and action plans. In doing so, we have also introduced new features into MARS: (1) mode choices for privately owned autonomous and electric vehicles and conventional and autonomous taxis (or shared vehicles) with associated car shedding and (2) shared bicycles as a feeder mode for rail stations. By introducing these new mobility technologies, services and policies and subjecting them to scenario testing, we have assessed their potential contributions to a sustainable transport system within a megacity. More specifically, we answer the following research questions:
(1)
What impacts will the chosen strategies of the Beijing Master Plan have by 2050 on:
  • Overall mode shares?
  • Rail shares, specifically in zones with new rail services?
(2)
Could the introduction of autonomous and shared vehicles lead to a more sustainable transport system?
(3)
How are our findings useful to other regions and their planners?
In the next section, we provide an introduction to the Beijing MARS model and how we implemented these scenarios. In Section 3, we present and discuss our results before finally drawing policy implications and conclusions in Section 4.

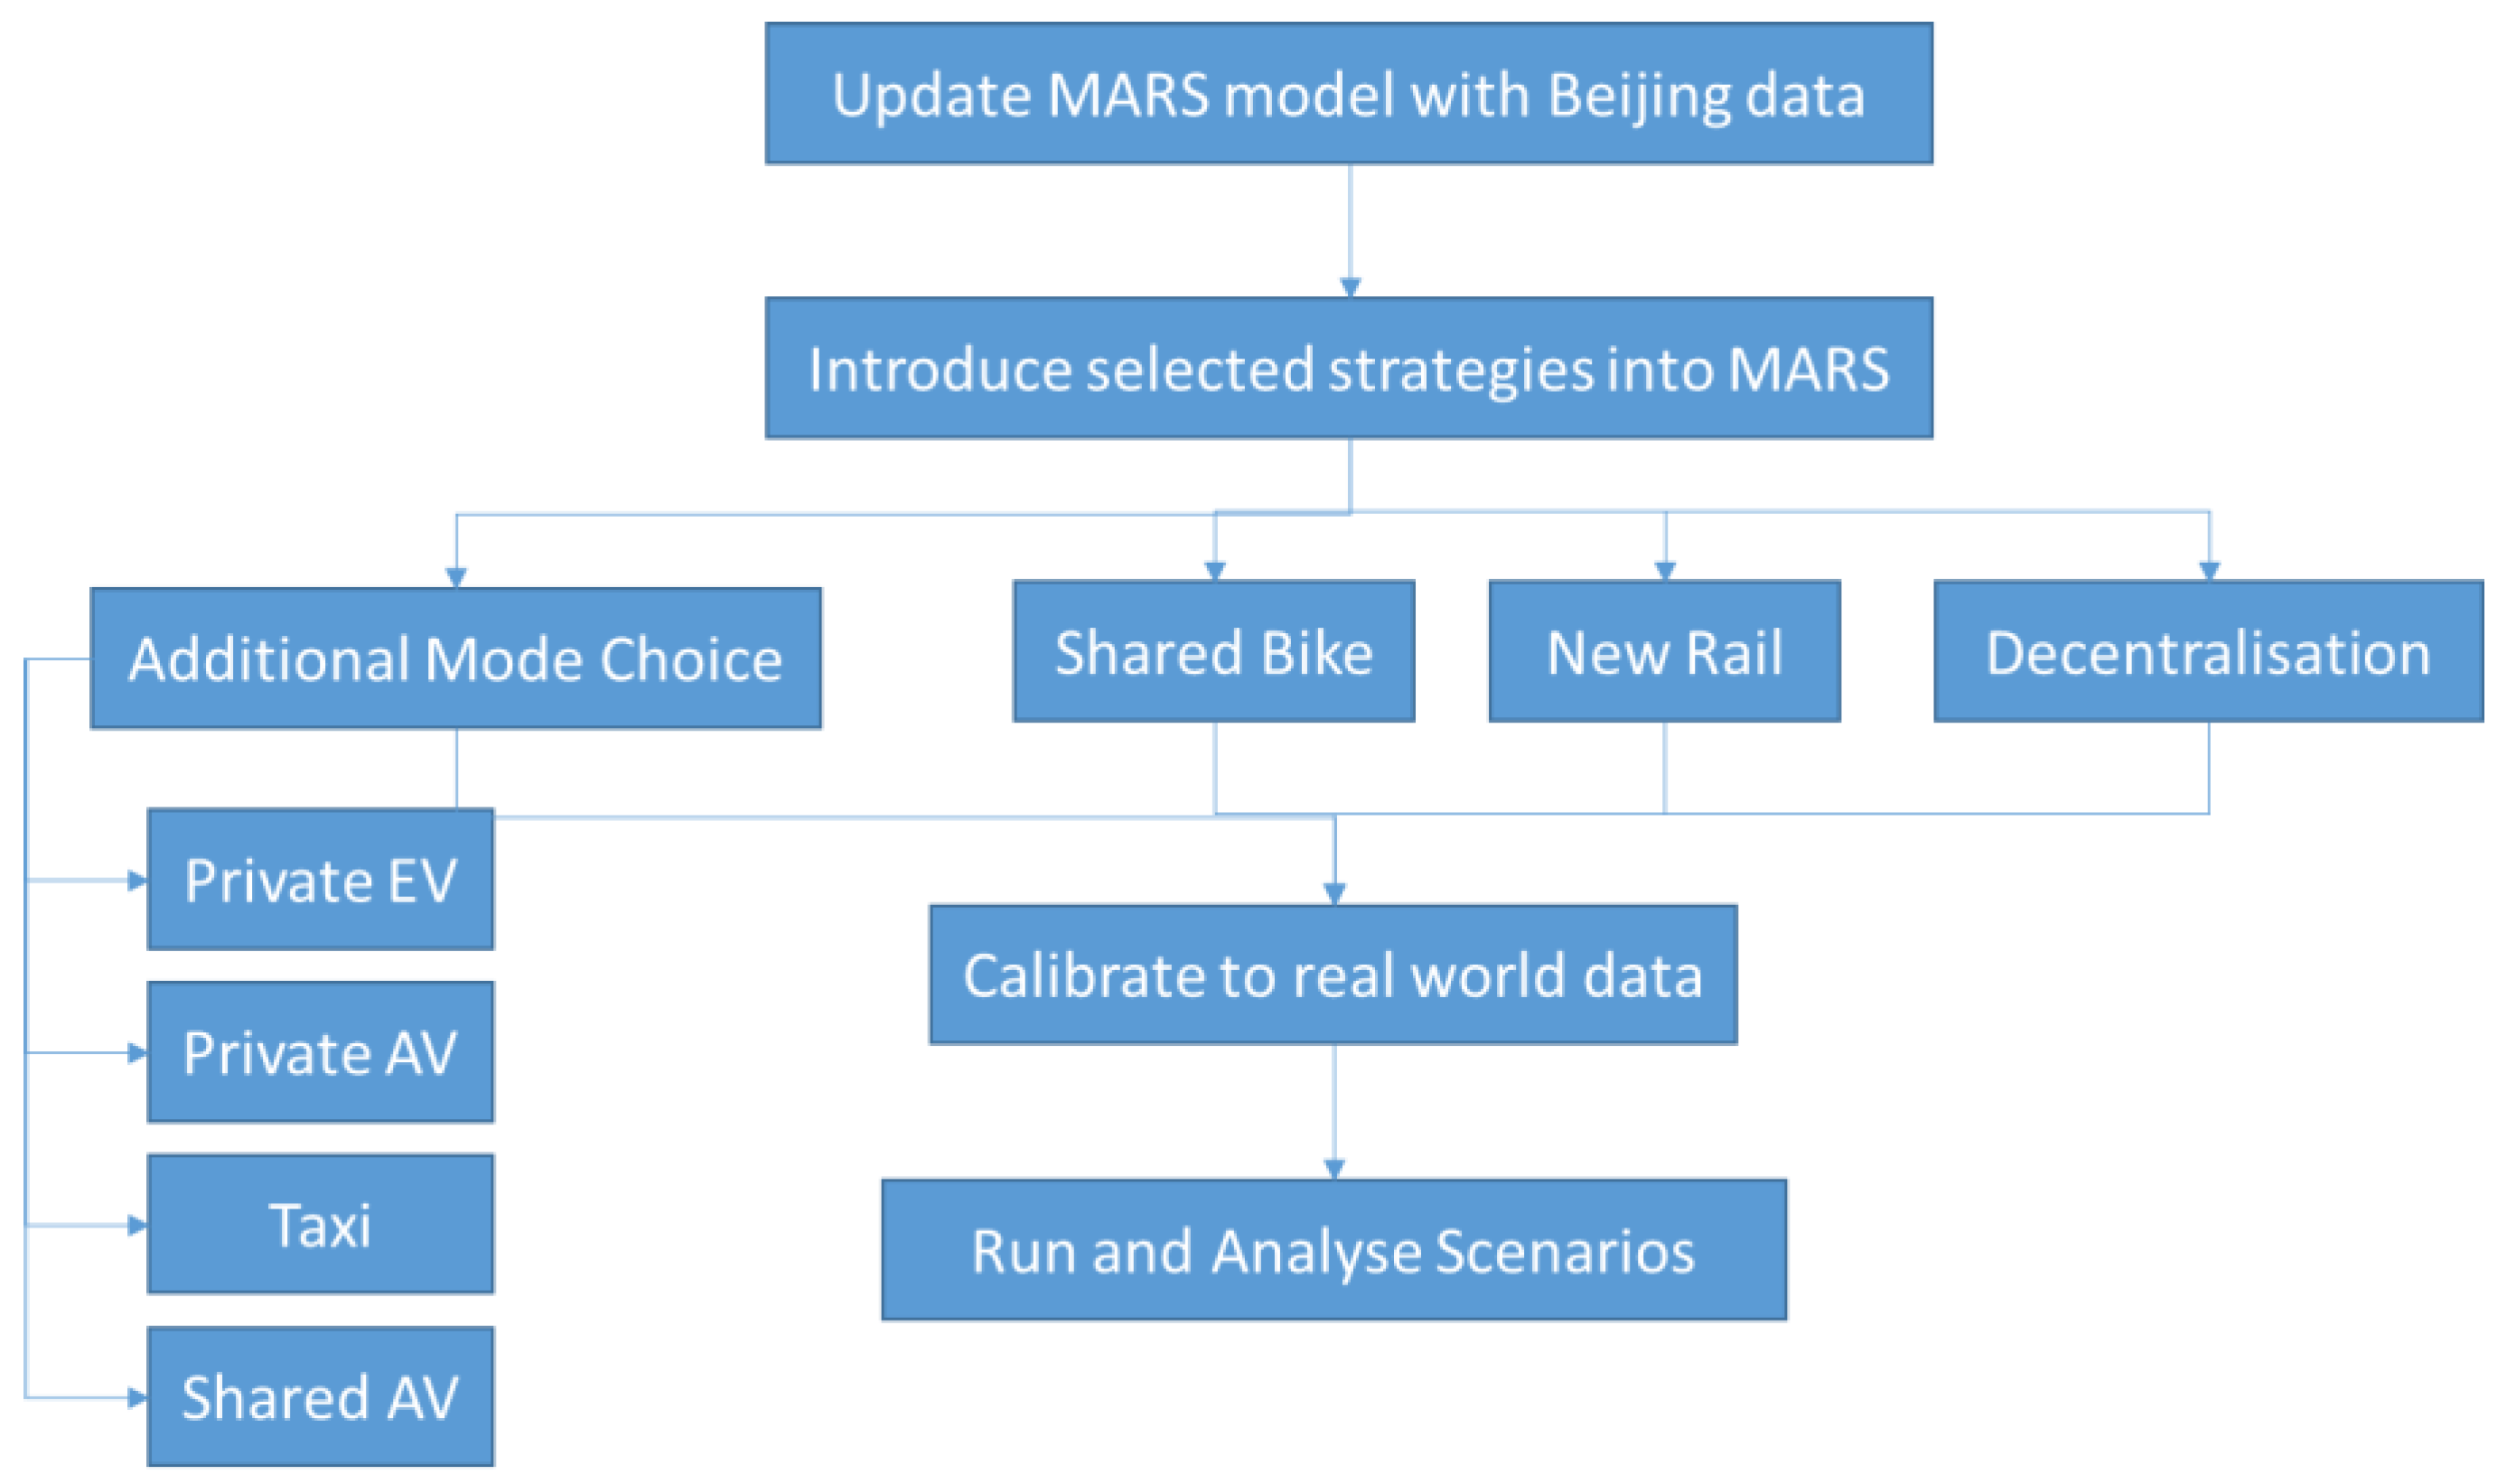
2. Materials and Methods

The method carried out in the study is set out in Figure 1. The existing MARS model was first updated with data from Beijing (Section 2.1 and Section 2.2), and then the selected strategies of the Beijing Master Plan were represented in the model—where model adaptations were required to better represent some strategies (Section 2.3, Section 2.4, Section 2.5, Section 2.6 and Section 2.7). We then performed calibration using real-world data (Section 2.8) before running and analyzing scenarios in order to answer our research question (Section 3 and Section 4).

2.1. System Dynamics and the MARS Model

System dynamics (SD) is a modeling approach to simulating the non-linear behavior of complex systems that has been widely applied in the domain of understanding transport-related policies, technologies and services [19]. In particular, SD models have been used extensively to explore the uptake of electric vehicles [20] and sustainable urban transport policies [21]. More recently, there has been a small but increasing number of studies that focus on shared bikes (e.g., [22,23,24,25]) and automated mobility (e.g., [26,27,28,29,30,31]). The MARS model, which has been in development for over twenty years [32], is based on the SD method, and it models land use and transport interactions (LUTIs) and is designed for modeling and analyzing transport policies in metropolitan areas [18,33]. A central concept of MARS is based on feedback between transport options and urban sprawl, as well as mode choice behavior related to friction factors (generalized costs of time) with available time budgets, and the first 3 stages of the common 4-stage transport model. Over the years, MARS has been applied to numerous regions, including in Europe and Asia, as well as incorporating increasing technologies and policies, most recently vehicle automation [34,35,36]. For further detail on the MARS model, we refer the reader to original manuscripts describing MARS [18,32], and in this paper, we focus on detailing the innovative adaptations that we implemented in this study.

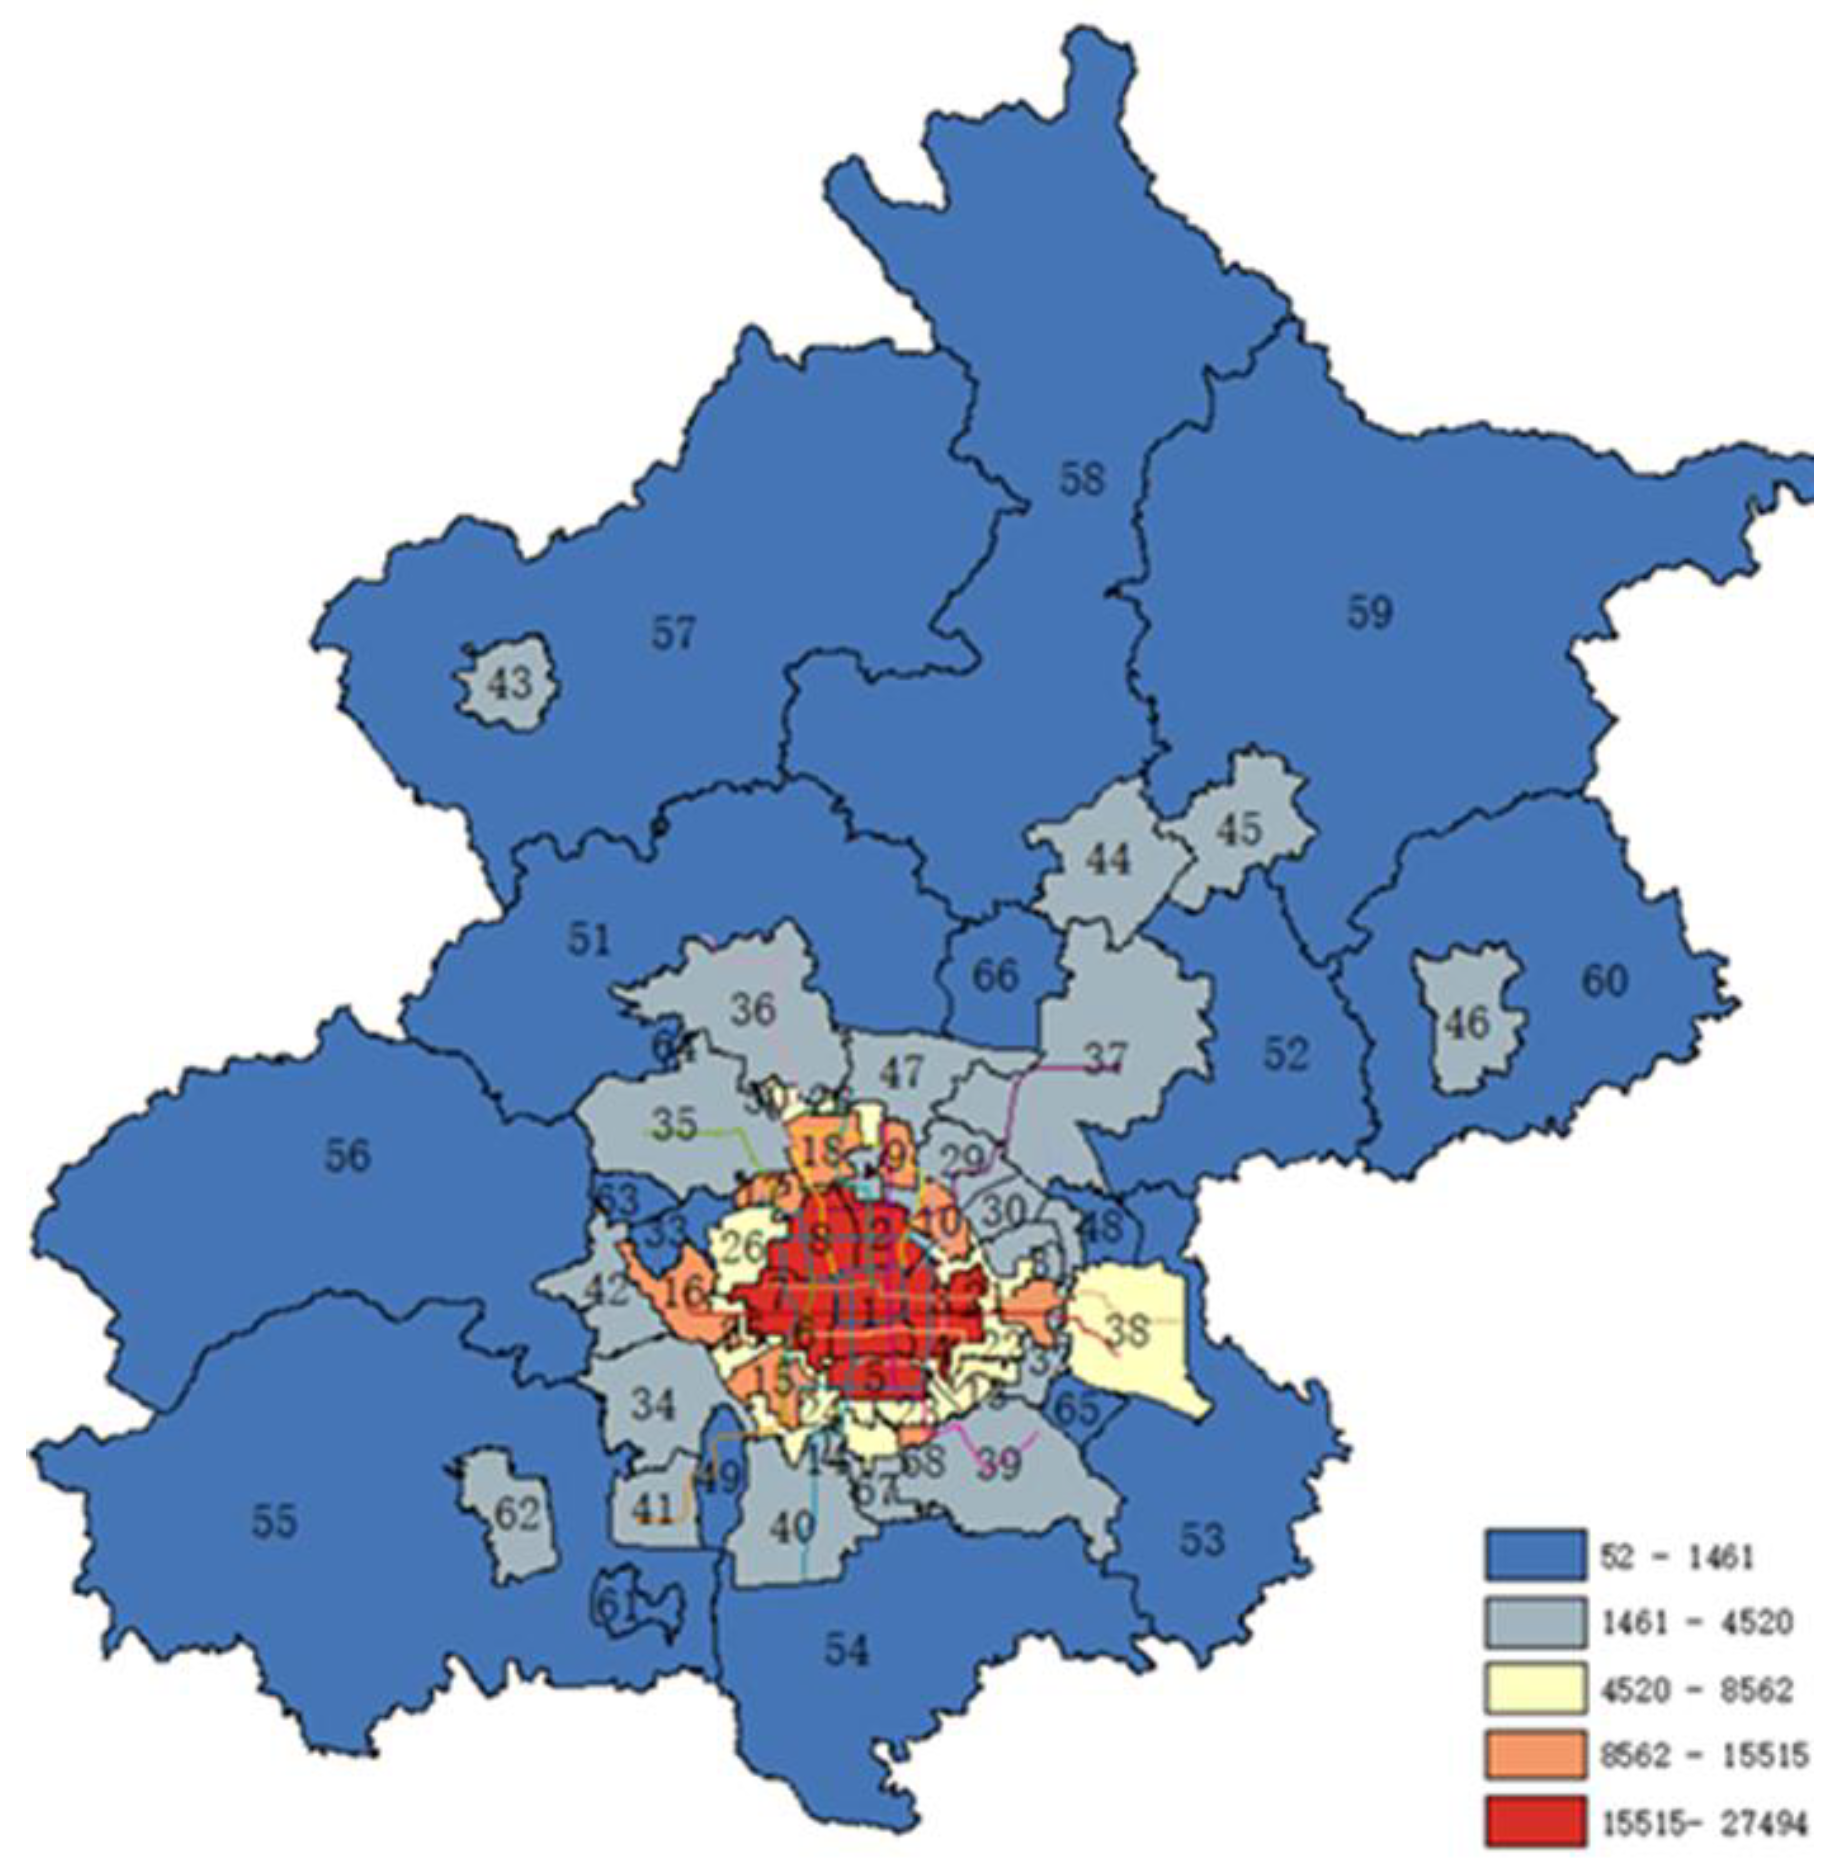
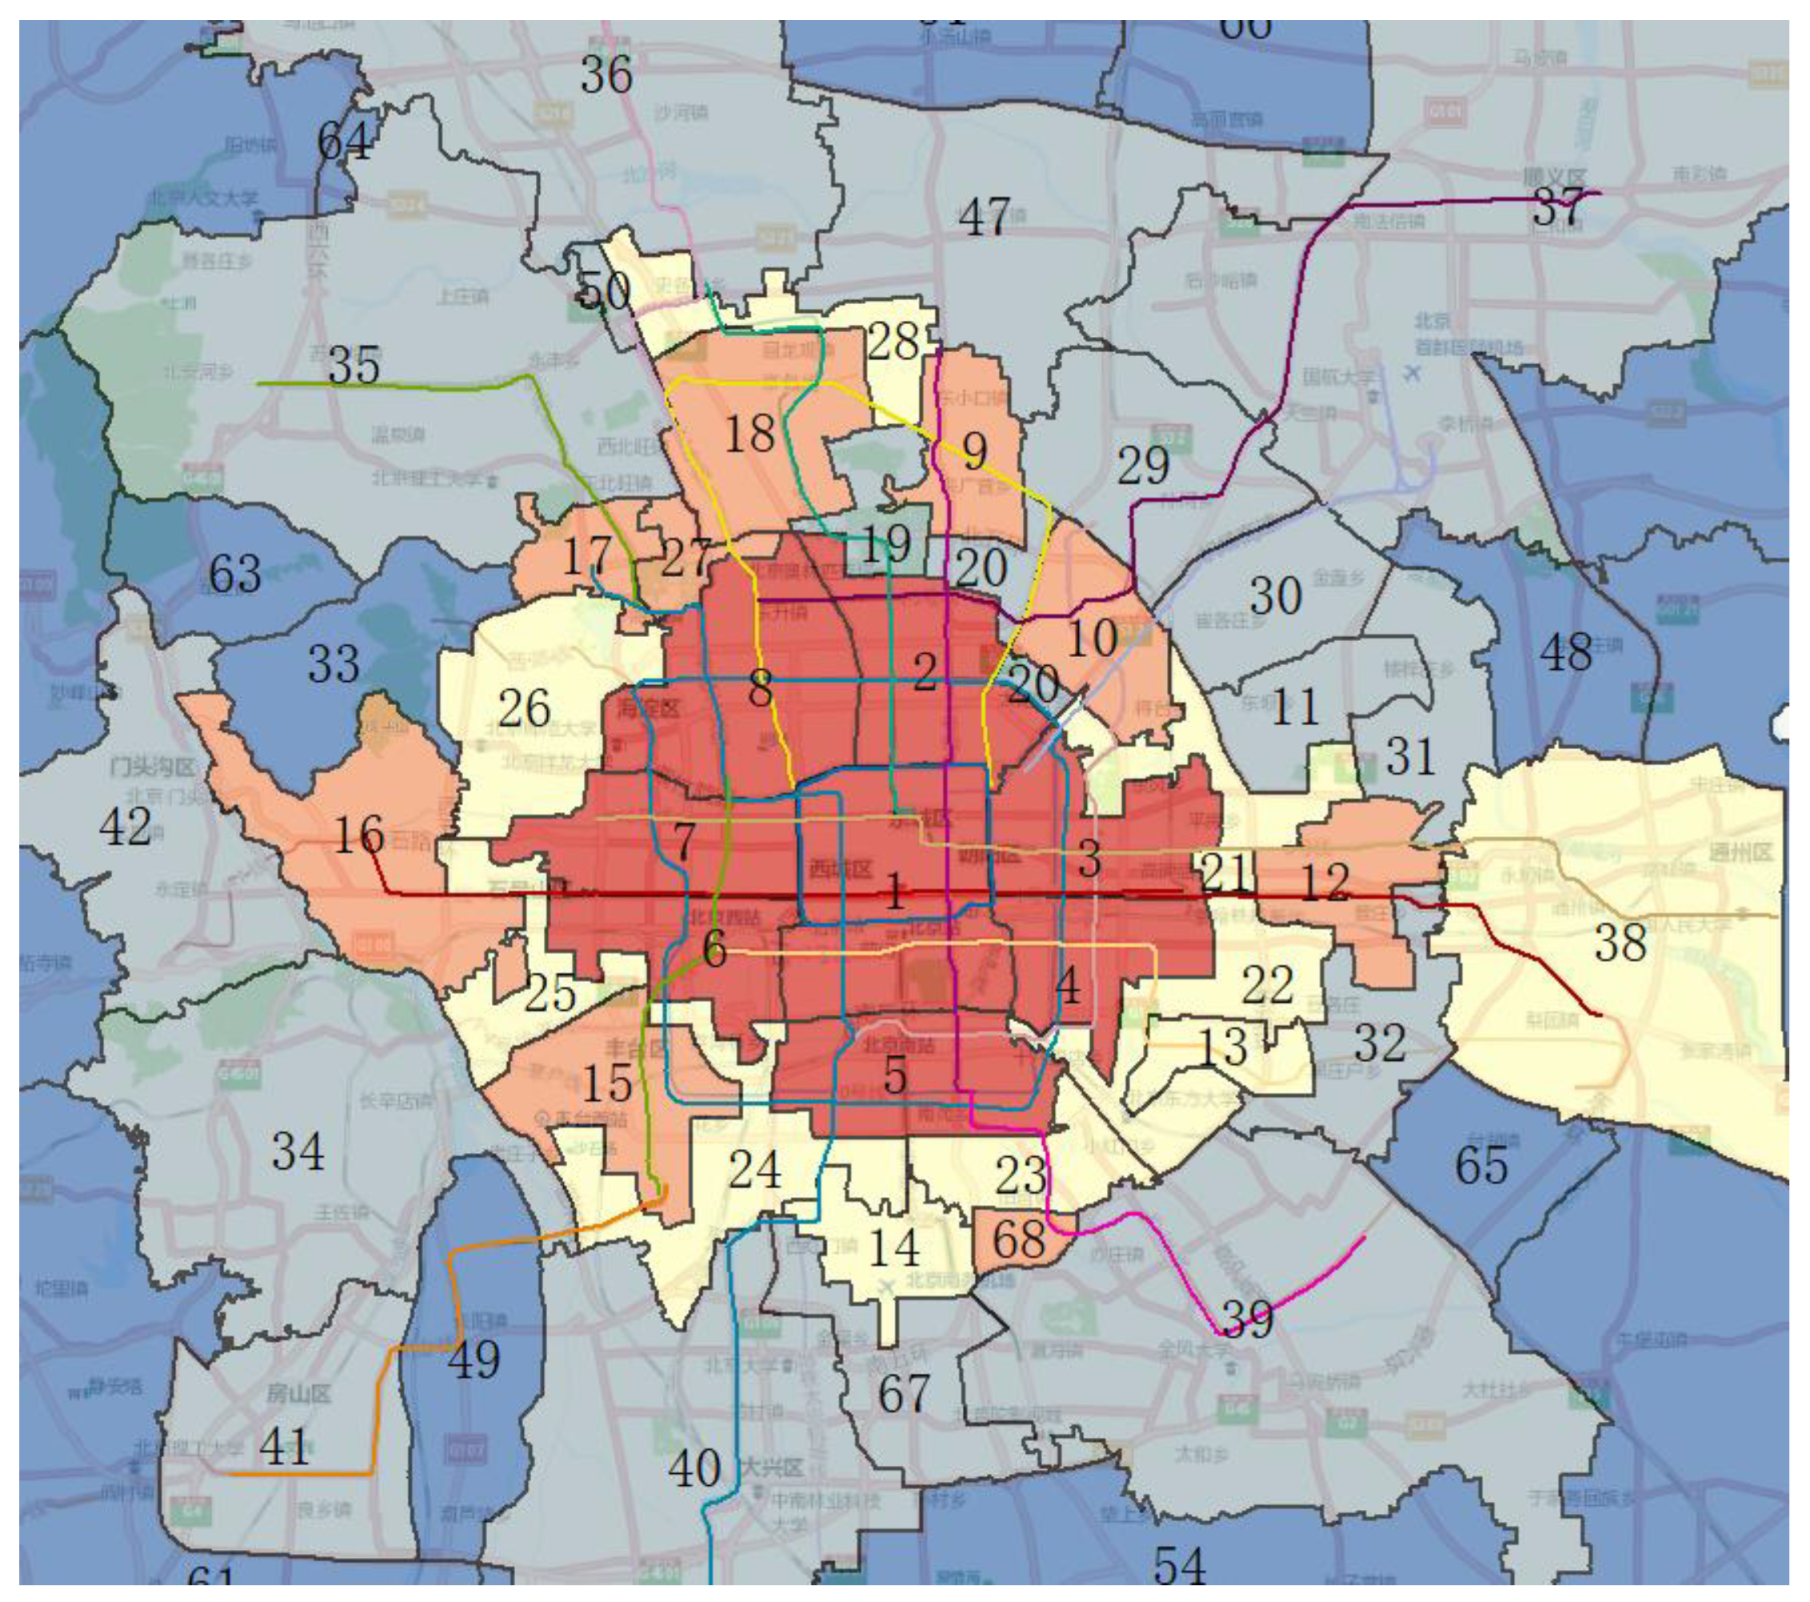
2.2. Beijing and the MARS Model

The development of transportation in Beijing has been receiving worldwide attention, and authorities play an important role in sustainable transportation development. The People’s Government of Beijing Municipality (PGBM) published the plan of building humanistic, scientific and technological, and green transport systems in 2009, following the 2008 Beijing Olympic Games, during which relatively free roads and clear blue skies were impressive to drivers and citizens. The proposal for a “humanistic transport system” focuses on the “human-oriented” development of a transport system comprising coordination with the historical and cultural characteristics of the city. It is an important step in the vision of a harmonious traffic environment’s creation and urban-administration and service-level improvements, and the essence of building humanistic, scientific and technological, and green transport systems is the sustainable transportation system development in the municipality of Beijing [12]. Further, “the Master Plan of Beijing Municipality (2016–2035)” was released in 2017, and it was approved by the Communist Party of China Central Committee and the State Council on 13 September 2017, hereinafter referred to as the Master Plan (MP). The MP focuses on Beijing’s urban development and implementation, emphasizing that the control of the population and construction will force the city to transform its development mode, upgrade and transform industries, and optimize and adjust its city functions. It identifies the capital’s strategic position as the national political center, cultural center, center for international exchanges and center for national innovation. The size of the resident population in Beijing should be controlled to within 23 million by 2020 and kept at this level thereafter. The MP also provides a perspective on the development direction in 2050. In particular, Chapter 5 of the MP emphasizes that traffic congestion in Beijing needs to be mitigated.
The annual “Beijing Municipal Transportation Comprehensive Management Action Plans” in the past five years (2018–2023) have also emphasized the key tasks of “optimizing supply”, “regulating demand” and “strengthening governance” for sustainable transportation development, as well as continuously improving urban transportation service capabilities. Specifically, these action plans were proposed to strengthen the construction of quarter-hour community service circles and improve education, medical care, elderly care and other service functions while reducing the long-distance, cross-regional life traffic demand and gradually increasing the requirement for the proportion of commuting within 45 min.
As the capital of China, Beijing includes 16 districts with a total area of over 16,000 square kilometers and a population of around 22 million [37]. Due to the large administrative area and large population, it was not suitable to directly set the 16 administrative areas as the zones for investigation and SD analyses. It was necessary to divide the area of Beijing into smaller zones in order to better carry out the necessary approaches.
Based on the geographical and administrative characteristics of Beijing, combined with the application cases of MARS models in other cities, the following factors were considered when constructing the regional division of the Beijing MARS model:
  • Beijing’s population density distribution and Beijing’s geographical and administrative area boundaries;
  • Counting homogenized location sets as regions, minimizing the differences within regions and maximizing the differences between regions;
  • According to the distribution of Beijing’s subway and bus network, avoiding the main traffic routes (subway and urban hub) as boundary lines of the clustering area; otherwise, the traffic route would involve two or more areas, which would have been difficult to analyze;
  • Some outer zones with travel > 90 min to central Beijing were merged, and some special external zones represent larger urban areas.
The design of the zoning system was based on a compromise between data availability and a trade-off between spatial detail and model run times, as well as the requirement for more detail in the densely populated central areas. The final decision was made in conjunction with the Beijing Transport Research Institute (BTI) and local partners.
Based on these considerations, Beijing is divided into 68 zones, as shown in Figure 2. The base Beijing version of the MARS model contains six travel modes: walking, cycling, bus, subway, taxi, traditional fuel car and electric/automated vehicle, and the covered period is from 2014 to 2050. The model was calibrated with mode share data from the Beijing Transport Institute (see details in Section 2.8), and additional data sources for the Beijing input data for the MARS model simulation included the following:
  • The Fifth Beijing Urban Transportation Comprehensive Survey by the Beijing Transport Institute;
  • The medium- and long-term development planning goals of the “Beijing Municipal Master Plan (2016–2035)”;
  • The Beijing Statistical Yearbook;
  • Map API navigation data;
  • Open resource data on Beijing from the Lianjia and Tuba websites.
In the following sections, how the policy interventions were included in the MARS model is described.

2.3. Shared Bike

The rapid development of shared bicycles in recent years has played a pivotal role in the development of Beijing’s green transportation plans, and orderly development is key going forwards. To this end, the Beijing Municipal Government has proposed a series of management plans and development plans for the shared bicycle operations in Beijing. In 2017, the Beijing Municipal Commission of Transportation issued the “Guiding Opinions on Encouraging and Regulating the Development of Shared Bicycles in Beijing (Trial)”. The document stated that Beijing should give priority to the development of public transportation, coordinate the development of shared bicycles, and actively promote the development of shared bicycles in the city. This would require active travel infrastructure construction, encouraging green and low-carbon travel, and establishing and improving a multi-level and diversified urban travel service system. Further, it is necessary to clarify the responsibilities of all parties in the development of shared bicycles, build supporting infrastructure, standardize shared bicycle services and market order, and establish a guarantee mechanism. In response to the problem of the indiscriminate parking of shared bicycles, it is required to strengthen the management of the parking order of internet rental bicycles, focus on subway sites, expand the pilot scope of “entry settlement”, and achieve the full coverage of electronic fence monitoring and management of key rail transit sites in central urban areas [38].
In the base model, the “bicycle” mode assumes that the mode is available to the individual because they already own or have (free) access to a bicycle. To include a shared bicycle in MARS would require the introduction of another mode, as the characteristics to be accounted for would be very different from the traditional bicycle mode (e.g., the costs of subscription and use, availability, etc.). Martin and Shaheen [39], based on the travel data of two urban residents, effectively proved that shared bicycles are mainly used to connect ground public transportation systems, including bus and rail transit. It was assumed, therefore, that the majority of shared bike trips would serve as a feeder to access/egress rail stations to/from origins and destinations. Our interest was, therefore, focused on how the introduction of shared bicycles may affect the share of rail trips, especially in combination with the policy for new subway rail services (see Section 2.5), rather than the share of bicycle trips. Therefore, in order to represent the introduction of shared bike schemes in Beijing, we modeled this as an impact on the access/egress time to rail stations only. An additional tool for the choice between the access modes of walking, a private bike, a shared bike, a bus and a car was developed for this purpose (see Appendix A). Note that doing it in this way means that the actual shared bike trips are not reflected in the bicycle share—but this is in line with the logic of the MARS model in that access/egress to public transport (usually via walking) is not accounted for as separate trips, but a change in access/egress will affect the rail share. The implementation of this new tool is an important improvement in the context of the policy for new subway rail services (see Section 2.5).
Shared bicycles were introduced in the base scenario of the model in 2017. The policy change to access/egress times was included in a model run via the use of a switch, which we turned off to model a scenario without shared bike services. The details of how we calculated the change in aggregate access/egress times when a shared bike was implemented are provided in Appendix A.

2.4. Population Decentralization in Beijing

As per the Master Plan of Beijing Municipality, one policy is for the decentralization of the population—moving inhabitants from the over-populated central zones (1–35, 48–50, and 67–68—generally those marked in red, orange or yellow in Figure 2) to less populated outer zones (36–47 and 51–66—generally those marked dark or light blue in Figure 2). As such, the usual land use and transport interactions within MARS do not apply in that any growth/decline in residents or workplaces (due to movement between zones) is not internally modeled but subject to the land use scenario set out in the Master Plan. As shown in Figure 3, while the overall population will grow by around 2% by 2050, the central zones’ population will reduce by over 20%, and the outer zones will grow by nearly 40%.
As a policy scenario, we also modeled an alternative scenario where the land use was not internally modeled but where there was no land use change (i.e., no movement between zones). Although this is not a realistic case, it allowed us to understand the implications of the decentralization policy in relation to other transport policies.

2.5. New Subway Rail Services

The effective, efficient and equitable measures for developing better public transport (PT) systems are a key priority for the highly populated megacity of Beijing. Over the past several decades, Beijing has developed a hierarchical and integrated multi-modal PT system, which includes subways, BRT, trams, buses, taxis and some on-demand transit systems. The subway system in Beijing has the highest system performance of all PT modes in terms of speed, capacity, reliability and image [40]. The subway system was opened to the public in 1981. After 2002, boosted by Beijing hosting the 29th Summer Olympic Games, the subway system in Beijing underwent rapid expansion, and in 2022, the passengers per year of the Beijing Subway were over 2 billion, according to the data of Beijing Subway Limited Company. By the end of March 2023, there were 27 subway operation lines, the total operation distance was 807 km and there were 475 operation stations, including 81 transfer stations, with plans to expand the network to 30 subway operation lines with 1177 km in total operation distance.
Beijing has been undertaking large-scale subway rail development over the first 10 years of the modeled period (which started in 2014). As shown in Figure 4, the original connections are in 31 zones (1–10, 12, 14–18, 20–21, 23–25, 27–28, 32, 36, 38–41, 49 and 68). Connections to 16 more zones have been introduced, as set out in Table 1. In the model, these new rail lines are included in the base scenario, as they are already constructed or planned. We also modeled a scenario in which these new lines were not introduced by removing the connections within the model. In the context of the subway line extension in the outer zones, the new explicit representation of feeder modes like shared bikes (see Section 2.3) is a significant improvement to the modeling framework.

2.6. Fleet Electrification

With the aim of reducing GHG emissions associated with transportation to combat the climate crisis, the government and public transport authorities in China have encouraged the electrification of transportation by utilizing electricity as a replacement for fossil fuels. According to the circular aimed at boosting the high-quality development of new energy vehicles (NEVs) from 2021 to 2035 issued by the State Council on second November 2020, efforts should be made to improve and protect an innovative institutional environment to encourage multi-pronged technology development and promote the deep integration of NEVs, energy, transportation and information communication. In terms of technology innovation, the nation should spread its innovation chain across electronic vehicles (EVs), plug-in hybrid electric vehicles (PHEVs) and fuel cell vehicles. Meanwhile, batteries will be better recycled, reused and monitored throughout the lifecycle, and charging facilities will be enhanced via scientific coordination with urban and rural construction planning, power grid planning, property arrangement, parking and more.
To support the circular aimed at boosting the high-quality development of new energy vehicles (NEVs) from 2021 to 2035, the charging and swapping infrastructures development planning for NEVs in Beijing during the fourteenth five-year period was issued by the Urban Management Commission of Beijing municipality in August of 2022. It identifies the construction of a social assessment mechanism for NEV charging services based on a user-centered approach. Electrification should be a typical feature for approaching low-emission development in Beijing, which is also important to achieve the mandated transition set out in the Beijing Municipal Master Plan (2016–2035). Accelerating the shift to electric vehicles (EVs), including private cars and public fleets, i.e., electric taxis and buses, is crucial for achieving this goal. EVs and traditional gasoline vehicles (GVs) are expected to coexist on the road for an extended period.
In the base scenario, the electric vehicle share is set to grow to 80% of the car stock by 2050, as shown in Figure 5. This is based on the mandated transition set out in the Beijing Master Plan), so in our version of MARS, the growth rate in EVs (and reduction in ICEVs) is an exogenous input. To demonstrate the impact of these assumptions, we implemented as an alternative scenario the notion that this transition was not mandated, and in fact, there is no growth in the EV market; however, we did allow for population growth and changes in car ownership within zones, in line with the decentralization policy.

2.7. The Introduction of Shared and Automated Vehicles

Shared and automated mobility (SAVs) could be considered complementary features of an urban passenger mobility system of the near future. Following the Beijing Municipal Master Plan (2016–2035), there is a significant offering of shared and automated vehicle development in Beijing. In 2021, the General Office of the State Council issued the plan for the commercialization of AVs in the “New Energy Vehicle Industry Development Plan (2021–2035)”. It is expected to achieve scale applications within 15 years after road testing of high-level AVs. As one of the first demonstration cities, Beijing actively promotes the construction of road testing and an AV application area. Beijing was included in the first batch of demonstration cities for the coordinated development of smart city infrastructure and AVs in May 2021. In 2021, Beijing set up the first AV test area in China, and it issued the “Beijing Intelligent Connected Vehicle Policy Pilot Zone Overall Implementation Plan” to support verified ICVs, taking the lead in carrying out trial operation and commercial operation services in the specific area. Currently, the AV test area in Beijing has basically achieved smart infrastructure coverage. The construction of the area will expand the coverage of signals to achieve a larger scale of smart road infrastructure and realize a high-speed application scenario and business model exploration. This will encourage citizens to try AV services on roads [17]. In April 2022, the “Implementation Rules for the Administration of Unmanned Road Testing and Demonstration Applications for Vehicles in the Beijing Intelligent Connected Vehicle Policy Pilot Zone” was issued. It approved some companies to carry out the manned application of AVs [33]. With the support from the government, AVs will develop rapidly in Beijing, and this will have an impact on its transportation development.
Therefore, we envision that there will be a significant offering of shared automated vehicles that will become the dominant choice. Thus, implementing this into MARS required two approaches: the automation of private vehicles and the introduction of a new mode, taxis, which could also become automated over time.

2.7.1. Private Automated Vehicles (PAVs)

Although there have been a number of studies that have used SD to explore the technology development and market uptake of AVs, the complexity of the MARS model does not lend itself to the integration of that level of detail. Earlier versions of introducing AVs into MARS were described in [34,35,36], and we build on them here. We focus only on Level 4 and 5 AVs and rely on an exogenous growth in this fleet as part of the EV fleet (assuming that all AVs will also be EVs). To reflect the characteristics of an AV, a number of policy scenario adaptations were implemented.
  • Automated parking and pick-up: One predicted advantage of AVs is that an individual does not need to park their vehicle; they need merely alight and be picked up directly at their destination. This can be turned on or off and set at 4 levels from low (25% reduction in access/egress time from a base of 7 min) to full (100% reduction in access/egress time).
  • Road capacity: It is expected that, as the AV fleet grows, the road capacity may increase (as AVs can travel closer together). If a capacity effect is implemented, then this can either be linear or progressive [41].
  • Effect on value of in-vehicle time: In a level 5 AV, driving tasks and concentration are no longer required. This not only makes the journey a more pleasurable experience but also frees up time for other activities, thus increasing the utility of the time spent in the vehicle. Based on [42], if such an effect is included in a scenario, then this can be set at 5–100% reduction levels in the in-vehicle time contribution to the friction factor.
  • Level 5 AV growth rate: The level 5 AV growth rate is based on the outputs from [14], as shown in Figure 6.

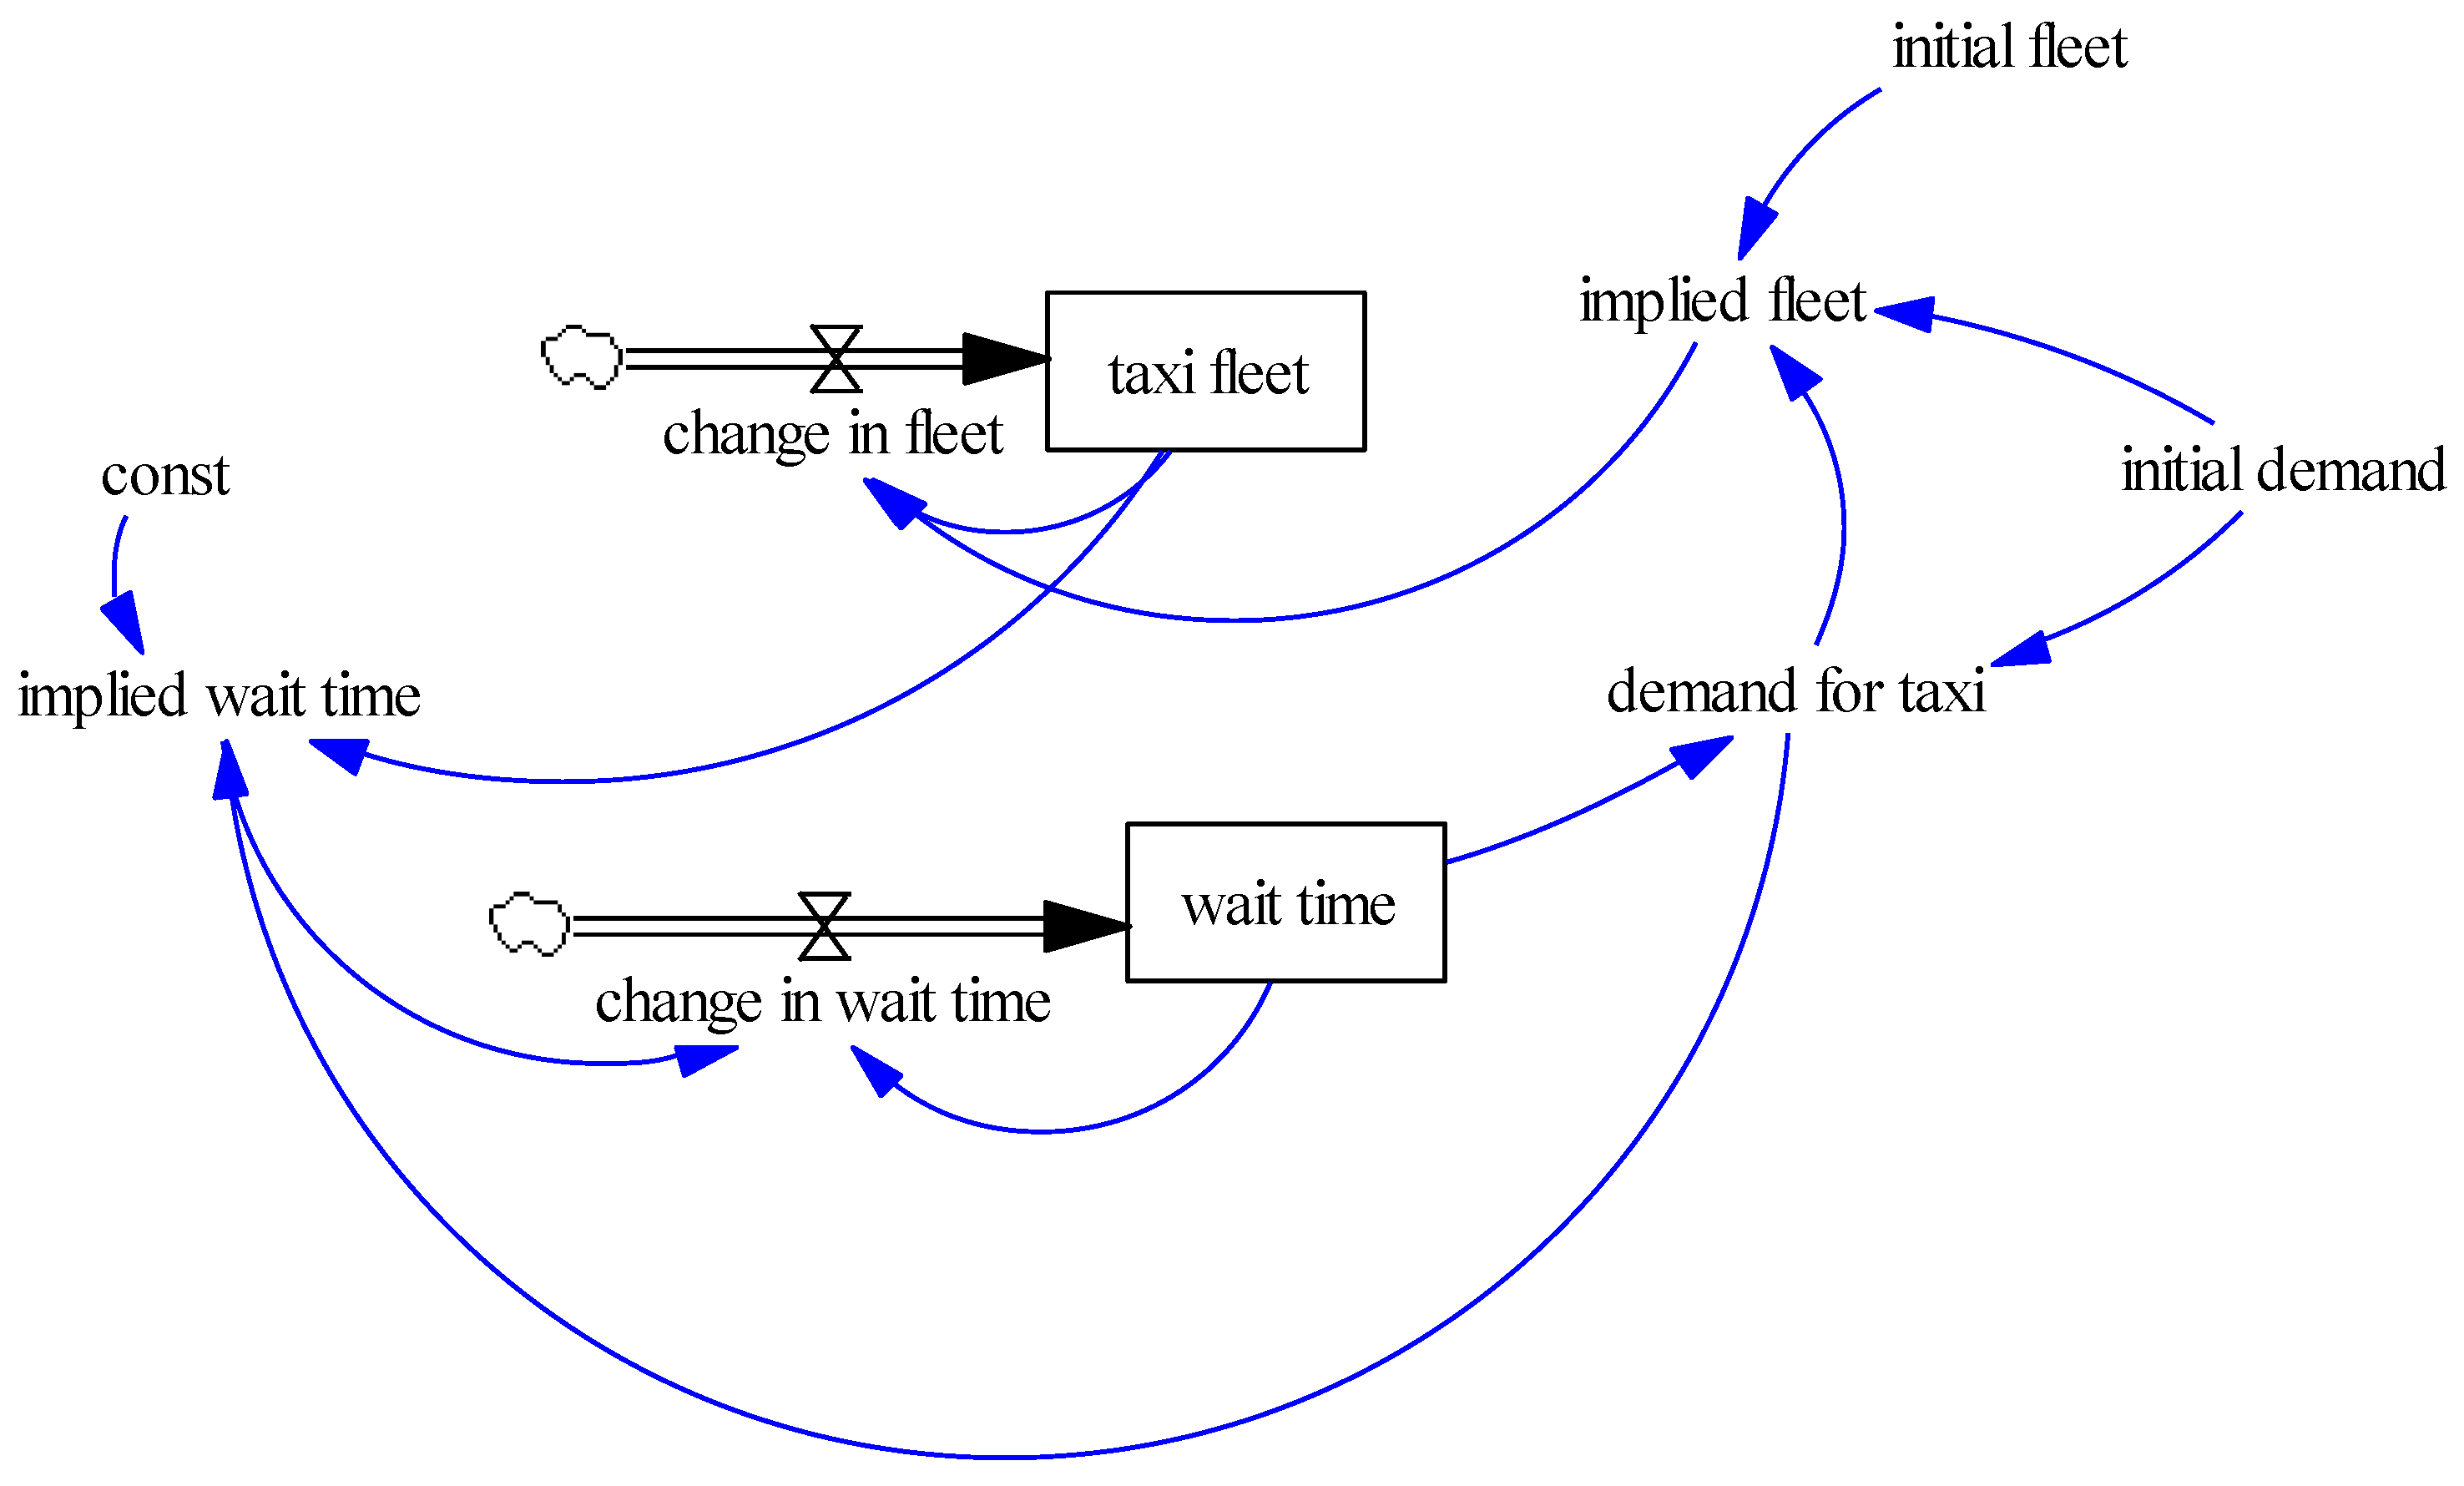
2.7.2. Taxis and Shared Autonomous Vehicles (SAVs)

Several studies have analyzed the relationship between built environments and taxi demand [43,44,45], but none have provided an operational, policy-sensitive modeling framework. Previous versions of the MARS model did not include taxis as a specific mode. In order to implement SAVs into MARS, we envisioned taxis as a precursor to SAVs, which would in effect be a “robo-taxi”. The user would not own the vehicle; nor would they expect the same vehicle every trip. Rather, they would simply order the vehicle when they required it to take a trip. In this way, the SAV operates in the same way as current ride-hailing taxi services (which are usually ordered via a mobile app or phone call). We did not directly consider within this a more traditional taxi service that would be hailed on the street or by waiting at a taxi rank. We also did not currently include ride sharing (i.e., individuals sharing a vehicle for the same journey), though this will be considered in future work. The implementation of a new mode, taxis, allowed for the consideration of mixed-case scenarios of private AVs and SAVs—an important improvement to previous work done for case studies in Leeds, the UK, and Austria [34,35]. This new approach makes it possible to influence the level of service via the SAV fleet size, which, in turn, affects its attractiveness for users and, hence, mode shares and, in turn, car shedding.
The licensed taxi fleet in Beijing was held at around 69,000 in 2014, the starting year of the MARS model [46]. However, we made the assumption that, as SAVs entered the fleet (following the same exogenous growth rate as PAVs), the fleet would be allowed to grow in size in order to meet the potential demand of the central zones, as up to 90% of current taxi journeys are within the 5th ring road of Beijing [46,47,48]. We modeled this growth in relation to the wait time for a taxi, based on [49]. The initial wait time was 8 min, with a 6-min wait assumed to be the minimum for a conventional fleet and a 3-min wait once the SAV fleet achieves over a 30% share [50,51]. Fare costs were based on Didi [52], and journey times were limited to 90 min [50,53]. Alongside the growth in SAVs, we also assumed some car shedding for private vehicles based on the experience of car clubs [54,55,56,57,58,59,60,61]. Full details on the implementation are provided in Appendix B.

2.8. Calibration

Once the above adjustments were implemented into the MARS model, it was necessary to calibrate the mode shares using existing data. In order to do this, we calibrated the friction factor cost sensitivities using the Beijing mode share data provided by the Beijing Transport Institute. Ideally, we would have calibrated to our base year (2014), but we found that the data for the years 2014–2016 (inclusive) were not completely available, so we performed calibration using the 2017 mode shares for the central area of Beijing. This achieved a relatively strong fit with the available data, as shown in Table 2.

3. Results and Discussion

3.1. Impacts of the Beijing Master Plan on Overall Modal Share

To understand the effect of the various policies of the Beijing Master Plan, we firstly modeled the following scenarios:
  • Business as Usual (BAU) Base: For business as usual, according to the Beijing Master Plan, which includes the decentralization policy, the introduction of new rail lines and shared bikes, and an increase in EV ownership, we did not include PAV or SAV in this, as there were currently no specific plans within the Beijing Master Plan
  • Do Nothing: This scenario has no movement between zones, no new rail lines, no shared bike services, no fleet electrification and no adoption of PAV or SAV.
  • No Land Use Change: As the base, but assuming no decentralization policy and no movement of either residents or workplaces between zones
  • No New Rail: As the base, but no new rail lines were introduced as planned—only those in place in 2014 were considered
  • No Shared Bike: As the base, but the shared bike service as a feeder to rail stations (affecting access/egress times) was not introduced (shared bikes improve friction factors for rail but do not affect bike friction factors).
  • No EV: As the base, but electric vehicles were not introduced.
The base year (2014) mode shares and the 2050 mode shares of all trips in Beijing (with all policies in place) are set out in Table 3 for all trips, Table 4 for trips with a central origin and Table 5 for trips with an origin in the outer zones. Private car shares slightly increased from 2014 in both the Do Nothing and BAU bases, though the policies in BAU have limited the increase by 1%pt. If any of the policies had not been in place, we would have seen a slightly larger private car share than if EVs were not introduced. This effect is because users effectively have an extra choice of mode when an EV is available. Had the decentralization policy not been enacted, then the car share would have been higher than in all other scenarios across all trips, suggesting that this may have been beneficial. On the other hand, without the decentralization, the rail and bus share could have been over 2% higher combined, though also active travel modes would have been lower. This is partly due to an increase in the average trip length across all modes by 10–15%.
We can also see that the introduction of new rail increased the trips by rail, though only by around 2%, with shared bikes hardly offering any increase, though this was slightly more noticeable in the central zones, which will benefit most from the new rail lines. This marginal impact of new rail suggests that corridor-based investments have a limited benefit overall. They may, however, have more of a direct impact in specific zones, and we consider this in the next section.

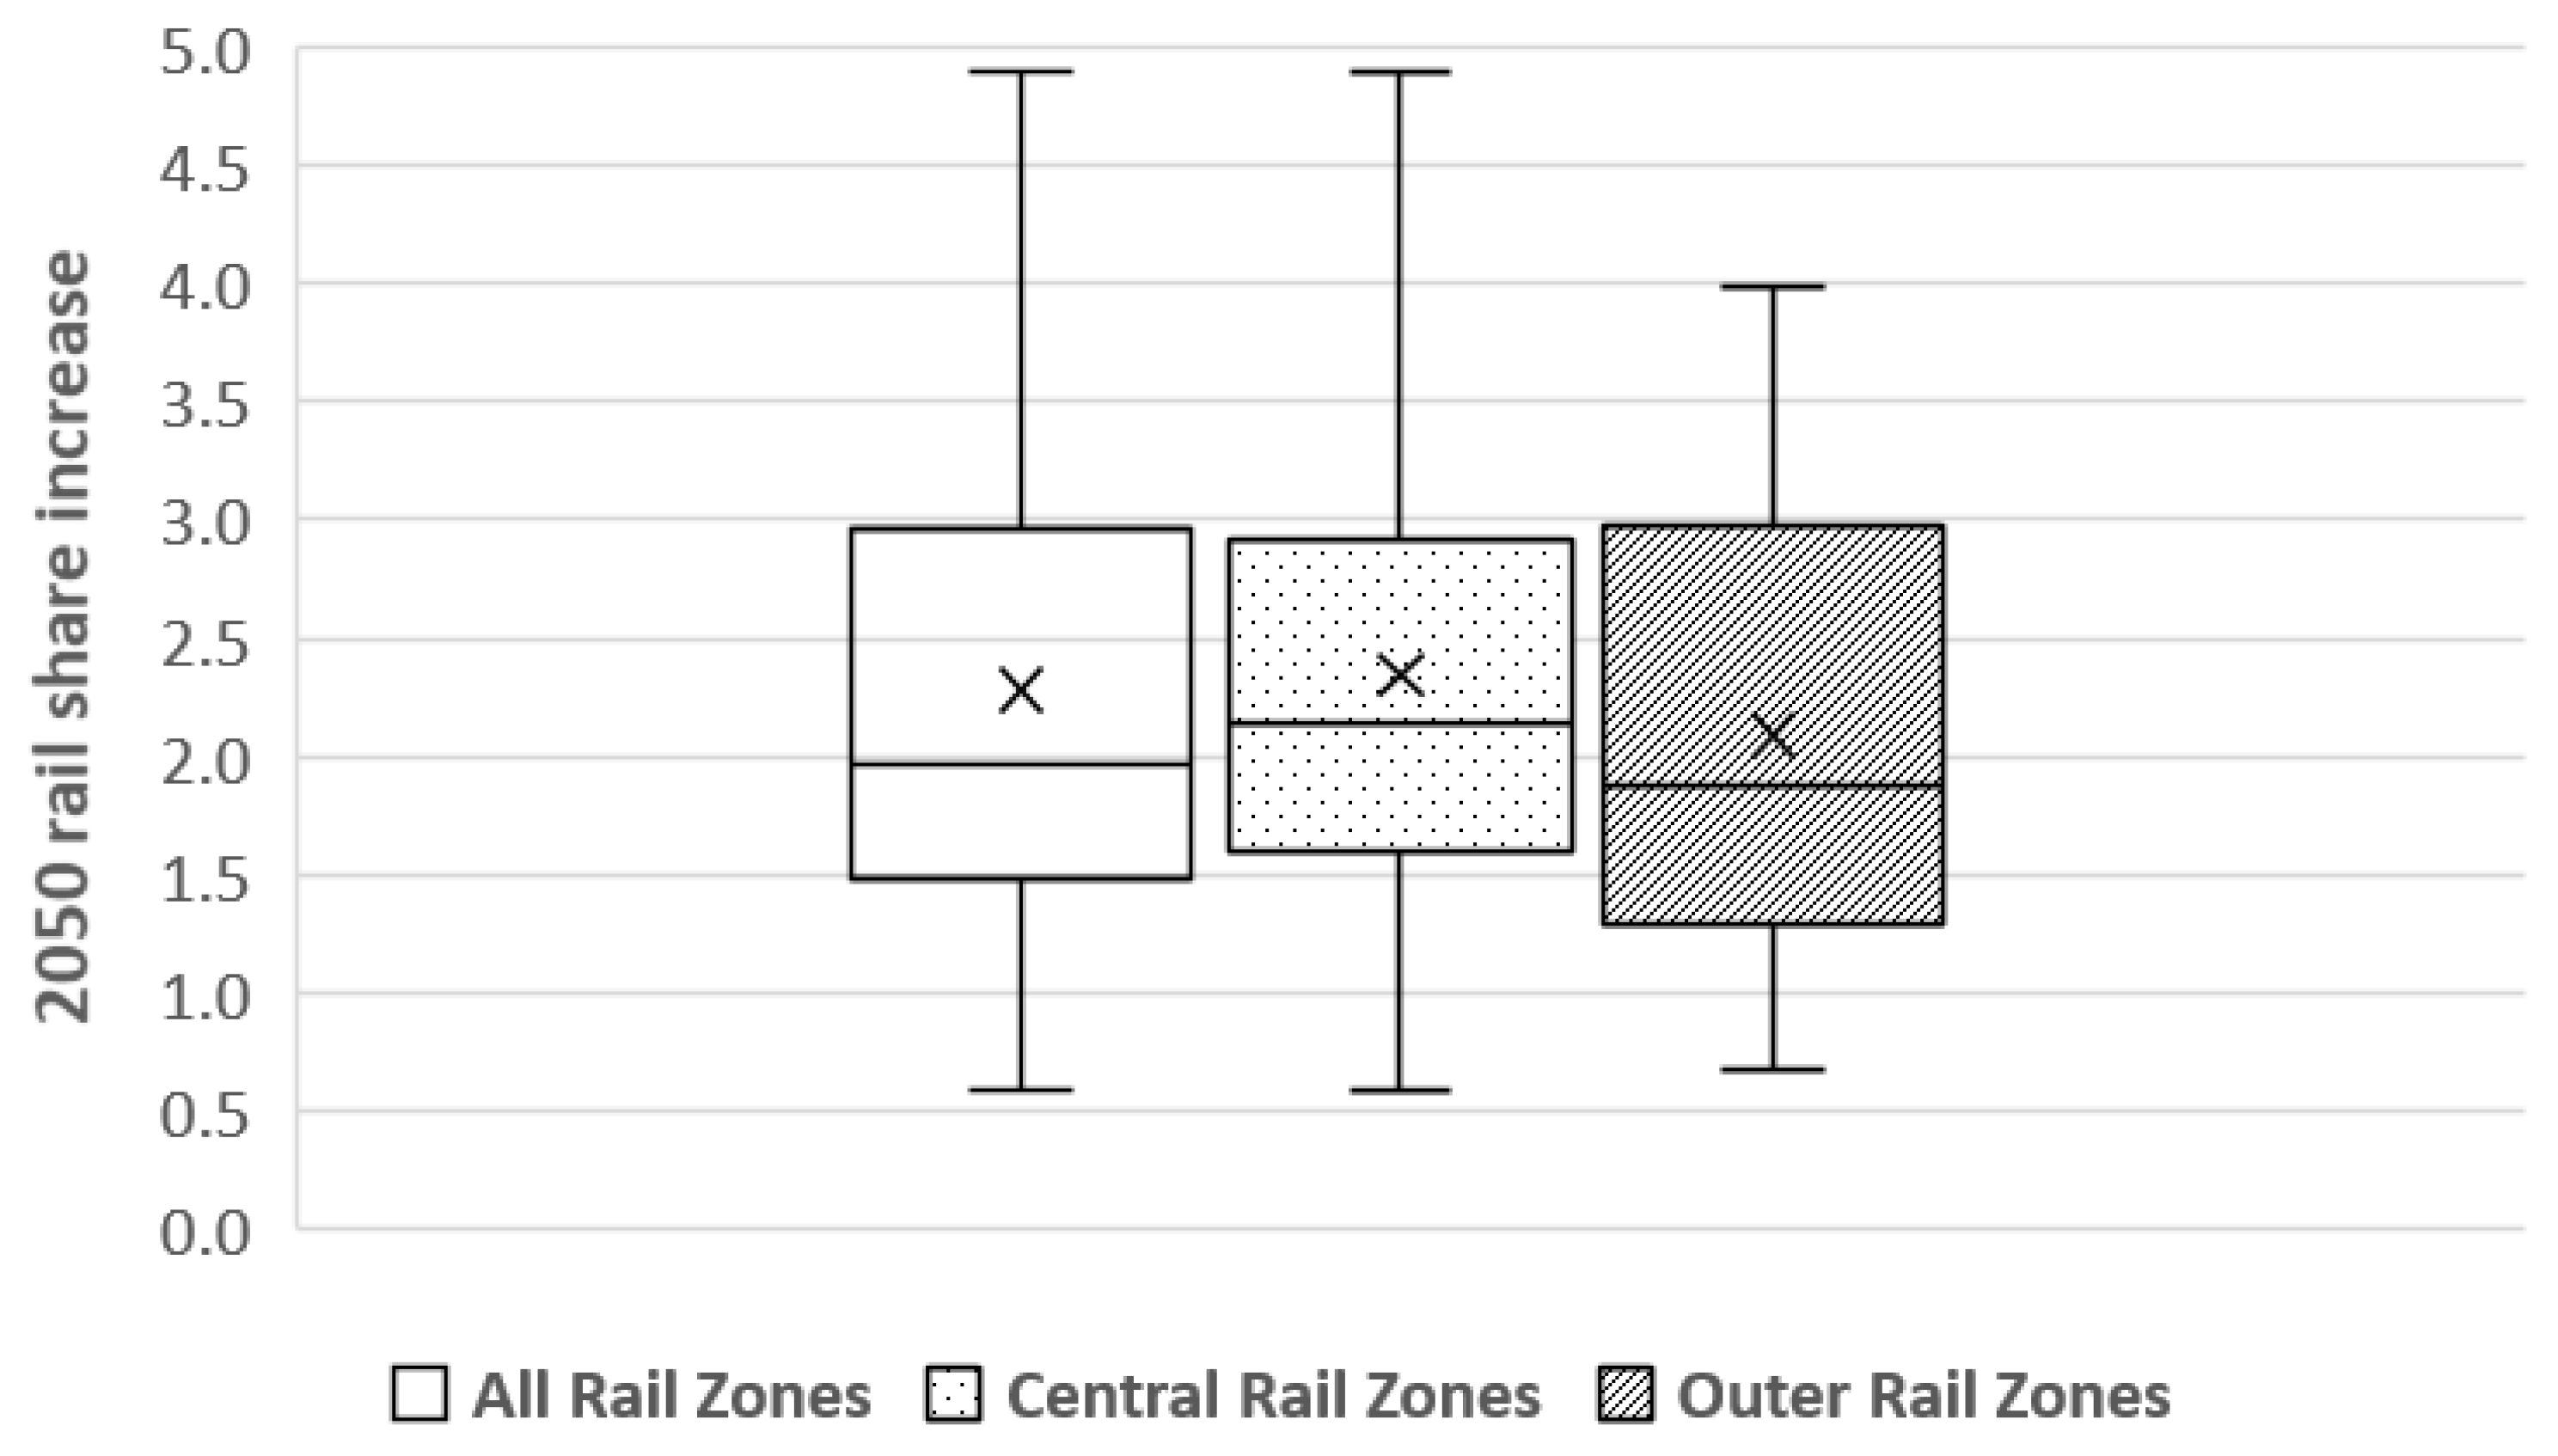
3.2. Impacts of the Beijing Master Plan on Rail Share in Specific Zones

Focusing only on rail share, we considered each policy applied in isolation against the BAU Base and Do Nothing scenarios:
  • Land Use only: Only the decentralization policy was introduced.
  • New Rail only: Only the new rail lines were introduced.
  • Shared bike only: Only the shared bike service as a feeder to rail stations was introduced (shared bikes improve friction factors for rail but do not affect bike friction factors).
  • New Rail and Shared Bike: Only the new rail lines and shared bike services were introduced.
  • EV only: Only electric vehicles were introduced.
We can see in Figure 7 and Table 6 that decentralization and EV introduction would have resulted in worse 2050 rail shares across all trips than even doing nothing if they were introduced in isolation. For decentralization, this was mainly due to the relocated central population adopting the travel behavior of the outer zones, i.e., fewer (but longer) rail connections and lower car ownership rates. Fleet electrification would have been of most benefit in the central zones, where the overall car fleet would have been lower without EVs. The BAU base benefits from the introduction of new rail lines in the first decade of the simulation, but these benefits reduce over time due to the effects of decentralization and EVs’ introduction. The rail share in the central zones under BAU was the same as for new rail alone during the middle period (around 2030 to 2040), presumably related to the draw from fleet electrification in those zones, though it was actually increasing slightly towards the end of the simulation period (also following the no-EV scenario, as the EV fleet grew). The clear advantage of shared bikes on top of new rail can be seen as more of an advantage in the central zones than the outer zones.
Considering the impact of new rail in the mode share as a whole (either in total or in the central/outer zones) may somewhat obfuscate the impact that it does have in the zones in which the new rail was introduced. Shown in Figure 8, we see that these zones had a rail share in 2050 of between 4 and 29% (average: 14%). The eight outer zones with new rail had the smallest rail shares (presumably due to longer journey distances, meaning rail is less attractive in general), and if we consider the central zones alone, the average share would be 21%.
Furthermore, the introduction of the Shared Bike scenario raised the rail share by 2.8% across all zones, with central zones benefiting more (3.0%) than outer zones (1.8%), as there were more rail connections in the central zones and longer access times in the outer zones. Although it may be reasonable to think that shared bikes would make a bigger impact in zones with longer access times, as the access/egress time is a smaller portion of the overall journey time, the effect was limited. However, once again, if we consider only the zones with rail connections (Figure 9), we can see a clearer impact. Across all of these zones with rail (n = 45), although the average increase in rail share was about 2.3%, the maximum increase was 5.1%. The central (n = 33) and outer zones (n = 12) had a similar average impact, with the outer zones having less variation.

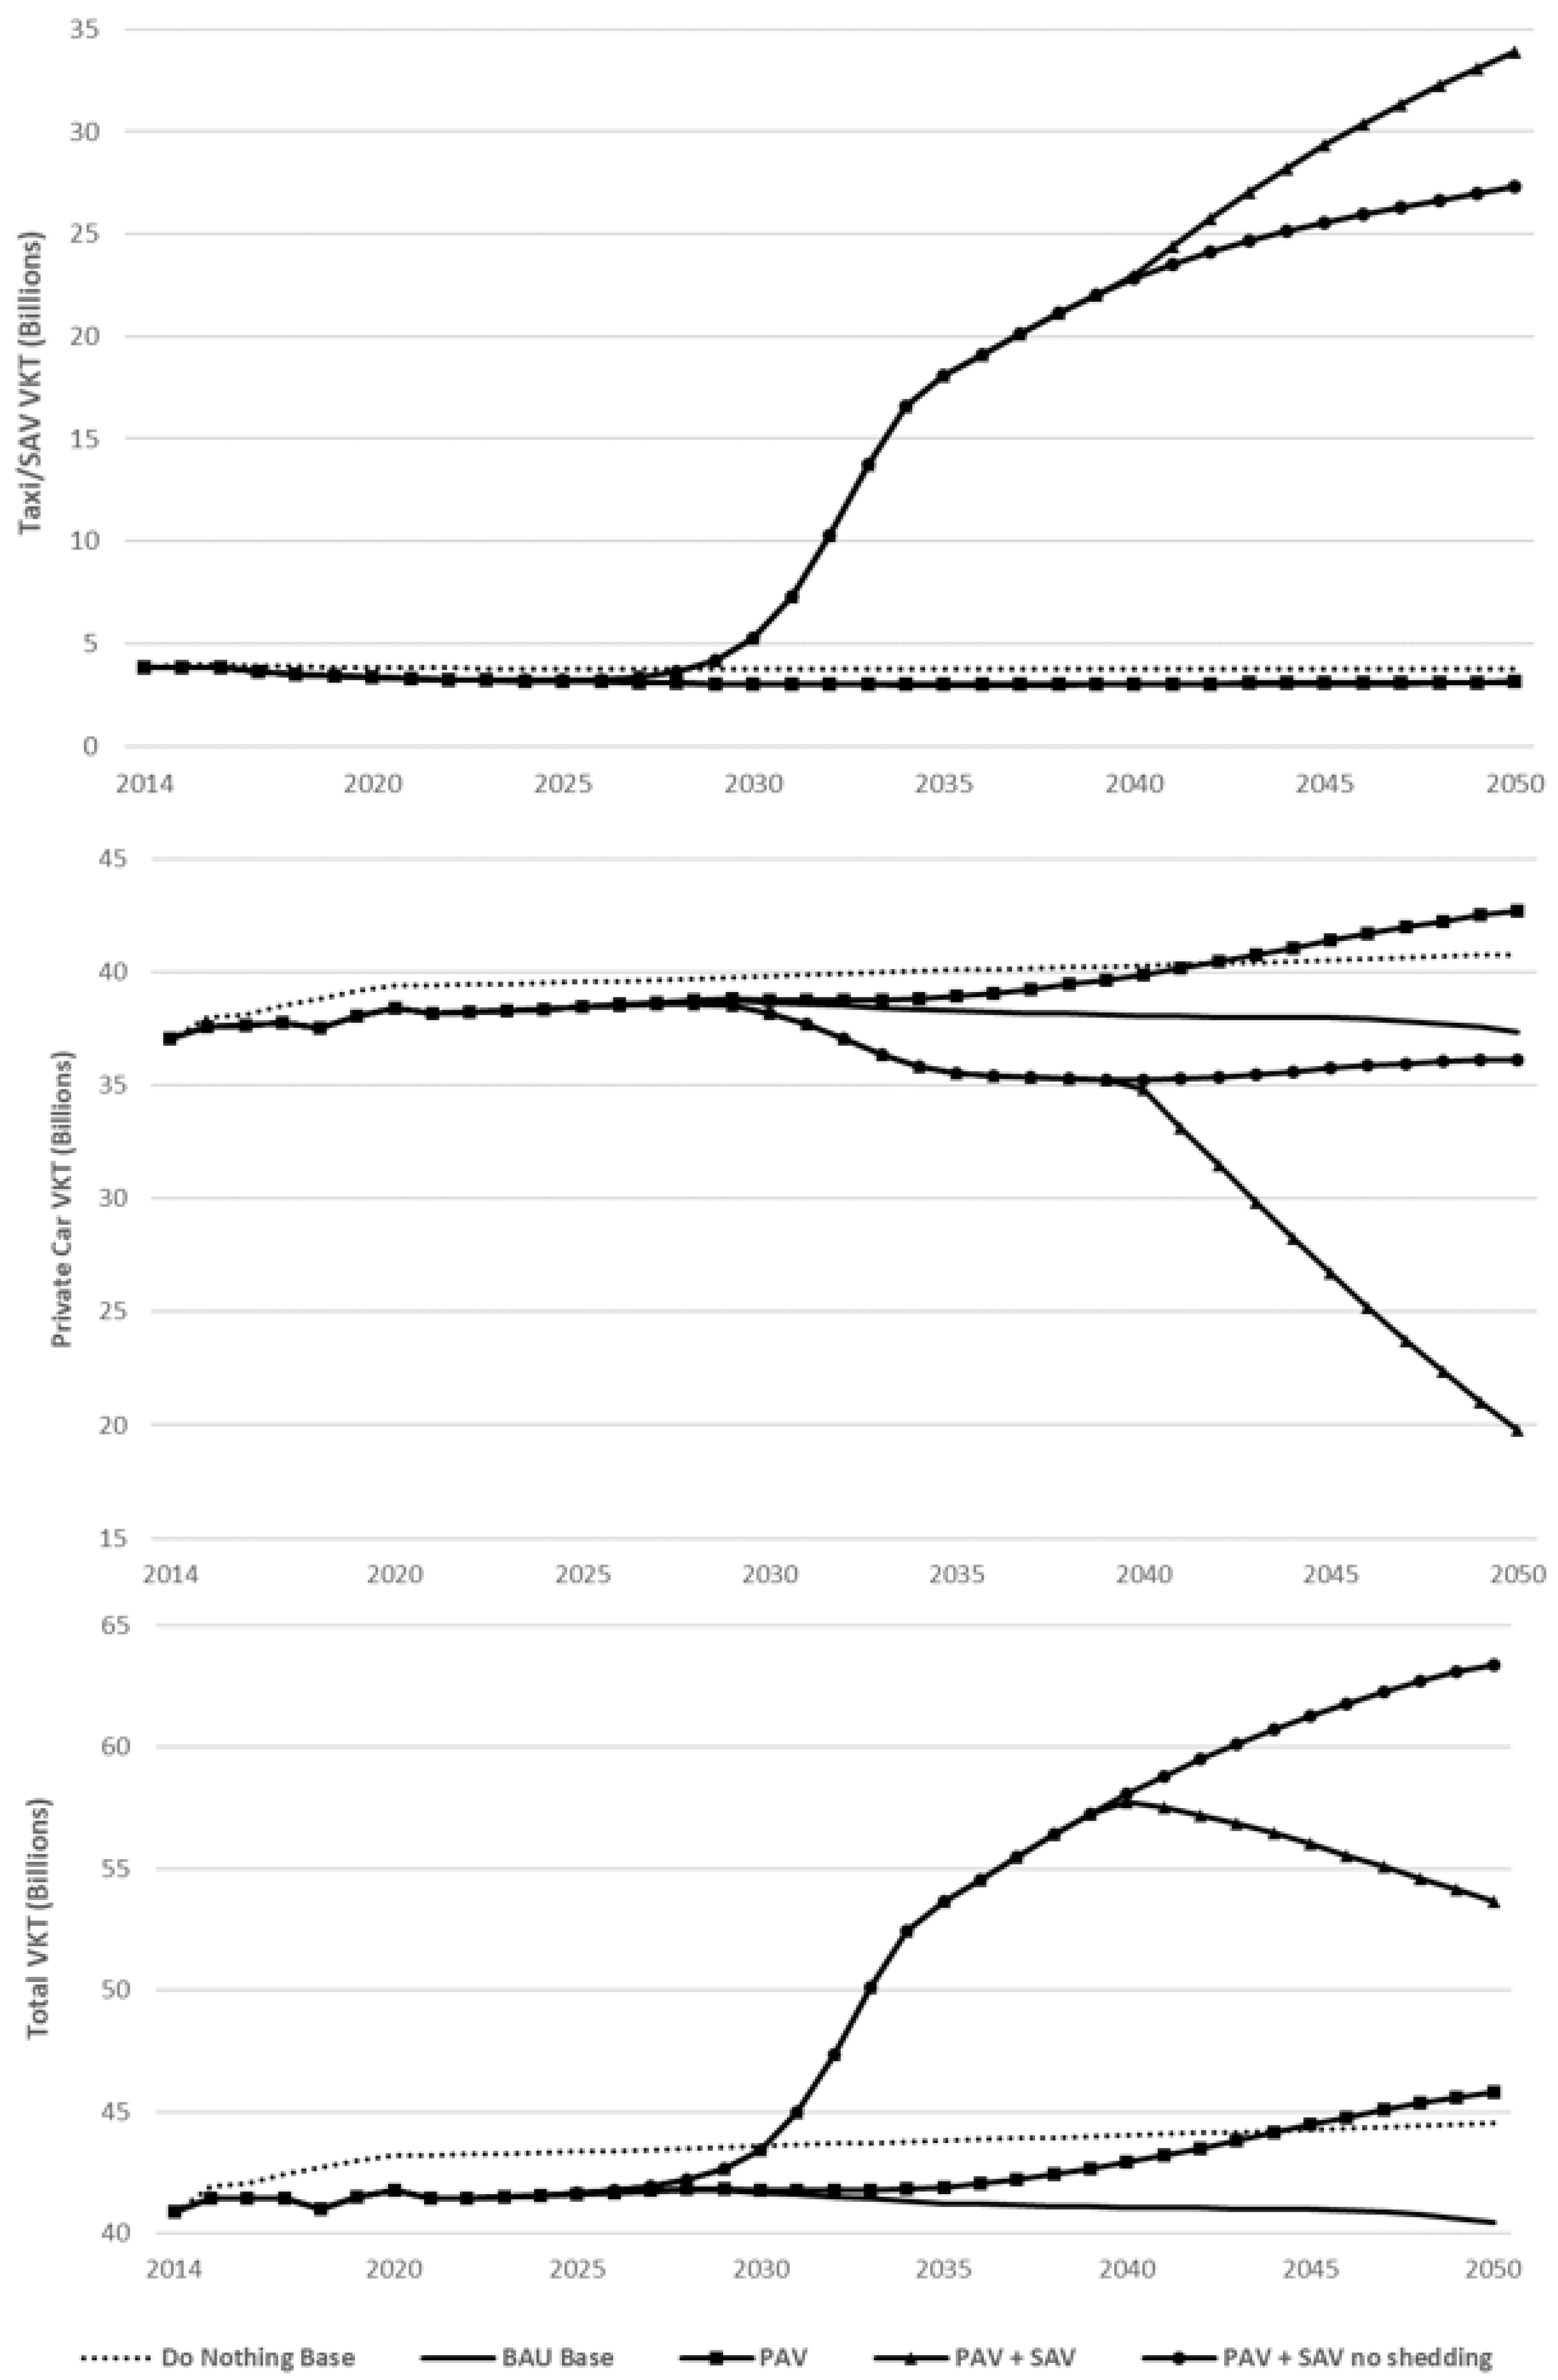
3.3. The Introduction of Autonomous and Shared Vehicles

Turning now to the influence of autonomous vehicles (AVs), we ran three additional scenarios where AVs were introduced as private autonomous vehicles (PAVs) with or without shared autonomous vehicles (SAVs) (or “robo-taxis”) and car shedding (no replacement of private vehicles due to use of SAVs).
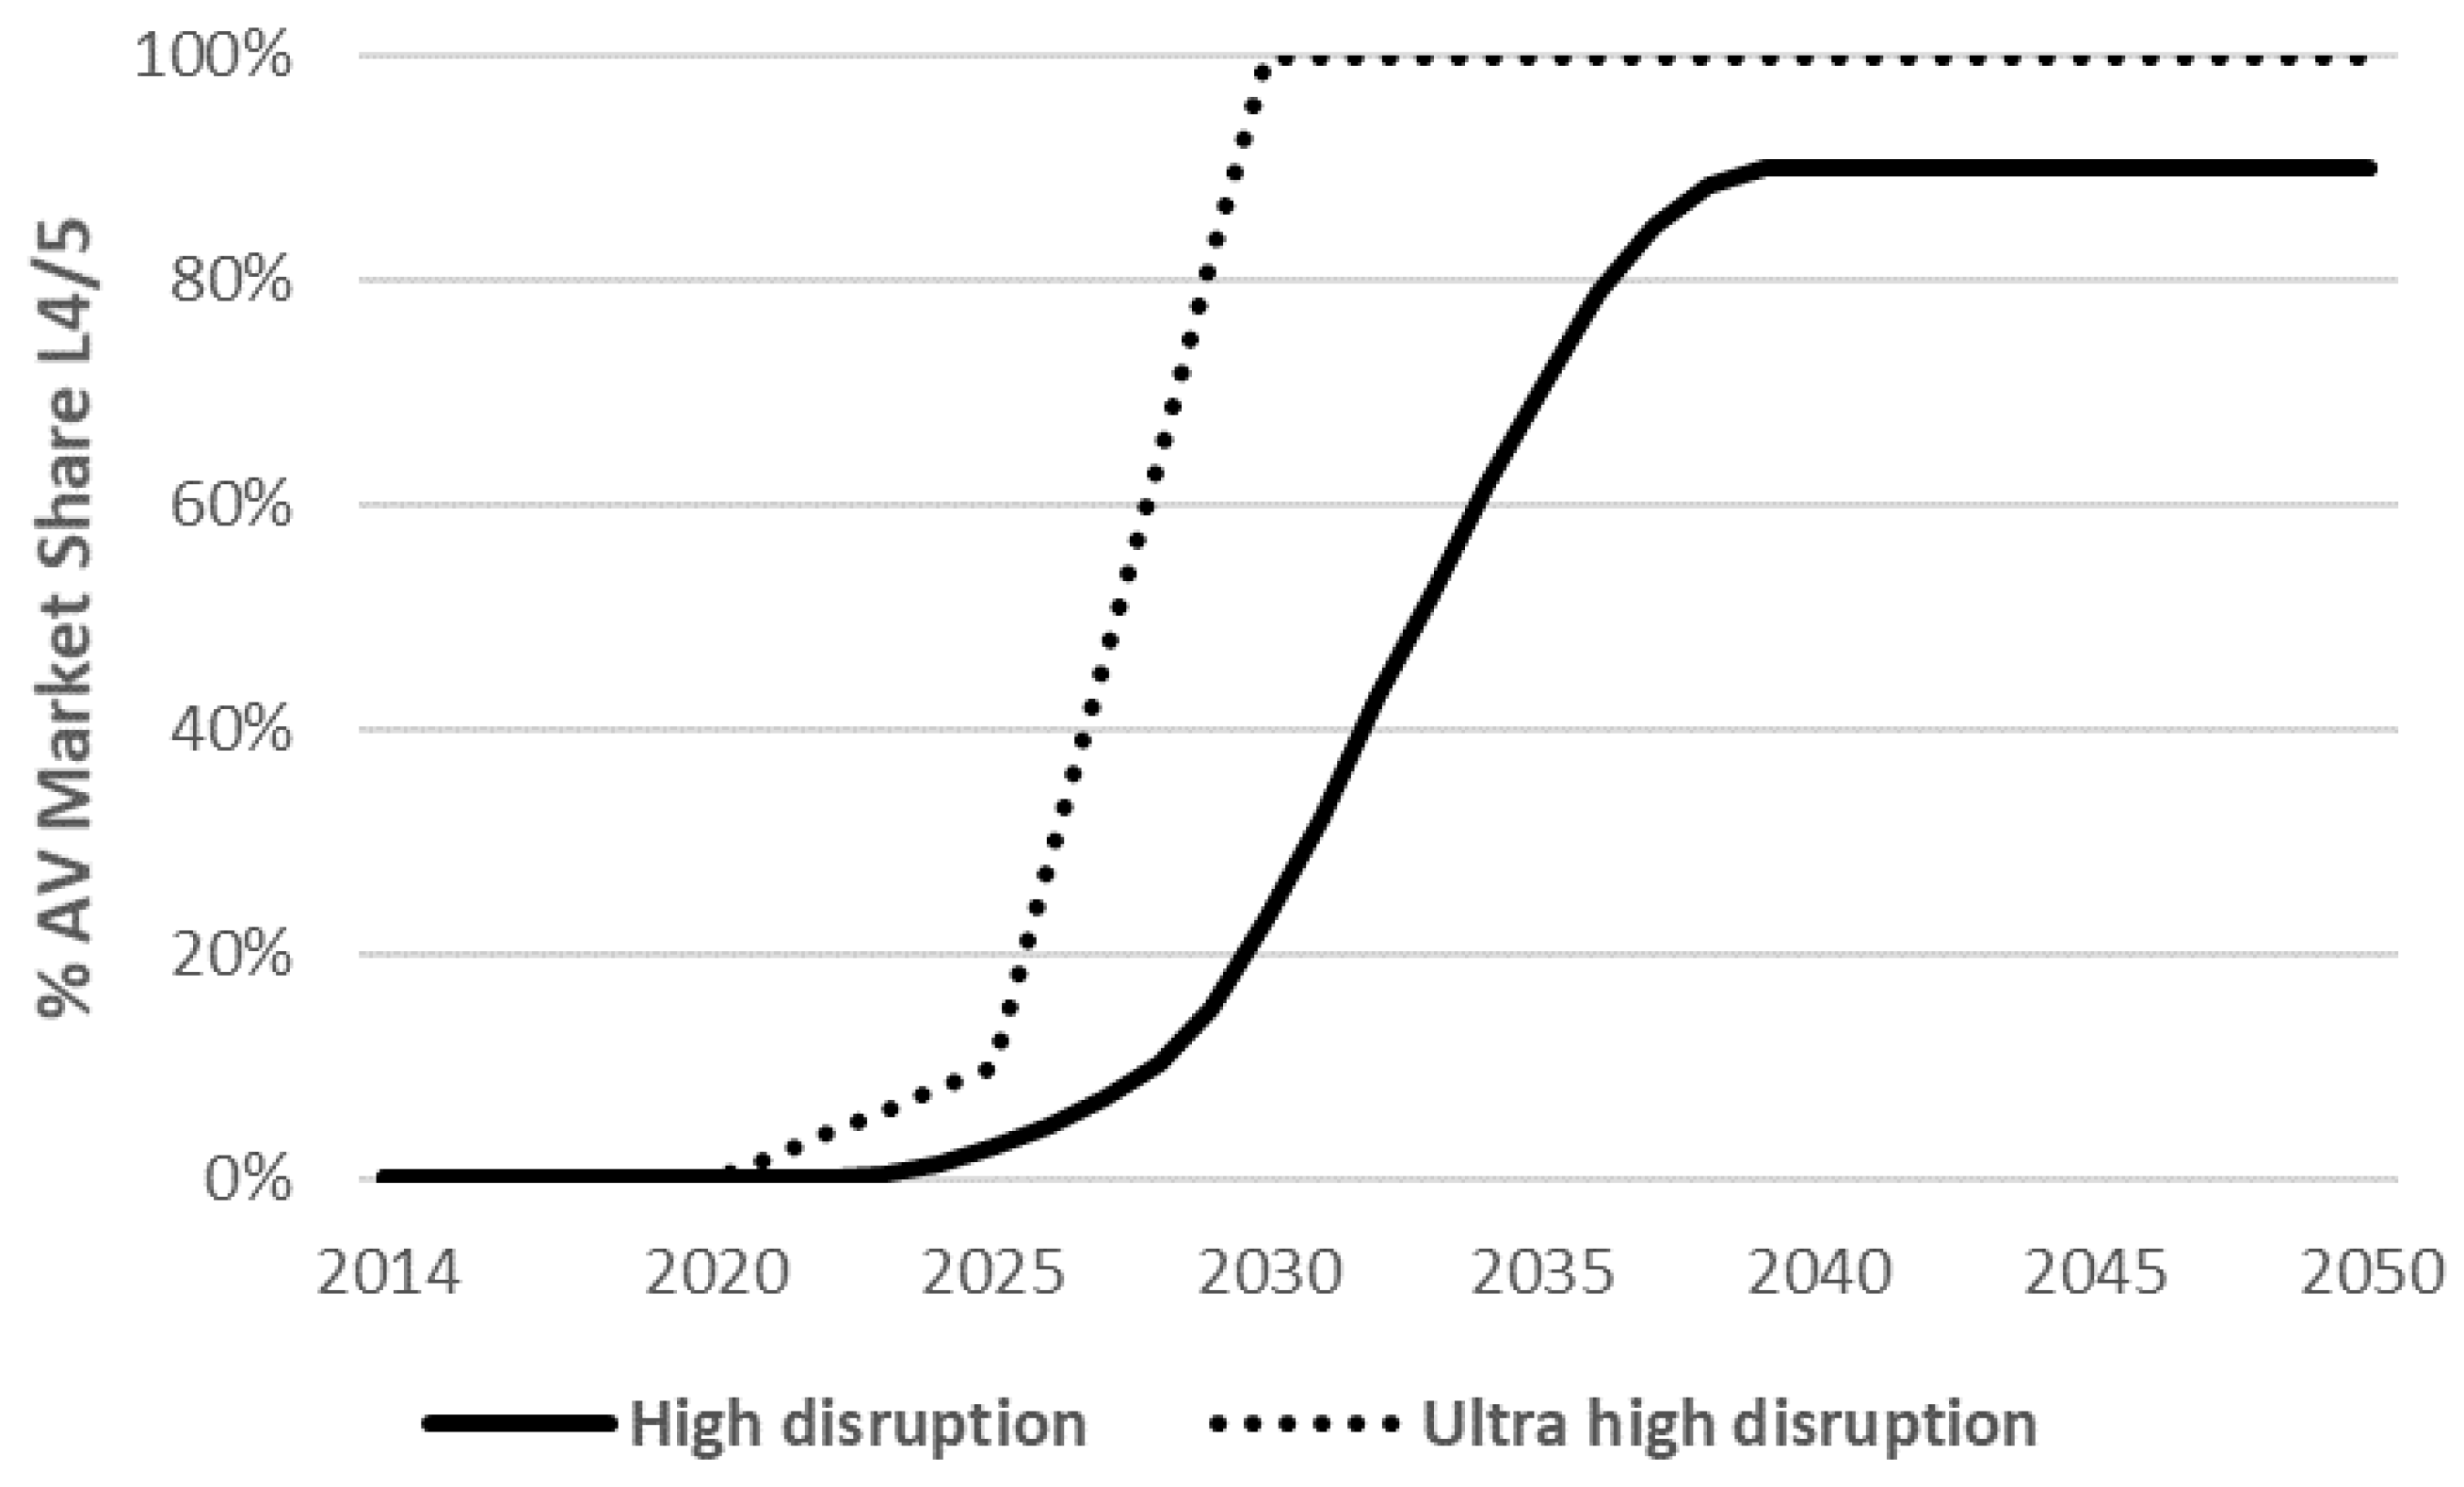
  • PAV: As the base but with the introduction of automated vehicles (assuming a high-disruption scenario, with a high impact on access/egress times, a linear impact on road capacity and a medium effect on in-vehicle value of time).
  • PAV + SAV: As PAV but including the introduction of shared AVs within the taxi fleet and associated car shedding.
  • PAV + SAV (no shedding): As PAV + SAV but without car shedding.
For the AV parameters, we assumed a mid-range scenario, choosing a reduction in access/egress time by 50% due to automated parking/pick-up, a linear road capacity effect and a 25% effect on in-vehicle value of time (see Section 3.3.2 for sensitivity to this). We can see in Table 7 and Table 8 that this introduction of AV had a significant effect on all mode shares and on the vehicle fleet, more so than any of the Beijing Master Plan interventions described previously (Table 3). With personal AVs (PAV) only, private car shares would increase by 25% from 2014 or by around 22% from our BAU base, with reductions in all other modes—mainly taken from pedestrian trips. When SAVs were also introduced, although we reduced the private car trip share by nearly half from our BAU base, the overall car trip share was nearly doubled. To meet this need, the taxi fleet would rise to around 600,000 vehicles (of which around 500,000 would be SAVs), and private cars in 2050 would reduce from nearly 5 m (in all other scenarios) to around 2.5 m. Finally, we see that, when there is no car shedding, although there are fewer private car trips than in the PAV-only scenario (and, actually, marginally fewer than in the BAU base), due to taxis/SAVs now taking a 20% share of all trips, now almost half (43%) of all trips are taken by car. However, only about a third of the trips from private cars transfer to SAVs, with the majority of trips transferring to other modes. In reality, we may expect that most would retain their preference for cars, so this could be due to an over-cautious assumption within our model. This would require just over 464,000 taxis, of which 360,000 would be SAVs, and there would still be almost 5 m private cars. As these shared vehicles are still private trips, there may be no effective gain from an environmental or traffic point of view, though there may be gains in wider system efficiency (e.g., the parking land required and vehicle resources). The responsibility for the maintenance of this growing SAV fleet would also need to fall to government or private operators.

3.3.1. Impact on VKT

As may be deduced from the findings regarding the mode share and induced trips from AVs, we now consider what that means for the total vehicle kilometers traveled via passenger car. From Figure 10, we can clearly see how PAVs, SAVs and car shedding significantly increased the total VKT compared to the BAU base. PAVs only would lead to an increase in the 2050 car VKT of 13% (compared to the base). In particular, introducing SAVs had a significant effect on VKT, which would peak in 2040 with a 40% increase compared to the base and then reduce to a 33% increase in 2050 as car shedding starts to take effect. Without any car shedding, mileage would increase from BAU by nearly 60% in 2050. These are similar findings to [35], who used a different version of the MARS model for Leeds UK (with AVs and SAVs implemented in a different way, as they did not include the adaptation of taxis and car shedding, as described previously), which suggested a private car VKT increase of 56% and a shared ownership increase of 41%. Another study suggested only a 19% increase in VKT from PAVs and 26% from SAVs in Vienna (22% and 9% for all of Austria) [34], though another Austrian application found a reduction in VKT across the country (though with significant regional differences) [36]. In their agent-based model of the introduction of an SAV fleet in the US context, which included empty running, [62] suggested a 10% increase in VKT, though this was based on a much smaller city region with only a small portion of SAV trips. This could have severe consequences not only in energy and emissions, even if the fleet were electrified, but also in system efficiency, as more vehicles would be on the roads at any point in time. As set out in Table 9, for SAVs, this would work out to 57,904 km/year per vehicle, only a small increase from the initial 55,903 km/year, and less than the BAU taxi mileage of 70,213 km/year. For private vehicles, this may mean an increase in annual VKT from 2014 by 25% to around 9000 km (without SAVs and/or shedding) This is potentially conservative, as another study suggested that the current average Chinese private mileage was 10,300 km, and they taxi mileage was around 80,000 km/year [63], though we (and other MARS-based studies) did not account for the empty running of vehicles.

3.3.2. Sensitivity to AV Assumptions

We used a mid-range scenario, but we accept that these assumptions influenced our conclusions. Table 10 shows the sensitivity of the PAV trip share to the AV assumptions of changes in growth rates, access/egress times, impacts on road capacity and changes in the value of the subjective in-vehicle value of time (VoT), as described in Section 2.7.1. Comparing scenarios with high AV penetration (AV1-11), we see that the access/egress time reductions can have a stronger individual impact than either the capacity or VoT. In fact, eliminating these times entirely (AV5) could increase the 2050 EV/AV share of all trips by over 70% compared to the base. AV15 is the mid-range scenario that we chose as the “PAV” scenario previously discussed, and it was based on a mid-range access/egress time reduction of 50%, which on its own can increase the EV/PAV mode share by 27.5%. The capacity effect type has little impact on its own (AV6-7), so we chose linear for simplicity. A decrease in the VoT (AV8-11) can cause, on its own, up to a 4.4% increase in the EV/PAV trip share compared to the BAU base, but as this is at an extreme value, we chose a more realistic reduction of 25%. Together, these conditions lead to a 2050 EV/PAV trip mode share of 24.2%, a 30% increase compared to BAU, which we think is reasonable. We chose not to consider the ultra-high scenario of AV penetration, as it was an extreme prediction, and under the same conditions (AV27), it would only increase EV/PAV share by 2%pt compared to AV15.

3.3.3. Sensitivity to Car Shedding Assumptions

Finally, we consider the sensitivity of car ownership and the trip share to our assumptions regarding car shedding. As set out in Appendix B, the portion of the car fleet that is shed each year due to use of SAVs was determined according to three factors:
  • The threshold of the L5 PAV share at which shedding takes effect;
  • The portion of the SAV trip share that would be shed;
  • The portion of the non-SAV trip share that would be shed.
To test the sensitivity to these, we created five sensitivity scenarios (SSx) where a portion of the non-SAV share (3) was increased substantially, and the threshold and shedding portions (1 and 2) were both increased and reduced by half. As set out in Table 11 and Figure 11, in comparison to our scenarios of PAVs + SAVs with and without shedding, we can make the following observations. Firstly, increasing the shedding of non-SAV users (SS1) could halve private car ownership and substantially reduce the private car trip share with a limited increase in the taxi/SAV trip share. However, it is unlikely that such a large number of people would be willing to car-shed if they were not already witnessing the benefits of SAVs (i.e., they do so only through word of mouth from others). Halving or doubling the shedding portion of SAV users (SS2 + 3) can change the total car trip share by around 3%pts, which is limited, as this group is smaller than the group of non-SAV users. A reduction in the assumed threshold for the PAV share for shedding (SS4) would be more optimistic but not quite as successful as an increased shedding share (SS3), though with an additional advantage that shedding would start around five years earlier. Increasing the shedding threshold tended toward the no-shedding case until the final years of the simulation, when a tipping point was reached.

4. Conclusions

In this study, new mobility services and technologies were implemented into the established MARS model, which was adapted for the megacity region of Beijing, China. The MARS adaptations detailed in this paper, particularly those related to the impact of shared bikes as a feeder mode to rail, and the additional mode of taxis/shared AVs, can be adopted by researchers applying MARS (or similar models) in other regions to more accurately assess these strategies.
Furthermore, from the findings discussed in the previous section, we can draw the following broad conclusions about the likely success of the strategies and policies of the Beijing Master Plan, which are not only relevant for policy makers in Beijing but also have transferable implications for other regions, particularly megacities that face similar complex challenges.
  • The decentralization of the population to the outer regions of Beijing may be successful in reducing the overall share of private car trips, though many people are effectively displaced from central zones into outer zones. Alongside this, however, decentralization could also reduce public transport use as the average trip length increases (especially in the outer zones), but it may increase active travel in some zones. Thus, any benefits for central zones may be outweighed by an overall reduction in sustainability across the whole city region, which should be considered at the planning stage, as it would suggest that better integration between all public and active transport could prevent shifts towards private cars. This observation depends on the model’s assumption that travel behavior (including car ownership) changes when the population moves to new zones, but a more nuanced understanding of whether and how people change their behavior should be sought in future work. Although affecting population movement may be hard with other cities, these findings on consequences and sensitivities are relevant to urban development planning.
  • Most major cities are considering the construction and promotion of some form of mass rapid transport system. In our study, the impact of new rail lines was limited to zones where new rail was introduced. If the purpose of policy is to increase rail use across all city regions, then other, more holistic policies that account for needs and diversity in every zone should be considered. Furthermore, investments should be integrated with other strategies, such as decentralization, to ensure that higher shares are obtained for rail in the larger, less dense outer zones; otherwise, we would lose rail share to other modes due to longer access and journey times compared to central zones.
  • Among the increasing research into policies for active travel modes, there is a limited understanding and increased interest in the impact of shared micro-mobility in multi-modal journeys. The introduction of a shared bike service (as a rail feeder system) in Beijing increases the rail share by around 2% on average across all zones with rail connections. Although this may seem limited, the benefits here are not only the increase in rail share but also the public health benefits from the additional active travel (not captured in our model). The impact is more limited in outer zones with generally longer access distances to stations, where the time savings gained have a marginal benefit, meaning that other methods to improve station access may be required (such as integrated bus services or shared AVs). In smaller cities, these impacts may not be as disparate.
  • Although the mandated electrification of the private car fleet would successfully lead to a significant reduction in tailpipe emissions (with air pollution benefits), the attraction of EVs compared to ICEVs would lead to a higher private car mode share than the scenario without electrification, which is mainly taken from active modes. Such trends could be replicated in cities that focus on the introduction of low- or zero-emission zones. This not only has the potential to create congestion issues and related system inefficiencies but also, the corresponding reduction in active travel would have public health implications. Furthermore, although EVs have no tailpipe emissions, the energy requirements, downstream emissions and local emissions related to tires and breaks remain a significant concern.
  • Shared and automated mobility is gaining increased attention across the world. In our study, it could increase the (effective) private car trip share up to 43% (PAVs + SAVs without shedding) with a corresponding increase in VKT of 60%. This would, clearly, have significant implications for sustainability and livability, reducing the active and public transport share by 24%. As we had a conservative assumption that, once cars are shed, other modes can be chosen in lieu of private car trips, even with car shedding in place, the car trip share can remain very high. As a result, not only would the option of SAVs critically require some corresponding imposed car shedding (and possibly ride sharing) but also the business model for SAV trips would need to be tailored in a way that would prioritize active and public transport. This could be similar to the current car ownership restriction and taxi fleet control policies in Beijing, suggesting that an approach taken in other regions could be to adopt stricter fleet control (either by restricting the fleet size or through pricing mechanisms) to avoid a shift from more sustainable transport modes and encourage car shedding. Innovative concepts such as 15-min cities and low-traffic neighborhoods could lead to similar outcomes.
In summary, our results suggest not only that decentralization policies can inhibit sustainable transitions in megacities, with a disparity of outcomes between different zones, unless supplemented with supportive transportation options but also that controlling car ownership (as is the case for conventional, non-automated vehicles) can be beneficial for local pollution but does not address wider issues, and the introduction of even shared AVs may increase VKT (and subsequent energy needs and emissions). As such, zonal diversity and additional policies to prioritize active and public transport should be considered as these new options emerge. Integrated planning is, therefore, critical to understanding the interplay between otherwise siloed policy and stakeholder decision making.

Author Contributions

Conceptualization, G.H., S.S., P.P. and M.X.; formal analysis, G.H.; funding acquisition, S.S. and M.X.; investigation, G.H., S.S., M.X., H.T. and W.M.; methodology, G.H., S.S. and P.P.; supervision, S.S. and M.X.; validation, G.H. and S.S.; visualization, G.H.; writing—original draft, G.H.; writing—review and editing, G.H., S.S., P.P. and M.X. All authors have read and agreed to the published version of the manuscript.

Funding

This work was funded through the U-PASS project, JPI-Urban Europe and ESRC (ES/T000074/1), and the National Natural Science Foundation of China (Grant No. 72288101).

Data Availability Statement

Data supporting the reported results may be available from the authors upon request.

Conflicts of Interest

Author Hang Tian was employed by the company Shanghai Urban Planning and Design Co., Ltd. of Shanghai Planning Institute. The remaining authors declare that the research was conducted in the absence of any commercial or financial relationships that could be construed as a potential conflict of interest.

Appendix A

Change in Aggregate Access/Egress Times for Shared Bikes

An external spreadsheet-based tool was developed to calculate the aggregated utility of the five subway access modes, walking, private bicycles, shared bicycles, feeder buses and private cars. The same tool was used to disaggregate the subway trips resulting from the MARS model simulations to the five access modes. Table A1 summarizes the elements that defined the specific utility of the five subway access modes. Equation (A1) describes the calculation of the utility of the different subway access modes. Equation (A2) describes the calculation of the aggregated generalized costs of access to a subway station. Equation (A3) describes the calculation of the probability that a certain access mode would be chosen.
Table A1. Generalized cost elements of subway access modes.
Access ModeGeneralized Cost Elements
WalkingWalking time
Private bicycleTravel time; parking process time; walking time, parking place–platform
Shared bicycleAccess time; transaction time; travel time; walking time, parking place–platform; costs
Feeder busAccess time; waiting time; in-vehicle time; walking time, bus station–platform; costs
Private carAvailability, access time; in-vehicle time; parking place searching time at destination; walking time, parking place–platform; costs
C m = f t m k , c m k = k α m k + β m k × e γ m k t m k × t m k + c m k δ m k × I
where C m is the generalized cost of a trip with access mode m, t m k is the time for component k of an access trip with mode m , C m k is the cost for component k of an access trip with mode m, α m k , β m k , γ m k and δ m k are parameters for the utility function of time components k of an access trip with mode m and I is the household income per minute of working time.
C a = l n 1 m = 1 M 1 / C m + Z
where C a is the aggregated generalized cost to access a subway station, and Z is a real-valued constant.
P m a = 1 / C m n = 1 N 1 / C n
where P m a is the probability that mode m is chosen to access a subway station, and C m is the generalized cost of a trip with access mode m .

Appendix B

The licensed taxi fleet in Beijing was held at around 69,000 in 2014 (the starting year of the MARS model) [36]. However, we made the assumption that, as SAVs entered the fleet, this would be allowed to grow in size in order to meet the potential demand. We modeled this growth in relation to the wait time for a taxi, as shown in Figure A1.
Figure A1. Model of growth in taxi fleet.
Futuretransp 04 00033 g0a1
Demand for a taxi ( D ) was determined in the wider MARS model in the usual way (see [25]), and the implied fleet ( F i —Equation (A4)) to meet that demand was calculated using the initial trip rate (Ri). It was not assumed that the trip rate would change over time, though in reality, an increasing SAV share could lead to a higher trip rate. The actual taxi fleet (Fa) was a stock, which then changed over time to meet this implied fleet, with an adjustment time of 0.5 years. As taxi journeys mainly (up to 90%) take place within the 5th Ring Road of Beijing [36,37,38], we modeled the taxi fleet based only on the demand in zones within this area (which we termed “inner” zones). The share of the whole taxi fleet that was SAVs was assumed to grow at the same rate as private L5 AVs.
F i = D R i
The actual taxi fleet then yielded an implied wait time ( T i —Equation (A5), based on [39]), which could itself influence the actual wait time ( T a ) via an archetypical goal-seeking structure in relation to the initial demand ( D 0 ) and wait time ( T 0 ). We assumed that the full fleet would be available at all times (though, in reality, there would be downtime for human drivers’ rest and vehicle fueling/maintenance). The initial wait time was 8 min, according to the available Didi data analysis, and we assumed a minimum wait time relative to the SAV share of the taxi fleet. A 6-min wait time was assumed to be the minimum for a fully conventional fleet, versus a 3-min wait once the SAV fleet went over a 30% share [40,41], with exponential decay. For the outer zones, we assumed that only 10% of the fleet would be available, so the wait times were assumed to be longer, but no specific data were found on this, so we doubled the inner-zone wait times. There was no difference in wait times by time of day. Although we accepted that wait times are generally longer off the peak for conventional taxis due to a lower supply [40], we assumed that taxi firms would provide a certain level of service and aim for a certain number of rides per day per vehicle.
T i = α × D F a 2   Where :   α = T 0 × F i 0 2 D 0
The actual wait time was then fed back into the time component of the friction factor for the taxi mode. We based the friction factor on the same structure as that of a public transport mode. That is to say that it consists of the same elements as a bus or rail, most notably including, as well as waiting time, fare cost, access and egress time, the quality of in-vehicle time and cost sensitivity. The fare cost was based on the Didi Express pricing structure [42]:
  • Peak fare (¥): 14 + 1.8 × distance + 0.8 × time.
  • Off-peak fare (¥): 14 + 1.45 × distance + 0.4 × time.
Access and egress times were taken as 1 min, assuming door-to-door service (and similar to [40]). The subjective value of the quality of in-vehicle time was the same as that of private AVs, and there was no over-crowding considered, as shared rides are not currently included. Peak and off-peak cost sensitivity was set to be slightly lower than that of rail and to rise in line with the SAV share to a value closer to the cost sensitivity of private cars (capped at 0.2 during the peak and 0.5 off the peak), later calibrated to 2017 mode shares (see Section 2.8). Finally, in order to prevent “unrealistic” trips, a threshold of a 90-min acceptable journey time was incorporated. This is quite a generous threshold, as [41] suggests no trips over 75 min and [43] that less than 7% of trips are over 30 min.
The final model amendment was to reflect on the shedding of private vehicles as shared vehicles were adopted. There is limited evidence available to model this, as the technology and services are both novel concepts. However, studies of car shedding by members of car clubs and users of ride sharing over recent years have suggested that there is a desire (if not an expectation) that sustainable urban mobility relies on a transition towards shared mobility and a significant volume of evidence that a reduction in car ownership is likely [44,45,46,47,48,49]. Therefore, it is reasonable that we are able to implement car shedding due to SAVs as a scenario within this work even though some authors found a rebound increase effect on ownership [50] or no influence [51]. Although it is not exactly the same situation, and many of those who join car clubs may already have been predisposed to the idea of car shedding, we assume that this can give us an indication of the potential of car shedding. There is a wider range in impact across the existing studies, suggesting that each SAV could replace between 4 and 30 private vehicles. There are indications that car sharing will affect the willingness to purchase a new car (rather than the disposal of one’s current car), and this tendency will increase with the use of car sharing. This was implemented as a reduction in car fleets, as shown in Equation (A6). For all zones, once the L5 AV share was over 50% of the car fleet (an assumption that, by this point, the AV technology would be well recognized and generally trusted), it was reduced in proportion to 30% of the taxi mode split ( T S A V ) in that zone (i.e., 30% of those using SAVs in the private car fleet (Fl) would car-shed—based on [44,47]—and a very small portion (0.01%) of the remainder of the fleet ( F i ) would also be shed).
C S = T S A V × 0.3 × F l + 1 T S A V × 0.0001 × F l   L 5   S h a r e = 0.5

References

  1. Tran, T. Mitigating Greenhouse Gas Emissions from Passenger Transport Sector in Megacities: A case of Ho Chi Minh City. Chem. Eng. Trans. 2019, 72, 85–90. [Google Scholar] [CrossRef]
  2. Bai, M.; Krumdieck, S. Transition engineering of transport in megacities with case study on commuting in Beijing. Cities 2020, 96, 102452. [Google Scholar] [CrossRef]
  3. Dong, D.; Duan, H.; Mao, R.; Song, Q.; Zuo, J.; Zhu, J.; Wang, G.; Hu, M.; Dong, B.; Liu, G. Towards a low carbon transition of urban public transport in megacities: A case study of Shenzhen, China. Resour. Conserv. Recycl. 2018, 134, 149–155. [Google Scholar] [CrossRef]
  4. Chiquetto, J.B.; Leichsenring, A.R.; Ribeiro, F.N.D.; Ribeiro, W.C. Work, housing, and urban mobility in the megacity of São Paulo, Brazil. Socio-Econ. Plan. Sci. 2022, 81, 101184. [Google Scholar] [CrossRef]
  5. UNECE. A Handbook on Sustainable Urban Mobility and Spatial Planning. Promoting Active Mobility; United Nations Economic Commission for Europe: Geneva, Switzerland, 2020; Available online: https://unece.org/DAM/trans/main/wp5/publications/1922152E_WEB_light.pdf (accessed on 30 January 2024).
  6. Canitez, F. Pathways to sustainable urban mobility in developing megacities: A socio-technical transition perspective. Technol. Forecast. Soc. Chang. 2019, 141, 319–329. [Google Scholar] [CrossRef]
  7. Mohan, D.; Tiwari, G. Mobility, Environment and Safety in Megacities: Dealing with a Complex Future. IATSS Res. 2000, 24, 39–46. [Google Scholar] [CrossRef]
  8. Zhao, P. Sustainable urban expansion and transportation in a growing megacity: Consequences of urban sprawl for mobility on the urban fringe of Beijing. Habitat Int. 2010, 34, 236–243. [Google Scholar] [CrossRef]
  9. Ghosh, B.; Schot, J. Towards a novel regime change framework: Studying mobility transitions in public transport regimes in an Indian megacity. Energy Res. Soc. Sci. 2019, 51, 82–95. [Google Scholar] [CrossRef]
  10. Sun, L.; Zhang, T.; Liu, S.; Wang, K.; Rogers, T.; Yao, L.; Zhao, P. Reducing energy consumption and pollution in the urban transportation sector: A review of policies and regulations in Beijing. J. Clean. Prod. 2021, 285, 125339. [Google Scholar] [CrossRef]
  11. Lee, J.; Arts, J.; Vanclay, F. Stakeholder views about Land Use and Transport Integration in a rapidly-growing megacity: Social outcomes and integrated planning issues in Seoul. Sustain. Cities Soc. 2021, 67, 102759. [Google Scholar] [CrossRef]
  12. Xu, M.; Grant-Muller, S.; Gao, Z. Implementation effects and integration evaluation of a selection of transport management measures in Beijing. Case Stud. Transp. Policy 2017, 5, 604–614. [Google Scholar] [CrossRef]
  13. Acheampong, R.A.; Legacy, C.; Kingston, R.; Stone, J. Imagining urban mobility futures in the era of autonomous vehicles—Insights from participatory visioning and multi-criteria appraisal in the UK and Australia. Transp. Policy 2023, 136, 193–208. [Google Scholar] [CrossRef]
  14. McKinsey & Company. Automotive Revolution—Perspective towards 2030; McKinsey & Company: New York, NY, USA, 2016; Available online: https://www.mckinsey.com/industries/automotive-and-assembly/our-insights/disruptive-trends-that-will-transform-the-auto-industry (accessed on 9 August 2023).
  15. Rahman, M.M.; Thill, J.-C. Impacts of connected and autonomous vehicles on urban transportation and environment: A comprehensive review. Sustain. Cities Soc. 2023, 96, 104649. [Google Scholar] [CrossRef]
  16. Milakis, D.; Müller, S. The societal dimension of the automated vehicles transition: Towards a research agenda. Cities 2021, 113, 103144. [Google Scholar] [CrossRef]
  17. Mao, W.; Shepherd, S.; Harrison, G.; Xu, M. Autonomous vehicle market development in Beijing: A simulation-based approach. Transp. Res. Part A 2024, 179, 103889. [Google Scholar]
  18. Pfaffenbichler, P.; Emberger, G.; Shepherd, S. The Integrated Dynamic Land Use and Transport Model MARS. Netw. Spat. Econ. 2008, 8, 183–200. [Google Scholar] [CrossRef]
  19. Shepherd, S.P. A review of system dynamics models applied in transportation. Transp. B Transp. Dyn. 2014, 2, 83–105. [Google Scholar] [CrossRef]
  20. Gómez Vilchez, J.J.; Jochem, P. Simulating vehicle fleet composition: A review of system dynamics models. Renew. Sustain. Energy Rev. 2019, 115, 109367. [Google Scholar] [CrossRef]
  21. Fontoura, W.B.a.; Ribeiro, G.M. System Dynamics for Sustainable Transportation Policies: A Systematic Literature Review. Rev. Bras. Gestão Urbana 2021, 13, e20200259. [Google Scholar] [CrossRef]
  22. Cai, J.; Liang, Y. System Dynamics Modeling for a Public–Private Partnership Program to Promote Bicycle–Metro Integration Based on Evolutionary Game. Transp. Res. Rec. 2021, 2675, 689–710. [Google Scholar] [CrossRef]
  23. Fernández, A.; Billhardt, H.; Ossowski, S.; Sánchez, Ó. Bike3S: A tool for bike sharing systems simulation. J. Simul. 2020, 14, 278–294. [Google Scholar] [CrossRef]
  24. Yang, T.; Li, Y.; Zhou, S. System Dynamics Modeling of Dockless Bike-Sharing Program Operations: A Case Study of Mobike in Beijing, China. Sustainability 2019, 11, 1601. [Google Scholar] [CrossRef]
  25. Zhihang, W. Research on the Impact of Shared Bicycles on Urban Traffic Congestion. Master’s Thesis, Beijing Jiaotong University, Beijing, China, 2019. [Google Scholar]
  26. Harrison, G.; Shepherd, S.P.; Chen, H. Modelling Uptake Sensitivities of Connected and Automated Vehicle Technologies. Int. J. Syst. Dyn. Appl. 2021, 10, 88–106. [Google Scholar] [CrossRef]
  27. Jiang, L.; Chen, H.; Paschalidis, E. Diffusion of connected and autonomous vehicles concerning mode choice, policy interventions and sustainability impacts: A system dynamics modelling study. Transp. Policy 2023, 141, 274–290. [Google Scholar] [CrossRef]
  28. Legêne, M.F.; Auping, W.L.; Correia, G.H.d.A.; van Arem, B. Spatial impact of automated driving in urban areas. J. Simul. 2020, 14, 295–303. [Google Scholar] [CrossRef]
  29. Nieuwenhuijsen, J.; Correia, G.H.d.A.; Milkis, D.; van Arem, B.; van Daalen, E. Towards a quantitative method to analyse the long-term innovation diffusion of automated vehicles technology using system dynamics. Transp. Res. Part C Emerg. Technol. 2018, 86, 300–327. [Google Scholar] [CrossRef]
  30. Pfaffenbichler, P.; Gühnemann, A.; Klementschitz, R.; Emberger, G.; Shepherd, S. A Systemic Analysis of Impacts of Individual and Shared Automated Mobility in Austria. Transp. Res. Procedia 2020, 49, 6–16. [Google Scholar] [CrossRef]
  31. Puylaert, S.; Snelder, M.; van Nes, R.; van Arem, B. Mobility impacts of early forms of automated driving—A system dynamic approach. Transp. Policy 2018, 72, 171–179. [Google Scholar] [CrossRef]
  32. Pfaffenbichler, P. The Strategic, Dynamic and Integrated Urban Land Use and Trasnport Model MARS (Metropolitan Acivtity Relocation Simulator). Ph.D. Thesis, Technische Universitat Wien, Vienna, Austria, 2003. [Google Scholar]
  33. Pfaffenbichler, P.; Emberger, G.; Shepherd, S. A system dynamics approach to land use transport interaction modelling: The strategic model MARS and its application. Syst. Dyn. Rev. 2010, 26, 262–282. [Google Scholar] [CrossRef]
  34. Emberger, G.; Pfaffenbichler, P. A quantitative analysis of potential impacts of automated vehicles in Austria using a dynamic integrated land use and transport interaction model. Transp. Policy 2020, 98, 57–67. [Google Scholar] [CrossRef]
  35. May, A.D.; Shepherd, S.; Pfaffenbichler, P.; Emberger, G. The potential impacts of automated cars on urban transport: An exploratory analysis. Transp. Policy 2020, 98, 127–138. [Google Scholar] [CrossRef]
  36. Soteropoulos, A.; Pfaffenbichler, P.; Berger, M.; Emberger, G.; Stickler, A.; Dangschat, J.S. Scenarios of Automated Mobility in Austria: Implications for Future Transport Policy. Future Transp. 2021, 1, 747–764. [Google Scholar] [CrossRef]
  37. NBSC. China Statistical Yearbook 2022. Table 8-21 Land Use by Region (2019). 2022. National Bureau of Statistics of China. Available online: http://www.stats.gov.cn/sj/ndsj/2022/indexeh.htm (accessed on 30 June 2023).
  38. Hongyang, S. Line 1 Batong Line, Fangshan Line Line 9 This Year Realizes Cross-Line Operation. Beijing Daily, 25 March 2021. [Google Scholar]
  39. Martin, E.W.; Shaheen, S.A. Evaluating public transit modal shift dynamics in response to bikesharing: A tale of two US cities. J. Transp. Geogr. 2014, 41, 315–324. [Google Scholar] [CrossRef]
  40. Liu, T.; Xu, M. Chapter One—Integrated Multilevel Measures for the Transformation to a Transit Metropolis: The Successful and Unsuccessful Practices in Beijing. In Advances in Transport Policy and Planning; Shiftan, Y., Kamargianni, M., Eds.; Academic Press: Cambridge, MA, USA, 2018; Volume 1, pp. 1–34. [Google Scholar]
  41. Muir, H.; Pfaffenbichler, P.; Emberger, G.; Shepherd, S.; Wagner, P.; Martin, P.; Shires, J.; May, T.; Levin, T. CityMobil WP2.3 Modelling Background Report—MARS, Microsimulation, Cities and Scenarios. 2008. Available online: https://www.researchgate.net/publication/317646084_CityMobil_WP23_Modelling_Background_Report_-_MARS_microsimulation_cities_and_scenarios (accessed on 9 August 2023).
  42. Wadud, Z.; MacKenzie, D.; Leiby, P. Help or hindrance? The travel, energy and carbon impacts of highly automated vehicles. Transp. Res. Part A Policy Pract. 2016, 86, 1–18. [Google Scholar] [CrossRef]
  43. Duan, Y.; Yuan, C.; Mao, X.; Zhao, J.; Ma, N. Influence of the built environment on taxi travel demand based on the optimal spatial analysis unit. PLoS ONE 2023, 18, e0292363. [Google Scholar] [CrossRef] [PubMed]
  44. Nie, W.-P.; Cai, S.-M.; Zhao, Z.-D.; Gao, F.-J.; Li, Z.-T.; Zhou, T. Examining the impact of urban-rural spatial structure on mobility networks: A case study of taxis. Cities 2023, 141, 104512. [Google Scholar] [CrossRef]
  45. Wang, J.; Du, F.; Huang, J.; Liu, Y. How do taxi usage patterns vary and why? A dynamic spatiotemporal analysis in Beijing. Comput. Urban Sci. 2023, 3, 11. [Google Scholar] [CrossRef]
  46. Jiang, W.; Lian, J.; Shen, M.; Zhang, L. A multi-period analysis of taxi drivers’ behaviors based on GPS trajectories. In Proceedings of the 2017 IEEE 20th International Conference on Intelligent Transportation Systems (ITSC), Yokohama, Japan, 16–19 October 2017; pp. 1–6. [Google Scholar]
  47. Jianqin, Z.; Peiyuan, Q.; Yingchao, D.; Mingyi, D.; Feng, L. A space-time visualization analysis method for taxi operation in Beijing. J. Vis. Lang. Comput. 2015, 31, 1–8. [Google Scholar] [CrossRef]
  48. Li, T.; Wu, J.; Dang, A.; Liao, L.; Xu, M. Emission pattern mining based on taxi trajectory data in Beijing. J. Clean. Prod. 2019, 206, 688–700. [Google Scholar] [CrossRef]
  49. Zhang, W.; Ukkusuri, S.V. Optimal Fleet Size and Fare Setting in Emerging Taxi Markets with Stochastic Demand. Comput. Aided Civ. Infrastruct. Eng. 2016, 31, 647–660. [Google Scholar] [CrossRef]
  50. Xue, M.; Yu, B.; Du, Y.; Wang, B.; Tang, B.; Wei, Y.-M. Possible Emission Reductions from Ride-Sourcing Travel in a Global Megacity: The Case of Beijing. J. Environ. Dev. 2018, 27, 156–185. [Google Scholar] [CrossRef]
  51. Yao, F.; Zhu, J.; Yu, J.; Chen, C.; Chen, X. Hybrid operations of human driving vehicles and automated vehicles with data-driven agent-based simulation. Transp. Res. Part D Transp. Environ. 2020, 86, 102469. [Google Scholar] [CrossRef]
  52. Wei, J. Didi Changes Pricing Rules in Beijing. Available online: https://www.chinadaily.com.cn/a/201907/10/WS5d257efaa3105895c2e7cb93.html (accessed on 7 October 2019).
  53. Feng, R.; Yao, B.; Gu, X.; Zhang, M.; Yu, B. Environmental benefits mining based on data-driven taxi cruising recommendation strategy. J. Clean. Prod. 2021, 326, 129376. [Google Scholar] [CrossRef]
  54. Guo, Y.; Xin, F.; Li, X. The market impacts of sharing economy entrants: Evidence from USA and China. Electron. Commer. Res. 2020, 20, 629–649. [Google Scholar] [CrossRef]
  55. Kim, D.; Park, Y.; Ko, J. Factors underlying vehicle ownership reduction among carsharing users: A repeated cross-sectional analysis. Transp. Res. Part D Transp. Environ. 2019, 76, 123–137. [Google Scholar] [CrossRef]
  56. Sabouri, S.; Brewer, S.; Ewing, R. Exploring the relationship between ride-sourcing services and vehicle ownership, using both inferential and machine learning approaches. Landsc. Urban Plan. 2020, 198, 103797. [Google Scholar] [CrossRef]
  57. Tang, B.-J.; Li, X.-Y.; Yu, B.; Wei, Y.-M. How app-based ride-hailing services influence travel behavior: An empirical study from China. Int. J. Sustain. Transp. 2020, 14, 554–568. [Google Scholar] [CrossRef]
  58. Wang, Y.; Shi, W.; Chen, Z. Impact of ride-hailing usage on vehicle ownership in the United States. Transp. Res. Part D Transp. Environ. 2021, 101, 103085. [Google Scholar] [CrossRef]
  59. Ye, J.; Wang, D.; Li, X.; Axhausen, K.W.; Jin, Y. Assessing one-way carsharing’s impacts on vehicle ownership: Evidence from Shanghai with an international comparison. Transp. Res. Part A Policy Pract. 2021, 150, 16–32. [Google Scholar] [CrossRef]
  60. Yoon, T.; Cherry, C.R.; Jones, L.R. One-way and round-trip carsharing: A stated preference experiment in Beijing. Transp. Res. Part D Transp. Environ. 2017, 53, 102–114. [Google Scholar] [CrossRef]
  61. Zhou, F.; Zheng, Z.; Whitehead, J.; Perrons, R.K.; Washington, S.; Page, L. Examining the impact of car-sharing on private vehicle ownership. Transp. Res. Part A Policy Pract. 2020, 138, 322–341. [Google Scholar] [CrossRef]
  62. Fagnant, D.J.; Kockelman, K.M. The travel and environmental implications of shared autonomous vehicles, using agent-based model scenarios. Transp. Res. Part C Emerg. Technol. 2014, 40, 1–13. [Google Scholar] [CrossRef]
  63. Ma, D.; Wu, X.; Sun, X.; Zhang, S.; Yin, H.; Ding, Y.; Wu, Y. The Characteristics of Light-Duty Passenger Vehicle Mileage and Impact Analysis in China from a Big Data Perspective. Atmosphere 2022, 13, 1984. [Google Scholar] [CrossRef]
Figure 1. Methodological overview.
Futuretransp 04 00033 g001
Figure 2. MARS zones for Beijing (color-coded for population density: persons/square kilometer).
Futuretransp 04 00033 g002
Figure 3. Population by area over time under the decentralization policy.
Futuretransp 04 00033 g003
Figure 4. New subway lines across zones in Beijing. (colour coded for population density—see Figure 2).
Futuretransp 04 00033 g004
Figure 5. Beijing car fleet, 2014–2050, under BAU baseline.
Futuretransp 04 00033 g005
Figure 6. AV market share scenarios.
Futuretransp 04 00033 g006
Figure 7. Rail share comparisons between all trips, central zone-origin trips and outer zone-origin trips.
Futuretransp 04 00033 g007
Figure 8. 2050 rail share under the rail-only scenario in new rail zones (solid fill = inner zones; no fill = outer zones).
Futuretransp 04 00033 g008
Figure 9. 2050 increase in rail share due to shared bikes’ introduction in zones with rail connections.
Futuretransp 04 00033 g009
Figure 10. Total car VKT.
Futuretransp 04 00033 g010
Figure 11. Sensitivities to car shedding assumptions.
Futuretransp 04 00033 g011
Table 1. New zone rail connections (as planned at point of model building in 2019).
YearNew Zone Rail Connections (Bold Indicates Outer Zones)
201513, 22, 29, 37
201651
201735
201826, 33, 42, 55, 62
202150, 65
202247
202356, 67
Table 2. Calibrated central zone mode share results for 2017.
PedestrianBicycleBusRailTaxiCar
Real Data29%12%16%15%3%25%
Modeled Data29%11%15%15%3%26%
Table 3. Mode trip shares (%) (all trips).
20142050
Do NothingBAU
Base
No LUNo RailNo SBNo EV
Pedestrian35.034.135.533.036.535.635.7
Bike16.215.917.115.217.517.217.4
Bus13.613.512.313.012.412.312.5
Rail9.49.29.711.37.79.59.9
Taxi3.02.82.02.62.12.01.9
Car (ICE)22.724.64.65.04.74.722.5
Car (EV)0.00.018.719.919.118.70.0
All private cars22.824.623.324.923.823.422.6
All cars25.827.425.327.625.925.424.5
Table 4. Mode trip shares (%) (central origin trips).
20142050
Do NothingBAU
Base
No LUNo RailNo SBNo EV
Pedestrian29.828.727.827.828.427.927.6
Bike11.411.110.510.510.810.610.7
Bus15.215.014.614.414.814.714.8
Rail13.312.915.114.813.214.715.5
Taxi3.63.42.93.33.12.92.8
Car (ICE)26.628.76.05.86.16.028.6
Car (EV)0.00.023.023.423.623.10.0
All private cars26.628.829.029.229.729.128.6
All cars30.232.231.932.532.832.131.5
Table 5. Mode trip shares (%) (outer origin trips).
20142050
Do NothingBAU
Base
No LUNo RailNo SBNo EV
Pedestrian42.441.841.740.842.941.842.1
Bike23.122.822.522.222.922.522.8
Bus11.211.210.410.910.510.410.6
Rail3.83.75.45.93.35.35.5
Taxi2.31.91.21.81.31.21.2
Car (ICE)17.218.63.53.73.63.617.7
Car (EV)0.00.015.214.815.515.20.0
All private cars17.218.618.818.419.018.817.7
All cars19.520.520.020.220.420.019.0
Table 6. Rail trips (millions).
YearZonesDo NothingBAU BASELU OnlyRail OnlySB OnlyRail + SBEV Only
2014Total3.68
Central3.07
Outer0.61
2050Total3.623.983.114.353.744.493.60
Central3.022.772.343.433.133.552.99
Outer0.601.210.770.920.610.940.60
Table 7. AV scenario results (trip mode share %).
20142050
Do NothingBAU BasePAVPAV + SAVPAV + SAV No Shedding
Pedestrian35.034.135.533.229.926.9
Bike16.215.917.116.014.613.3
Bus13.613.512.311.410.49.3
Rail9.49.29.79.08.57.3
Taxi/SAV3.02.82.01.924.420.2
Car (ICE)22.724.64.64.31.93.6
Car (EV/AV)0.00.018.724.210.219.5
All private cars22.824.623.328.512.123.1
All cars25.827.425.330.436.543.2
Table 8. Vehicle fleet size (number of cars).
20142050
Private CarTaxiTotalPrivate CarTaxiTotal
BAU base4,196,44669,0004,265,4464,891,31943,9884,935,307
PAV4,891,31944,0684,935,387
PAV + SAV2,559,786585,4003,145,186
PAV + SAV no shedding4,891,319463,9465,355,265
Table 9. Vehicle fleet mileage (KM/vehicle).
20142050
Private CarTaxiTotalPrivate CarTaxiTotal
BAU Base882955,9039591763670,2138194
PAV872770,9988202
PAV + SAV772257,90424,350
PAV + SAV no shedding738558,8168787
Table 10. Sensitivity to AV assumptions under the PAV-only scenario (no AV in BAU Base scenario).
ScenarioAV
Scenario
AccessEgressCapacityVoT2050 EV/PAV % Trip Share% Change from BAU
BAU BaseNonen/an/an/an/a18.7n/a
AV1High000018.70.0
AV2High−25%−25%0021.615.3
AV3High−50%−50%0023.827.5
AV4High−75%−75%0027.044.7
AV5High−100%−100%0032.071.3
AV6High00linear018.70.2
AV7High00progressive018.80.3
AV8High000−5%18.70.2
AV9High000−25%18.91.0
AV10High000−50%19.12.1
AV11High000−100%19.54.4
AV12High−50%−50%linear023.928.1
AV13High−50%−50%progressive024.028.4
AV14High−50%−50%linear−5%24.028.4
AV15High−50%−50%linear−25%24.229.5
AV16High−50%−50%linear−50%24.530.9
AV17High−50%−50%linear−100%25.033.9
AV18Ultra000018.70.0
AV19Ultra−25%−25%0022.419.6
AV20Ultra−50%−50%0025.637.0
AV21Ultra−75%−75%0030.965.1
AV22Ultra−100%−100%0041.1119.8
AV23Ultra−50%−50%linear025.837.9
AV24Ultra−50%−50%progressive025.938.6
AV25Ultra−50%−50%linear−5%25.838.3
AV26Ultra−50%−50%linear−25%26.139.7
AV27Ultra−50%−50%linear−50%26.541.6
AV28Ultra−50%−50%linear−100%27.245.6
Table 11. Car shedding scenarios.
ScenarioL5 PAV Shedding ThresholdPortion of SAV SheddingPortion of Non-SAV Shedding2050 Private Car Ownership2050 Private Car Trip Share2050 Taxi/SAV Trip Share
PAV + SAV no sheddingn/an/an/a4,891,31923.1%20.2%
PAV + SAV0.50.30.00012,559,78612.1%24.4%
SS10.50.30.11,486,8697.1%25.7%
SS20.50.150.00013,572,22617.4%22.4%
SS30.50.60.00011,709,7348.0%25.6%
SS40.250.30.00011,955,6499.0%25.5%
SS50.750.30.00014,405,27221.2%20.9%
Disclaimer/Publisher’s Note: The statements, opinions and data contained in all publications are solely those of the individual author(s) and contributor(s) and not of MDPI and/or the editor(s). MDPI and/or the editor(s) disclaim responsibility for any injury to people or property resulting from any ideas, methods, instructions or products referred to in the content.

