Scenarios for New Mobility Policies and Automated Mobility in Beijing
Abstract
:1. Introduction
- (1)
- What impacts will the chosen strategies of the Beijing Master Plan have by 2050 on:
- Overall mode shares?
- Rail shares, specifically in zones with new rail services?
- (2)
- Could the introduction of autonomous and shared vehicles lead to a more sustainable transport system?
- (3)
- How are our findings useful to other regions and their planners?
2. Materials and Methods
2.1. System Dynamics and the MARS Model
2.2. Beijing and the MARS Model
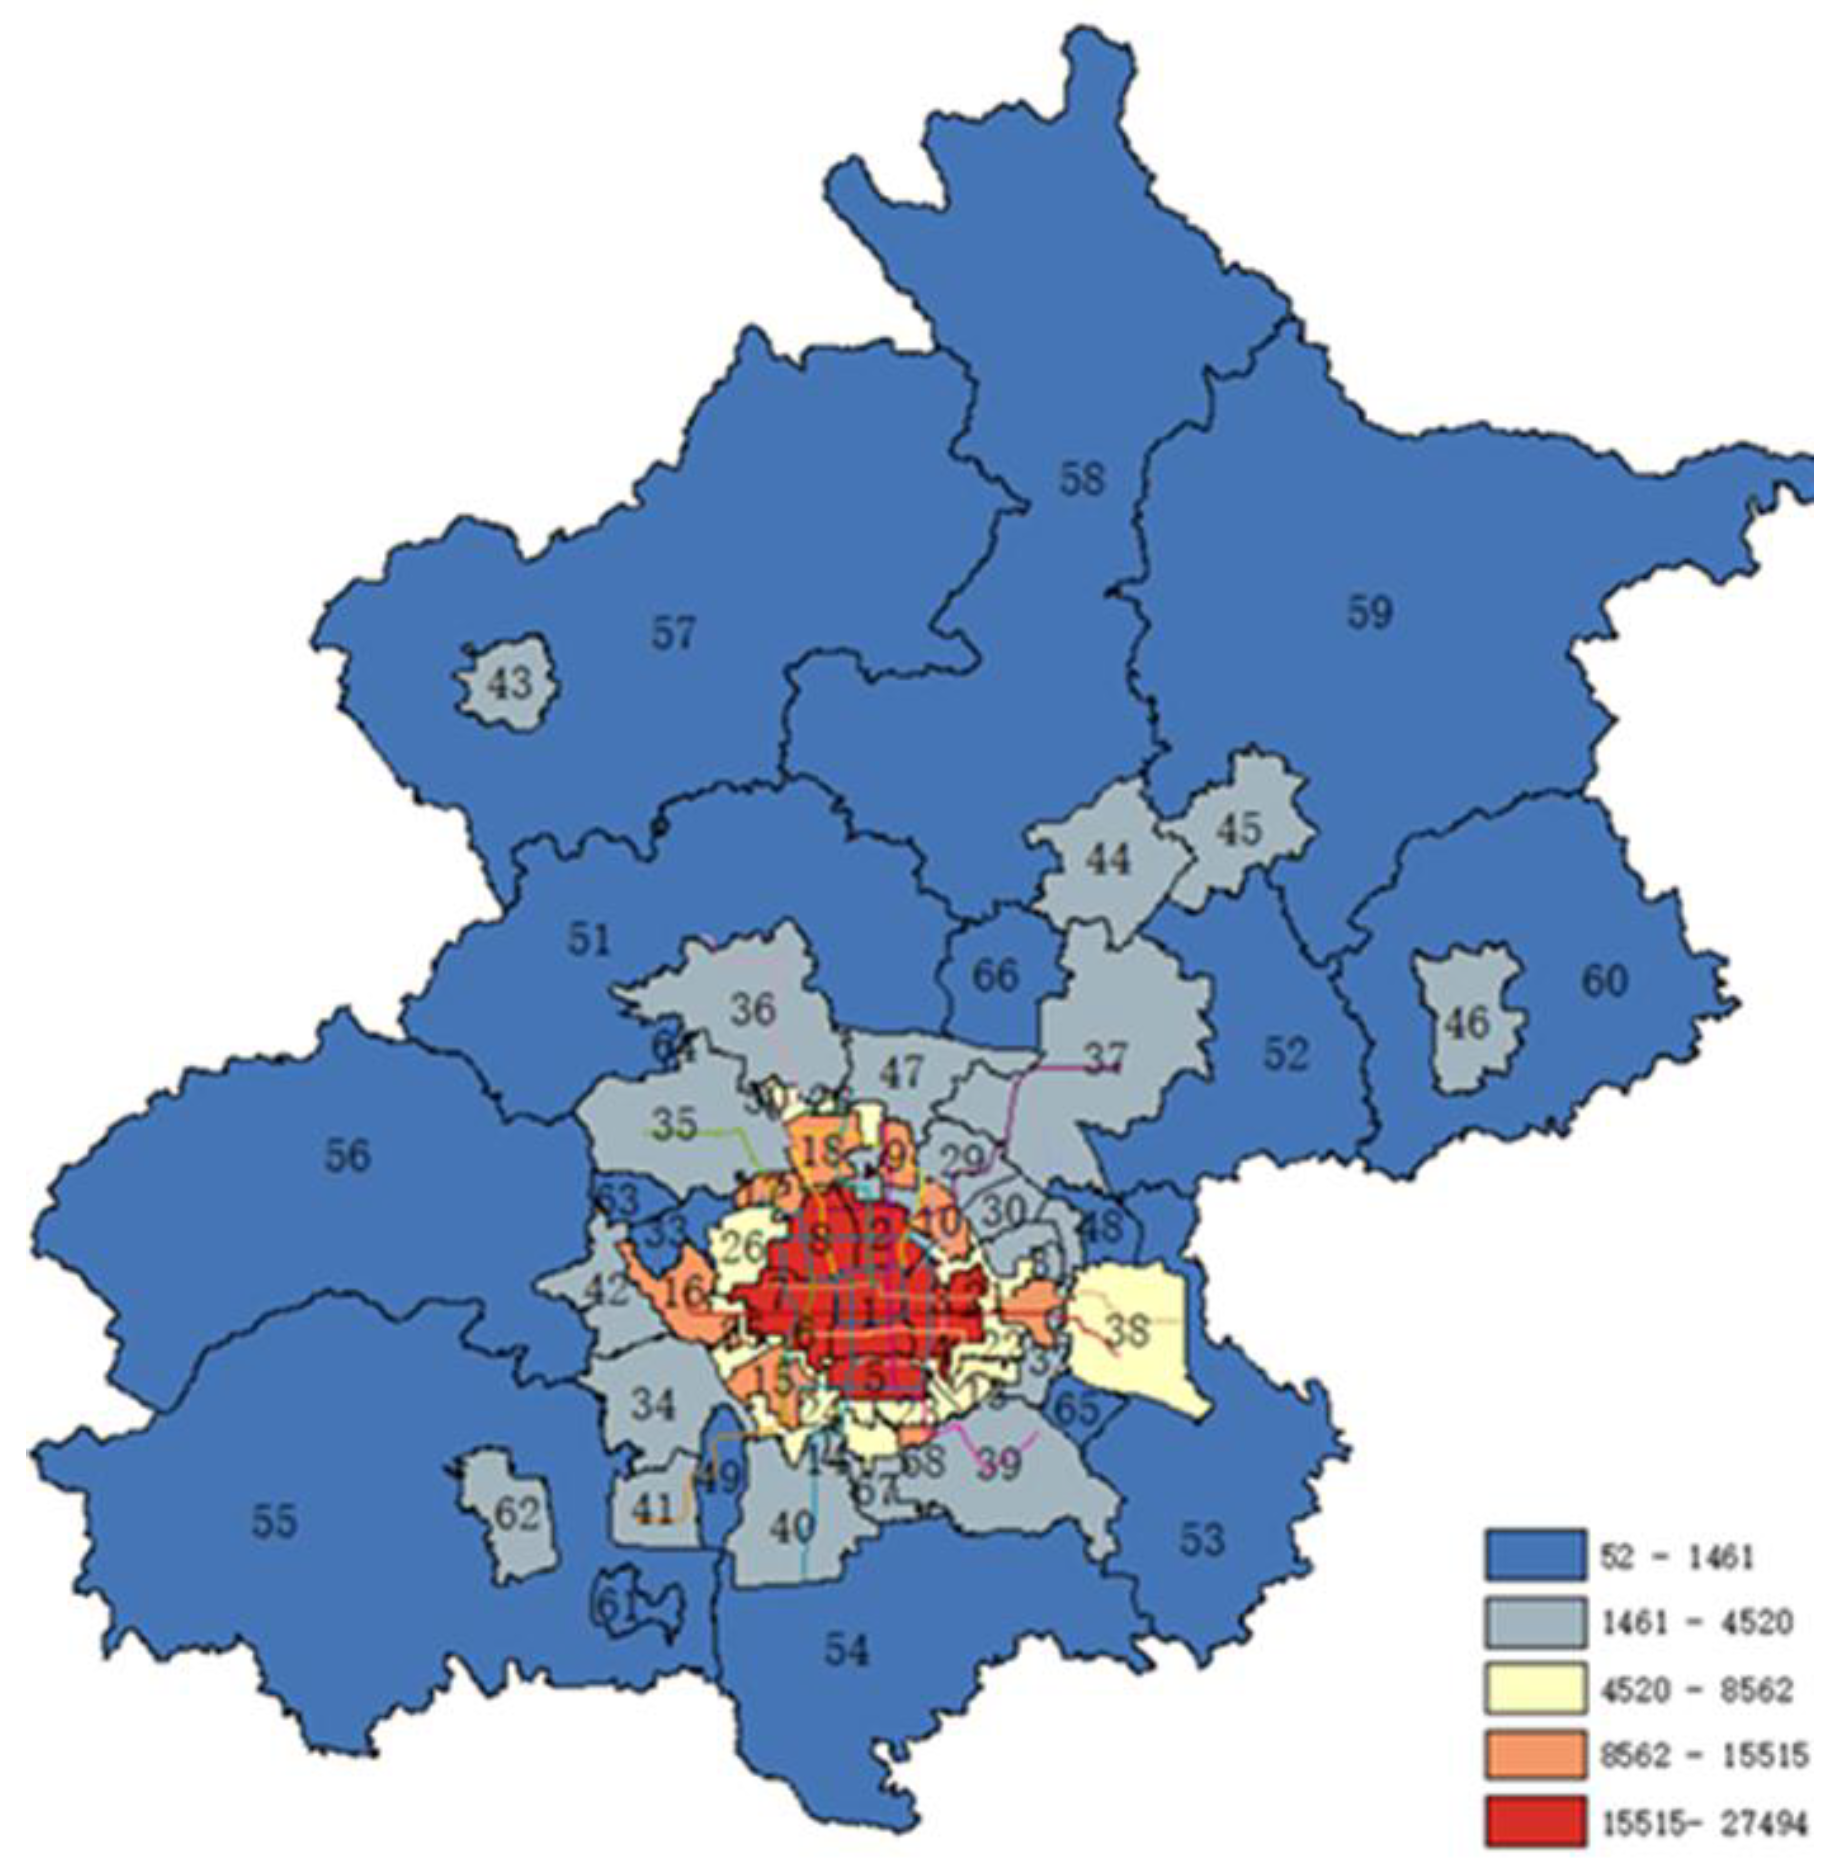
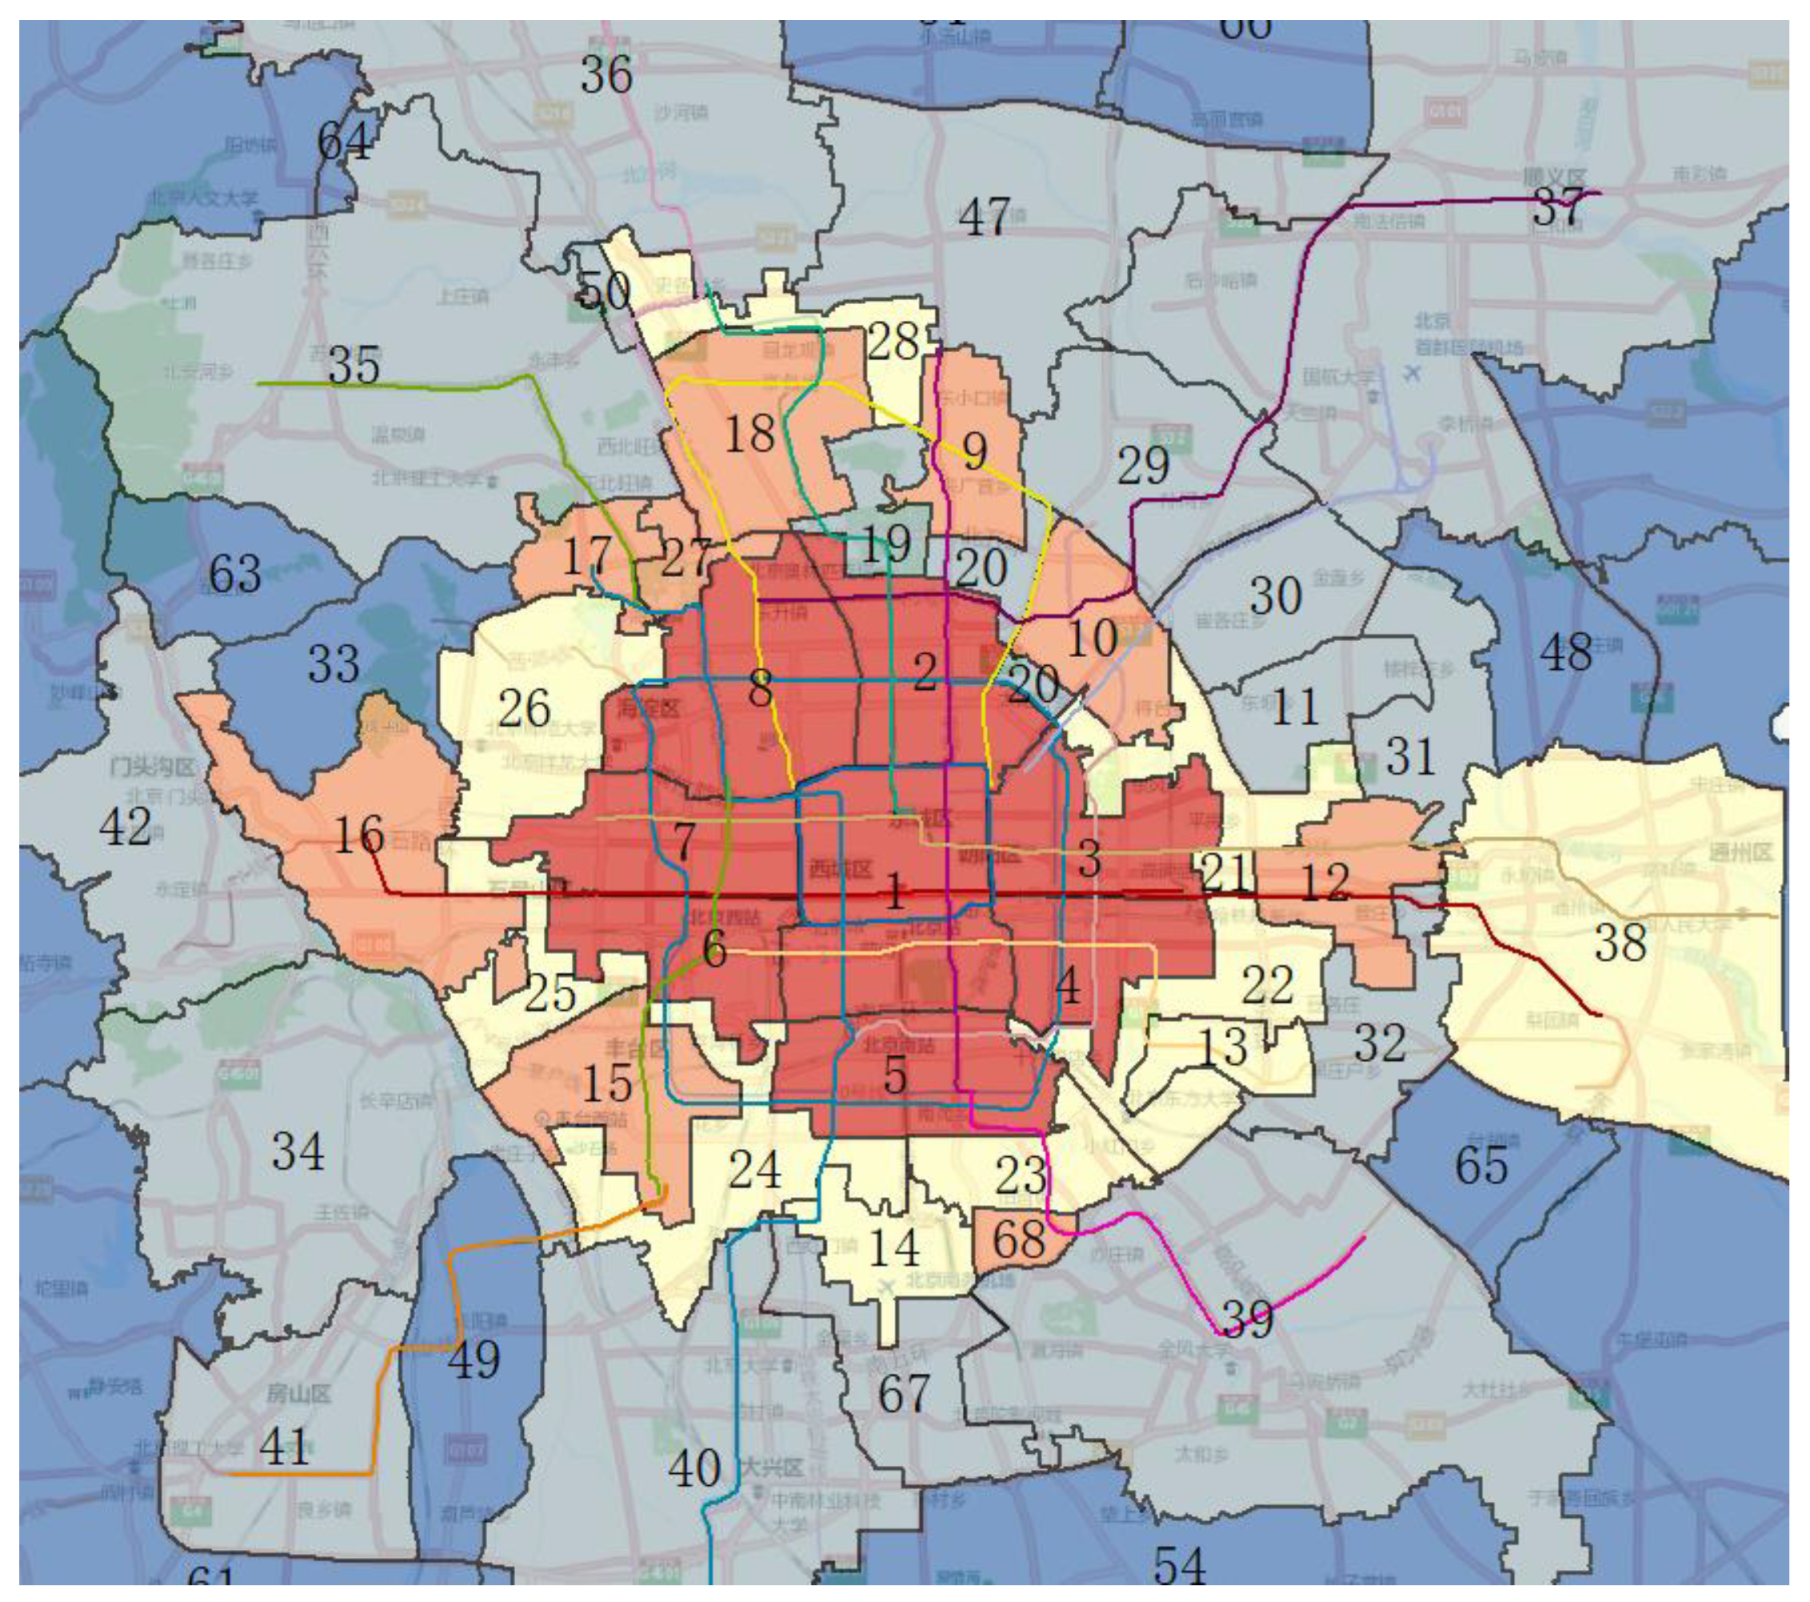
- Beijing’s population density distribution and Beijing’s geographical and administrative area boundaries;
- Counting homogenized location sets as regions, minimizing the differences within regions and maximizing the differences between regions;
- According to the distribution of Beijing’s subway and bus network, avoiding the main traffic routes (subway and urban hub) as boundary lines of the clustering area; otherwise, the traffic route would involve two or more areas, which would have been difficult to analyze;
- Some outer zones with travel > 90 min to central Beijing were merged, and some special external zones represent larger urban areas.
- The Fifth Beijing Urban Transportation Comprehensive Survey by the Beijing Transport Institute;
- The medium- and long-term development planning goals of the “Beijing Municipal Master Plan (2016–2035)”;
- The Beijing Statistical Yearbook;
- Map API navigation data;
- Open resource data on Beijing from the Lianjia and Tuba websites.
2.3. Shared Bike
2.4. Population Decentralization in Beijing
2.5. New Subway Rail Services
2.6. Fleet Electrification
2.7. The Introduction of Shared and Automated Vehicles
2.7.1. Private Automated Vehicles (PAVs)
- Automated parking and pick-up: One predicted advantage of AVs is that an individual does not need to park their vehicle; they need merely alight and be picked up directly at their destination. This can be turned on or off and set at 4 levels from low (25% reduction in access/egress time from a base of 7 min) to full (100% reduction in access/egress time).
- Road capacity: It is expected that, as the AV fleet grows, the road capacity may increase (as AVs can travel closer together). If a capacity effect is implemented, then this can either be linear or progressive [41].
- Effect on value of in-vehicle time: In a level 5 AV, driving tasks and concentration are no longer required. This not only makes the journey a more pleasurable experience but also frees up time for other activities, thus increasing the utility of the time spent in the vehicle. Based on [42], if such an effect is included in a scenario, then this can be set at 5–100% reduction levels in the in-vehicle time contribution to the friction factor.
2.7.2. Taxis and Shared Autonomous Vehicles (SAVs)
2.8. Calibration
3. Results and Discussion
3.1. Impacts of the Beijing Master Plan on Overall Modal Share
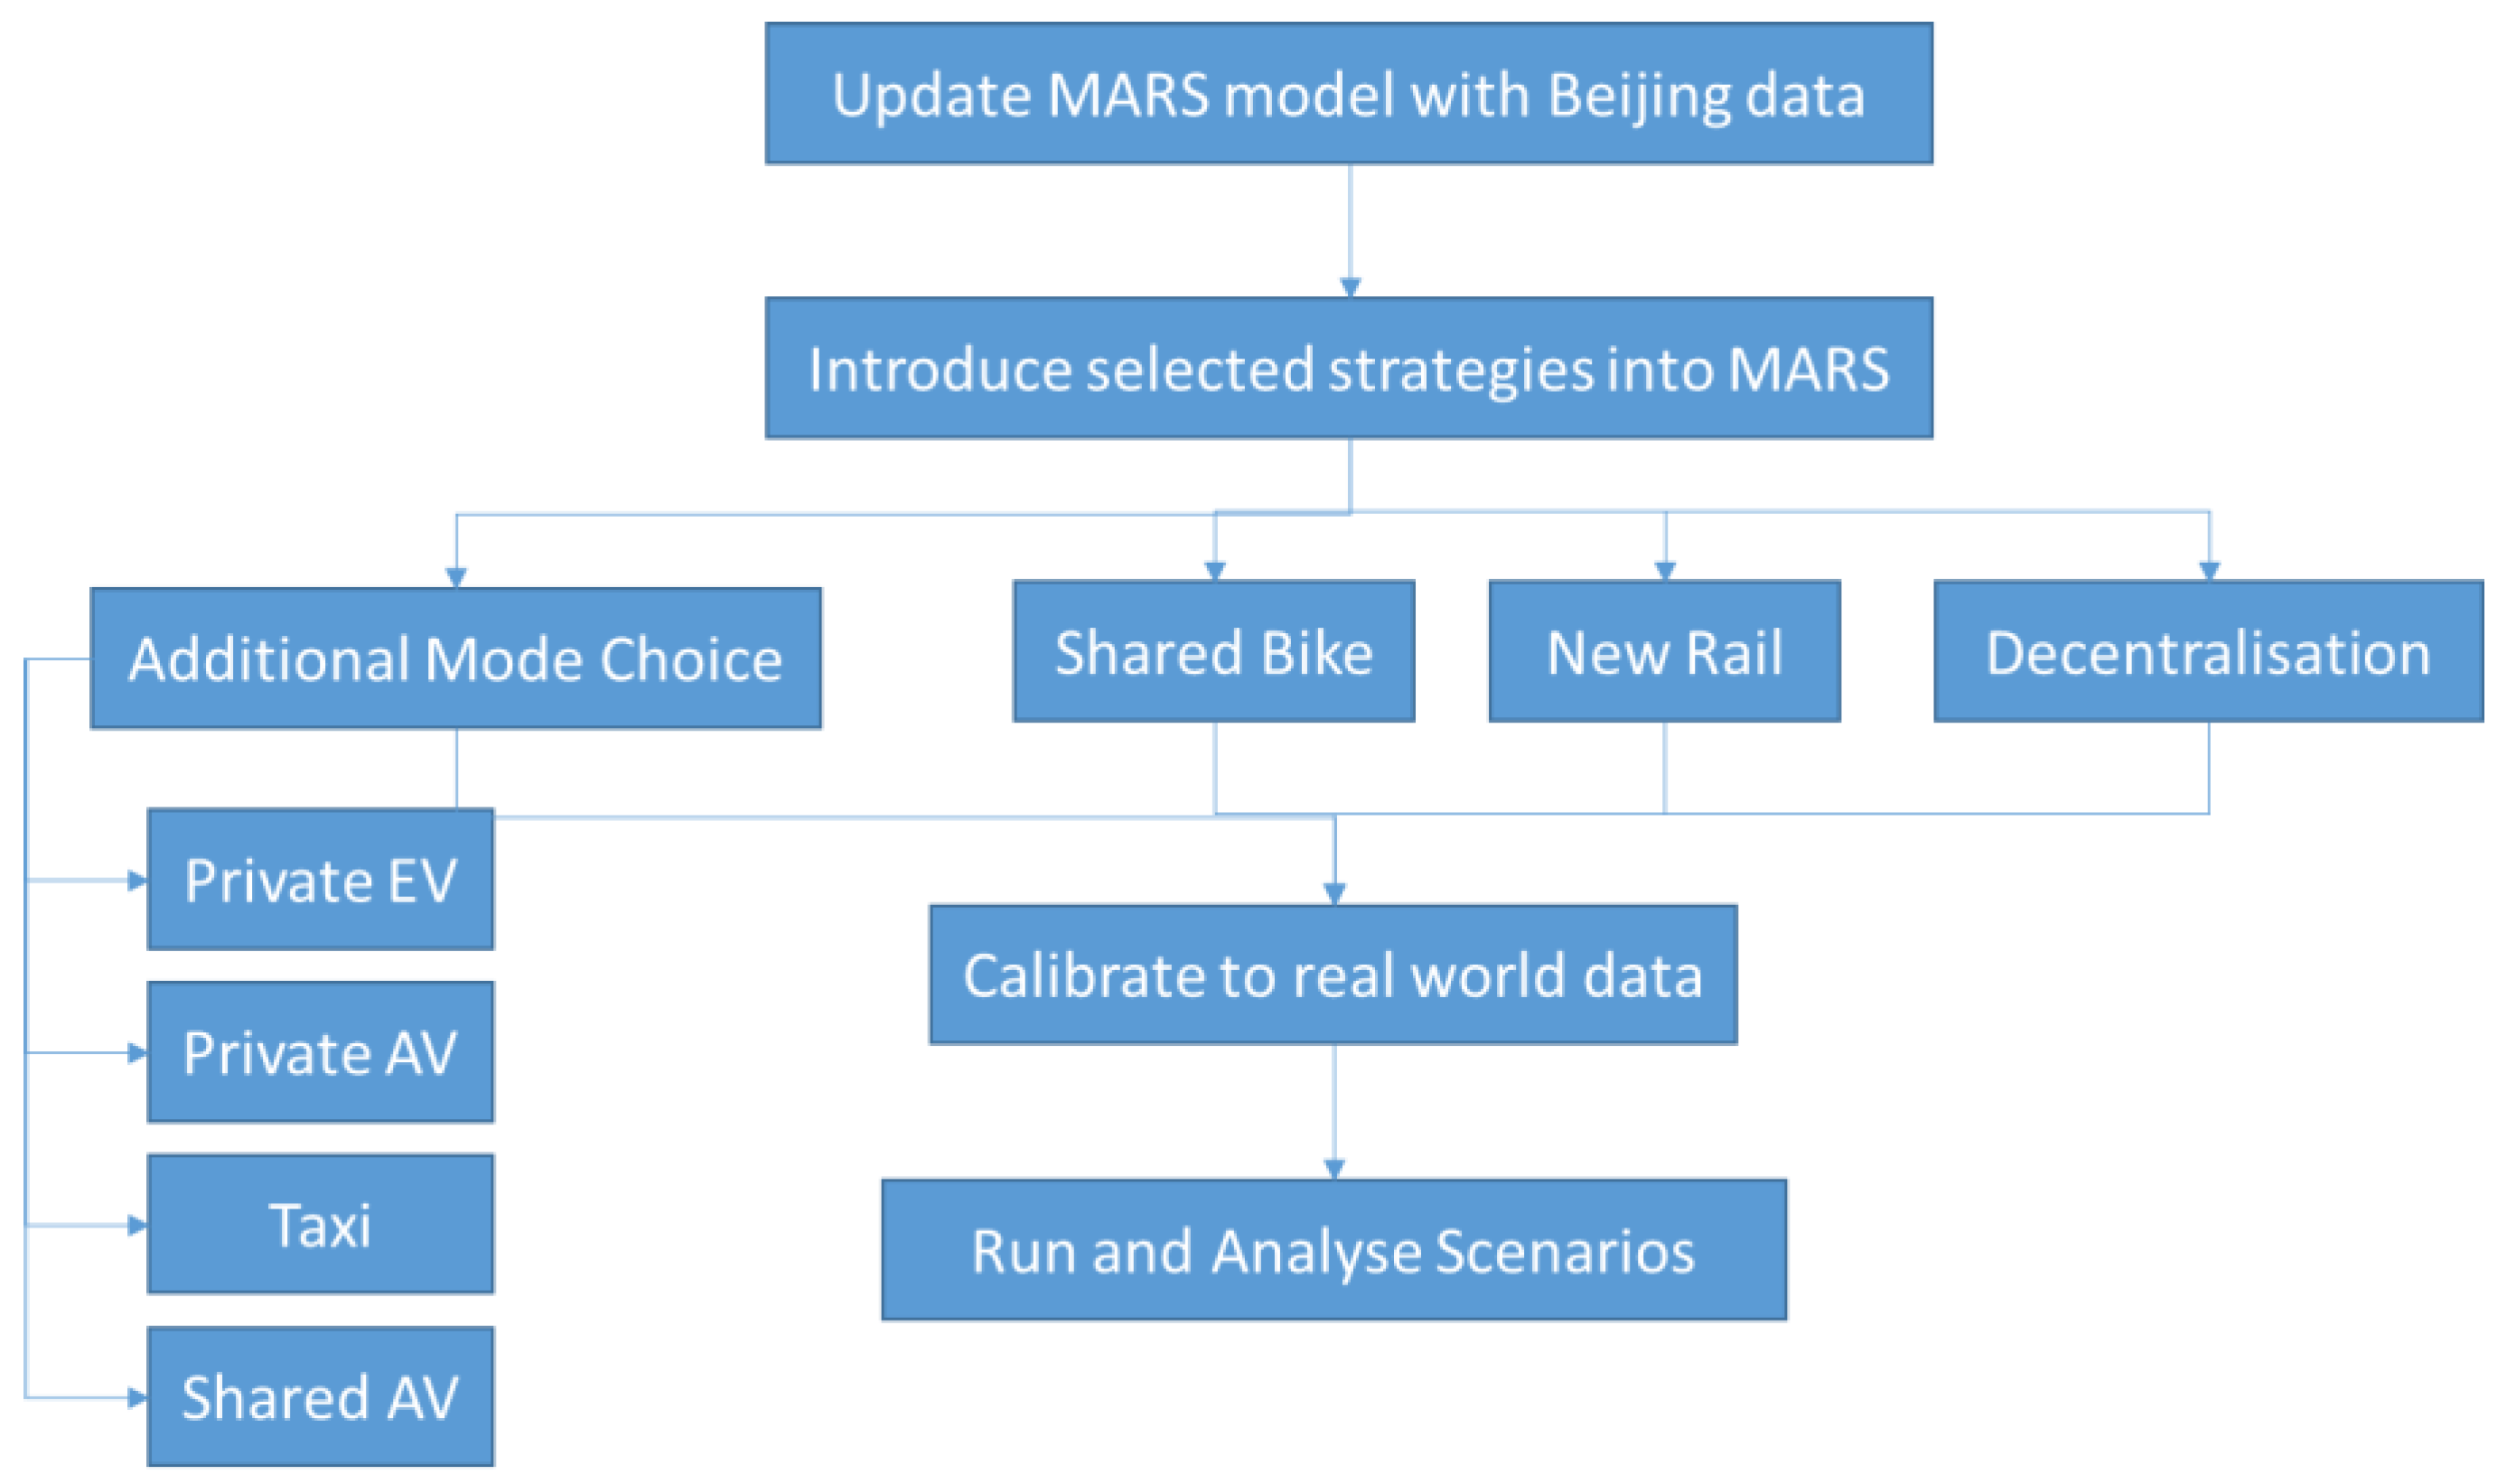
- Business as Usual (BAU) Base: For business as usual, according to the Beijing Master Plan, which includes the decentralization policy, the introduction of new rail lines and shared bikes, and an increase in EV ownership, we did not include PAV or SAV in this, as there were currently no specific plans within the Beijing Master Plan
- Do Nothing: This scenario has no movement between zones, no new rail lines, no shared bike services, no fleet electrification and no adoption of PAV or SAV.
- No Land Use Change: As the base, but assuming no decentralization policy and no movement of either residents or workplaces between zones
- No New Rail: As the base, but no new rail lines were introduced as planned—only those in place in 2014 were considered
- No Shared Bike: As the base, but the shared bike service as a feeder to rail stations (affecting access/egress times) was not introduced (shared bikes improve friction factors for rail but do not affect bike friction factors).
- No EV: As the base, but electric vehicles were not introduced.
3.2. Impacts of the Beijing Master Plan on Rail Share in Specific Zones
- Land Use only: Only the decentralization policy was introduced.
- New Rail only: Only the new rail lines were introduced.
- Shared bike only: Only the shared bike service as a feeder to rail stations was introduced (shared bikes improve friction factors for rail but do not affect bike friction factors).
- New Rail and Shared Bike: Only the new rail lines and shared bike services were introduced.
- EV only: Only electric vehicles were introduced.
3.3. The Introduction of Autonomous and Shared Vehicles
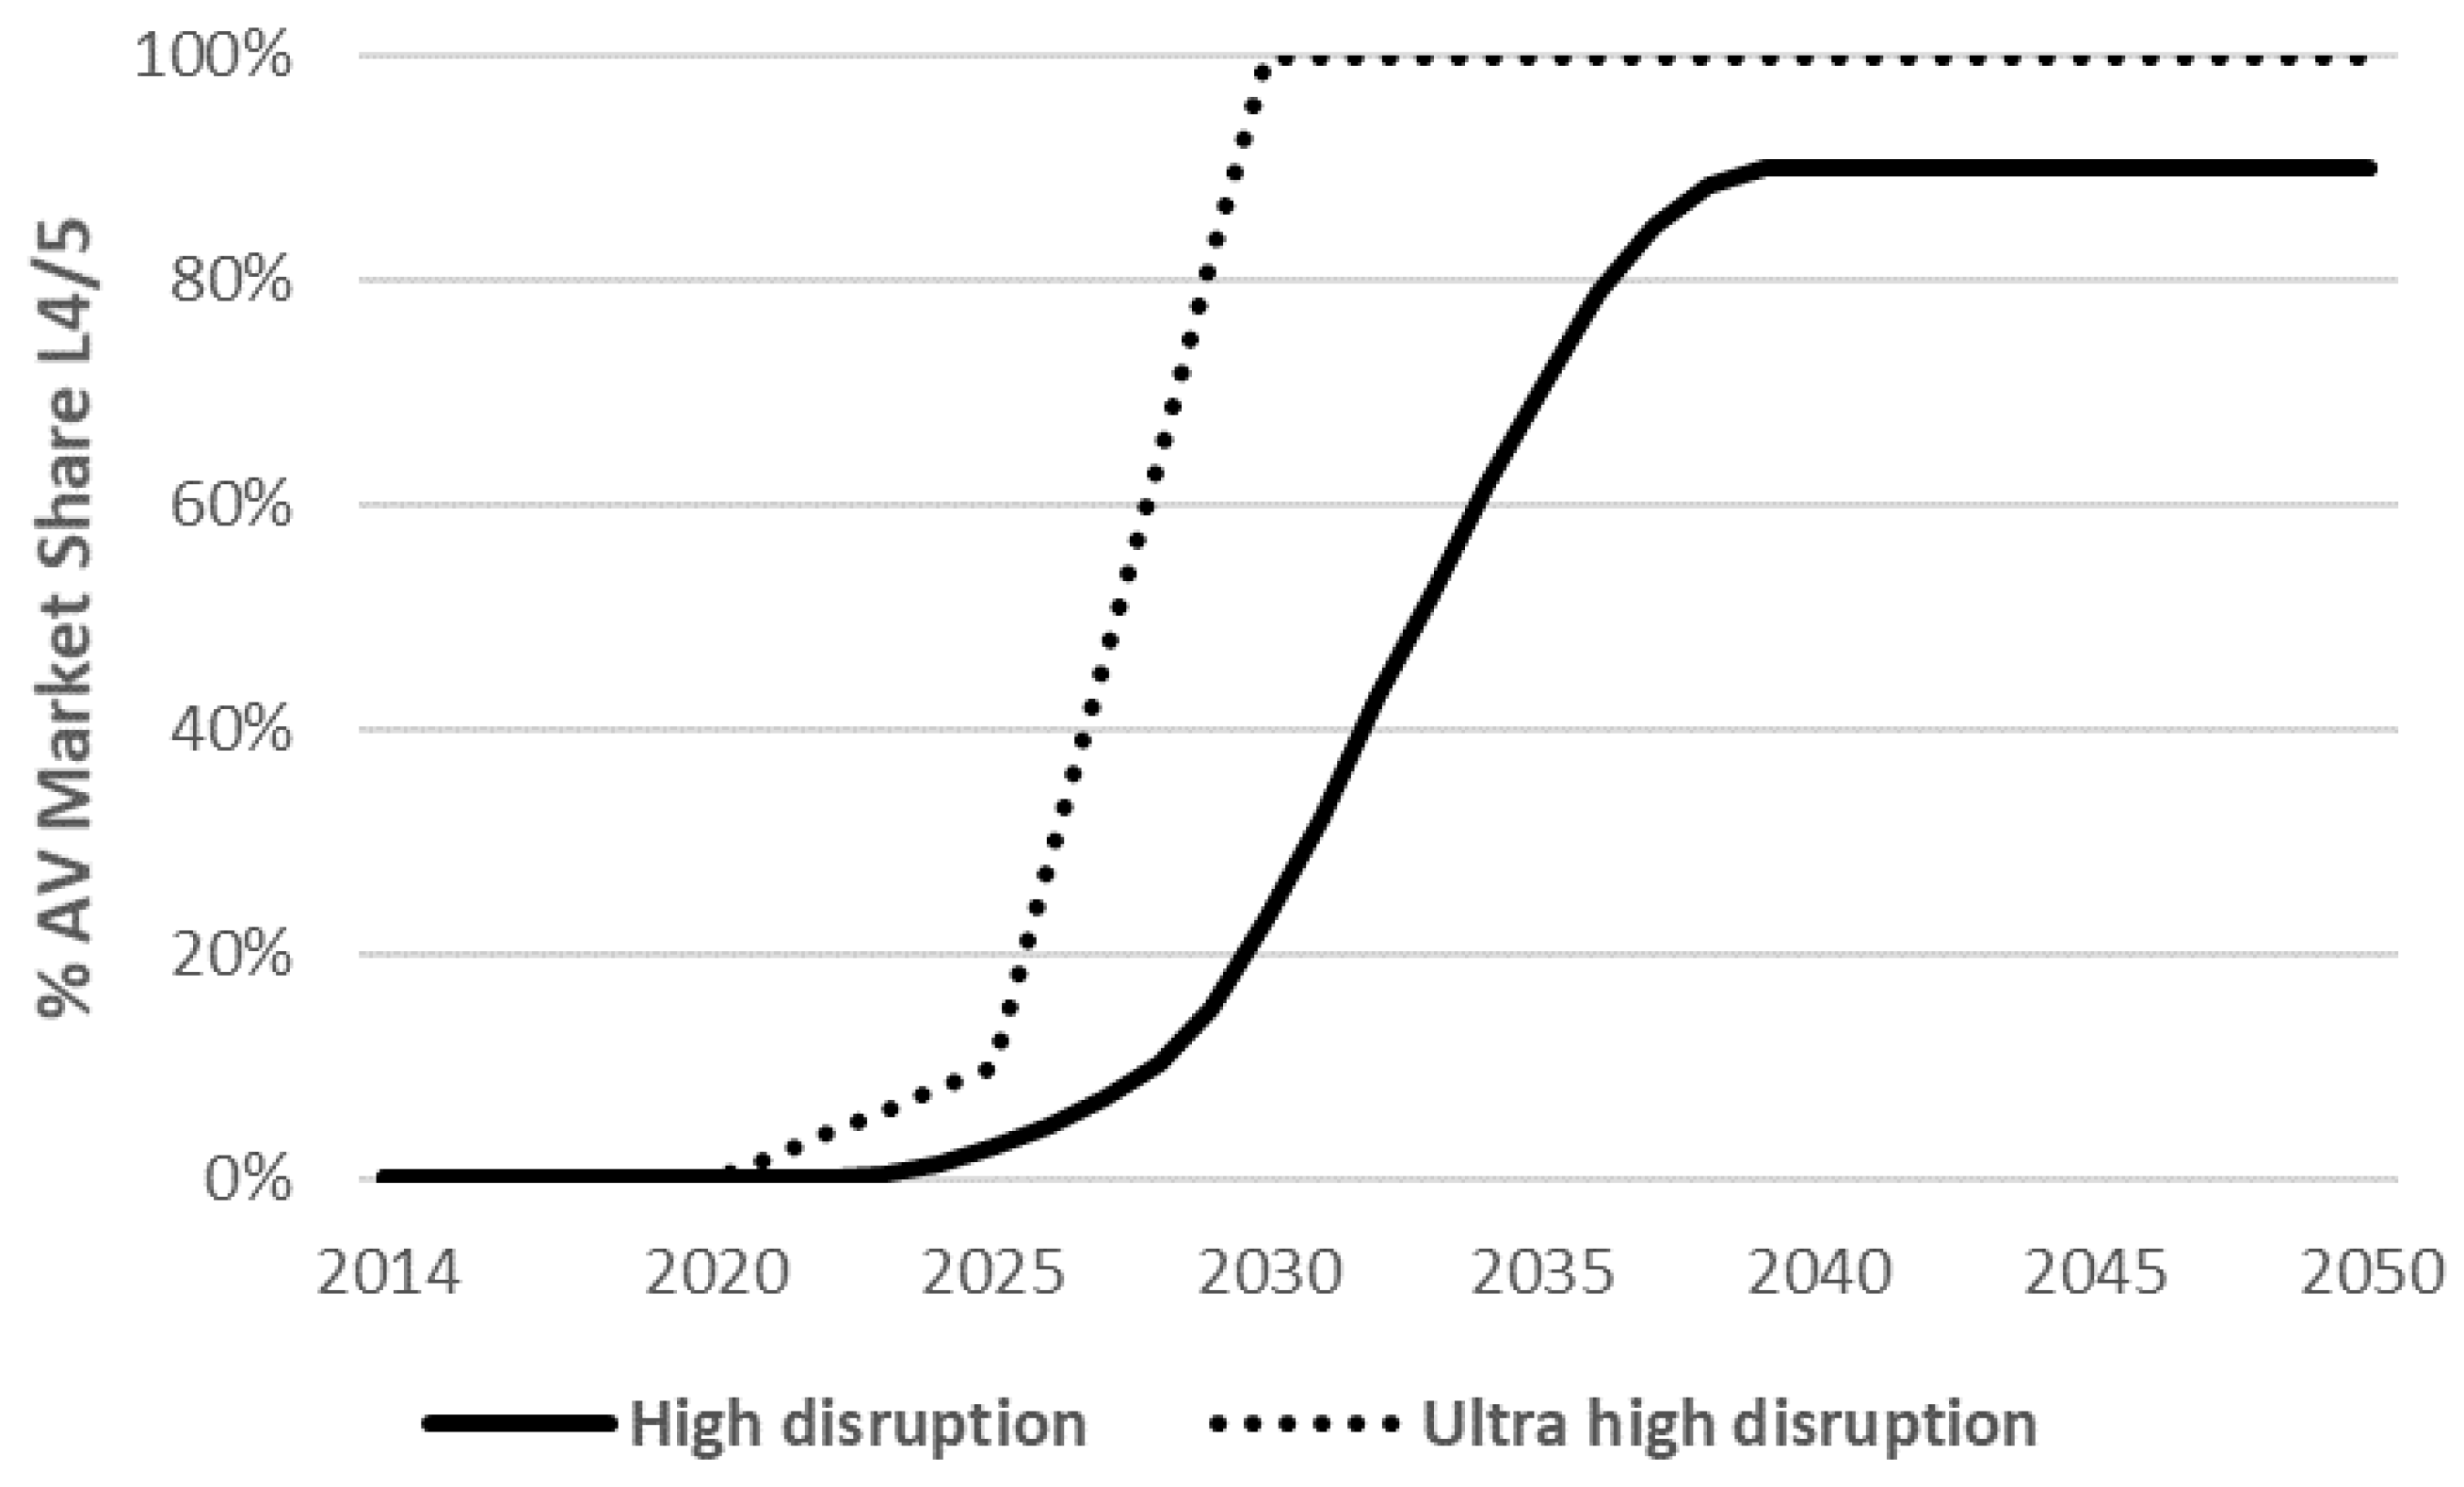
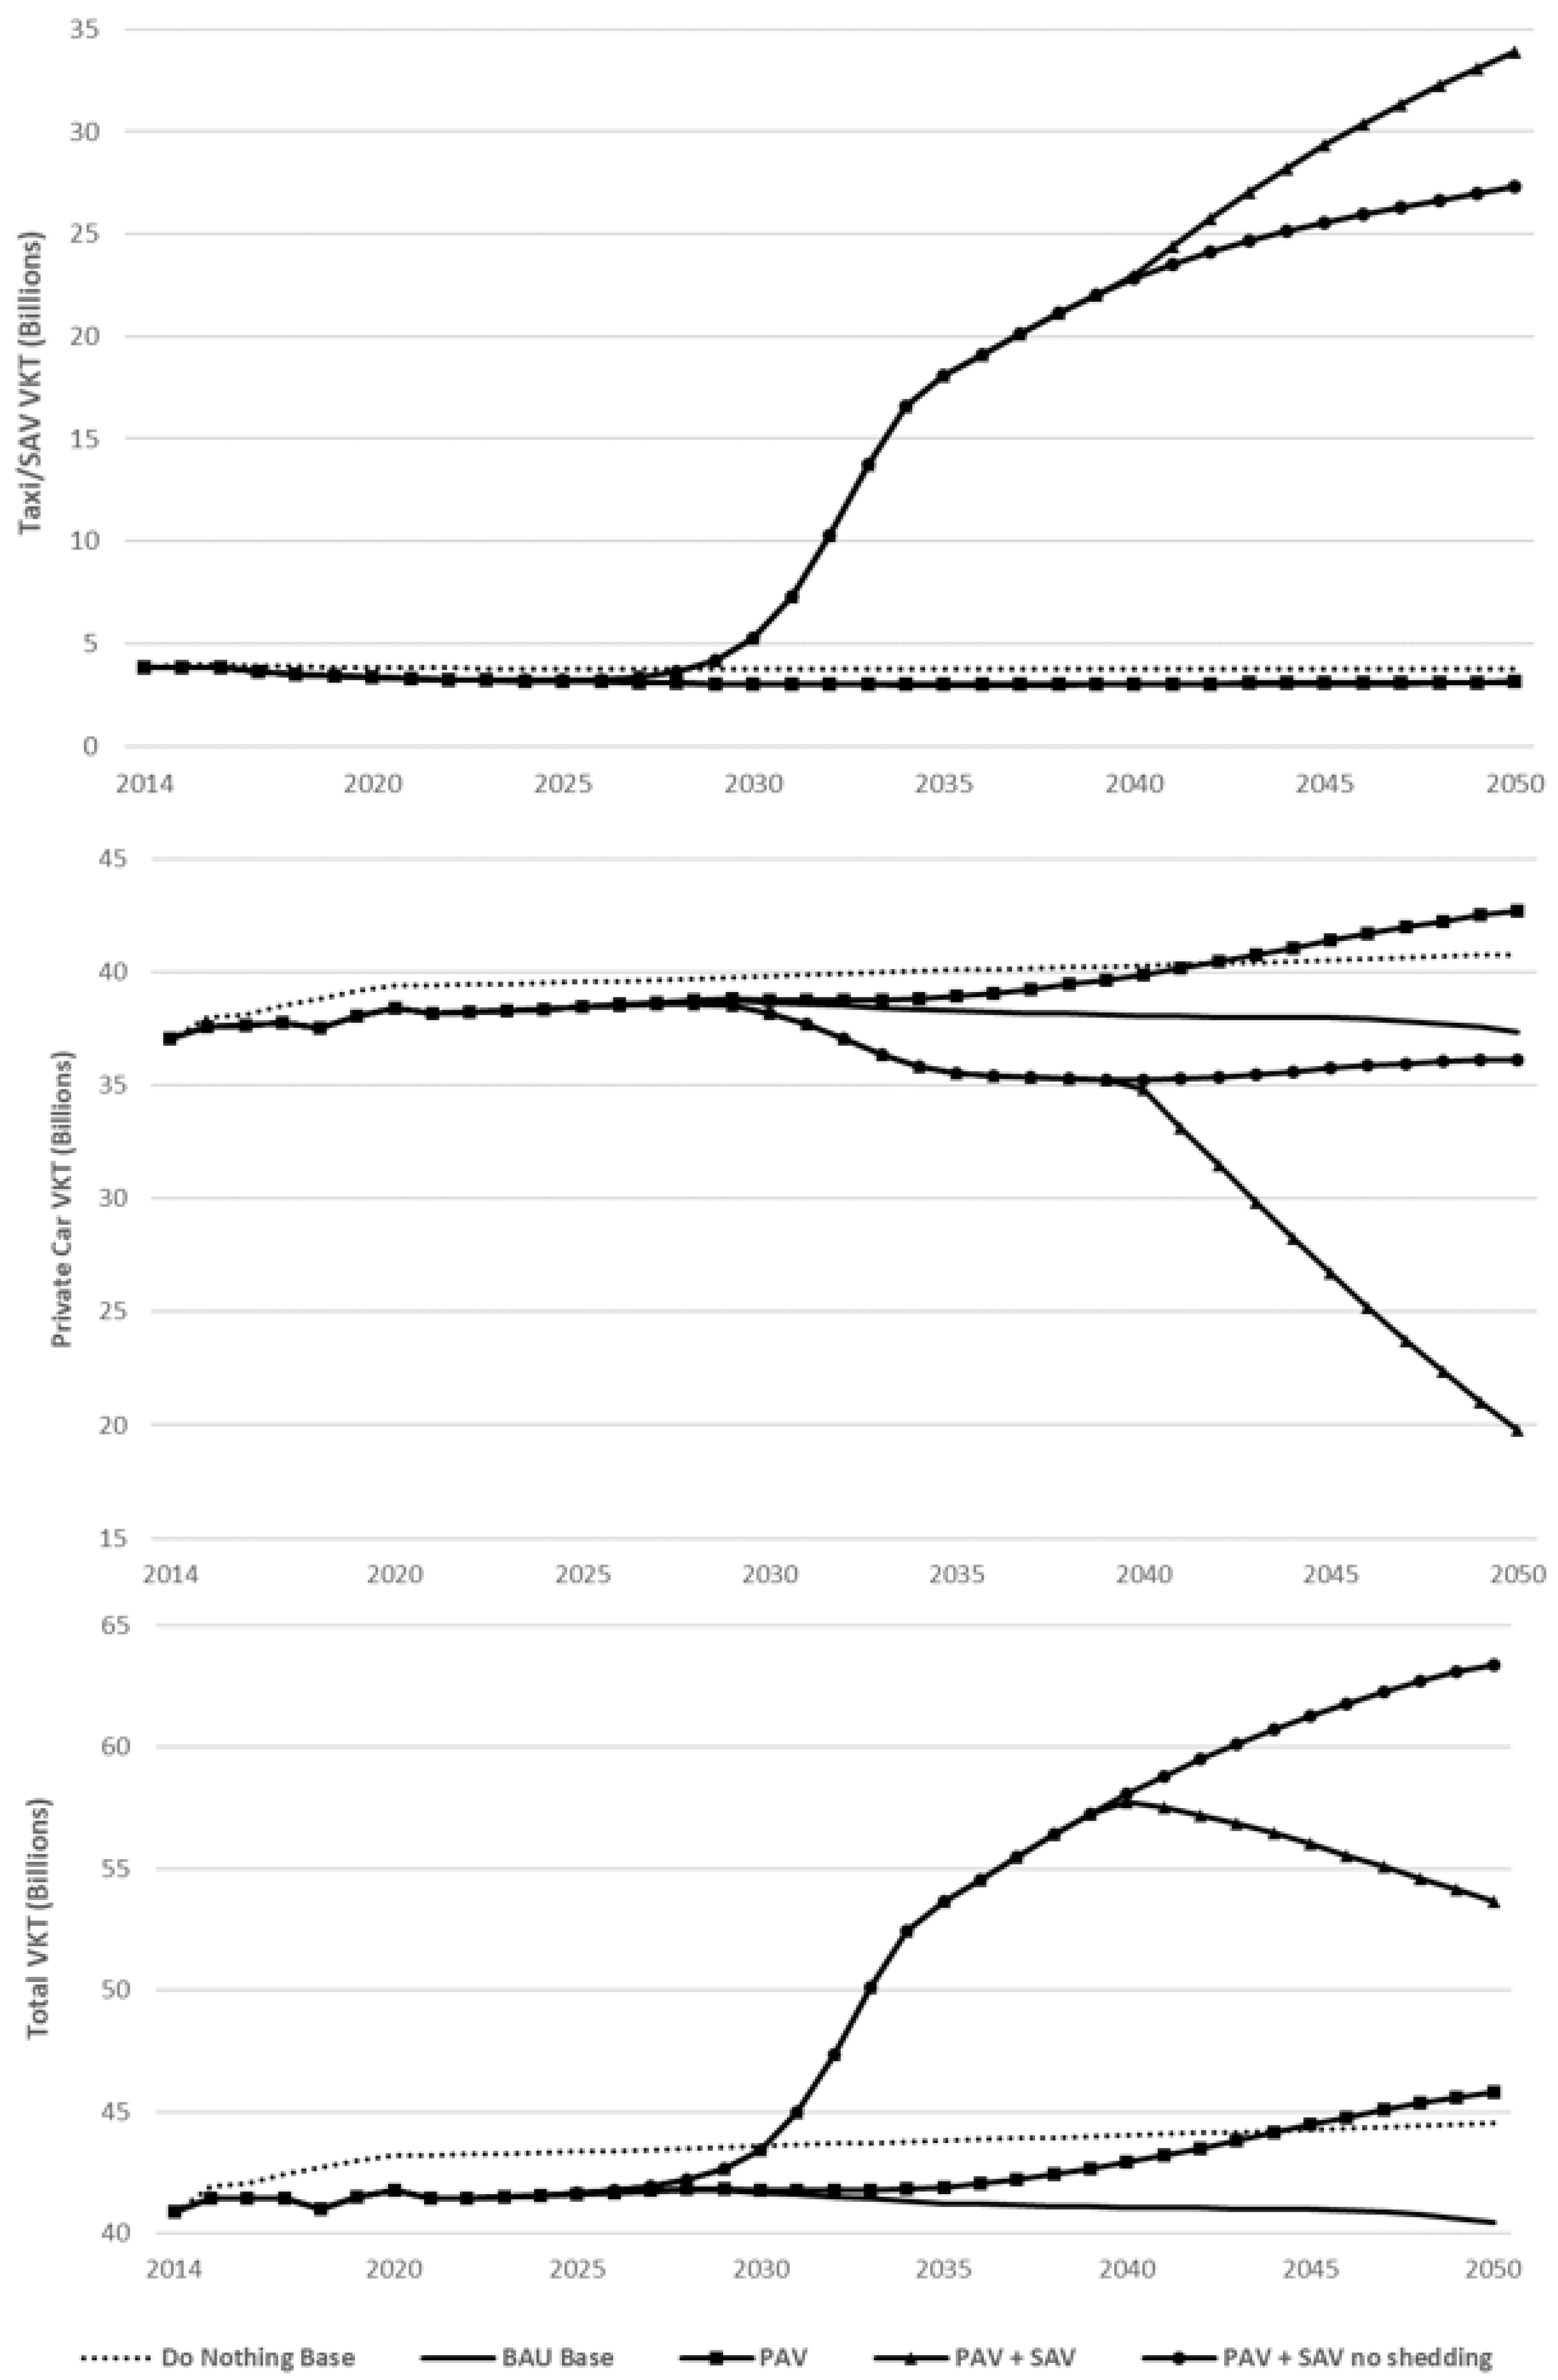
- PAV: As the base but with the introduction of automated vehicles (assuming a high-disruption scenario, with a high impact on access/egress times, a linear impact on road capacity and a medium effect on in-vehicle value of time).
- PAV + SAV: As PAV but including the introduction of shared AVs within the taxi fleet and associated car shedding.
- PAV + SAV (no shedding): As PAV + SAV but without car shedding.
3.3.1. Impact on VKT
3.3.2. Sensitivity to AV Assumptions
3.3.3. Sensitivity to Car Shedding Assumptions
- The threshold of the L5 PAV share at which shedding takes effect;
- The portion of the SAV trip share that would be shed;
- The portion of the non-SAV trip share that would be shed.
4. Conclusions
- The decentralization of the population to the outer regions of Beijing may be successful in reducing the overall share of private car trips, though many people are effectively displaced from central zones into outer zones. Alongside this, however, decentralization could also reduce public transport use as the average trip length increases (especially in the outer zones), but it may increase active travel in some zones. Thus, any benefits for central zones may be outweighed by an overall reduction in sustainability across the whole city region, which should be considered at the planning stage, as it would suggest that better integration between all public and active transport could prevent shifts towards private cars. This observation depends on the model’s assumption that travel behavior (including car ownership) changes when the population moves to new zones, but a more nuanced understanding of whether and how people change their behavior should be sought in future work. Although affecting population movement may be hard with other cities, these findings on consequences and sensitivities are relevant to urban development planning.
- Most major cities are considering the construction and promotion of some form of mass rapid transport system. In our study, the impact of new rail lines was limited to zones where new rail was introduced. If the purpose of policy is to increase rail use across all city regions, then other, more holistic policies that account for needs and diversity in every zone should be considered. Furthermore, investments should be integrated with other strategies, such as decentralization, to ensure that higher shares are obtained for rail in the larger, less dense outer zones; otherwise, we would lose rail share to other modes due to longer access and journey times compared to central zones.
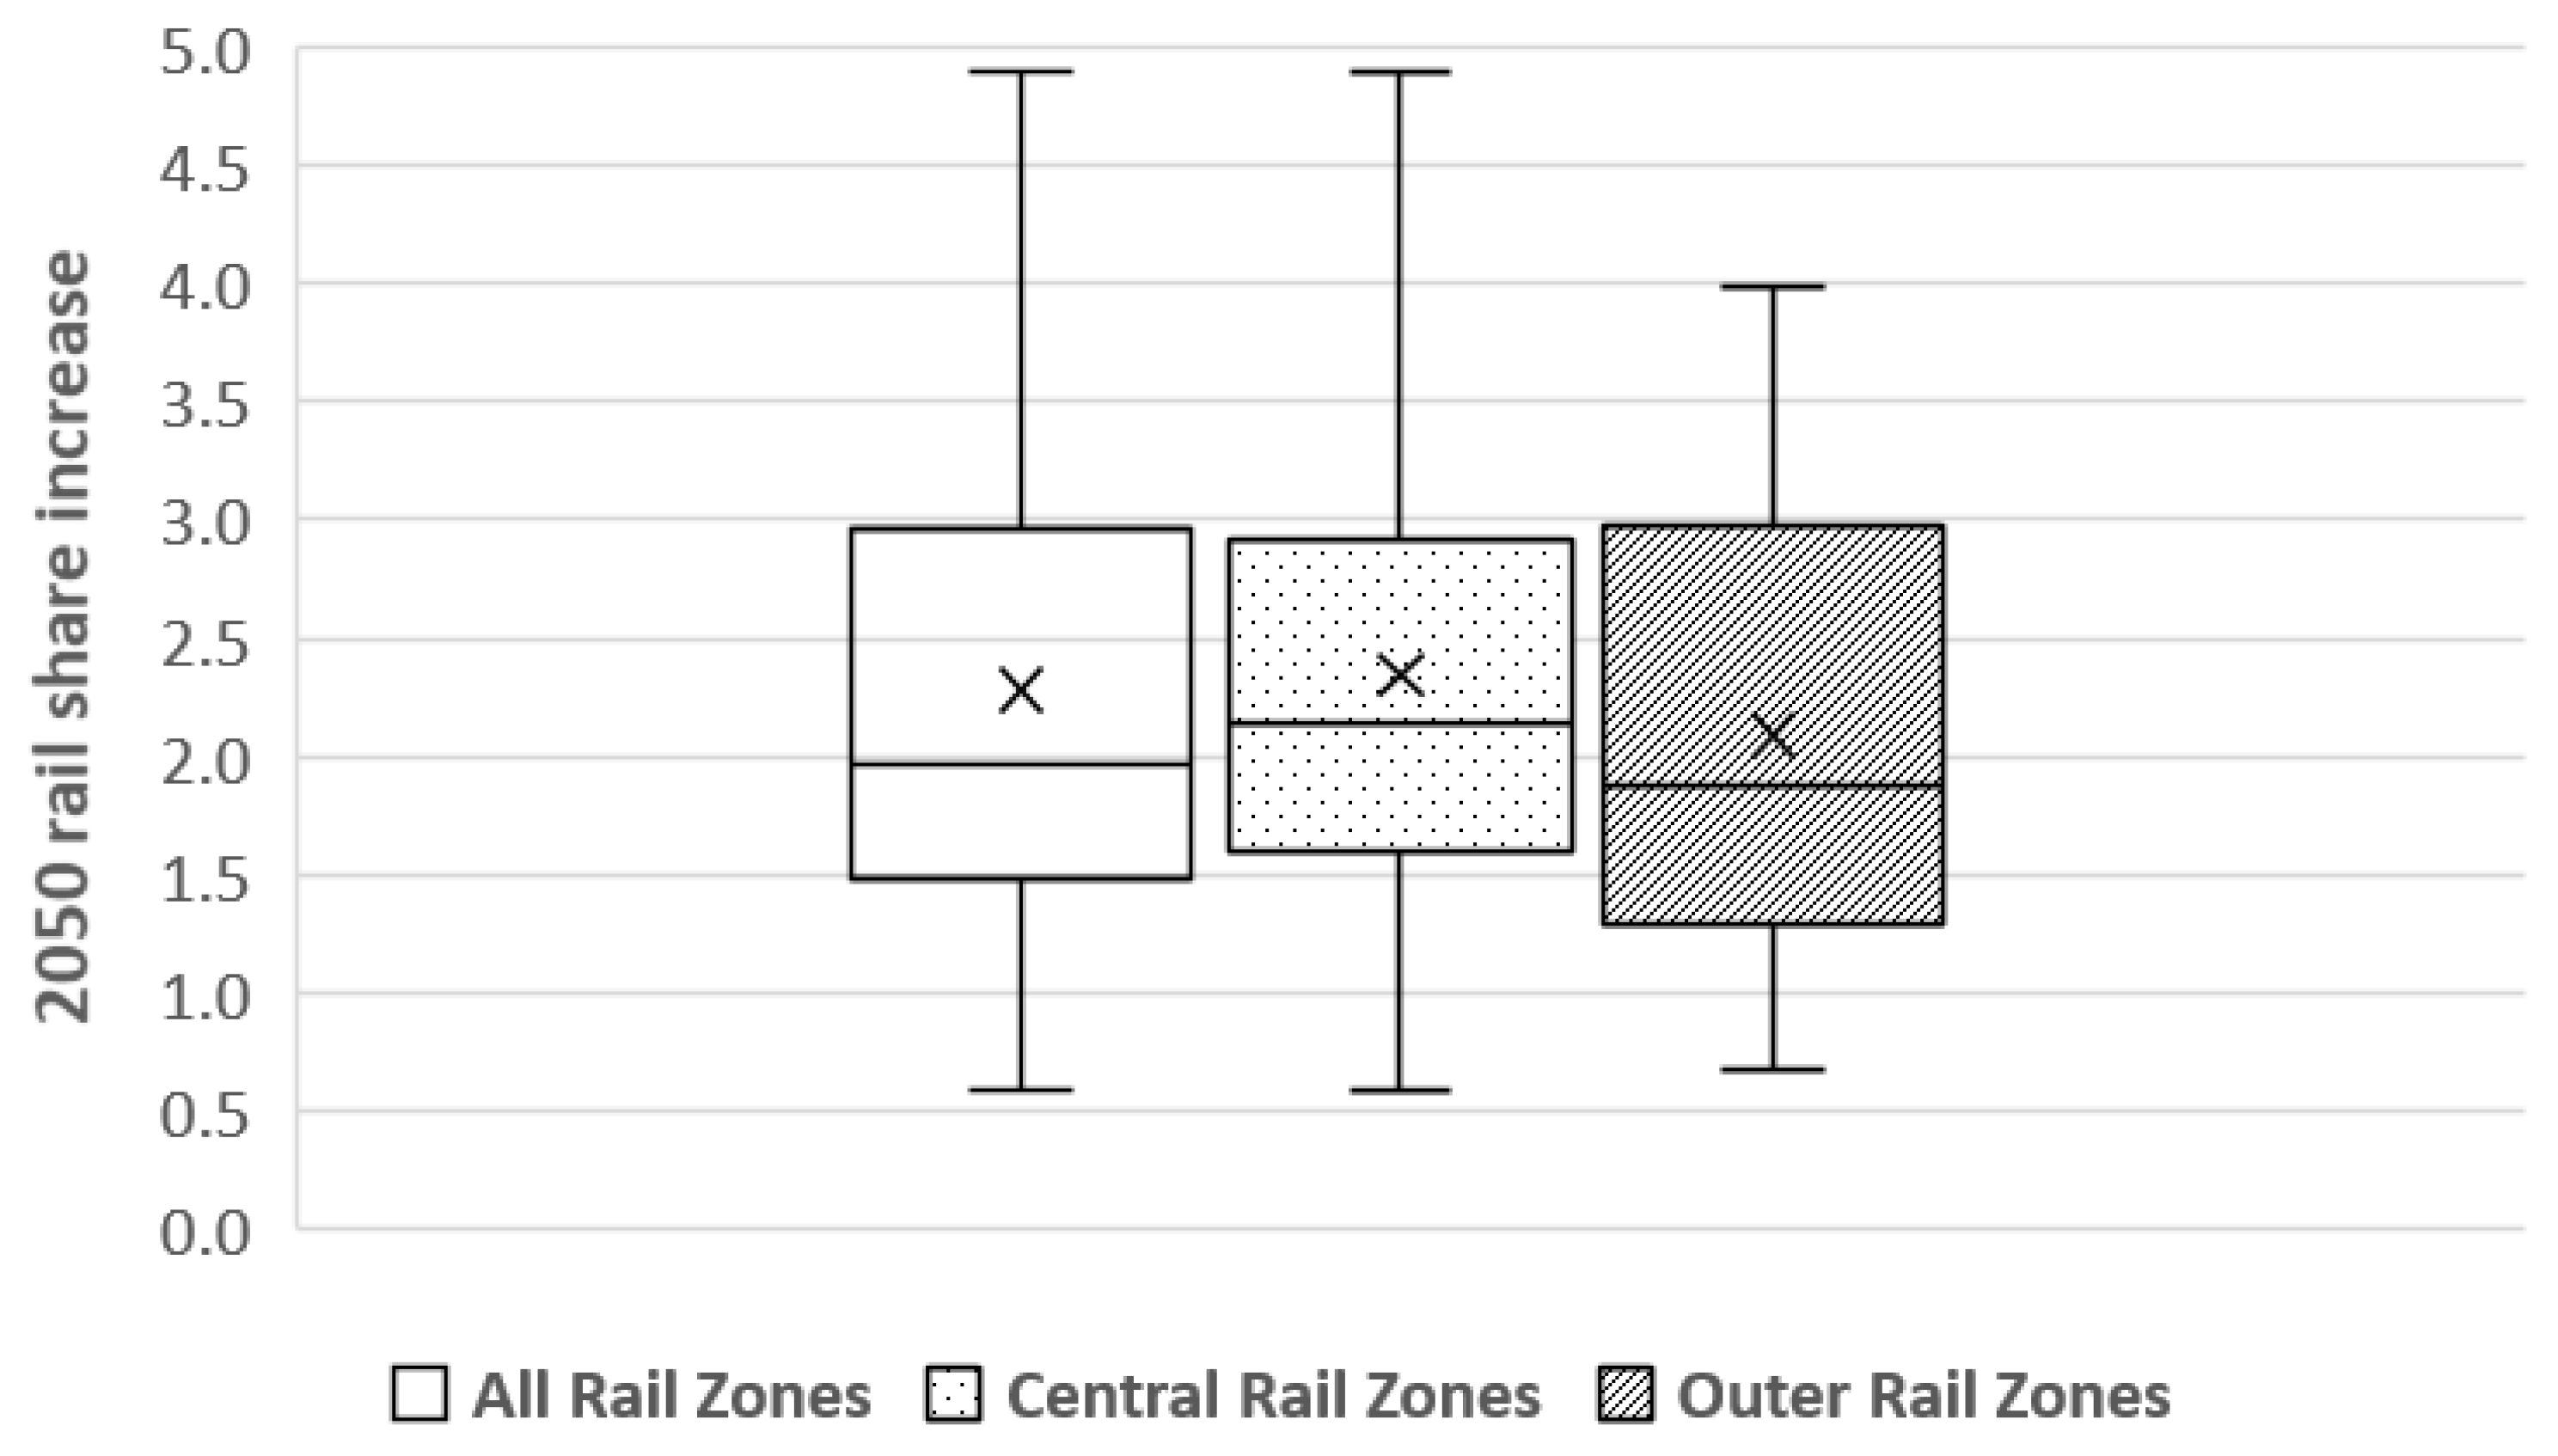
- Among the increasing research into policies for active travel modes, there is a limited understanding and increased interest in the impact of shared micro-mobility in multi-modal journeys. The introduction of a shared bike service (as a rail feeder system) in Beijing increases the rail share by around 2% on average across all zones with rail connections. Although this may seem limited, the benefits here are not only the increase in rail share but also the public health benefits from the additional active travel (not captured in our model). The impact is more limited in outer zones with generally longer access distances to stations, where the time savings gained have a marginal benefit, meaning that other methods to improve station access may be required (such as integrated bus services or shared AVs). In smaller cities, these impacts may not be as disparate.
- Although the mandated electrification of the private car fleet would successfully lead to a significant reduction in tailpipe emissions (with air pollution benefits), the attraction of EVs compared to ICEVs would lead to a higher private car mode share than the scenario without electrification, which is mainly taken from active modes. Such trends could be replicated in cities that focus on the introduction of low- or zero-emission zones. This not only has the potential to create congestion issues and related system inefficiencies but also, the corresponding reduction in active travel would have public health implications. Furthermore, although EVs have no tailpipe emissions, the energy requirements, downstream emissions and local emissions related to tires and breaks remain a significant concern.
- Shared and automated mobility is gaining increased attention across the world. In our study, it could increase the (effective) private car trip share up to 43% (PAVs + SAVs without shedding) with a corresponding increase in VKT of 60%. This would, clearly, have significant implications for sustainability and livability, reducing the active and public transport share by 24%. As we had a conservative assumption that, once cars are shed, other modes can be chosen in lieu of private car trips, even with car shedding in place, the car trip share can remain very high. As a result, not only would the option of SAVs critically require some corresponding imposed car shedding (and possibly ride sharing) but also the business model for SAV trips would need to be tailored in a way that would prioritize active and public transport. This could be similar to the current car ownership restriction and taxi fleet control policies in Beijing, suggesting that an approach taken in other regions could be to adopt stricter fleet control (either by restricting the fleet size or through pricing mechanisms) to avoid a shift from more sustainable transport modes and encourage car shedding. Innovative concepts such as 15-min cities and low-traffic neighborhoods could lead to similar outcomes.
Author Contributions
Funding
Data Availability Statement
Conflicts of Interest
Appendix A
Appendix B
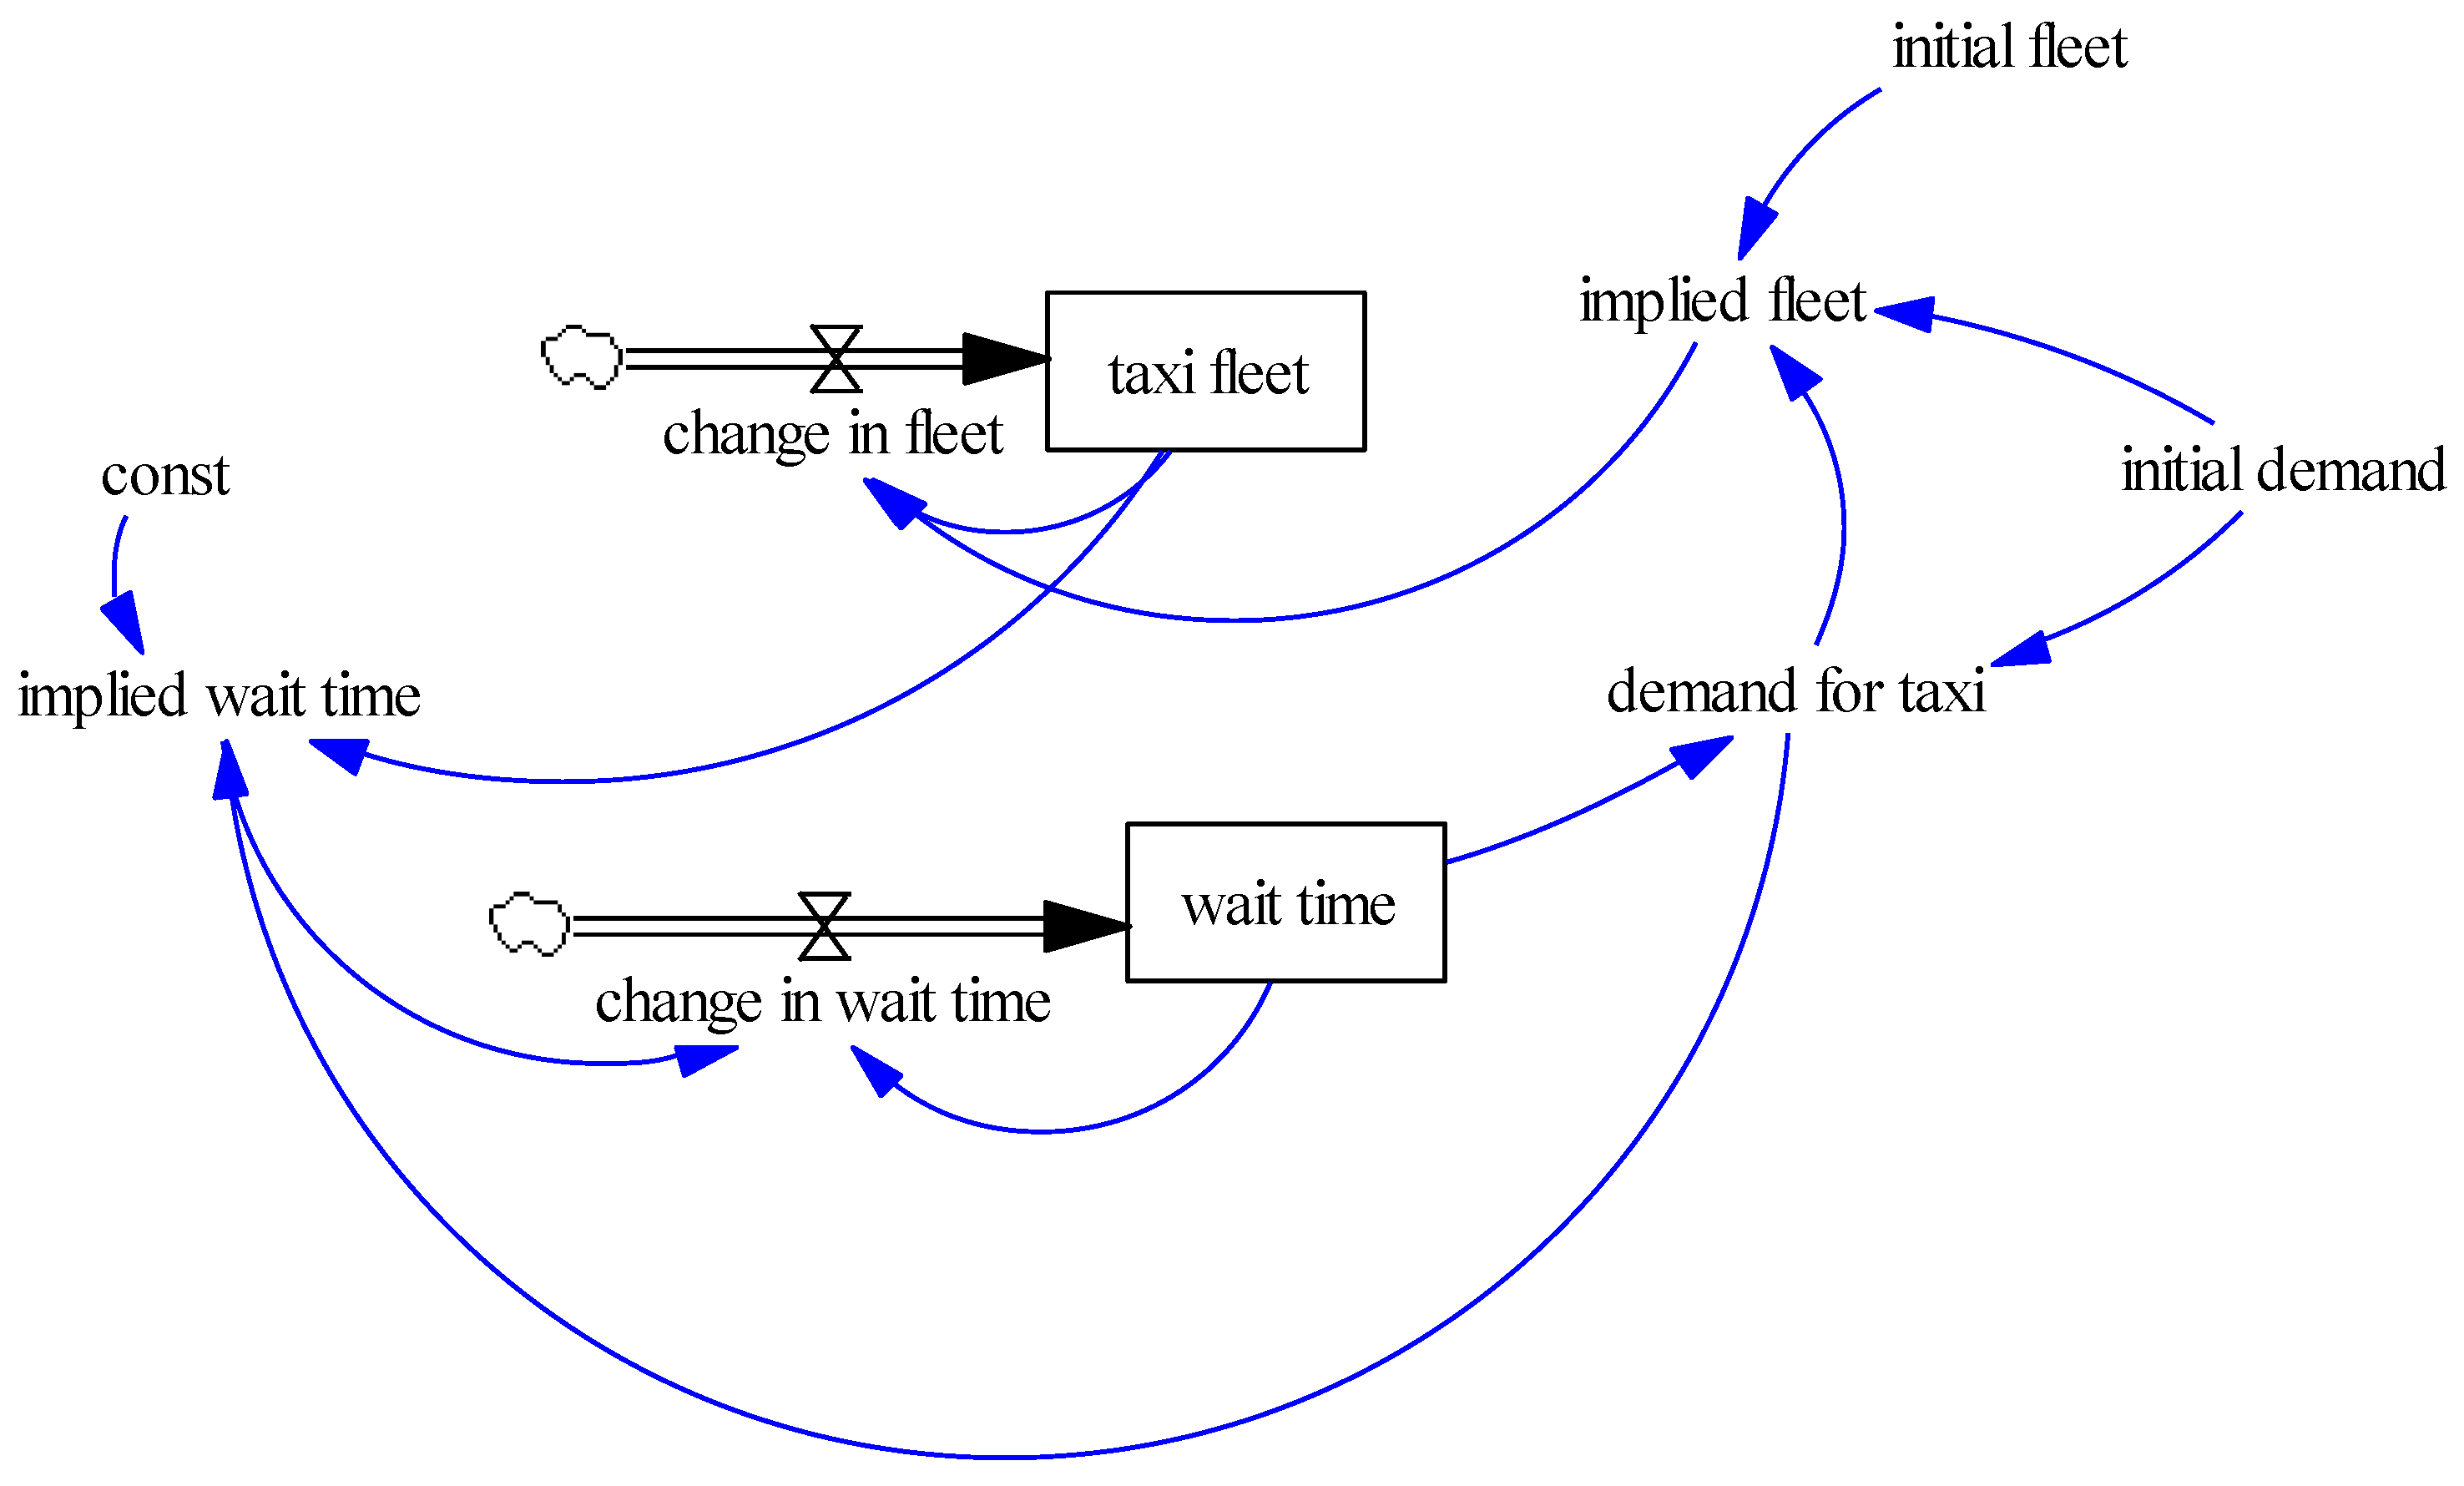
- Peak fare (¥): 14 + 1.8 distance + 0.8 time.
- Off-peak fare (¥): 14 + 1.45 distance + 0.4 time.
References
- Tran, T. Mitigating Greenhouse Gas Emissions from Passenger Transport Sector in Megacities: A case of Ho Chi Minh City. Chem. Eng. Trans. 2019, 72, 85–90. [Google Scholar] [CrossRef]
- Bai, M.; Krumdieck, S. Transition engineering of transport in megacities with case study on commuting in Beijing. Cities 2020, 96, 102452. [Google Scholar] [CrossRef]
- Dong, D.; Duan, H.; Mao, R.; Song, Q.; Zuo, J.; Zhu, J.; Wang, G.; Hu, M.; Dong, B.; Liu, G. Towards a low carbon transition of urban public transport in megacities: A case study of Shenzhen, China. Resour. Conserv. Recycl. 2018, 134, 149–155. [Google Scholar] [CrossRef]
- Chiquetto, J.B.; Leichsenring, A.R.; Ribeiro, F.N.D.; Ribeiro, W.C. Work, housing, and urban mobility in the megacity of São Paulo, Brazil. Socio-Econ. Plan. Sci. 2022, 81, 101184. [Google Scholar] [CrossRef]
- UNECE. A Handbook on Sustainable Urban Mobility and Spatial Planning. Promoting Active Mobility; United Nations Economic Commission for Europe: Geneva, Switzerland, 2020; Available online: https://unece.org/DAM/trans/main/wp5/publications/1922152E_WEB_light.pdf (accessed on 30 January 2024).
- Canitez, F. Pathways to sustainable urban mobility in developing megacities: A socio-technical transition perspective. Technol. Forecast. Soc. Chang. 2019, 141, 319–329. [Google Scholar] [CrossRef]
- Mohan, D.; Tiwari, G. Mobility, Environment and Safety in Megacities: Dealing with a Complex Future. IATSS Res. 2000, 24, 39–46. [Google Scholar] [CrossRef]
- Zhao, P. Sustainable urban expansion and transportation in a growing megacity: Consequences of urban sprawl for mobility on the urban fringe of Beijing. Habitat Int. 2010, 34, 236–243. [Google Scholar] [CrossRef]
- Ghosh, B.; Schot, J. Towards a novel regime change framework: Studying mobility transitions in public transport regimes in an Indian megacity. Energy Res. Soc. Sci. 2019, 51, 82–95. [Google Scholar] [CrossRef]
- Sun, L.; Zhang, T.; Liu, S.; Wang, K.; Rogers, T.; Yao, L.; Zhao, P. Reducing energy consumption and pollution in the urban transportation sector: A review of policies and regulations in Beijing. J. Clean. Prod. 2021, 285, 125339. [Google Scholar] [CrossRef]
- Lee, J.; Arts, J.; Vanclay, F. Stakeholder views about Land Use and Transport Integration in a rapidly-growing megacity: Social outcomes and integrated planning issues in Seoul. Sustain. Cities Soc. 2021, 67, 102759. [Google Scholar] [CrossRef]
- Xu, M.; Grant-Muller, S.; Gao, Z. Implementation effects and integration evaluation of a selection of transport management measures in Beijing. Case Stud. Transp. Policy 2017, 5, 604–614. [Google Scholar] [CrossRef]
- Acheampong, R.A.; Legacy, C.; Kingston, R.; Stone, J. Imagining urban mobility futures in the era of autonomous vehicles—Insights from participatory visioning and multi-criteria appraisal in the UK and Australia. Transp. Policy 2023, 136, 193–208. [Google Scholar] [CrossRef]
- McKinsey & Company. Automotive Revolution—Perspective towards 2030; McKinsey & Company: New York, NY, USA, 2016; Available online: https://www.mckinsey.com/industries/automotive-and-assembly/our-insights/disruptive-trends-that-will-transform-the-auto-industry (accessed on 9 August 2023).
- Rahman, M.M.; Thill, J.-C. Impacts of connected and autonomous vehicles on urban transportation and environment: A comprehensive review. Sustain. Cities Soc. 2023, 96, 104649. [Google Scholar] [CrossRef]
- Milakis, D.; Müller, S. The societal dimension of the automated vehicles transition: Towards a research agenda. Cities 2021, 113, 103144. [Google Scholar] [CrossRef]
- Mao, W.; Shepherd, S.; Harrison, G.; Xu, M. Autonomous vehicle market development in Beijing: A simulation-based approach. Transp. Res. Part A 2024, 179, 103889. [Google Scholar]
- Pfaffenbichler, P.; Emberger, G.; Shepherd, S. The Integrated Dynamic Land Use and Transport Model MARS. Netw. Spat. Econ. 2008, 8, 183–200. [Google Scholar] [CrossRef]
- Shepherd, S.P. A review of system dynamics models applied in transportation. Transp. B Transp. Dyn. 2014, 2, 83–105. [Google Scholar] [CrossRef]
- Gómez Vilchez, J.J.; Jochem, P. Simulating vehicle fleet composition: A review of system dynamics models. Renew. Sustain. Energy Rev. 2019, 115, 109367. [Google Scholar] [CrossRef]
- Fontoura, W.B.a.; Ribeiro, G.M. System Dynamics for Sustainable Transportation Policies: A Systematic Literature Review. Rev. Bras. Gestão Urbana 2021, 13, e20200259. [Google Scholar] [CrossRef]
- Cai, J.; Liang, Y. System Dynamics Modeling for a Public–Private Partnership Program to Promote Bicycle–Metro Integration Based on Evolutionary Game. Transp. Res. Rec. 2021, 2675, 689–710. [Google Scholar] [CrossRef]
- Fernández, A.; Billhardt, H.; Ossowski, S.; Sánchez, Ó. Bike3S: A tool for bike sharing systems simulation. J. Simul. 2020, 14, 278–294. [Google Scholar] [CrossRef]
- Yang, T.; Li, Y.; Zhou, S. System Dynamics Modeling of Dockless Bike-Sharing Program Operations: A Case Study of Mobike in Beijing, China. Sustainability 2019, 11, 1601. [Google Scholar] [CrossRef]
- Zhihang, W. Research on the Impact of Shared Bicycles on Urban Traffic Congestion. Master’s Thesis, Beijing Jiaotong University, Beijing, China, 2019. [Google Scholar]
- Harrison, G.; Shepherd, S.P.; Chen, H. Modelling Uptake Sensitivities of Connected and Automated Vehicle Technologies. Int. J. Syst. Dyn. Appl. 2021, 10, 88–106. [Google Scholar] [CrossRef]
- Jiang, L.; Chen, H.; Paschalidis, E. Diffusion of connected and autonomous vehicles concerning mode choice, policy interventions and sustainability impacts: A system dynamics modelling study. Transp. Policy 2023, 141, 274–290. [Google Scholar] [CrossRef]
- Legêne, M.F.; Auping, W.L.; Correia, G.H.d.A.; van Arem, B. Spatial impact of automated driving in urban areas. J. Simul. 2020, 14, 295–303. [Google Scholar] [CrossRef]
- Nieuwenhuijsen, J.; Correia, G.H.d.A.; Milkis, D.; van Arem, B.; van Daalen, E. Towards a quantitative method to analyse the long-term innovation diffusion of automated vehicles technology using system dynamics. Transp. Res. Part C Emerg. Technol. 2018, 86, 300–327. [Google Scholar] [CrossRef]
- Pfaffenbichler, P.; Gühnemann, A.; Klementschitz, R.; Emberger, G.; Shepherd, S. A Systemic Analysis of Impacts of Individual and Shared Automated Mobility in Austria. Transp. Res. Procedia 2020, 49, 6–16. [Google Scholar] [CrossRef]
- Puylaert, S.; Snelder, M.; van Nes, R.; van Arem, B. Mobility impacts of early forms of automated driving—A system dynamic approach. Transp. Policy 2018, 72, 171–179. [Google Scholar] [CrossRef]
- Pfaffenbichler, P. The Strategic, Dynamic and Integrated Urban Land Use and Trasnport Model MARS (Metropolitan Acivtity Relocation Simulator). Ph.D. Thesis, Technische Universitat Wien, Vienna, Austria, 2003. [Google Scholar]
- Pfaffenbichler, P.; Emberger, G.; Shepherd, S. A system dynamics approach to land use transport interaction modelling: The strategic model MARS and its application. Syst. Dyn. Rev. 2010, 26, 262–282. [Google Scholar] [CrossRef]
- Emberger, G.; Pfaffenbichler, P. A quantitative analysis of potential impacts of automated vehicles in Austria using a dynamic integrated land use and transport interaction model. Transp. Policy 2020, 98, 57–67. [Google Scholar] [CrossRef]
- May, A.D.; Shepherd, S.; Pfaffenbichler, P.; Emberger, G. The potential impacts of automated cars on urban transport: An exploratory analysis. Transp. Policy 2020, 98, 127–138. [Google Scholar] [CrossRef]
- Soteropoulos, A.; Pfaffenbichler, P.; Berger, M.; Emberger, G.; Stickler, A.; Dangschat, J.S. Scenarios of Automated Mobility in Austria: Implications for Future Transport Policy. Future Transp. 2021, 1, 747–764. [Google Scholar] [CrossRef]
- NBSC. China Statistical Yearbook 2022. Table 8-21 Land Use by Region (2019). 2022. National Bureau of Statistics of China. Available online: http://www.stats.gov.cn/sj/ndsj/2022/indexeh.htm (accessed on 30 June 2023).
- Hongyang, S. Line 1 Batong Line, Fangshan Line Line 9 This Year Realizes Cross-Line Operation. Beijing Daily, 25 March 2021. [Google Scholar]
- Martin, E.W.; Shaheen, S.A. Evaluating public transit modal shift dynamics in response to bikesharing: A tale of two US cities. J. Transp. Geogr. 2014, 41, 315–324. [Google Scholar] [CrossRef]
- Liu, T.; Xu, M. Chapter One—Integrated Multilevel Measures for the Transformation to a Transit Metropolis: The Successful and Unsuccessful Practices in Beijing. In Advances in Transport Policy and Planning; Shiftan, Y., Kamargianni, M., Eds.; Academic Press: Cambridge, MA, USA, 2018; Volume 1, pp. 1–34. [Google Scholar]
- Muir, H.; Pfaffenbichler, P.; Emberger, G.; Shepherd, S.; Wagner, P.; Martin, P.; Shires, J.; May, T.; Levin, T. CityMobil WP2.3 Modelling Background Report—MARS, Microsimulation, Cities and Scenarios. 2008. Available online: https://www.researchgate.net/publication/317646084_CityMobil_WP23_Modelling_Background_Report_-_MARS_microsimulation_cities_and_scenarios (accessed on 9 August 2023).
- Wadud, Z.; MacKenzie, D.; Leiby, P. Help or hindrance? The travel, energy and carbon impacts of highly automated vehicles. Transp. Res. Part A Policy Pract. 2016, 86, 1–18. [Google Scholar] [CrossRef]
- Duan, Y.; Yuan, C.; Mao, X.; Zhao, J.; Ma, N. Influence of the built environment on taxi travel demand based on the optimal spatial analysis unit. PLoS ONE 2023, 18, e0292363. [Google Scholar] [CrossRef] [PubMed]
- Nie, W.-P.; Cai, S.-M.; Zhao, Z.-D.; Gao, F.-J.; Li, Z.-T.; Zhou, T. Examining the impact of urban-rural spatial structure on mobility networks: A case study of taxis. Cities 2023, 141, 104512. [Google Scholar] [CrossRef]
- Wang, J.; Du, F.; Huang, J.; Liu, Y. How do taxi usage patterns vary and why? A dynamic spatiotemporal analysis in Beijing. Comput. Urban Sci. 2023, 3, 11. [Google Scholar] [CrossRef]
- Jiang, W.; Lian, J.; Shen, M.; Zhang, L. A multi-period analysis of taxi drivers’ behaviors based on GPS trajectories. In Proceedings of the 2017 IEEE 20th International Conference on Intelligent Transportation Systems (ITSC), Yokohama, Japan, 16–19 October 2017; pp. 1–6. [Google Scholar]
- Jianqin, Z.; Peiyuan, Q.; Yingchao, D.; Mingyi, D.; Feng, L. A space-time visualization analysis method for taxi operation in Beijing. J. Vis. Lang. Comput. 2015, 31, 1–8. [Google Scholar] [CrossRef]
- Li, T.; Wu, J.; Dang, A.; Liao, L.; Xu, M. Emission pattern mining based on taxi trajectory data in Beijing. J. Clean. Prod. 2019, 206, 688–700. [Google Scholar] [CrossRef]
- Zhang, W.; Ukkusuri, S.V. Optimal Fleet Size and Fare Setting in Emerging Taxi Markets with Stochastic Demand. Comput. Aided Civ. Infrastruct. Eng. 2016, 31, 647–660. [Google Scholar] [CrossRef]
- Xue, M.; Yu, B.; Du, Y.; Wang, B.; Tang, B.; Wei, Y.-M. Possible Emission Reductions from Ride-Sourcing Travel in a Global Megacity: The Case of Beijing. J. Environ. Dev. 2018, 27, 156–185. [Google Scholar] [CrossRef]
- Yao, F.; Zhu, J.; Yu, J.; Chen, C.; Chen, X. Hybrid operations of human driving vehicles and automated vehicles with data-driven agent-based simulation. Transp. Res. Part D Transp. Environ. 2020, 86, 102469. [Google Scholar] [CrossRef]
- Wei, J. Didi Changes Pricing Rules in Beijing. Available online: https://www.chinadaily.com.cn/a/201907/10/WS5d257efaa3105895c2e7cb93.html (accessed on 7 October 2019).
- Feng, R.; Yao, B.; Gu, X.; Zhang, M.; Yu, B. Environmental benefits mining based on data-driven taxi cruising recommendation strategy. J. Clean. Prod. 2021, 326, 129376. [Google Scholar] [CrossRef]
- Guo, Y.; Xin, F.; Li, X. The market impacts of sharing economy entrants: Evidence from USA and China. Electron. Commer. Res. 2020, 20, 629–649. [Google Scholar] [CrossRef]
- Kim, D.; Park, Y.; Ko, J. Factors underlying vehicle ownership reduction among carsharing users: A repeated cross-sectional analysis. Transp. Res. Part D Transp. Environ. 2019, 76, 123–137. [Google Scholar] [CrossRef]
- Sabouri, S.; Brewer, S.; Ewing, R. Exploring the relationship between ride-sourcing services and vehicle ownership, using both inferential and machine learning approaches. Landsc. Urban Plan. 2020, 198, 103797. [Google Scholar] [CrossRef]
- Tang, B.-J.; Li, X.-Y.; Yu, B.; Wei, Y.-M. How app-based ride-hailing services influence travel behavior: An empirical study from China. Int. J. Sustain. Transp. 2020, 14, 554–568. [Google Scholar] [CrossRef]
- Wang, Y.; Shi, W.; Chen, Z. Impact of ride-hailing usage on vehicle ownership in the United States. Transp. Res. Part D Transp. Environ. 2021, 101, 103085. [Google Scholar] [CrossRef]
- Ye, J.; Wang, D.; Li, X.; Axhausen, K.W.; Jin, Y. Assessing one-way carsharing’s impacts on vehicle ownership: Evidence from Shanghai with an international comparison. Transp. Res. Part A Policy Pract. 2021, 150, 16–32. [Google Scholar] [CrossRef]
- Yoon, T.; Cherry, C.R.; Jones, L.R. One-way and round-trip carsharing: A stated preference experiment in Beijing. Transp. Res. Part D Transp. Environ. 2017, 53, 102–114. [Google Scholar] [CrossRef]
- Zhou, F.; Zheng, Z.; Whitehead, J.; Perrons, R.K.; Washington, S.; Page, L. Examining the impact of car-sharing on private vehicle ownership. Transp. Res. Part A Policy Pract. 2020, 138, 322–341. [Google Scholar] [CrossRef]
- Fagnant, D.J.; Kockelman, K.M. The travel and environmental implications of shared autonomous vehicles, using agent-based model scenarios. Transp. Res. Part C Emerg. Technol. 2014, 40, 1–13. [Google Scholar] [CrossRef]
- Ma, D.; Wu, X.; Sun, X.; Zhang, S.; Yin, H.; Ding, Y.; Wu, Y. The Characteristics of Light-Duty Passenger Vehicle Mileage and Impact Analysis in China from a Big Data Perspective. Atmosphere 2022, 13, 1984. [Google Scholar] [CrossRef]





| Year | New Zone Rail Connections (Bold Indicates Outer Zones) |
|---|---|
| 2015 | 13, 22, 29, 37 |
| 2016 | 51 |
| 2017 | 35 |
| 2018 | 26, 33, 42, 55, 62 |
| 2021 | 50, 65 |
| 2022 | 47 |
| 2023 | 56, 67 |
| Pedestrian | Bicycle | Bus | Rail | Taxi | Car | |
|---|---|---|---|---|---|---|
| Real Data | 29% | 12% | 16% | 15% | 3% | 25% |
| Modeled Data | 29% | 11% | 15% | 15% | 3% | 26% |
| 2014 | 2050 | ||||||
|---|---|---|---|---|---|---|---|
| Do Nothing | BAU Base | No LU | No Rail | No SB | No EV | ||
| Pedestrian | 35.0 | 34.1 | 35.5 | 33.0 | 36.5 | 35.6 | 35.7 |
| Bike | 16.2 | 15.9 | 17.1 | 15.2 | 17.5 | 17.2 | 17.4 |
| Bus | 13.6 | 13.5 | 12.3 | 13.0 | 12.4 | 12.3 | 12.5 |
| Rail | 9.4 | 9.2 | 9.7 | 11.3 | 7.7 | 9.5 | 9.9 |
| Taxi | 3.0 | 2.8 | 2.0 | 2.6 | 2.1 | 2.0 | 1.9 |
| Car (ICE) | 22.7 | 24.6 | 4.6 | 5.0 | 4.7 | 4.7 | 22.5 |
| Car (EV) | 0.0 | 0.0 | 18.7 | 19.9 | 19.1 | 18.7 | 0.0 |
| All private cars | 22.8 | 24.6 | 23.3 | 24.9 | 23.8 | 23.4 | 22.6 |
| All cars | 25.8 | 27.4 | 25.3 | 27.6 | 25.9 | 25.4 | 24.5 |
| 2014 | 2050 | ||||||
|---|---|---|---|---|---|---|---|
| Do Nothing | BAU Base | No LU | No Rail | No SB | No EV | ||
| Pedestrian | 29.8 | 28.7 | 27.8 | 27.8 | 28.4 | 27.9 | 27.6 |
| Bike | 11.4 | 11.1 | 10.5 | 10.5 | 10.8 | 10.6 | 10.7 |
| Bus | 15.2 | 15.0 | 14.6 | 14.4 | 14.8 | 14.7 | 14.8 |
| Rail | 13.3 | 12.9 | 15.1 | 14.8 | 13.2 | 14.7 | 15.5 |
| Taxi | 3.6 | 3.4 | 2.9 | 3.3 | 3.1 | 2.9 | 2.8 |
| Car (ICE) | 26.6 | 28.7 | 6.0 | 5.8 | 6.1 | 6.0 | 28.6 |
| Car (EV) | 0.0 | 0.0 | 23.0 | 23.4 | 23.6 | 23.1 | 0.0 |
| All private cars | 26.6 | 28.8 | 29.0 | 29.2 | 29.7 | 29.1 | 28.6 |
| All cars | 30.2 | 32.2 | 31.9 | 32.5 | 32.8 | 32.1 | 31.5 |
| 2014 | 2050 | ||||||
|---|---|---|---|---|---|---|---|
| Do Nothing | BAU Base | No LU | No Rail | No SB | No EV | ||
| Pedestrian | 42.4 | 41.8 | 41.7 | 40.8 | 42.9 | 41.8 | 42.1 |
| Bike | 23.1 | 22.8 | 22.5 | 22.2 | 22.9 | 22.5 | 22.8 |
| Bus | 11.2 | 11.2 | 10.4 | 10.9 | 10.5 | 10.4 | 10.6 |
| Rail | 3.8 | 3.7 | 5.4 | 5.9 | 3.3 | 5.3 | 5.5 |
| Taxi | 2.3 | 1.9 | 1.2 | 1.8 | 1.3 | 1.2 | 1.2 |
| Car (ICE) | 17.2 | 18.6 | 3.5 | 3.7 | 3.6 | 3.6 | 17.7 |
| Car (EV) | 0.0 | 0.0 | 15.2 | 14.8 | 15.5 | 15.2 | 0.0 |
| All private cars | 17.2 | 18.6 | 18.8 | 18.4 | 19.0 | 18.8 | 17.7 |
| All cars | 19.5 | 20.5 | 20.0 | 20.2 | 20.4 | 20.0 | 19.0 |
| Year | Zones | Do Nothing | BAU BASE | LU Only | Rail Only | SB Only | Rail + SB | EV Only |
|---|---|---|---|---|---|---|---|---|
| 2014 | Total | 3.68 | ||||||
| Central | 3.07 | |||||||
| Outer | 0.61 | |||||||
| 2050 | Total | 3.62 | 3.98 | 3.11 | 4.35 | 3.74 | 4.49 | 3.60 |
| Central | 3.02 | 2.77 | 2.34 | 3.43 | 3.13 | 3.55 | 2.99 | |
| Outer | 0.60 | 1.21 | 0.77 | 0.92 | 0.61 | 0.94 | 0.60 | |
| 2014 | 2050 | |||||
|---|---|---|---|---|---|---|
| Do Nothing | BAU Base | PAV | PAV + SAV | PAV + SAV No Shedding | ||
| Pedestrian | 35.0 | 34.1 | 35.5 | 33.2 | 29.9 | 26.9 |
| Bike | 16.2 | 15.9 | 17.1 | 16.0 | 14.6 | 13.3 |
| Bus | 13.6 | 13.5 | 12.3 | 11.4 | 10.4 | 9.3 |
| Rail | 9.4 | 9.2 | 9.7 | 9.0 | 8.5 | 7.3 |
| Taxi/SAV | 3.0 | 2.8 | 2.0 | 1.9 | 24.4 | 20.2 |
| Car (ICE) | 22.7 | 24.6 | 4.6 | 4.3 | 1.9 | 3.6 |
| Car (EV/AV) | 0.0 | 0.0 | 18.7 | 24.2 | 10.2 | 19.5 |
| All private cars | 22.8 | 24.6 | 23.3 | 28.5 | 12.1 | 23.1 |
| All cars | 25.8 | 27.4 | 25.3 | 30.4 | 36.5 | 43.2 |
| 2014 | 2050 | |||||
|---|---|---|---|---|---|---|
| Private Car | Taxi | Total | Private Car | Taxi | Total | |
| BAU base | 4,196,446 | 69,000 | 4,265,446 | 4,891,319 | 43,988 | 4,935,307 |
| PAV | 4,891,319 | 44,068 | 4,935,387 | |||
| PAV + SAV | 2,559,786 | 585,400 | 3,145,186 | |||
| PAV + SAV no shedding | 4,891,319 | 463,946 | 5,355,265 | |||
| 2014 | 2050 | |||||
|---|---|---|---|---|---|---|
| Private Car | Taxi | Total | Private Car | Taxi | Total | |
| BAU Base | 8829 | 55,903 | 9591 | 7636 | 70,213 | 8194 |
| PAV | 8727 | 70,998 | 8202 | |||
| PAV + SAV | 7722 | 57,904 | 24,350 | |||
| PAV + SAV no shedding | 7385 | 58,816 | 8787 | |||
| Scenario | AV Scenario | Access | Egress | Capacity | VoT | 2050 EV/PAV % Trip Share | % Change from BAU |
|---|---|---|---|---|---|---|---|
| BAU Base | None | n/a | n/a | n/a | n/a | 18.7 | n/a |
| AV1 | High | 0 | 0 | 0 | 0 | 18.7 | 0.0 |
| AV2 | High | −25% | −25% | 0 | 0 | 21.6 | 15.3 |
| AV3 | High | −50% | −50% | 0 | 0 | 23.8 | 27.5 |
| AV4 | High | −75% | −75% | 0 | 0 | 27.0 | 44.7 |
| AV5 | High | −100% | −100% | 0 | 0 | 32.0 | 71.3 |
| AV6 | High | 0 | 0 | linear | 0 | 18.7 | 0.2 |
| AV7 | High | 0 | 0 | progressive | 0 | 18.8 | 0.3 |
| AV8 | High | 0 | 0 | 0 | −5% | 18.7 | 0.2 |
| AV9 | High | 0 | 0 | 0 | −25% | 18.9 | 1.0 |
| AV10 | High | 0 | 0 | 0 | −50% | 19.1 | 2.1 |
| AV11 | High | 0 | 0 | 0 | −100% | 19.5 | 4.4 |
| AV12 | High | −50% | −50% | linear | 0 | 23.9 | 28.1 |
| AV13 | High | −50% | −50% | progressive | 0 | 24.0 | 28.4 |
| AV14 | High | −50% | −50% | linear | −5% | 24.0 | 28.4 |
| AV15 | High | −50% | −50% | linear | −25% | 24.2 | 29.5 |
| AV16 | High | −50% | −50% | linear | −50% | 24.5 | 30.9 |
| AV17 | High | −50% | −50% | linear | −100% | 25.0 | 33.9 |
| AV18 | Ultra | 0 | 0 | 0 | 0 | 18.7 | 0.0 |
| AV19 | Ultra | −25% | −25% | 0 | 0 | 22.4 | 19.6 |
| AV20 | Ultra | −50% | −50% | 0 | 0 | 25.6 | 37.0 |
| AV21 | Ultra | −75% | −75% | 0 | 0 | 30.9 | 65.1 |
| AV22 | Ultra | −100% | −100% | 0 | 0 | 41.1 | 119.8 |
| AV23 | Ultra | −50% | −50% | linear | 0 | 25.8 | 37.9 |
| AV24 | Ultra | −50% | −50% | progressive | 0 | 25.9 | 38.6 |
| AV25 | Ultra | −50% | −50% | linear | −5% | 25.8 | 38.3 |
| AV26 | Ultra | −50% | −50% | linear | −25% | 26.1 | 39.7 |
| AV27 | Ultra | −50% | −50% | linear | −50% | 26.5 | 41.6 |
| AV28 | Ultra | −50% | −50% | linear | −100% | 27.2 | 45.6 |
| Scenario | L5 PAV Shedding Threshold | Portion of SAV Shedding | Portion of Non-SAV Shedding | 2050 Private Car Ownership | 2050 Private Car Trip Share | 2050 Taxi/SAV Trip Share |
|---|---|---|---|---|---|---|
| PAV + SAV no shedding | n/a | n/a | n/a | 4,891,319 | 23.1% | 20.2% |
| PAV + SAV | 0.5 | 0.3 | 0.0001 | 2,559,786 | 12.1% | 24.4% |
| SS1 | 0.5 | 0.3 | 0.1 | 1,486,869 | 7.1% | 25.7% |
| SS2 | 0.5 | 0.15 | 0.0001 | 3,572,226 | 17.4% | 22.4% |
| SS3 | 0.5 | 0.6 | 0.0001 | 1,709,734 | 8.0% | 25.6% |
| SS4 | 0.25 | 0.3 | 0.0001 | 1,955,649 | 9.0% | 25.5% |
| SS5 | 0.75 | 0.3 | 0.0001 | 4,405,272 | 21.2% | 20.9% |
Disclaimer/Publisher’s Note: The statements, opinions and data contained in all publications are solely those of the individual author(s) and contributor(s) and not of MDPI and/or the editor(s). MDPI and/or the editor(s) disclaim responsibility for any injury to people or property resulting from any ideas, methods, instructions or products referred to in the content. |
© 2024 by the authors. Licensee MDPI, Basel, Switzerland. This article is an open access article distributed under the terms and conditions of the Creative Commons Attribution (CC BY) license (https://creativecommons.org/licenses/by/4.0/).
Share and Cite
Harrison, G.; Shepherd, S.; Pfaffenbichler, P.; Xu, M.; Tian, H.; Mao, W. Scenarios for New Mobility Policies and Automated Mobility in Beijing. Future Transp. 2024, 4, 697-721. https://doi.org/10.3390/futuretransp4030033
Harrison G, Shepherd S, Pfaffenbichler P, Xu M, Tian H, Mao W. Scenarios for New Mobility Policies and Automated Mobility in Beijing. Future Transportation. 2024; 4(3):697-721. https://doi.org/10.3390/futuretransp4030033
Chicago/Turabian StyleHarrison, Gillian, Simon Shepherd, Paul Pfaffenbichler, Meng Xu, Hang Tian, and Wei Mao. 2024. "Scenarios for New Mobility Policies and Automated Mobility in Beijing" Future Transportation 4, no. 3: 697-721. https://doi.org/10.3390/futuretransp4030033
APA StyleHarrison, G., Shepherd, S., Pfaffenbichler, P., Xu, M., Tian, H., & Mao, W. (2024). Scenarios for New Mobility Policies and Automated Mobility in Beijing. Future Transportation, 4(3), 697-721. https://doi.org/10.3390/futuretransp4030033


