
A Comparative Study Between Micro and Millimeter Impedance Sensor Designs for Type-2 Diabetes Detection


Abstract
1. Introduction
- Demonstrate the methodology for blood glucose detection based on the bio-impedance signature study.
- Establish a performance comparison between mm and µm structured IDE design for bio-impedance signature-based blood glucose detection.
- Analysis of sensitivity for both types of sensors (mm and µm) across the entire range of concentrations within the 1 MHz to 10 MHz frequency spectrum.
2. Materials and Methods
2.1. Bio-Impedance Measurement

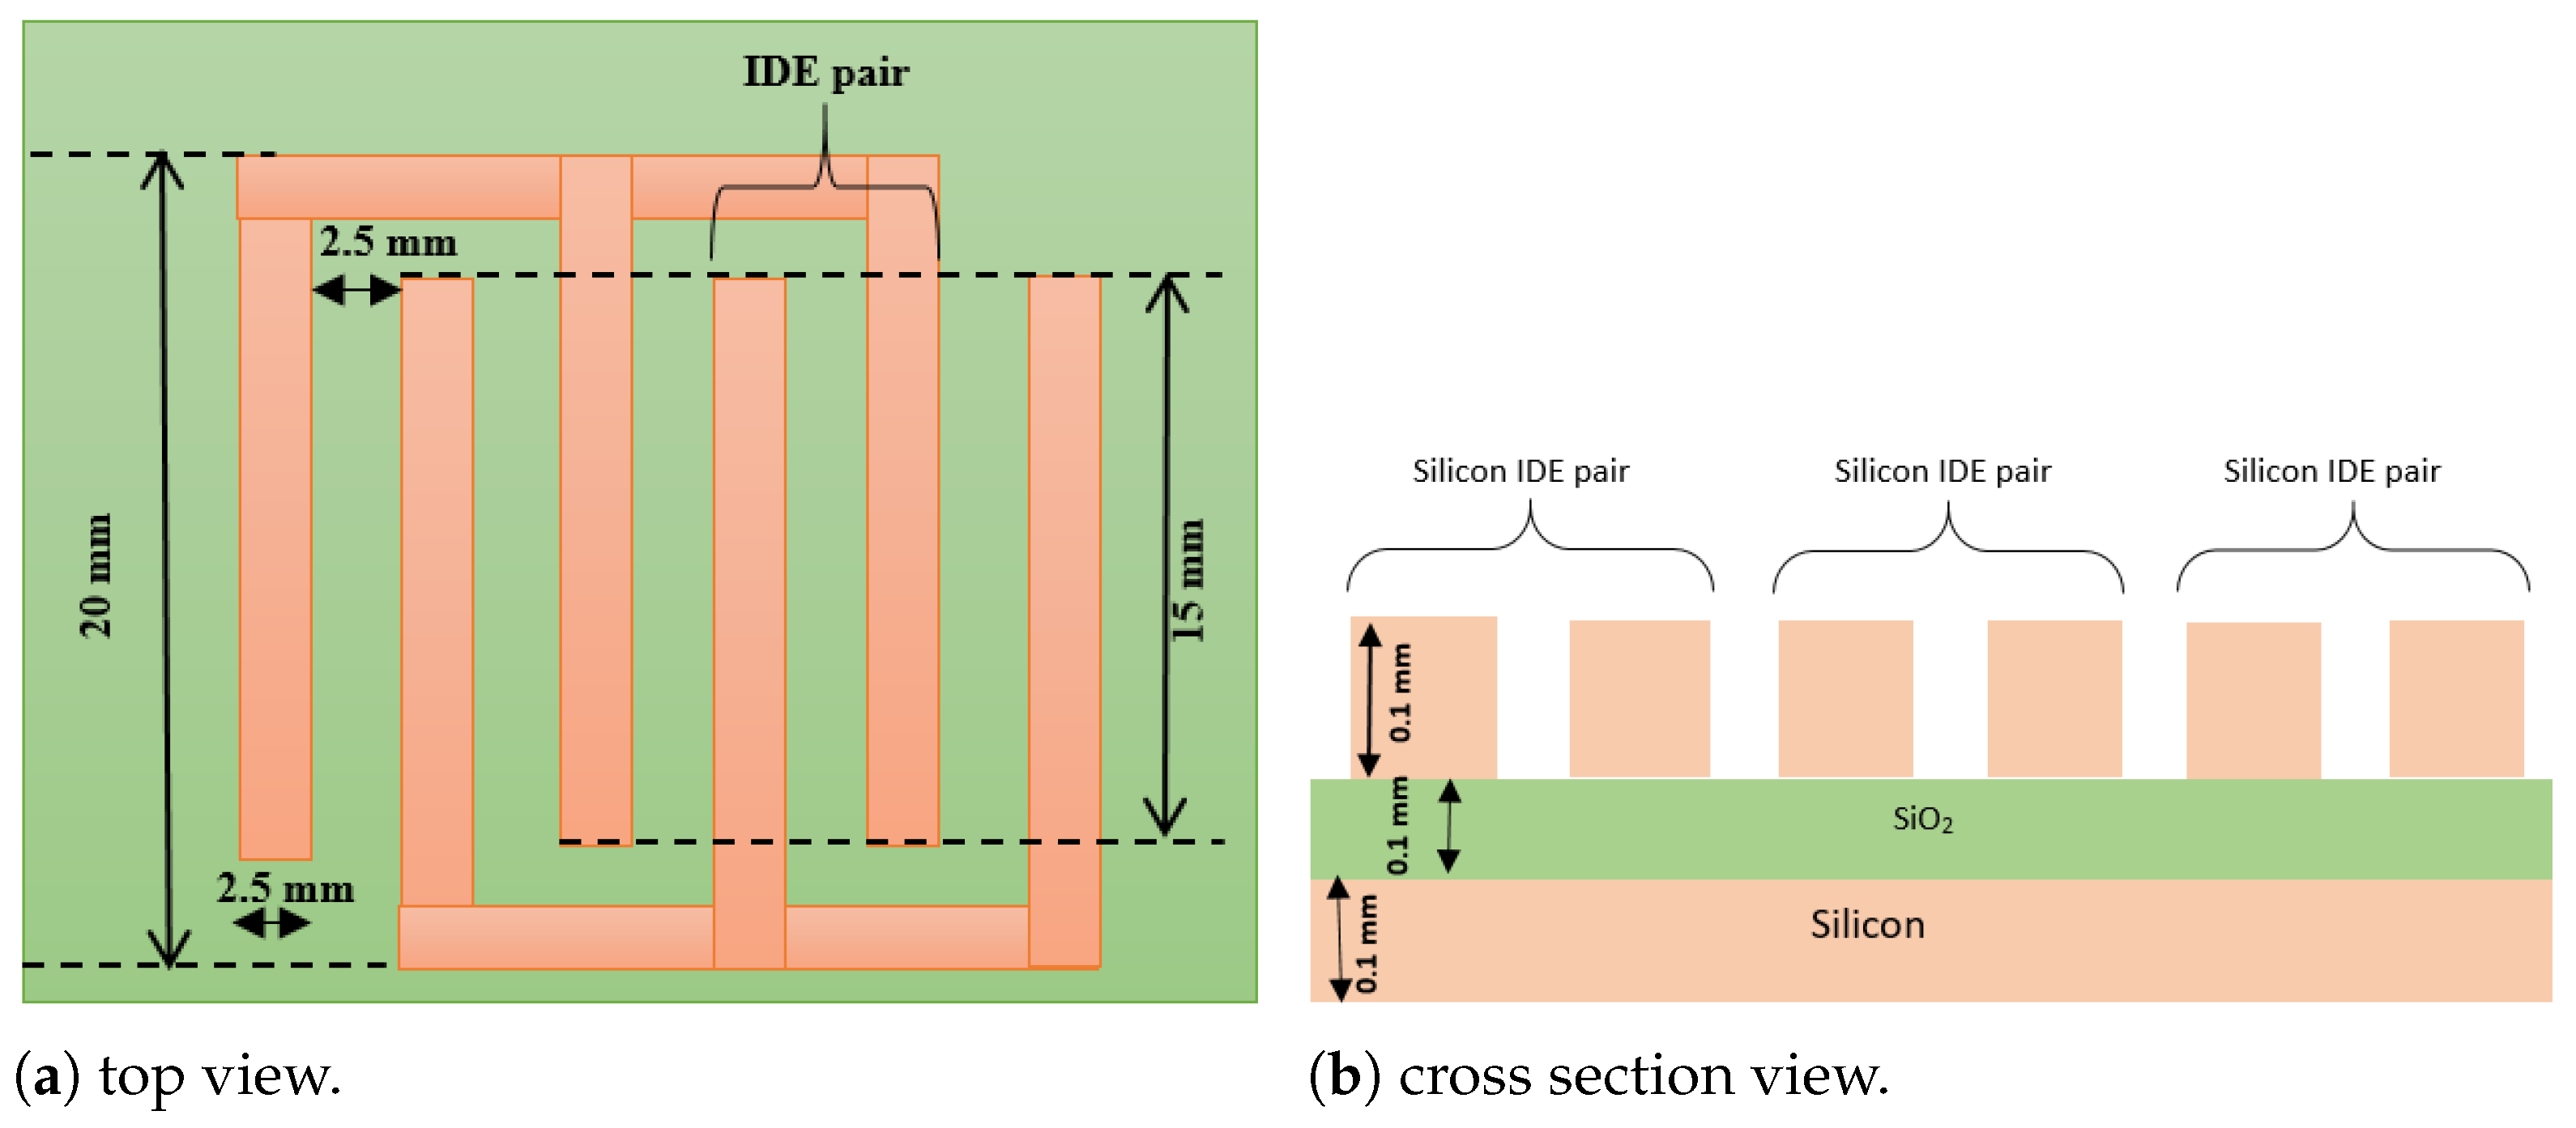
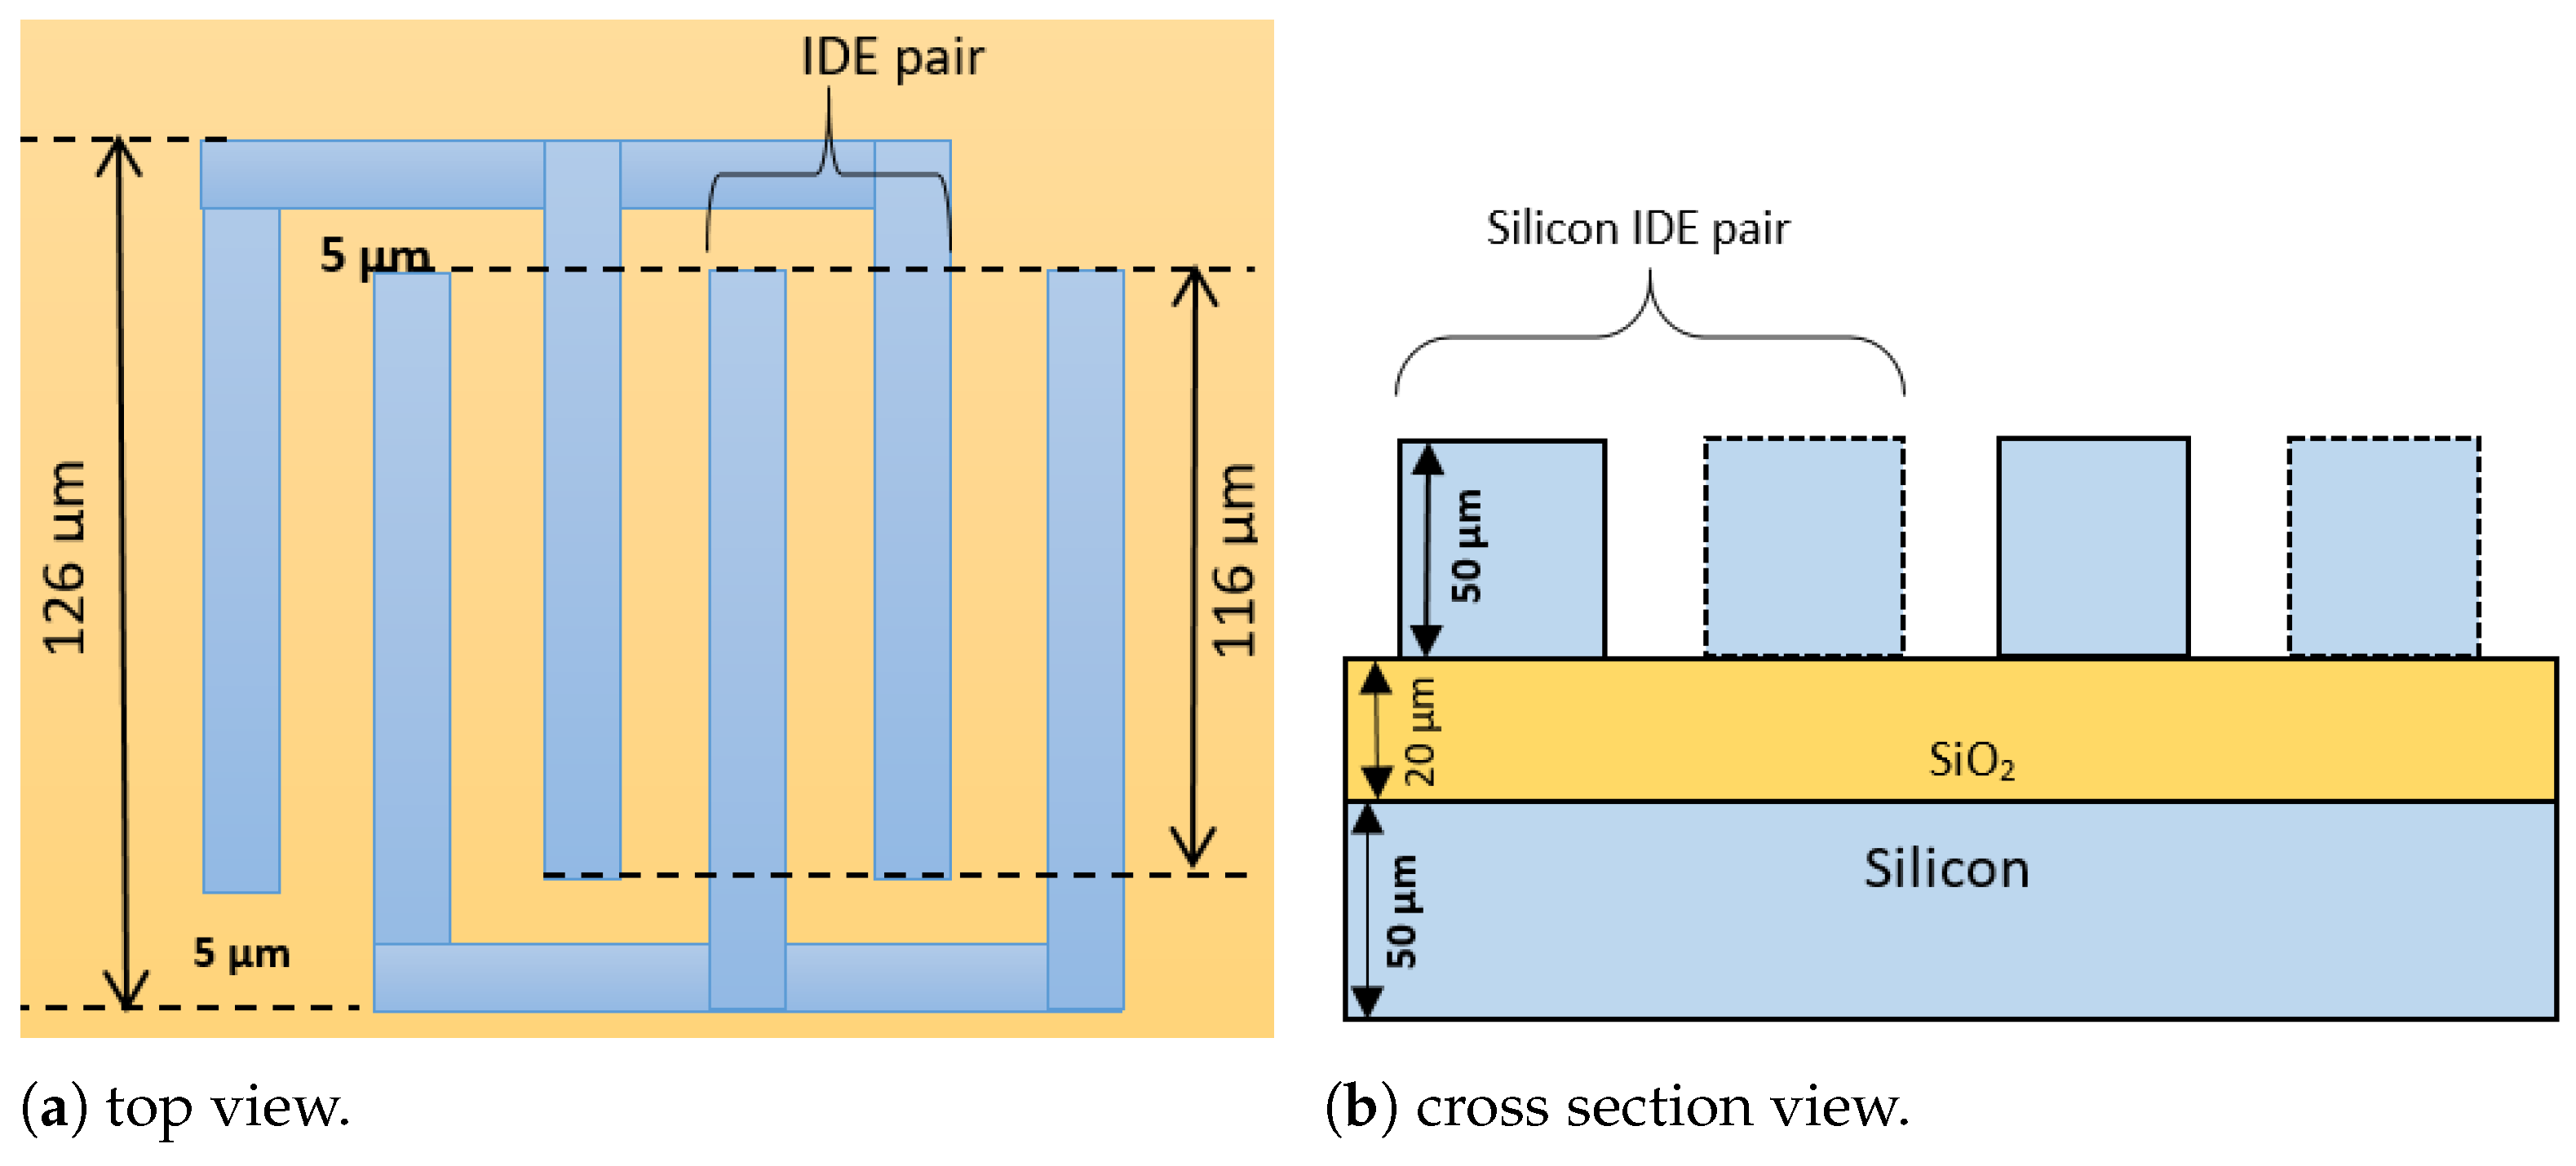
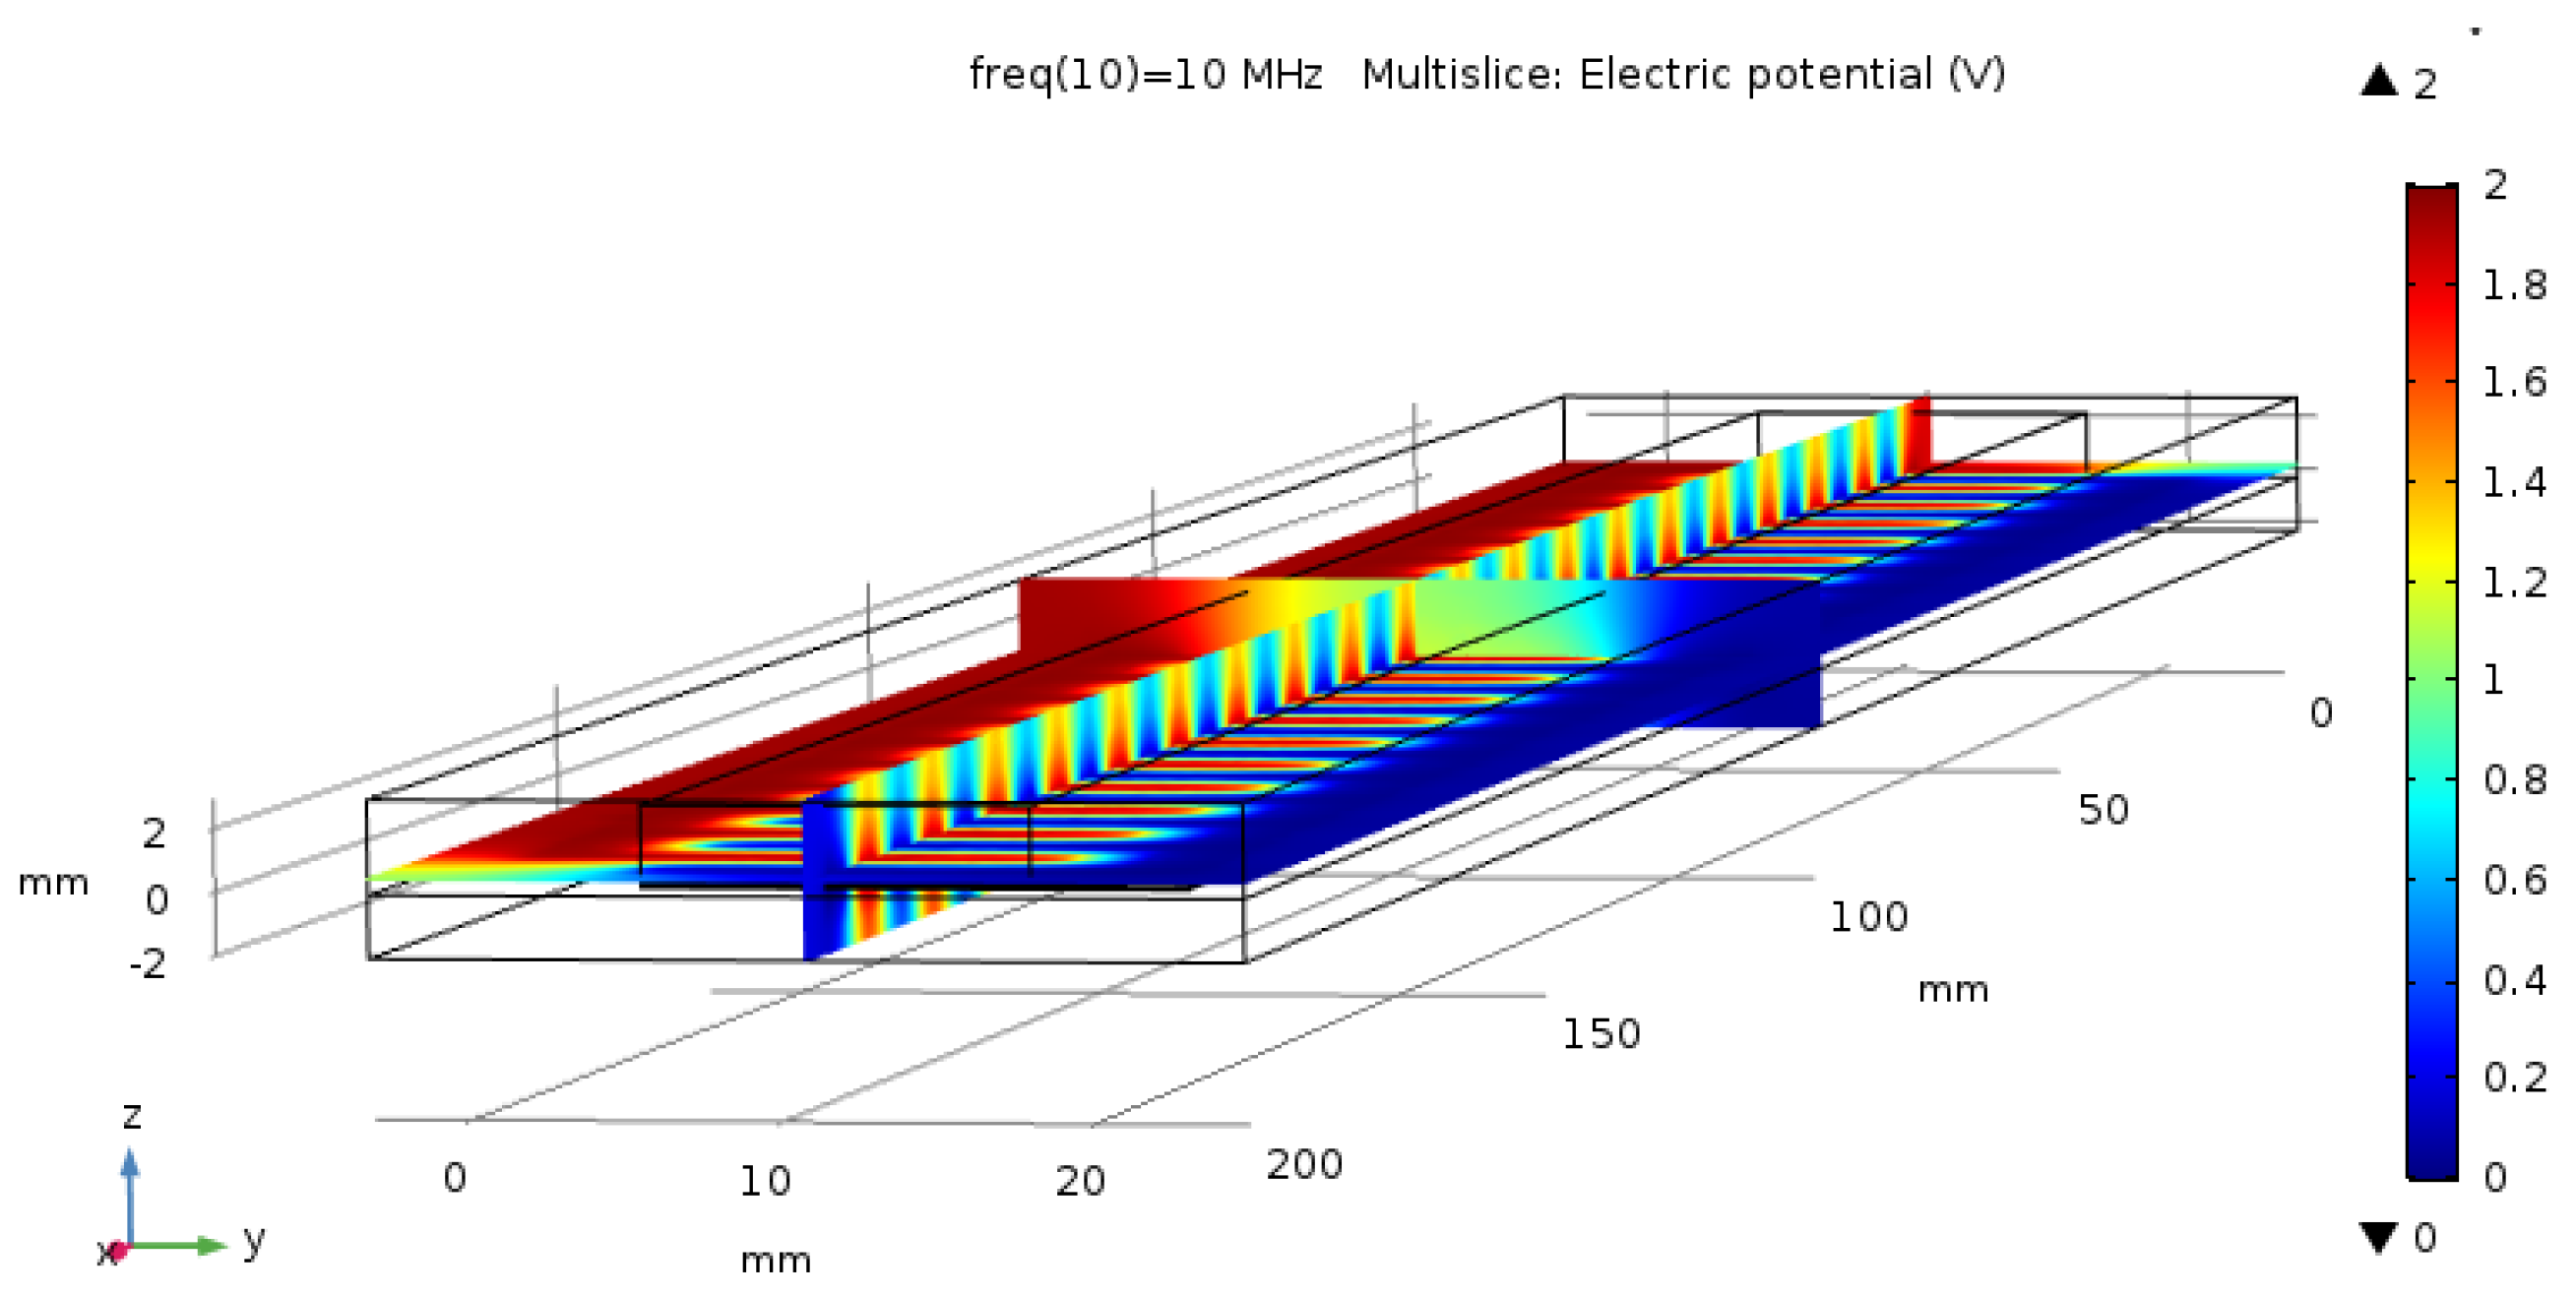
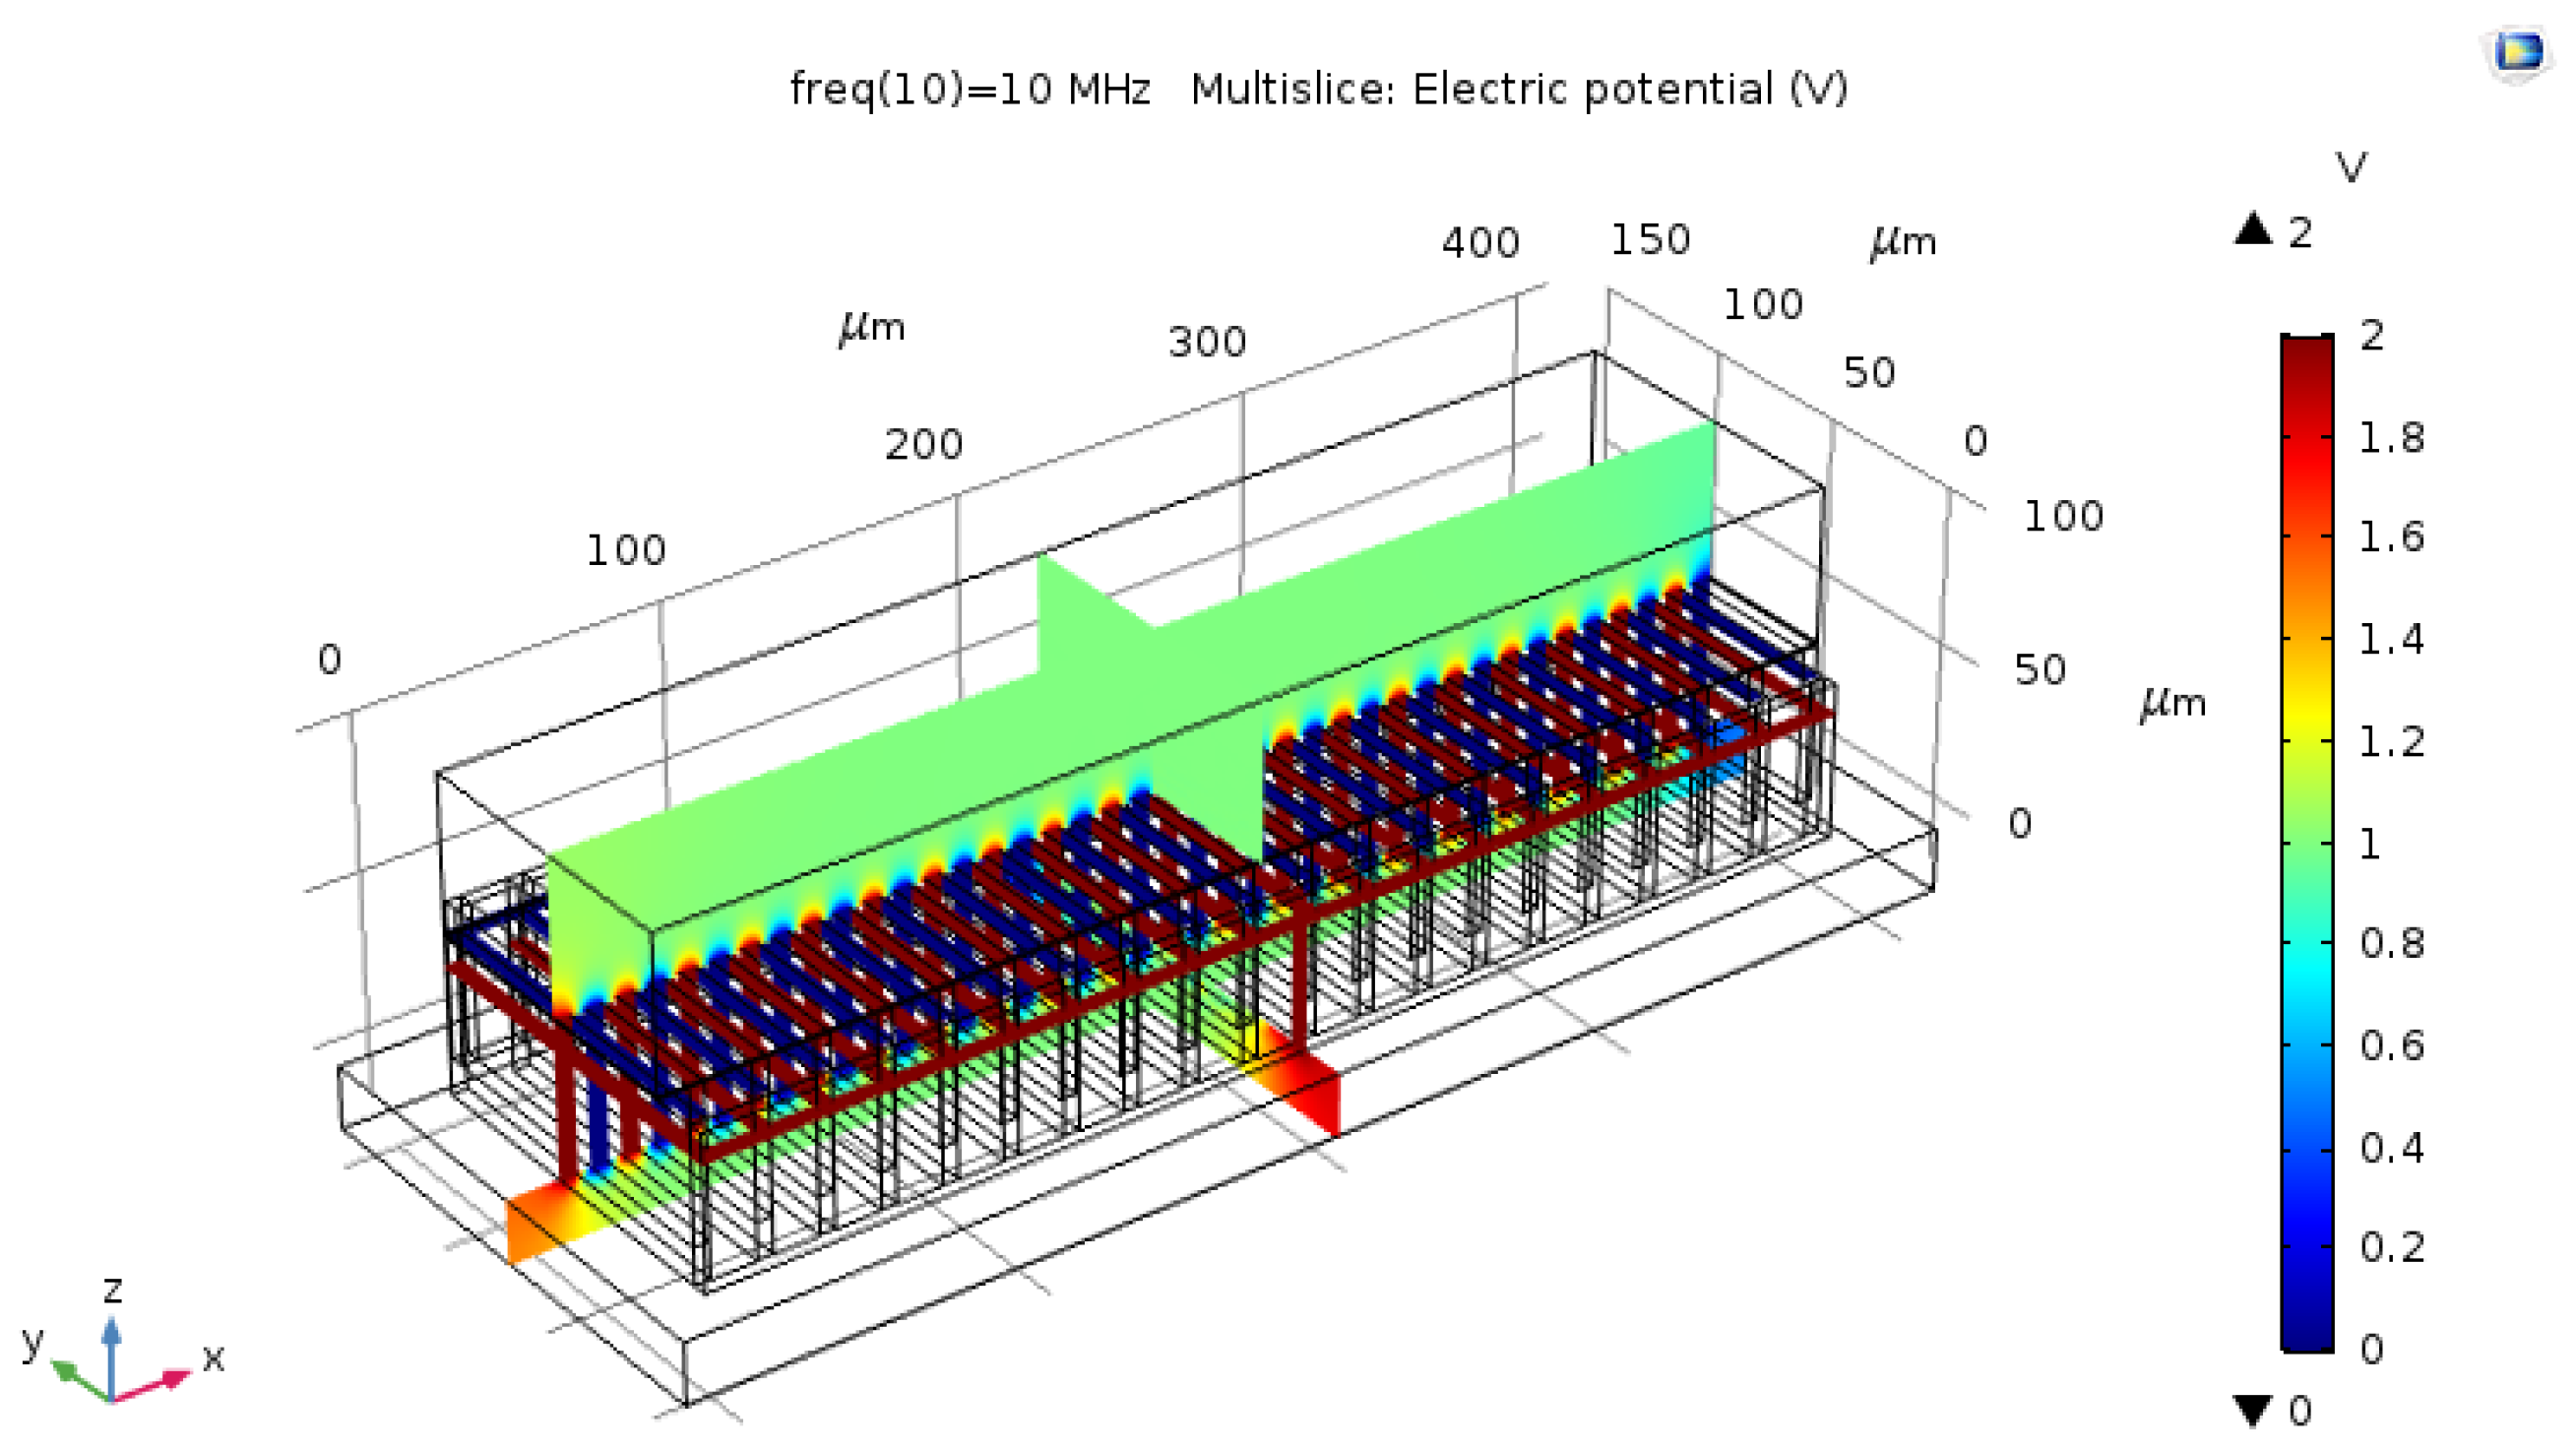
2.2. Capacitive Sensor Design in the Simulator
2.3. Sensor Properties
2.3.1. Cell Factor Calculation
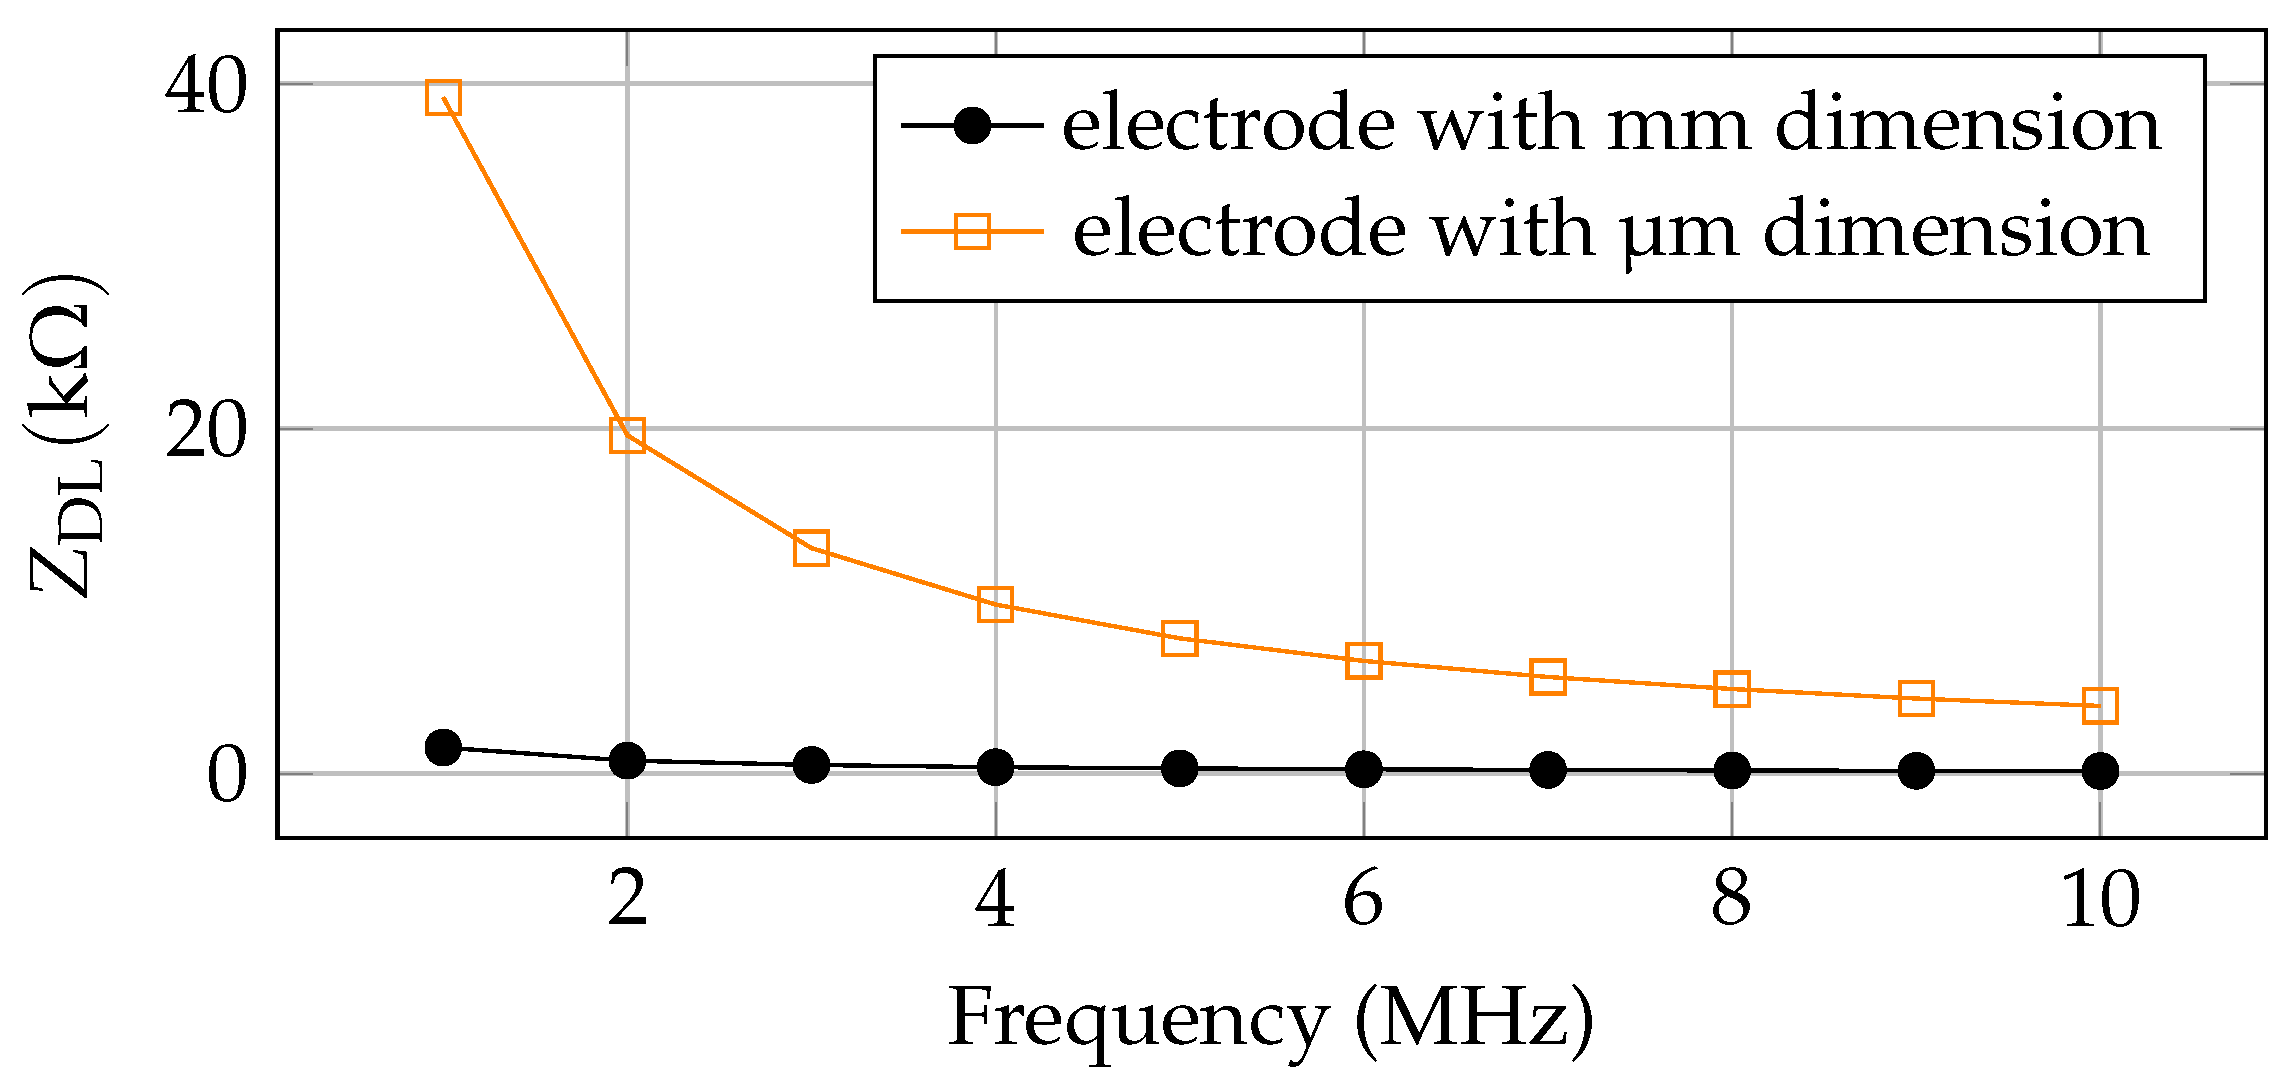
2.3.2. Double-Layer Capacitance
2.3.3. Double Layer Impedance
3. Results
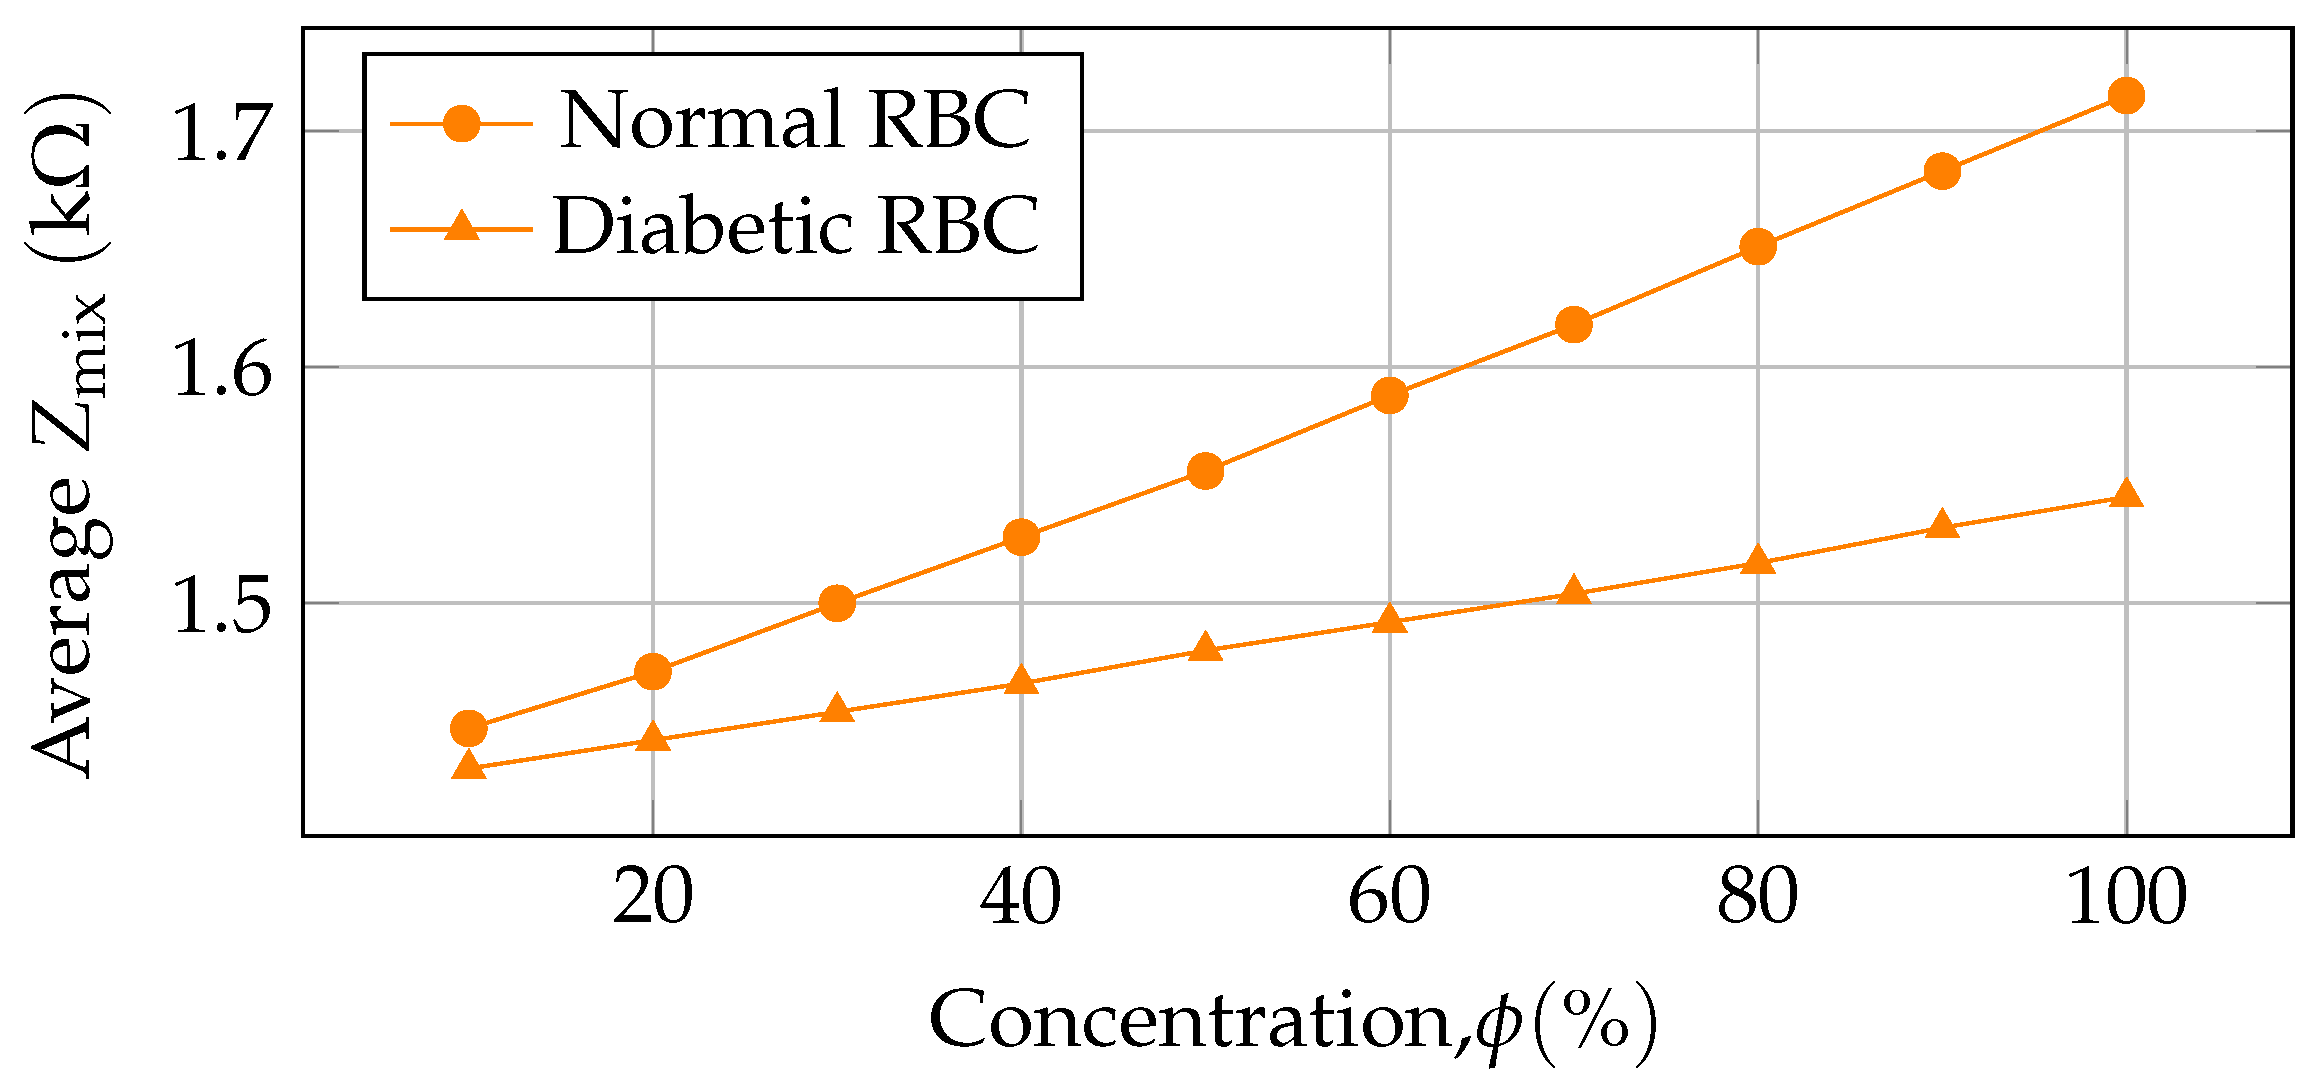
3.1. Average Impedance
3.2. Sensitivity of the Designed Sensor
4. Discussion
5. Conclusions
Author Contributions
Funding
Institutional Review Board Statement
Informed Consent Statement
Data Availability Statement
Conflicts of Interest
References
- Wang, Z.; Liu, X.; Liu, Z.; Zhang, J.; Fang, T. A Continuous Blood Glucose Monitoring Front End IC Design with Large Input Range. In Proceedings of the 2023 8th International Conference On Integrated Circuits And Microsystems (ICICM), Nanjing, China, 20–23 October 2023; pp. 128–133. [Google Scholar]
- Reza, M.; Song, H.; Lee, Y.; Asaduzzaman, M.; Cha, C.; Park, J. An Electrochemical Microneedle Biosensor with Wide Linear Range for Continuous Glucose Monitoring. In Proceedings of the 2023 IEEE SENSORS, Vienna, Austria, 29 October–1 November 2023; pp. 1–4. [Google Scholar]
- Saeedi, P.; Petersohn, I.; Salpea, P.; Malanda, B.; Karuranga, S.; Unwin, N.; Colagiuri, S.; Guariguata, L.; Motala, A.; Ogurtsova, K. Others Global and regional diabetes prevalence estimates for 2019 and projections for 2030 and 2045: Results from the International Diabetes Federation Diabetes Atlas. Diabetes Res. Clin. Pract. 2019, 157, 107843. [Google Scholar] [CrossRef] [PubMed]
- Udara, S.; De Alwis, A.; Silva, K.; Ananda, U.; Kahandawaarachchi, K. DiabiTech-Non-Invasive Blood Glucose Monitoring System. In Proceedings of the 2019 International Conference On Advancements In Computing (ICAC), Malabe, Sri Lanka, 5–7 December 2019; pp. 145–150. [Google Scholar]
- Sun, H.; Saeedi, P.; Karuranga, S.; Pinkepank, M.; Ogurtsova, K.; Duncan, B.; Stein, C.; Basit, A.; Chan, J.; Mbanya, J. Others IDF Diabetes Atlas: Global, regional and country-level diabetes prevalence estimates for 2021 and projections for 2045. Diabetes Res. Clin. Pract. 2022, 183, 109119. [Google Scholar] [CrossRef] [PubMed]
- Owida, H.; Al-Nabulsi, J.; Al Khatib, A. Equivalence of Fasting and Non-Fasting Blood Glucose Readings at the Palm and Fingertip Sites. In Proceedings of the 2022 13th International Conference On Information And Communication Systems (ICICS), Irbid, Jordan, 21–23 June 2022; pp. 411–415. [Google Scholar]
- Association, A. Diagnosis and classification of diabetes mellitus. Diabetes Care 2014, 37, S81–S90. [Google Scholar] [CrossRef] [PubMed]
- Baingane, A.; Slaughter, G. A glucose monitoring system with remote data access. IEEE Trans. Nanobioscience 2020, 19, 622–626. [Google Scholar] [CrossRef] [PubMed]
- Kassem, A.; Hamad, M.; Harbieh, G.; El Moucary, C. A Non-Invasive Blood Glucose Monitoring Device. In Proceedings of the 2020 IEEE 5th Middle East And Africa Conference On Biomedical Engineering (MECBME), Amman, Jordan, 27–29 October 2020; pp. 1–4. [Google Scholar]
- Walker, H.; Hall, W.; Hurst, J. Clinical Methods: The History, Physical, and Laboratory Examinations; Butterworths: Boston, MA, USA, 1990. [Google Scholar]
- Shanthi, K.; Santhi, S.; Reddy, S. Others Handy Non-Invasive Blood Glucose Estimator using Arduino and NodeMCU. In Proceedings of the 2023 International Conference on Intelligent Data Communication Technologies and Internet of Things (IDCIoT), Bengaluru, India, 5–7 January 2023; pp. 866–869. [Google Scholar]
- Zhu, W.; Yu, H.; Pu, Z.; Jin, C.; Ma, Y.; Zheng, H.; Li, W.; Li, C.; Zhang, X.; Li, D. Accurate Non-Invasive Glucose Monitoring Based on Ph-Calibration. In Proceedings of the 2024 IEEE 37th International Conference On Micro Electro Mechanical Systems (MEMS), Austin, TX, USA, 21–25 January 2024; pp. 379–382. [Google Scholar]
- Ribas, R.; Moreira, J.; Uriz, A. A Novel Fingertip Model for Microwave Non-Invasive Blood Glucose Simulations. IEEE Sen. Lett. 2024, 8, 3500604. [Google Scholar]
- Hanna, J.; Costantine, J.; Kanj, R.; Eid, A.; Tawk, Y.; Ramadan, A. Electromagnetic based devices for non-invasive glucose monitoring. In Proceedings of the 2018 IEEE Conference On Antenna Measurements & Applications (CAMA), Västerås, Sweden, 3–6 September 2018; pp. 1–4. [Google Scholar]
- Joel, T.; Sakthipriya, R.; Reena, J.; Poojha, A. Novel Approach to Non-Invasive Blood Glucose Monitoring Based on Visible Laser Light. In Proceedings of the 2022 International Conference on Automation, Computing and Renewable Systems (ICACRS), Coimbatore, India, 15–16 October 2018; pp. 54–57. [Google Scholar]
- Ghoreishizadeh, S.; Taurino, I.; De Micheli, G.; Carrara, S.; Georgiou, P. A differential electrochemical readout ASIC with heterogeneous integration of bio-nano sensors for amperometric sensing. IEEE Trans. Biomed. Circuits Syst. 2017, 11, 1148–1159. [Google Scholar] [CrossRef]
- Khamsavi, A.; Abdi, Y.; Meymian, M. A novel two-electrode nonenzymatic electrochemical glucose sensor based on vertically aligned carbon nanotube arrays. IEEE Sens. Lett. 2019, 3, 4500104. [Google Scholar] [CrossRef]
- Villena Gonzales, W.; Mobashsher, A.; Abbosh, A. The progress of glucose monitoring—A review of invasive to minimally and non-invasive techniques, devices and sensors. Sensors 2019, 19, 800. [Google Scholar] [CrossRef] [PubMed]
- Marius, I.; Sever, P. Algorithms of absorbance and colorimeter for measuring blood glucose. In Proceedings of the 2019 11th International Symposium on Advanced Topics in Electrical Engineering (ATEE), Bucharest, Romania, 28–30 March 2019; pp. 1–6. [Google Scholar]
- Burrin, J.; Price, C. Measurement of blood glucose. Ann. Clin. Biochem. 1985, 22, 327–342. [Google Scholar] [CrossRef]
- Volsko, T.; Chatburn, R.; El-Khatib, M. Equipment for Respiratory Care; Jones & Bartlett Learning: Burlington, MA, USA, 2020. [Google Scholar]
- YSI Incorporated. YSI 2700 SELECT Biochemistry Analyzer User’s Manual; YSI Incorporated: Yellow Springs, OH, USA, 2009. [Google Scholar]
- Liang, Y.; Wanderer, J.; Nichols, J.; Klonoff, D.; Rice, M. Blood gas analyzer accuracy of glucose measurements. Mayo Clin. Proc. 2017, 92, 1030–1041. [Google Scholar] [CrossRef] [PubMed]
- Sahu, S.; Chowdhury, D.; Chattopadhyay, M. Design of MEMS capacitive sensor for the identification of cancerous blood cell: A simulation study. In Proceedings of the 2015 International Conference on Smart Sensors and Systems (IC-SSS), Bangalore, India, 21–23 December 2015; pp. 1–4. [Google Scholar]
- Guin, S.; Chattopadhyay, M. Advancement and challenges for non-invasive monitoring of blood glucose: A review. In Proceedings of the 2020 International Conference on Advances in Medical Physics and Healthcare Engineering (AMPHE 2020), Kolkata, India, 25–26 September 2020; Springer: Berlin/Heidelberg, Germany, 2020; pp. 101–113. [Google Scholar]
- Ullah, A.; Zulfiqar, M.; Khan, M.; Zubair, M.; Mehmood, M.; Massoud, Y. Fast response facile fabricated ide-based ultra-sensitive humidity sensor for medical applications. ACS Omega 2023, 8, 16842–16850. [Google Scholar] [CrossRef] [PubMed]
- Aldhaheri, R.; Kamili, J.; Nella, A.; Sobahi, N. A novel compact highly sensitive non-invasive microwave antenna sensor for blood glucose monitoring. Open Phys. 2023, 21, 20230107. [Google Scholar] [CrossRef]
- Zoric, N.; Iavorschi, A.; Sireteanu, M.; Viziteu, G.; Ciobanu, R. Design and simulations of idc sensor using comsol multyphysics and dielectric spectroscopy of ltcc spectroscopy of ltcc materials materials materials. Bul. Agir 2013, 3, 63–69. [Google Scholar]
- Li, M.; Lv, Y.; Jin, Y.; Li, Y. Simulation Research on Interdigitated Electrodes based sensors in water solution monitoring. J. Phys. Conf. Ser. 2022, 2417, 012026. [Google Scholar] [CrossRef]
- Muaz, A.; Hashim, U.; Liu, W.; Ibrahim, F.; Thong, K.; Mohktar, M. Fabrication of interdigitated electrodes (IDE’s) by conventional photolithography technique for pH measurement using micro-gap structure. In Proceedings of the 2014 IEEE Conference on Biomedical Engineering and Sciences (IECBES), Kuala Lumpur, Malaysia, 8–10 December 2014; pp. 146–150. [Google Scholar]
- MacKay, S.; Hermansen, P.; Wishart, D.; Chen, J. Simulations of interdigitated electrode interactions with gold nanoparticles for impedance-based biosensing applications. Sensors 2015, 15, 22192–22208. [Google Scholar] [CrossRef]
- Hatada, M.; Loew, N.; Okuda-Shimazaki, J.; Khanwalker, M.; Tsugawa, W.; Mulchandani, A.; Sode, K. Development of an interdigitated electrode-based disposable enzyme sensor strip for glycated albumin measurement. Molecules 2021, 26, 734. [Google Scholar] [CrossRef] [PubMed]
- Nguyen, S.; Vu, P.; Tran, M. Glucose sensors based on chitosan capped Zns doped Mn nanomaterials. IEEE Sens. Lett. 2023, 7, 4500304. [Google Scholar] [CrossRef]
- Nguyen, S.; Vu, P.; Nguyen, H.; Tran, M. Optical glucose sensors based on chitosan-capped ZnS-doped Mn nanomaterials. Sensors 2023, 23, 2841. [Google Scholar] [CrossRef] [PubMed]
- Jiang, T.; Ye, X.; Tian, Z.; Shaheen, M.; Khorshed, A.; Feng, Y.; Li, B.; Zhang, Y.; Wang, X.; Chen, J. Sensitivity studies and optimization of an impedance-based biosensor for point-of-care applications. Biosens. Bioelectron. X 2024, 18, 100479. [Google Scholar] [CrossRef]
- Mondol, S.; Mallik, S.; Chattopadhyay, M. ResearchGate Home Page. Available online: https://www.researchgate.net/publication/332834825_MEMS_based_Blood_Cell_Counting_Device (accessed on 1 September 2024).
- Chattopadhyay, M.; Chowdhury, D.; Sahu, S. Study of dielectric properties of leukocytes for the determination of malignancy by capacitive type MEMS sensor. Microsyst. Technol. 2019, 25, 1613–1618. [Google Scholar] [CrossRef]
- Chattopadhyay, M.; Chowdhury, D. Design and performance analysis of MEMS capacitive pressure sensor array for measurement of heart rate. Microsyst. Technol. 2017, 23, 4203–4209. [Google Scholar] [CrossRef]
- Chowdhury, D.; Chattopadhyay, M. Development of a low-power microcontroller-based wrist-worn device with resource-constrained activity detection algorithm. IEEE Trans. Instrum. Meas. 2020, 69, 7522–7529. [Google Scholar] [CrossRef]
- Mallik, S.; Chowdhury, D.; Chattopadhyay, M. Development of a Power Efficient Hearing Aid Using MEMS Microphone. In Proceedings of the Social Transformation—Digital Way: 52nd Annual Convention of the Computer Society of India, CSI 2017, Kolkata, India, 19–21 January 2018; Revised Selected Papers 52. pp. 369–375. [Google Scholar]
- Kumar, V.; Preeti, K.; Saini, V.; Kaushik, A.; Sharma, S. Interdigitated Electrodes (IDEs)-Supported Biosensing for Efficient Point-of-Care Applications. ECS Sens. Plus 2024, 3, 043401. [Google Scholar] [CrossRef]
- Sabiri, I.; Bouyghf, H.; Raihani, A. Optimal interdigitated electrode sensor design for biosensors using differential evolution algorithm. E3S Web Conf. 2022, 351, 01031. [Google Scholar] [CrossRef]
- Li, P.; Boilla, S.; Wang, C.; Lin, P.; Kuo, C.; Tsai, T.; Lee, G. A self-driven, microfluidic, integrated-circuit biosensing chip for detecting four cardiovascular disease biomarkers. Biosens. Bioelectron. 2024, 249, 115931. [Google Scholar] [CrossRef] [PubMed]
- Assaifan, A.; Almansour, R.; Alessa, J.; Alhudaithy, S.; Fakhouri, A.; Alsaleh, A. Roles of Interdigitated Electrode Geometry in Non-Faradaic Impedimetric Biosensors. J. Electrochem. Soc. 2024, 171, 087515. [Google Scholar] [CrossRef]
- Mielewczyk, L.; Galle, L.; Niese, N.; Grothe, J.; Kaskel, S. Precursor-Derived Sensing Interdigitated Electrode Microstructures Based on Platinum and Nano Porous Carbon. ChemistryOpen 2024, 13, e202400179. [Google Scholar] [CrossRef] [PubMed]
- Korek, E.; Teotia, R.; Herbig, D.; Brederlow, R. Electrochemical Impedance Spectroscopy for Ion Sensors with Interdigitated Electrodes: Capacitance Calculations, Equivalent Circuit Models and Design Optimizations. Biosensors 2024, 14, 241. [Google Scholar] [CrossRef]
- Thakur, A.; Srivatava, V.; Park, H.; Kebaili, I.; Boukhris, I.; Joo, Y.; Sung, T.; Kumar, A.; Vaish, R. Calligraphic interdigitated capacitive sensors for green electronics. Sci. Rep. 2024, 14, 15685. [Google Scholar] [CrossRef]
- Habboush, S.; Rojas, S.; Rodríguez, N.; Rivadeneyra, A. The Role of Interdigitated Electrodes in Printed and Flexible Electronics. Sensors 2024, 24, 2717. [Google Scholar] [CrossRef] [PubMed]
- Amers, E.; Orme, B.; Shi, Y.; Torun, H.; Dodd, L. Embroidered Interdigitated Electrodes (IDTs) with Wireless Readout for Continuous Biomarker Monitoring. Sensors 2024, 24, 2717. [Google Scholar] [CrossRef]
- Borchers, J.; Clark, M.; Van Scoy, S.; Anand, R. Array of interdigitated bipolar electrodes for selective capture and analysis of melanoma cells. ChemElectroChem 2024, 11, e202300345. [Google Scholar] [CrossRef]
- Zhang, J.; Luan, Y.; Ma, Q.; Hu, Y.; Ou, R.; Szydzik, C.; Yang, Y.; Trinh, V.; Ha, N.; Zhang, Z.; et al. Large-area grown ultrathin molybdenum oxide for label-free sensitive biomarker detection. Nanoscale 2024, 16, 13061–13070. [Google Scholar] [CrossRef]
- Chowdhury, D.; Chattopadhyay, M. Study and classification of cell bio-impedance signature for identification of malignancy using artificial neural network. IEEE Trans. Instrum. Meas. 2021, 70, 2505908. [Google Scholar] [CrossRef]
- Guin, S.; Chowdhury, D.; Chattopadhyay, M. A capacitive sensor-based approach for type-2 diabetes detection via bio-impedance analysis of erythrocytes. Sens. Int. 2024, 6, 100300. [Google Scholar] [CrossRef]
- Gemanam, S.; Suardi, N.; Ikyo, B.; Oluwafemi, S. Frequency characterization of dielectric parameters and impedance of irradiated diabetic blood using He-Ne laser and non-diabetic human blood samples. J. Phys. Conf. Ser. 2021, 1892, 012024. [Google Scholar] [CrossRef]
- Guin, S.; Chowdhury, D.; Chattopadhyay, M. A novel methodology for detection of Malaria. Microsyst. Technol. 2024, 30, 1477–1484. [Google Scholar] [CrossRef]
- Mortadi, A.; Melouky, A.; Chahid, E.; Moznine, R.; Cherkaoui, O. Studies of the Clausius-Mossotti Factor. J. Phys. Stud. 2016, 20, 4001-1. [Google Scholar] [CrossRef]
- Malleo, D.; Nevill, J.; Lee, L.; Morgan, H. Continuous differential impedance spectroscopy of single cells. Microfluid. Nanofluidics 2010, 9, 191–198. [Google Scholar] [CrossRef] [PubMed]
- Sun, T.; Morgan, H. Single-cell microfluidic impedance cytometry: A review. Microfluid. Nanofluidics 2010, 8, 423–443. [Google Scholar] [CrossRef]
- Kamat, D.; Bagul, D.; Patil, P. Blood glucose measurement using bioimpedance technique. Adv. Electron. 2014, 2014, 406257. [Google Scholar] [CrossRef]
- Desouky, O. Rheological and electrical behavior of erythrocytes in patients with diabetes mellitus. Rom. J. Biophys. 2009, 19, 239–250. [Google Scholar]

| Sl. No. | Technology | Description | Comparison with Our Work |
|---|---|---|---|
| 1 | Finger-Prick Test [14,15] | Uses test strips and pricking, causing discomfort and recurring costs. | Our method eliminates the need for pricking and consumables, providing a painless and cost-effective solution. |
| 2 | Hexokinase Method [16,17] | Lab-based technique requiring skilled personnel and high costs. | Our sensors are portable, suitable for point-of-care use, and reduce dependency on lab facilities. |
| 3 | Enzymatic–Amperometric Sensors [1,12] | Reagent-based electrochemical sensing. | Our reagent-free design offers a broader sensitivity range and reduced operational complexity |
| 4 | Capacitive Sensors [25,26] | Measures capacitance, typically used in non-biomedical fields. | We adapt this technology for bio-impedance-based glucose sensing, optimized for both mm and µm scales. |
| 5 | Microwave Antenna Sensors [13,27] | Highly sensitive but complex and less clinically adopted. | Our IDE sensors achieve comparable sensitivity while being simpler and more adaptable to clinical use. |
| Sl. No. | RBC Type | ||||
|---|---|---|---|---|---|
| 1 | Normal RBC | 0.133 | −0.46 | 66.16 | 0.63 |
| 2 | Diabetic RBC | 0.062 | −0.45 | 73.48 | 0.68 |
| Serial No. | Parameters | Values | |
|---|---|---|---|
| in mm Dimension | in µm Dimension | ||
| 1 | Material of IDE | Silicon | Silicon |
| 2 | Number of IDE | 6 | 6 |
| 3 | Area of IDE | 15 mm × 0.1 mm | 116 µm × 50 µm |
| 4 | Distance between electrode pairs | 2.5 mm | 5 µm |
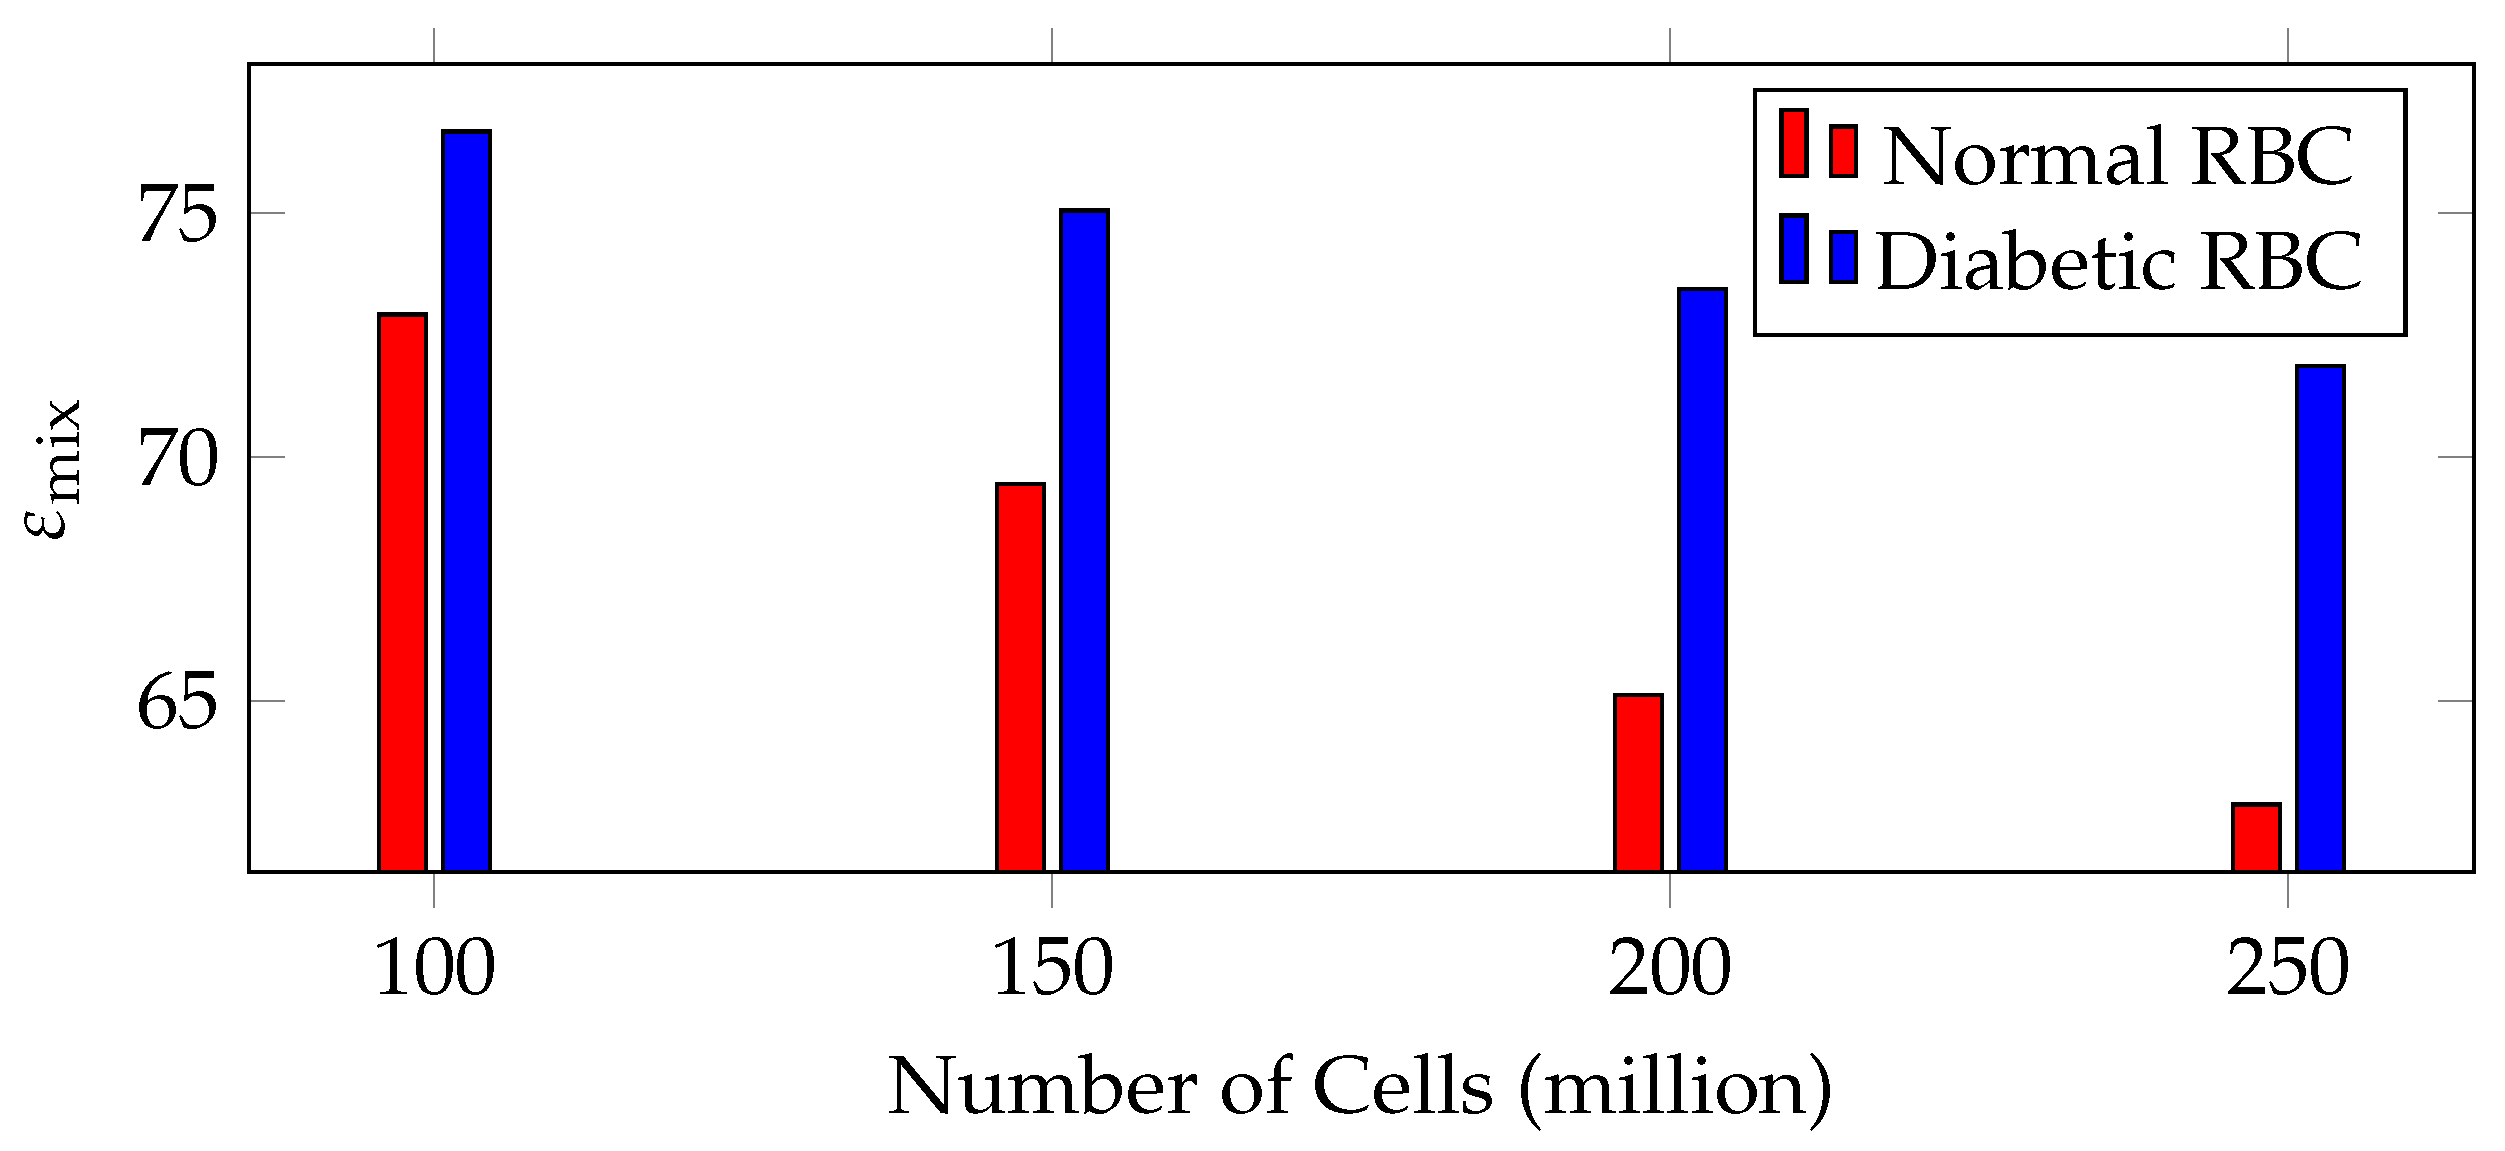
| Sl. No. | Number of Cells (Million) | for Normal RBC | for Diabetic RBC |
|---|---|---|---|
| 1 | 100 | 72.92 | 76.67 |
| 2 | 150 | 69.44 | 75.05 |
| 3 | 200 | 65.12 | 73.44 |
| 4 | 250 | 62.87 | 71.86 |
| Sl. No. | Dimension of Electrodes | (M) | |||||||||||
|---|---|---|---|---|---|---|---|---|---|---|---|---|---|
| 1 MHz | 2 MHz | 3 MHz | 4 MHz | 5 MHz | 6 MHz | 7 MHz | 8 MHz | 9 MHz | 10 MHz | ||||
| 1 | mm | 2.82 | 105 | 1.51 | 0.75 | 0.50 | 0.37 | 0.30 | 0.25 | 0.21 | 0.18 | 0.16 | 0.15 |
| 2 | µm | 365.09 | 4.06 | 39.2 | 19.61 | 13.07 | 9.80 | 7.84 | 6.53 | 5.60 | 4.90 | 4.35 | 3.92 |
| (a) Variation in electrical properties of normal RBC in PBS mixture over different concentrations using 40 capacitive elements in mm dimension | |||||||||||||
| Sl. No. | Concentration (%) | Volume Fraction () | Average | ||||||||||
| 1 MHz | 2 MHz | 3 MHz | 4 MHz | 5 MHz | 6 MHz | 7 MHz | 8 MHz | 9 MHz | 10 MHz | ||||
| 1 | 100 | 0.133 | 11.326 | 5.633 | 3.775 | 2.831 | 2.265 | 1.887 | 1.618 | 1.415 | 1.258 | 1.132 | 3.314 |
| 2 | 90 | 0.120 | 11.111 | 5.555 | 3.703 | 2.777 | 2.222 | 1.851 | 1.587 | 1.388 | 1.234 | 1.111 | 3.254 |
| 3 | 80 | 0.107 | 10.901 | 5.450 | 3.633 | 2.725 | 2.180 | 1.816 | 1.557 | 1.362 | 1.211 | 1.090 | 3.193 |
| 4 | 70 | 0.093 | 10.682 | 5.341 | 3.560 | 2.670 | 2.136 | 1.780 | 1.526 | 1.335 | 1.186 | 1.068 | 3.128 |
| 5 | 60 | 0.080 | 10.483 | 5.241 | 3.494 | 2.620 | 2.096 | 1.747 | 1.497 | 1.310 | 1.164 | 1.048 | 3.070 |
| 6 | 50 | 0.066 | 10.276 | 5.138 | 3.425 | 2.569 | 2.055 | 1.712 | 1.468 | 1.284 | 1.141 | 1.027 | 3.010 |
| 7 | 40 | 0.053 | 10.088 | 5.044 | 3.362 | 2.522 | 2.017 | 1.681 | 1.441 | 1.261 | 1.120 | 1.008 | 2.954 |
| 8 | 30 | 0.040 | 9.904 | 4.952 | 3.301 | 2.476 | 1.980 | 1.650 | 1.414 | 1.238 | 1.100 | 0.990 | 2.901 |
| 9 | 20 | 0.026 | 9.711 | 4.855 | 3.237 | 2.427 | 1.942 | 1.618 | 1.387 | 1.213 | 1.079 | 0.971 | 2.844 |
| 10 | 10 | 0.013 | 9.537 | 4.768 | 3.179 | 2.384 | 1.907 | 1.589 | 1.362 | 1.192 | 1.059 | 0.953 | 2.793 |
| (b) Variation in electrical properties of diabetic RBC in PBS mixture over different concentrations using 40 capacitive elements in mm dimension | |||||||||||||
| Sl. No. | Concentration (%) | Volume Fraction () | Average | ||||||||||
| 1 MHz | 2 MHz | 3 MHz | 4 MHz | 5 MHz | 6 MHz | 7 MHz | 8 MHz | 9 MHz | 10 MHz | ||||
| 1 | 100 | 0.062 | 10.198 | 5.099 | 3.399 | 2.549 | 2.039 | 1.699 | 1.456 | 1.274 | 1.133 | 1.019 | 2.987 |
| 2 | 90 | 0.056 | 10.112 | 5.056 | 3.370 | 2.528 | 2.022 | 1.685 | 1.444 | 1.264 | 1.123 | 1.011 | 2.962 |
| 3 | 80 | 0.049 | 10.015 | 5.077 | 3.338 | 2.503 | 2.003 | 1.669 | 1.430 | 1.251 | 1.112 | 1.001 | 2.940 |
| 4 | 70 | 0.043 | 9.933 | 4.966 | 3.311 | 2.483 | 1.986 | 1.655 | 1.419 | 1.241 | 1.103 | 0.993 | 2.909 |
| 5 | 60 | 0.037 | 9.852 | 4.926 | 3.284 | 2.463 | 1.970 | 1.642 | 1.407 | 1.231 | 1.094 | 0.985 | 2.885 |
| 6 | 50 | 0.031 | 9.771 | 4.885 | 3.257 | 2.442 | 1.954 | 1.628 | 1.395 | 1.221 | 1.085 | 0.977 | 2.862 |
| 7 | 40 | 0.024 | 9.677 | 4.838 | 3.225 | 2.419 | 1.935 | 1.612 | 1.382 | 1.209 | 1.075 | 0.967 | 2.834 |
| 8 | 30 | 0.018 | 9.598 | 4.799 | 3.199 | 2.399 | 1.919 | 1.599 | 1.371 | 1.199 | 1.066 | 0.959 | 2.811 |
| 9 | 20 | 0.012 | 9.520 | 4.760 | 3.173 | 2.380 | 1.904 | 1.586 | 1.360 | 1.190 | 1.057 | 0.952 | 2.788 |
| 10 | 10 | 0.006 | 9.443 | 4.721 | 3.147 | 2.360 | 1.888 | 1.573 | 1.349 | 1.180 | 1.049 | 0.944 | 2.765 |
| (a) Variation in electrical properties of normal RBC in PBS mixture over different concentrations using 40 capacitive elements in μm dimension | |||||||||||||
| Sl. No. | Concentration (%) | Volume Fraction () | Average | ||||||||||
| 1 MHz | 2 MHz | 3 MHz | 4 MHz | 5 MHz | 6 MHz | 7 MHz | 8 MHz | 9 MHz | 10 MHz | ||||
| 1 | 100 | 0.133 | 5.858 | 2.929 | 1.952 | 1.464 | 1.171 | 0.976 | 0.836 | 0.732 | 0.650 | 0.585 | 1.715 |
| 2 | 90 | 0.120 | 5.747 | 2.873 | 1.915 | 1.436 | 1.149 | 0.957 | 0.821 | 0.718 | 0.638 | 0.574 | 1.683 |
| 3 | 80 | 0.107 | 5.638 | 2.819 | 1.879 | 1.409 | 1.127 | 0.939 | 0.805 | 0.704 | 0.626 | 0.563 | 1.651 |
| 4 | 70 | 0.093 | 5.525 | 2.762 | 1.841 | 1.381 | 1.105 | 0.920 | 0.789 | 0.690 | 0.613 | 0.552 | 1.618 |
| 5 | 60 | 0.080 | 5.422 | 2.711 | 1.807 | 1.355 | 1.084 | 0.903 | 0.774 | 0.677 | 0.602 | 0.542 | 1.588 |
| 6 | 50 | 0.066 | 5.315 | 2.657 | 1.771 | 1.328 | 1.063 | 0.885 | 0.759 | 0.664 | 0.590 | 0.531 | 1.556 |
| 7 | 40 | 0.053 | 5.218 | 2.609 | 1.739 | 1.304 | 1.043 | 0.869 | 0.745 | 0.652 | 0.579 | 0.521 | 1.528 |
| 8 | 30 | 0.040 | 5.122 | 2.561 | 1.707 | 1.280 | 1.024 | 0.853 | 0.731 | 0.640 | 0.569 | 0.512 | 1.500 |
| 9 | 20 | 0.026 | 5.023 | 2.511 | 1.674 | 1.255 | 1.004 | 0.837 | 0.717 | 0.627 | 0.558 | 0.502 | 1.471 |
| 10 | 10 | 0.013 | 4.933 | 2.466 | 1.664 | 1.233 | 0.986 | 0.822 | 0.704 | 0.616 | 0.548 | 0.493 | 1.447 |
| (b) Variation in electrical properties of diabetic RBC in PBS mixture over different concentrations using 40 capacitive elements in µm dimension | |||||||||||||
| Sl. No. | Concentration (%) | Volume Fraction () | Average | ||||||||||
| 1 MHz | 2 MHz | 3 MHz | 4 MHz | 5 MHz | 6 MHz | 7 MHz | 8 MHz | 9 MHz | 10 MHz | ||||
| 1 | 100 | 0.062 | 5.274 | 2.637 | 1.758 | 1.318 | 1.054 | 0.879 | 0.753 | 0.659 | 0.586 | 0.527 | 1.545 |
| 2 | 90 | 0.056 | 5.230 | 2.615 | 1.743 | 1.307 | 1.046 | 0.871 | 0.747 | 0.653 | 0.581 | 0.523 | 1.532 |
| 3 | 80 | 0.049 | 5.180 | 2.590 | 1.726 | 1.295 | 1.036 | 0.863 | 0.740 | 0.647 | 0.575 | 0.518 | 1.517 |
| 4 | 70 | 0.043 | 5.137 | 2.568 | 1.712 | 1.284 | 1.027 | 0.856 | 0.733 | 0.642 | 0.570 | 0.513 | 1.504 |
| 5 | 60 | 0.037 | 5.095 | 2.547 | 1.698 | 1.273 | 1.019 | 0.849 | 0.727 | 0.636 | 0.566 | 0.509 | 1.492 |
| 6 | 50 | 0.031 | 5.054 | 2.527 | 1.684 | 1.263 | 1.010 | 0.842 | 0.722 | 0.631 | 0.561 | 0.505 | 1.480 |
| 7 | 40 | 0.024 | 5.005 | 2.502 | 1.668 | 1.251 | 1.001 | 0.834 | 0.715 | 0.625 | 0.556 | 0.500 | 1.466 |
| 8 | 30 | 0.018 | 4.964 | 2.482 | 1.654 | 1.241 | 0.992 | 0.827 | 0.709 | 0.620 | 0.551 | 0.496 | 1.454 |
| 9 | 20 | 0.012 | 4.924 | 2.462 | 1.641 | 1.231 | 0.984 | 0.820 | 0.703 | 0.615 | 0.547 | 0.492 | 1.442 |
| 10 | 10 | 0.006 | 4.884 | 2.442 | 1.628 | 1.221 | 0.976 | 0.814 | 0.697 | 0.610 | 0.542 | 0.488 | 1.430 |
| RBC Type | Average Sensitivity (mm Design) | Average Sensitivity (µm Design) |
|---|---|---|
| Normal RBC | 65.198 | 33.739 |
| Diabetic RBC | 136.643 | 70.661 |
Disclaimer/Publisher’s Note: The statements, opinions and data contained in all publications are solely those of the individual author(s) and contributor(s) and not of MDPI and/or the editor(s). MDPI and/or the editor(s) disclaim responsibility for any injury to people or property resulting from any ideas, methods, instructions or products referred to in the content. |
© 2025 by the authors. Licensee MDPI, Basel, Switzerland. This article is an open access article distributed under the terms and conditions of the Creative Commons Attribution (CC BY) license (https://creativecommons.org/licenses/by/4.0/).
Share and Cite
Guin, S.; Chowdhury, D.; Chattopadhyay, M. A Comparative Study Between Micro and Millimeter Impedance Sensor Designs for Type-2 Diabetes Detection. Micro 2025, 5, 7. https://doi.org/10.3390/micro5010007
Guin S, Chowdhury D, Chattopadhyay M. A Comparative Study Between Micro and Millimeter Impedance Sensor Designs for Type-2 Diabetes Detection. Micro. 2025; 5(1):7. https://doi.org/10.3390/micro5010007
Chicago/Turabian StyleGuin, Santu, Debjyoti Chowdhury, and Madhurima Chattopadhyay. 2025. "A Comparative Study Between Micro and Millimeter Impedance Sensor Designs for Type-2 Diabetes Detection" Micro 5, no. 1: 7. https://doi.org/10.3390/micro5010007
APA StyleGuin, S., Chowdhury, D., & Chattopadhyay, M. (2025). A Comparative Study Between Micro and Millimeter Impedance Sensor Designs for Type-2 Diabetes Detection. Micro, 5(1), 7. https://doi.org/10.3390/micro5010007