Abstract
Background: In recent years, many reports have investigated the usefulness of brachial artery blood flow (BAF) measured by ultrasonography as an evaluation index for the vascular access (VA) stenosis of hemodialysis patients. However, the mechanism of VA dysfunction, despite BAF being higher than the preset blood flow, has not been clarified to date. Methods: The relationship between actual blood-removal flow and recirculation rate with decreasing VA flow was examined using a VA flow path model and pure water as a model fluid. The blood-flow rate was set at 180 mL/min, and the set VA flow rate was lowered stepwise from 350 to 50 mL/min. VA flow rate, blood-removal flow rate, and flow waveform measured between two needle-puncture sites were recorded, and then the actual blood-removal flow rate and recirculation rate were calculated. Results: Recirculation was observed at a VA flow rate < 300 mL/min. The recirculation was due to the VA flow rate, which was transiently reduced to the level below the blood-removal flow rate, resulting in backflow. In contrast, no decrease in the actual blood-removal flow rate was observed. Conclusion: It is suggested that the mechanism of the VA dysfunction, despite the BAF being higher than the preset blood-flow rate, was due to the diastolic BAF being lower than the blood-removal flow rate.
1. Introduction
In hemodialysis, vascular access (VA) is formed by anastomosing arterial and venous blood vessels and by introducing arterial blood flow into superficial veins. However, VA stenosis tends to occur due to turbulent flow at the anastomosis and vascular damage caused by repeated punctures, resulting in reduced dialysis efficiency and eventually VA occlusion. The guidelines of the Japanese Society for Dialysis Therapy (JSDT) define the criteria for therapeutic intervention for VA stenosis as “a stenosis rate of 50% plus other abnormalities such as decreased actual blood-removal flow, a varix formation, increased venous pressure, high BUN concentration and/or increased recirculation rate, unpredictable decrease in dialysis efficiency, and physical abnormalities” [1]. Therefore, VA therapeutic intervention is recommended for the cases when VA stenosis reduces recirculation or actual blood-removal flow rate, resulting in VA dysfunction where a prescribed dialysis dose cannot be attained.
Recently, it has been reported that brachial artery flow (BAF) and resistance index (RI), measured by ultrasonography, are valuable therapeutic intervention criteria for VA [2,3,4,5]. In Japan, more than 90% of chronic maintenance hemodialysis patients choose arteriovenous fistula (AVF) as their VA. Ogawa et al. reported that the cutoff value of BAF for therapeutic intervention, which meets the JSDT guidelines, was 349 mL/min [2]. Sato et al. also reported that the cutoff value of FV is 354 mL/min to diagnose AVF patients with reduced actual blood flow at a preset blood flow rate of 200 mL/min [3]. Accordingly, the cutoff value of BAF for discriminating AVF cases with VA dysfunction is considered to be around 350 mL/min. However, the mechanism of VA dysfunction, despite the high BAF relative to the preset blood-flow rate, has not been clarified to date. Thus, this study aims to clarify the mechanism of the decrease in actual blood-removal flow and recirculation rate with the reduction in BAF in basic experiments.
2. Methods
2.1. Experimental Circuit
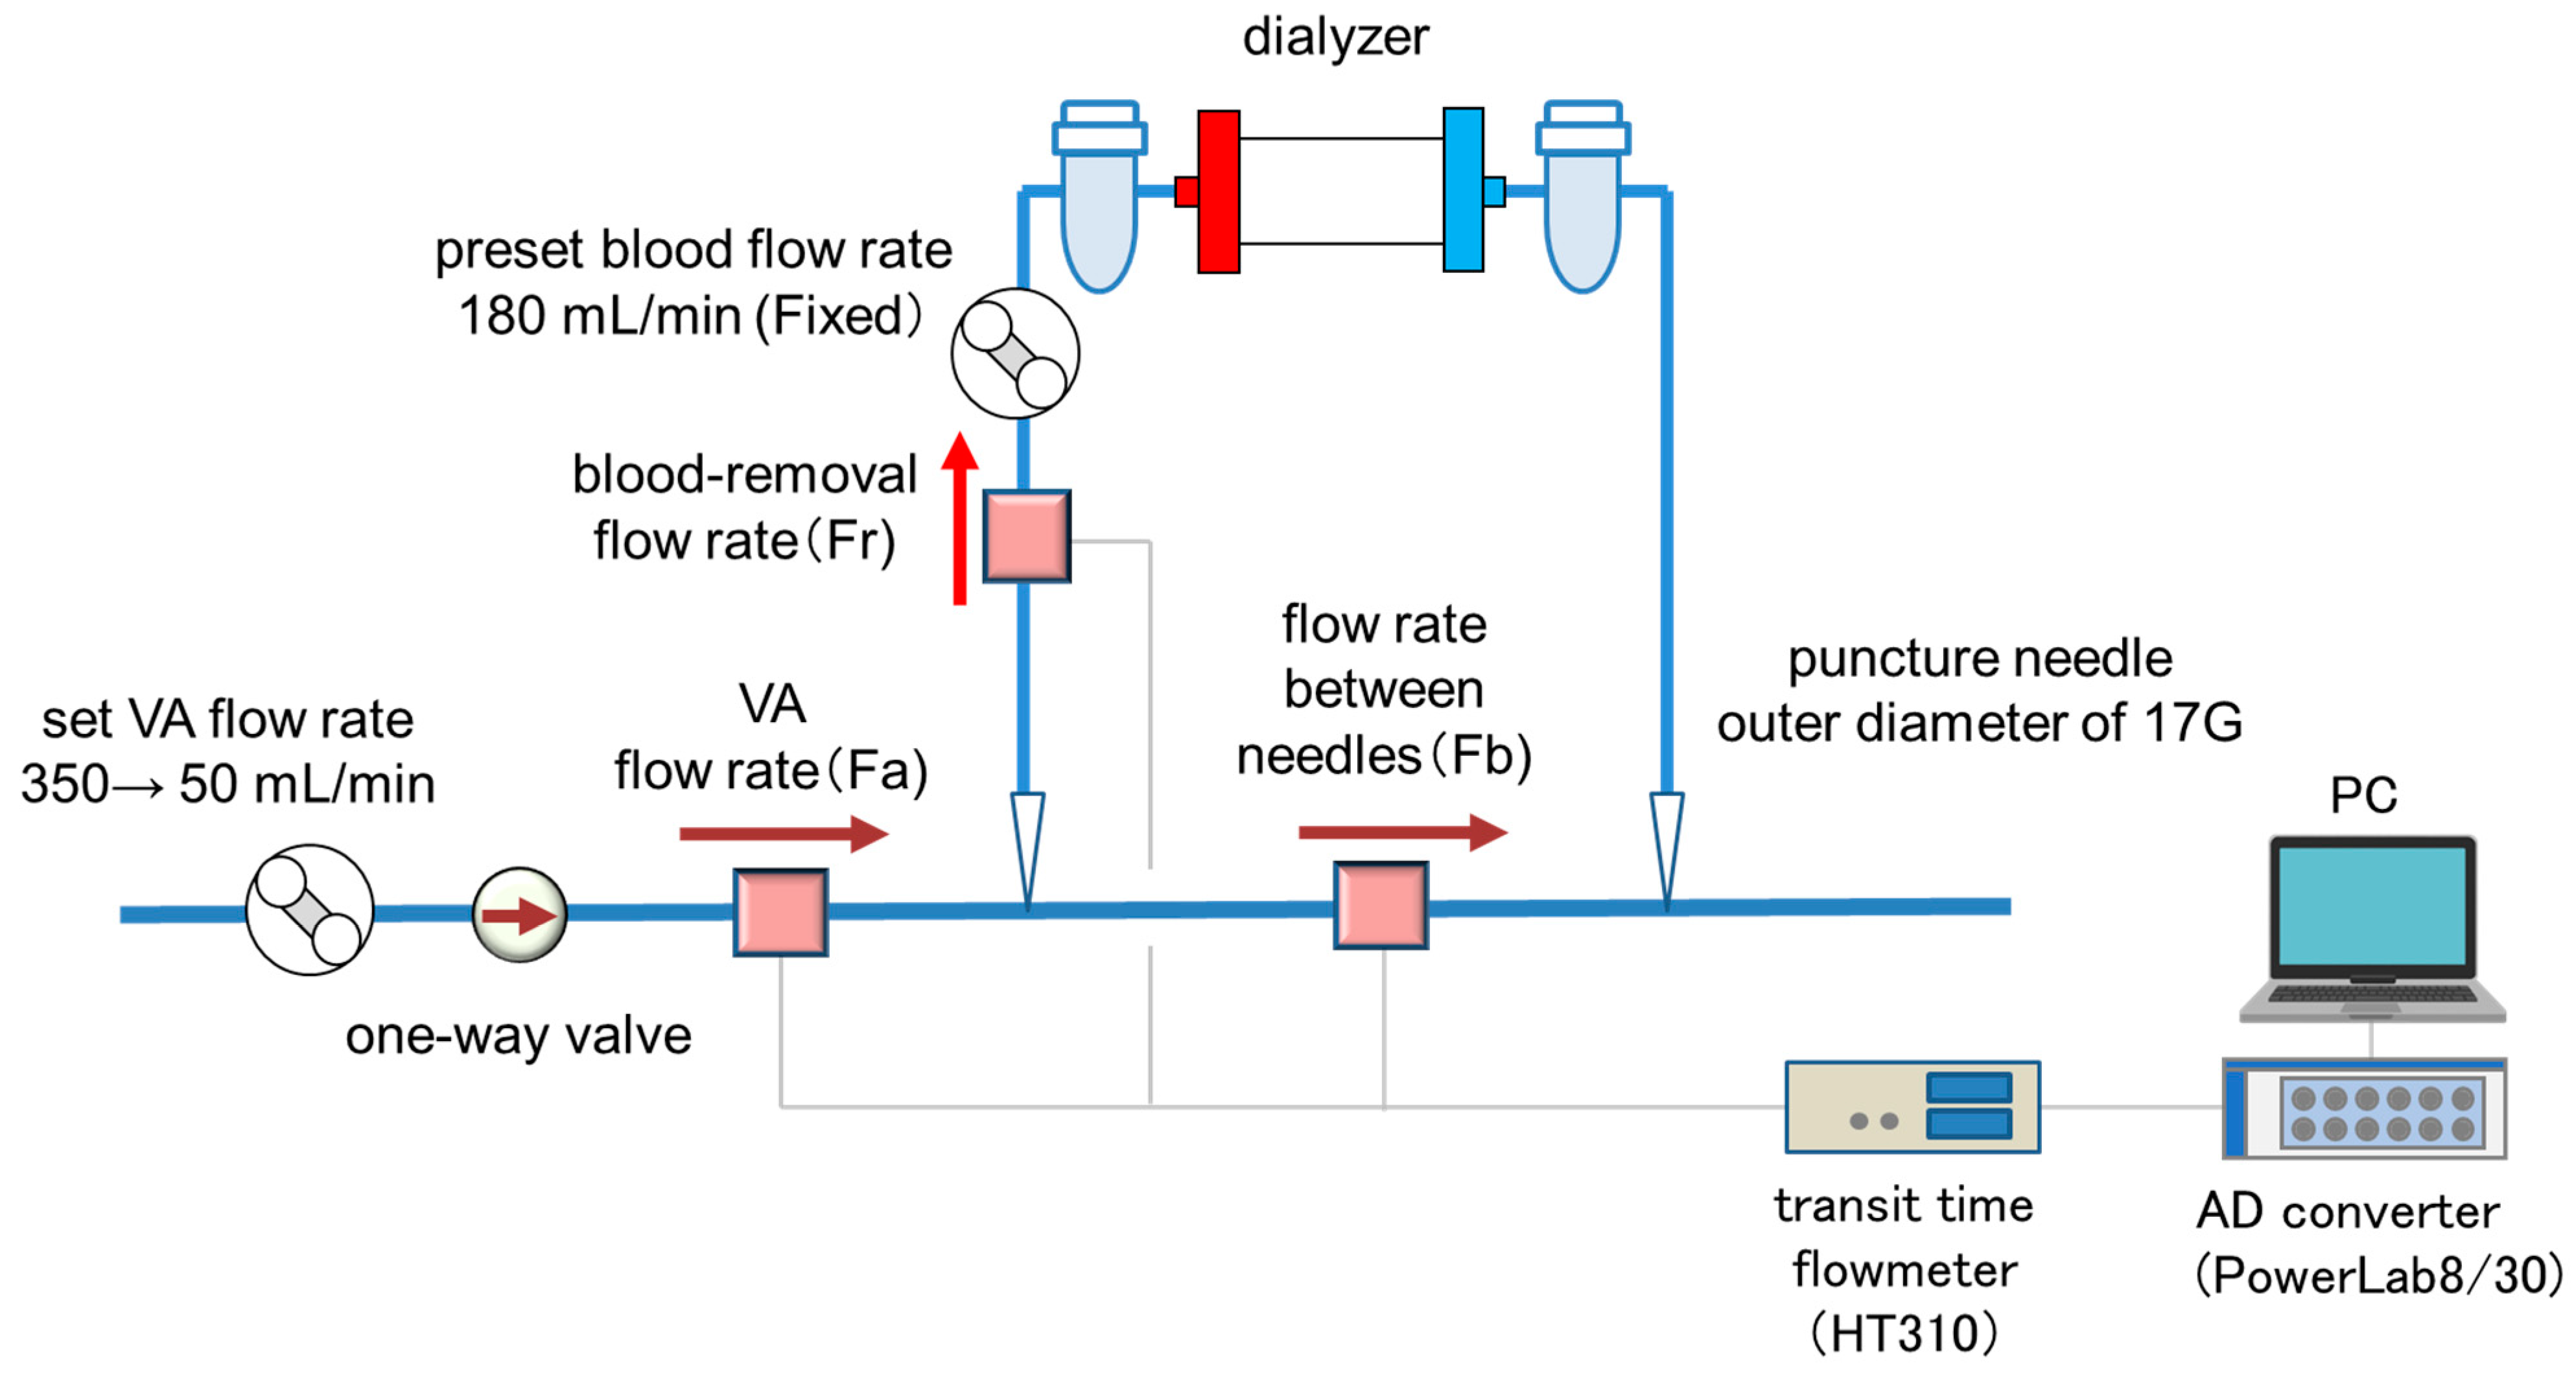
The experimental setup is shown in Figure 1. Pure water was used as perfusate instead of blood as a model fluid. A silicon tubing of 3.0 mm in the outer diameter (MGJG-3.0 mm, Monotaro, Hyogo, Japan) was used for the VA flow path model with a one-way valve (CV3030VP, AS ONE, Osaka, Japan) placed upstream of the blood-removal needle as the simulated VA stenosis. A dialysis machine (DCS-73, Nikkiso Co., Ltd., Tokyo, Japan) was used as the extracorporeal circulation circuit and for inducing VA pulsation (by the roller pump). A blood circuit for dialysis (AVP-8282, Nikkiso Co., Ltd., Tokyo, Japan) and a puncture needle with an outer diameter of 17G (Medicut Cannula with Clamping, Covidien Japan, Tokyo, Japan) were used. VA flow rate (Fa), blood-removal flow rate (Fr), and flow rate between needles (Fb) were measured by an ultrasonic transit time flowmeter (HT-310, Nihon Kohden Co, Tokyo, Japan). The measured flow-rate data were transferred to a computer via an AD converter (PowerLab 8/30, ADInstruments, Dunedin, New Zealand) and data analysis software (LabChart ver8.1.13, ADInstruments, Dunedin, New Zealand) at a sampling rate of 1 kHz.
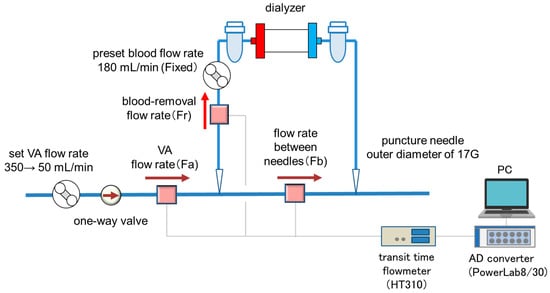
Figure 1.
The experimental setup.
2.2. Experimental Conditions and Methods for Calculating Actual Blood-Removal Flow and Recirculation Rate
The JSDT guideline defines “actual blood-removal flow drop” as “when puncture toward the anastomotic site results in multiple episodes of blood-removal flow rate of 180 mL/min or less”. Therefore, the preset blood-flow rate was fixed at 180 mL/min. The set VA flow rate was decreased stepwise from 350 to 50 mL/min, and the flow waveforms of Fa, Fr, and Fb were monitored. The actual blood-removal flow rate was calculated based on the integrated value of the Fr waveform and the recirculation rate by the following equation, based on the integrated value of the Fb backflow waveform and the actual blood-removal flow volume.
Recirculation Rate (%) = Integral value of Fb backflow/Actual blood flow volume × 100 (%)
3. Results
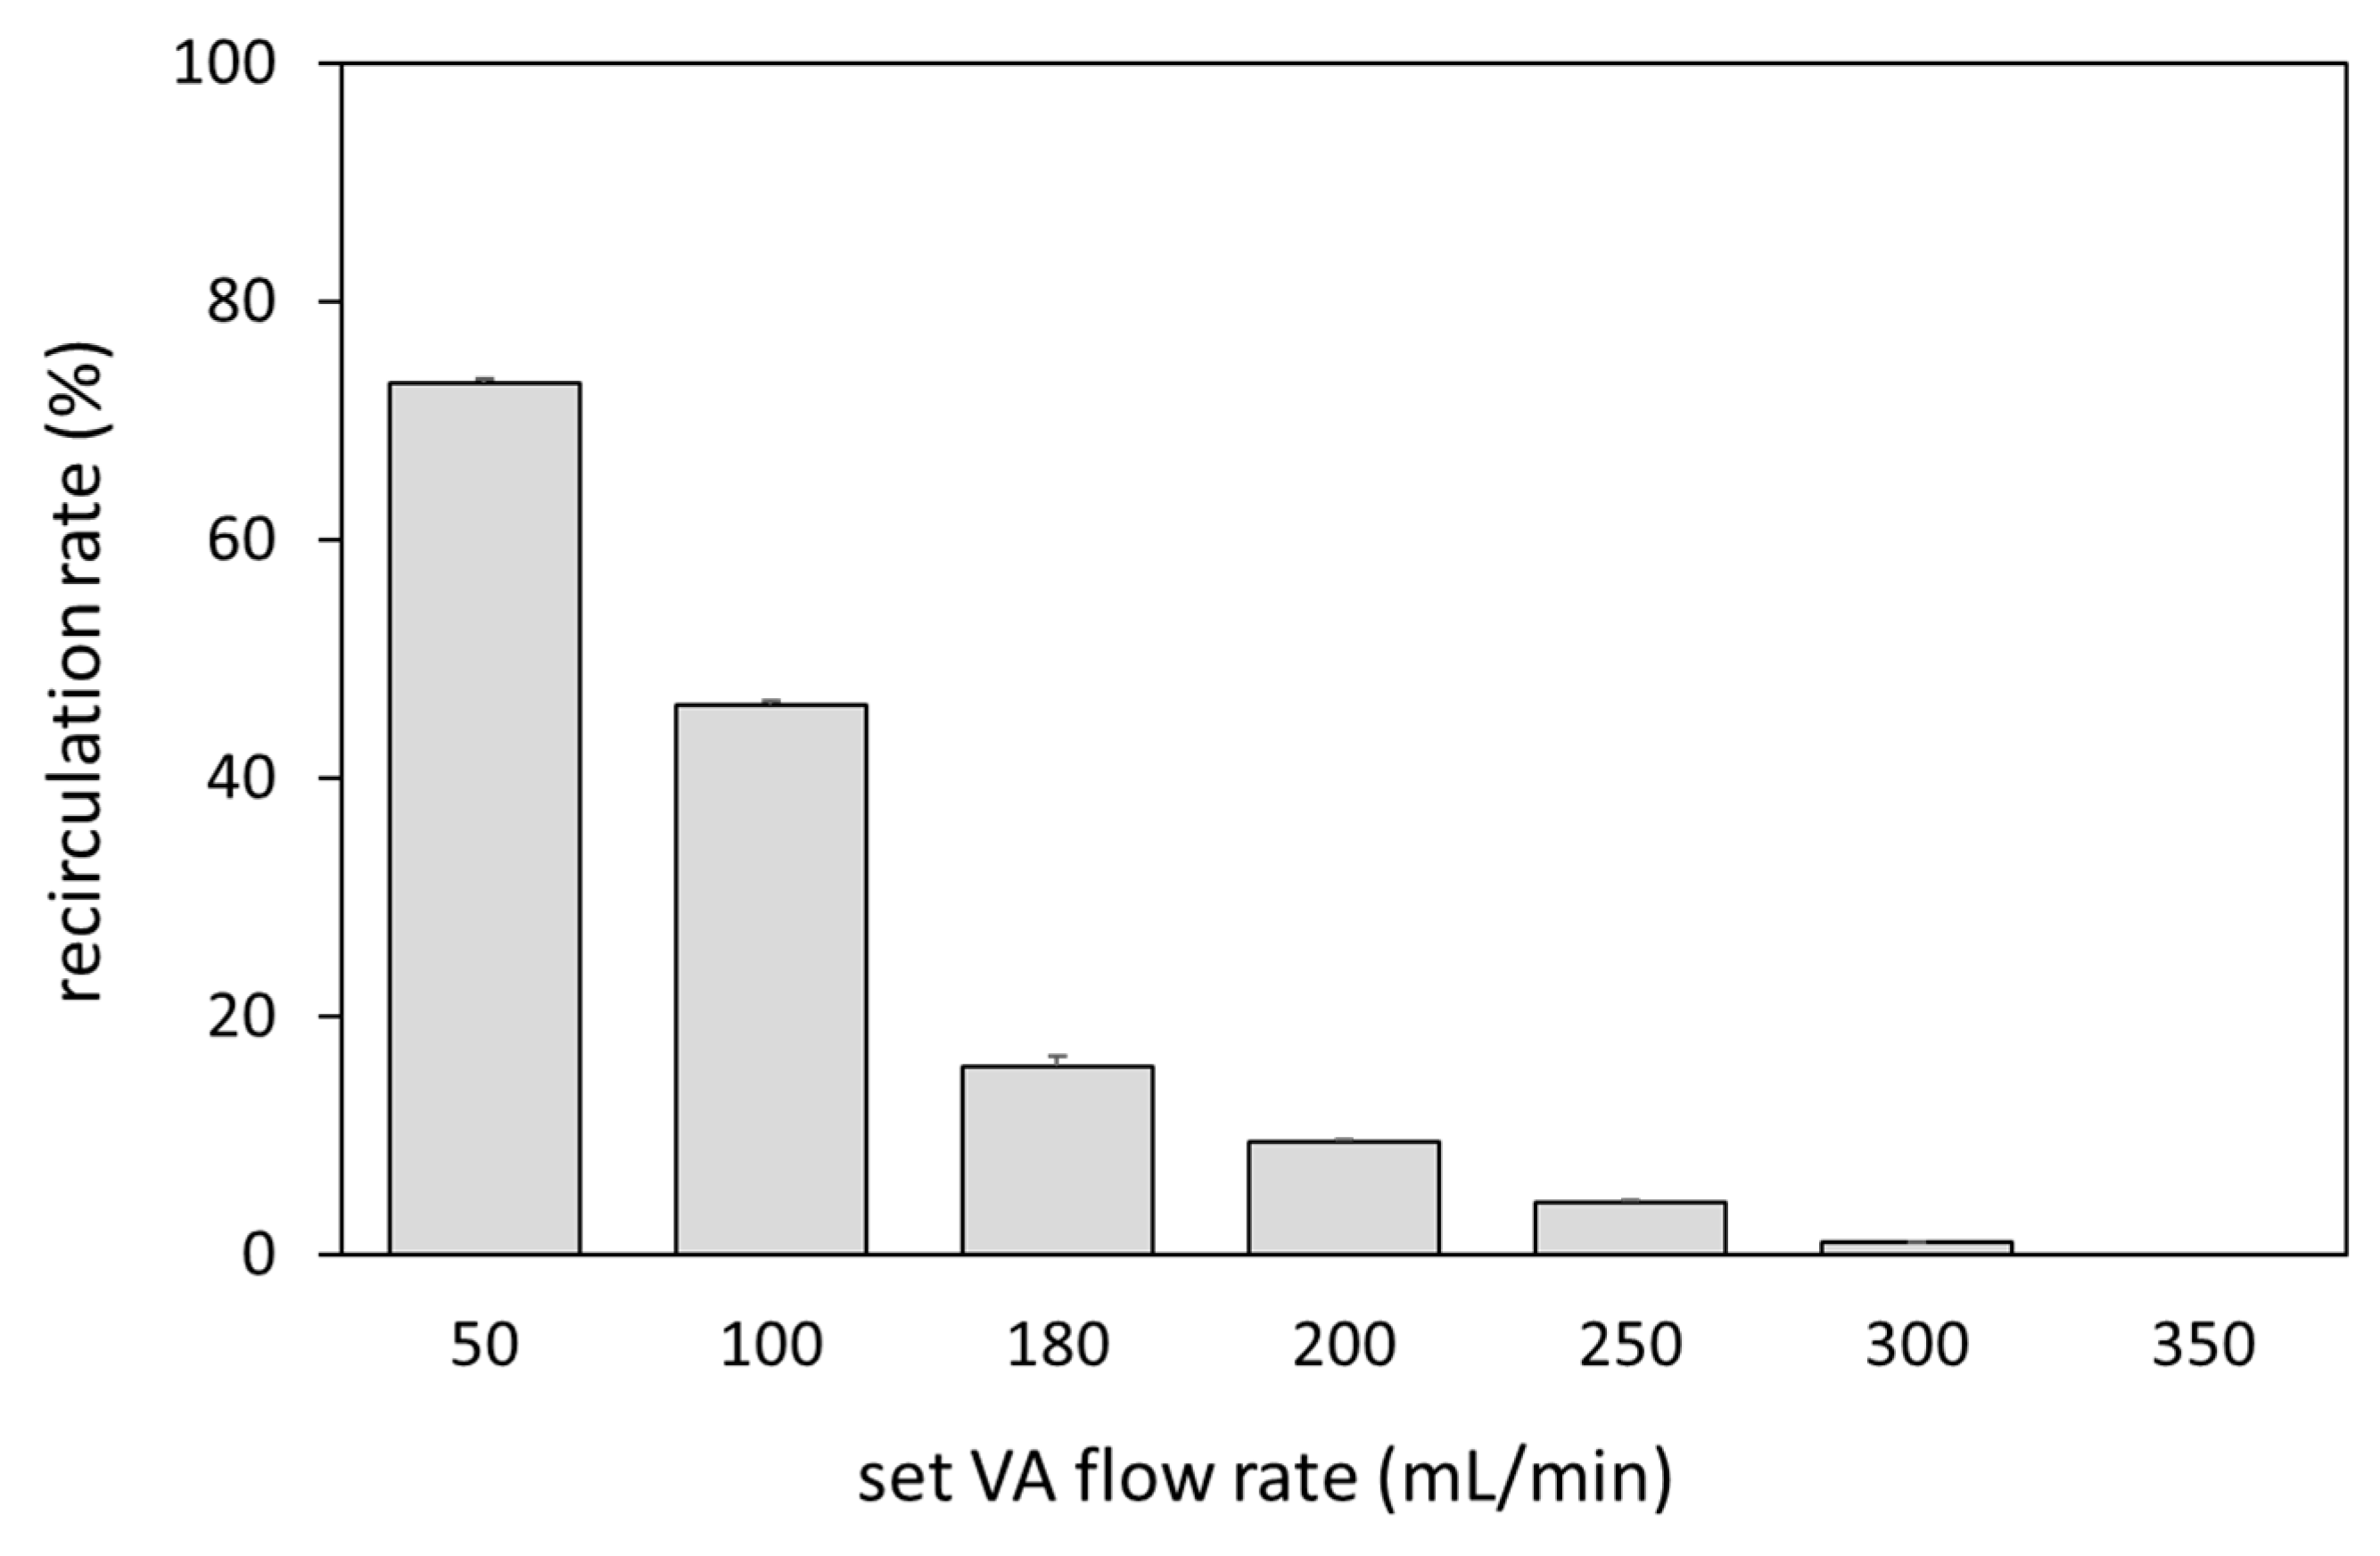
Figure 2 shows a comparison of the waveforms of Fa, Fr, and Fb at the set VA flow rate of 250 and 350 mL/min and at a preset blood flow rate of 180 mL/min. At 350 mL/min, the Fb waveform always showed positive values, while at 250 mL/min the reverse flow was observed in the Fb waveform. Focusing on the reverse flow of Fb, Fa showed a transiently smaller value than Fr due to the pulsation of the roller pump. The relationship between Fa and recirculation rate at the preset blood-flow rate of 180 mL/min is shown in Figure 3. Recirculation occurred at the VA flow rate < 300 mL/min, and the recirculation rate increased with decreasing VA flow rate. We observed that a transient drop in Fa due to the pulsation of the roller pump caused Fa to fall below Fr, resulting in an increase in recirculation rate.
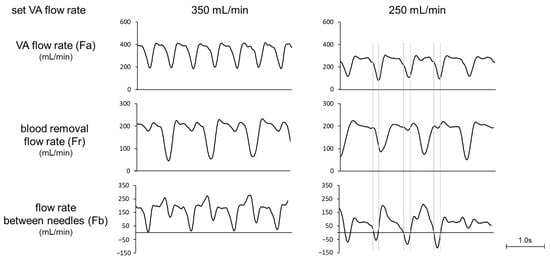
Figure 2.
Waveforms of VA flow rate, blood-removal flow rate, and flow rate between needles (set blood flow rate: 180 mL/min).

Figure 3.
Relationship between the VA flow rate and recirculation rate.
4. Discussion
Measurement of brachial artery blood flow (BAF) using ultrasonography is widely used as an index for therapeutic intervention of stenosis in AVF. However, the cutoff value of BAF as a criterion for therapeutic intervention varies widely, ranging from 350 to 612 mL/min [2,3,4,5]. One of the reasons is the different criteria for therapeutic intervention, such as detecting severe stenotic lesions, preventing thrombotic occlusion, and preventing decreased dialysis efficiency. The JSDT guidelines define stenosis intervention as a VA dysfunctional state in which the prescribed dialysis doses cannot be achieved.
Sato et al. reported that the threshold of BAF at which a decrease in actual blood flow occurs under the condition of a set blood-flow rate of 200 mL/min is 354 mL/min. According to this result, VA dysfunction was considered to occur at a BAF of 1.77 times the set blood-flow rate. The maximum set flow rate of the roller pump used as the driving source for VA flow in this study was 350 mL/min. Therefore, the experiment was conducted by fixing the set blood-flow rate at 180 mL/min, which is almost half of the VA flow rate. As a result, recirculation was observed at a VA flow rate of 300 mL/min. According to this result, VA dysfunction occurred at a VA flow rate 1.67 times higher than the set blood-flow rate, which is almost identical to the report by Sato et al. A statistical survey by the Japanese Society of Dialysis Therapy reported that the average set blood-flow rate for hemodialysis patients in Japan was 205 mL/min, and the average set blood-flow rate for HDF patients was 224 mL/min, indicating that the set blood-flow rate was higher in HDF patients than in HD patients [6]. On the other hand, in patients with electrolyte imbalance due to hypovolemia, it is necessary to reduce blood flow. Therefore, the cutoff value of BAF as a criterion for therapeutic intervention is expected to vary greatly depending on the set blood-flow rate.
In this study, we found that reverse flow occurred in Fb at the timing of the transient decrease in Fa, despite the lower Fr compared to Fa. In this result, it is highly important to focus on the waveform pattern rather than just the average value of Fa. The usefulness of BAF and RI as evaluation indices for VA stenosis has been reported in several previous studies. When VA stenosis occurs, BAF decreases, and RI increases (increase in systolic BAF and decrease in diastolic BAF). As stenosis progresses, the systolic BAF waveform becomes steeper and shorter, and the diastolic BAF is reduced and prolonged. Therefore, we speculate that when diastolic BAF decreases to the level below the preset blood-flow rate, recirculation or decreased actual blood-removal flow would occur. Alessandro et al. reported that the use of Qx, the index of BAF divided by RI, is strongly associated with detection of stenosis and thrombotic risk in AVF cases [7]. Thus, the combination of both mean BFA and waveform pattern is expected to provide new insights into VA dysfunction. To verify this hypothesis, we need to investigate the relationship between diastolic BAF, actual blood-removal flow, and recirculation in clinical practice. Ion dialysate monitors [8] and blood temperature monitors [9] may be useful to verify the relationship between VA flow rate and dialysis efficiency during dialysis treatment. In addition, ultrasonography can also be used to confirm reflux in the VA flow waveform between the two puncture needles.
Two limitations of this study are that 1. Fa is not equal to BAF, and 2. a roller pump was used as the driving source for the VA flow model. First, BAF is equal to Fa because the puncture needles for blood-removal and blood delivery were placed in one vessel in this study. Marques et al. reported that BAF using ultrasonography correlated with Fa, but Fa was slightly lower than BAF [10]. In particular, if a branch is present upstream of the puncture on the bleeding-out side, the Fa is even lower than the BAF. Therefore, the present experimental results cannot be used to determine the threshold of BAF required to prevent VA dysfunction. Secondly, the roller pump might not adequately reproduce the decrease in diastolic BAF associated with stenosis. Therefore, in this model, recirculation was confirmed even at the set VA flow rate of 300 mL/min or lower, while it was suggested that recirculation might occur at a higher BAF in clinical cases. Although a higher percentage of VA dysfunction in clinical reports is caused by decreased actual blood-removal flow rather than recirculation [11], in this study, actual blood-removal flow was not reduced and only recirculation was observed. In this study, the one-way valve was installed upstream of the puncture needle on the blood-removal side. We thus speculate that negative pressure in the blood-removal side caused backflow from the return side to the blood-removal side, leading to recirculation. On the other hand, in clinical practice, it is known that a decrease in VA function is more likely to cause a reduction in actual blood-removal flow than recirculation. The cause of recirculation in the present study may be the difference in the characteristics of the vascular model used for the VA flow path model. In this experiment, a silicon tube with an outer diameter of 3.0 mm was used as the vascular model. Since this tube does not easily collapse when negative pressure is generated, we believe that a decrease in actual blood-removal flow did not occur, and recirculation occurred. In contrast, venous blood vessels tend to collapse due to the negative pressure generated at the puncture needles on the blood-removal sides. As a result, it is thought that a decrease in actual blood-removal flow rate is more likely to occur than recirculation occurs. Accordingly, further study is needed to construct a new VA flow path model that simulates the change in BAF pattern and venous valves with the progression of VA stenosis.
5. Conclusions
It is suggested that VA dysfunction occurs when flow pulsation causes diastolic BAF to fall below the preset blood flow. Further study is needed to investigate the relationship between diastolic BAF and preset blood-flow rate as a possible evaluation index of VA stenosis in ultrasonography.
Author Contributions
Conceptualization, J.-i.O. and Y.O.; investigation, J.-i.O.; data curation, T.O. and J.-i.O.; writing—original draft preparation, J.-i.O.; writing—review and editing, J.-i.O., Y.O. and S.M.; visualization, J.-i.O.; project administration, J.-i.O.; funding acquisition, J.-i.O. All authors have read and agreed to the published version of the manuscript.
Funding
This work was supported by Kawasaki University of Medical Welfare Research Grant, 2012.
Institutional Review Board Statement
Not applicable.
Informed Consent Statement
Not applicable.
Data Availability Statement
The data presented in this study are available on request from the corresponding author. This data is not publicly available as it contains additional information presented in the future.
Conflicts of Interest
The authors declare no conflict of interest.
References
- Kukita, K.; Ohira, S.; Amano, I.; Naito, H.; Azuma, N.; Ikeda, K.; Kanno, Y.; Satou, T.; Sakai, S.; Sugimoto, T.; et al. 2011 update Japanese Society for Dialysis Therapy Guidelines of Vascular Access Construction and Repair for Chronic Hemodialysis. Ther. Apher. Dial. 2015, 19 (Suppl. 1), 1–39. [Google Scholar] [CrossRef] [PubMed]
- Ogawa, T.; Matsumura, O.; Matsuda, A.; Hasegawa, H.; Mitarai, T. Brachial artery blood flow measurement: A simple and non-invasive method to evaluate the need for arteriovenous fistula repair. Dial. Transpl. 2011, 40, 206–210. [Google Scholar] [CrossRef]
- Sato, T.; Tsuboi, M.; Onogi, T.; Miwa, N.; Sakurai, H.; Ookubo, K.; Matsubara, C.; Kasuga, H. Standard Procedures of Endovascular Treatment for Vascular Access Stenosis in our Facility—Clinical Usefulness of Ultrasonography. J. Vasc. Access 2015, 16 (Suppl. 10), S34–S37. [Google Scholar] [CrossRef] [PubMed]
- Cho, S.; Lee, Y.-J.; Kim, S.-R. Value of Doppler evaluation of physically abnormal fistula: Hemodynamic guidelines and access outcomes. Korean J. Intern. Med. 2019, 34, 137–145. [Google Scholar] [CrossRef] [PubMed] [Green Version]
- Ishii, T.; Suzuki, Y.; Nakayama, T.; Ohmori, M.; Masai, S.; Sasagawa, N.; Ohyama, K. Duplex ultrasound for the prediction of vascular events associated with arteriovenous fistulas in hemodialysis patients. J. Vasc. Access 2016, 17, 499–505. [Google Scholar] [CrossRef] [PubMed]
- Nitta, K.; Abe, M.; Masakane, I.; Hanafusa, N.; Taniguchi, M.; Hasegawa, T.; Nakai, S.; Wada, A.; Hamano, T.; Hoshino, J.; et al. Annual dialysis data report 2018, JSDT Renal Data Registry: Dialysis fluid quality, hemodialysis and hemodiafiltration, peritoneal dialysis, and diabetes. Ren. Replace. Ther. 2020, 6, 51. [Google Scholar] [CrossRef]
- Colombo, A.; Provenzano, M.; Rivoli, L.; Donato, C.; Capria, M.; Leonardi, G.; Chiarella, S.; Andreucci, M.; Fuiano, G.; Bolignano, D.; et al. Utility of Blood Flow/Resistance Index Ratio (Q x) as a Marker of Stenosis and Future Thrombotic Events in Native Arteriovenous Fistulas. Front. Surg. 2021, 7, 604347. [Google Scholar] [CrossRef] [PubMed]
- Maduell, F.; Vera, M.; Arias, M.; Serra, N.; Blasco, M.; Bergadá, E.; Fontsere, N.; Cases, A.; Campistol, J.M. Influence of the ionic dialysance monitor on Kt measurement in hemodialysis. Am. J. Kidney Dis. 2008, 52, 85–92. [Google Scholar] [CrossRef] [PubMed]
- Lee, J.Y.; Park, E.J.; Chang, J.H.; Han, B.G.; Kim, G.H. Use of blood temperature monitor with Twister device for the surveillance of vascular access in maintenance hemodialysis: Comparison with Doppler ultrasonography. J. Vasc. Access 2021, 22, 218–224. [Google Scholar] [CrossRef] [PubMed]
- Marques, M.G.; Ibeas, J.; Botelho, C.; Maia, P.; Ponce, P. Doppler Ultrasound: A Powerful Tool for Vascular Access Surveillance. Semin. Dial. 2014, 28, 206–210. [Google Scholar] [CrossRef] [PubMed]
- Coyne, D.W.; Delmez, J.; Spence, G.; Windus, D.W. Impaired delivery of hemodialysis prescriptions: An analysis of causes and an approach to evaluation. J. Am. Soc. Nephrol. 1997, 8, 1315–1318. [Google Scholar] [CrossRef] [PubMed]

Publisher’s Note: MDPI stays neutral with regard to jurisdictional claims in published maps and institutional affiliations. |
© 2022 by the authors. Licensee MDPI, Basel, Switzerland. This article is an open access article distributed under the terms and conditions of the Creative Commons Attribution (CC BY) license (https://creativecommons.org/licenses/by/4.0/).