
Baseline Electroencephalogram and Its Evolution after Activation of Dopaminergic System by Apomorphine in Middle-Aged 5XFAD Transgenic Mice, a Model of Alzheimer’s Disease

 , and
, and 
Abstract
:1. Introduction
2. Materials and Methods
2.1. Electrodes Implantation and EEG Recording
2.2. Computation of EEG Frequency Spectra
2.3. Statistics
3. Results
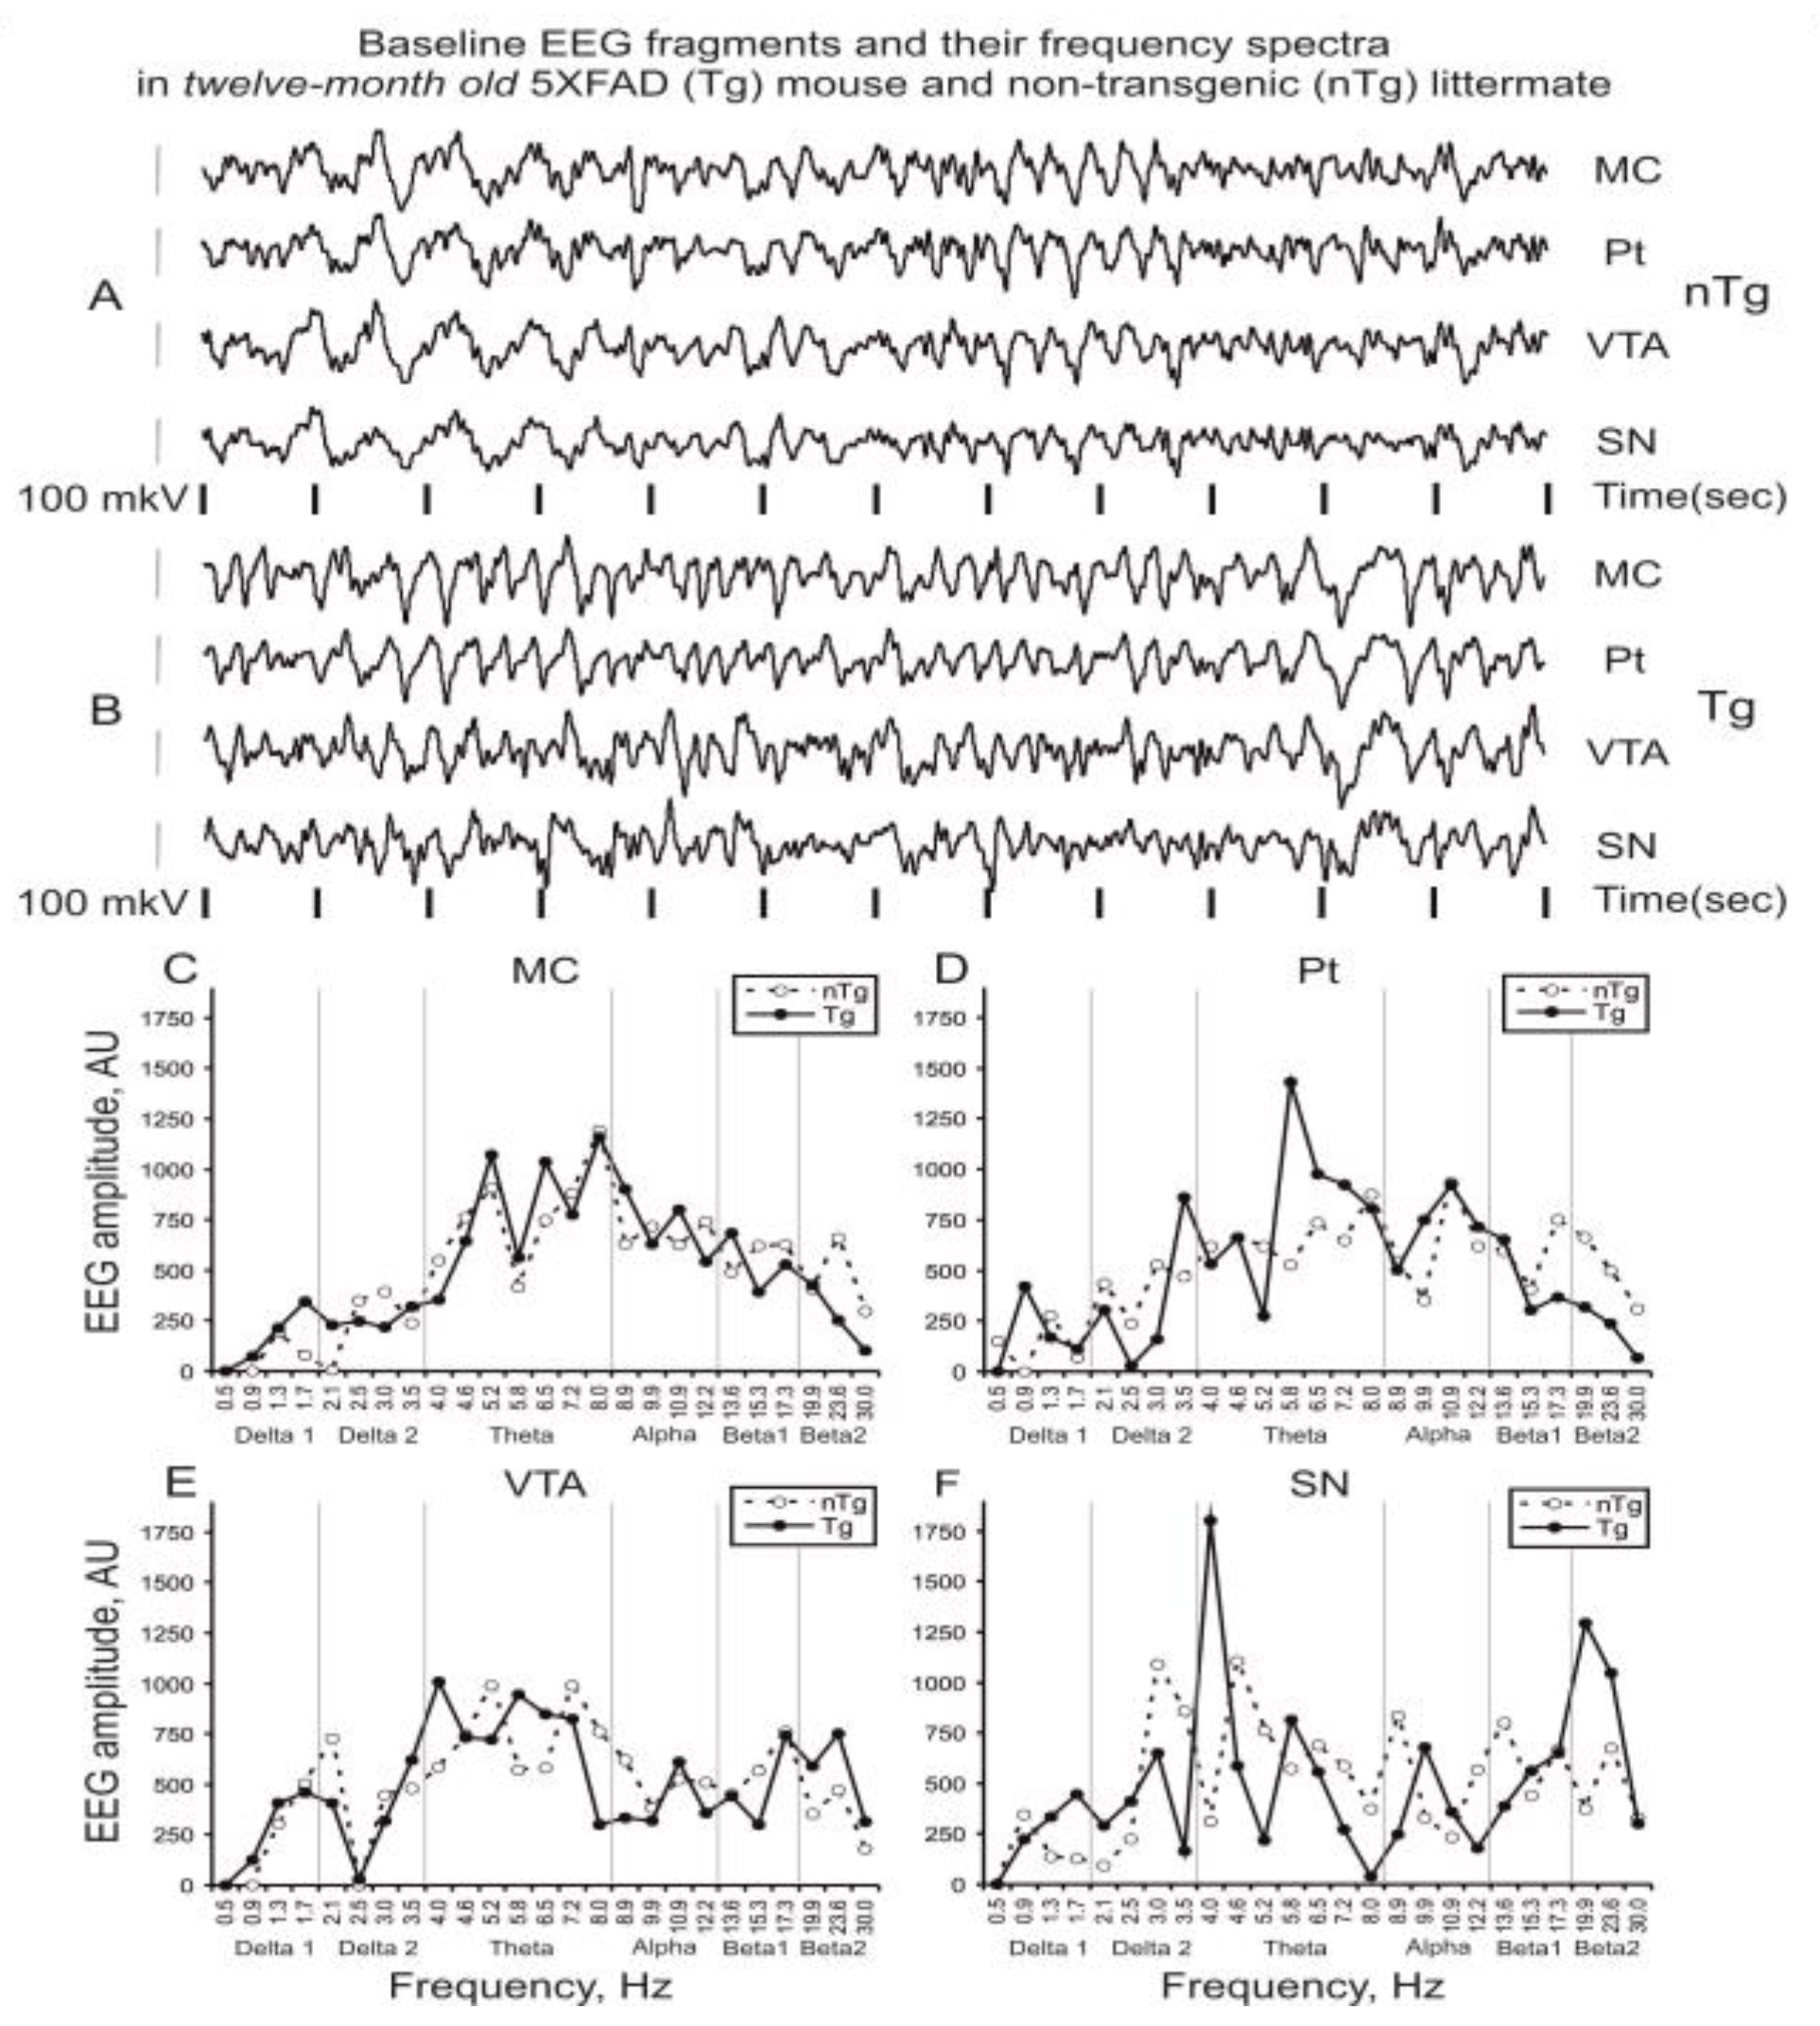
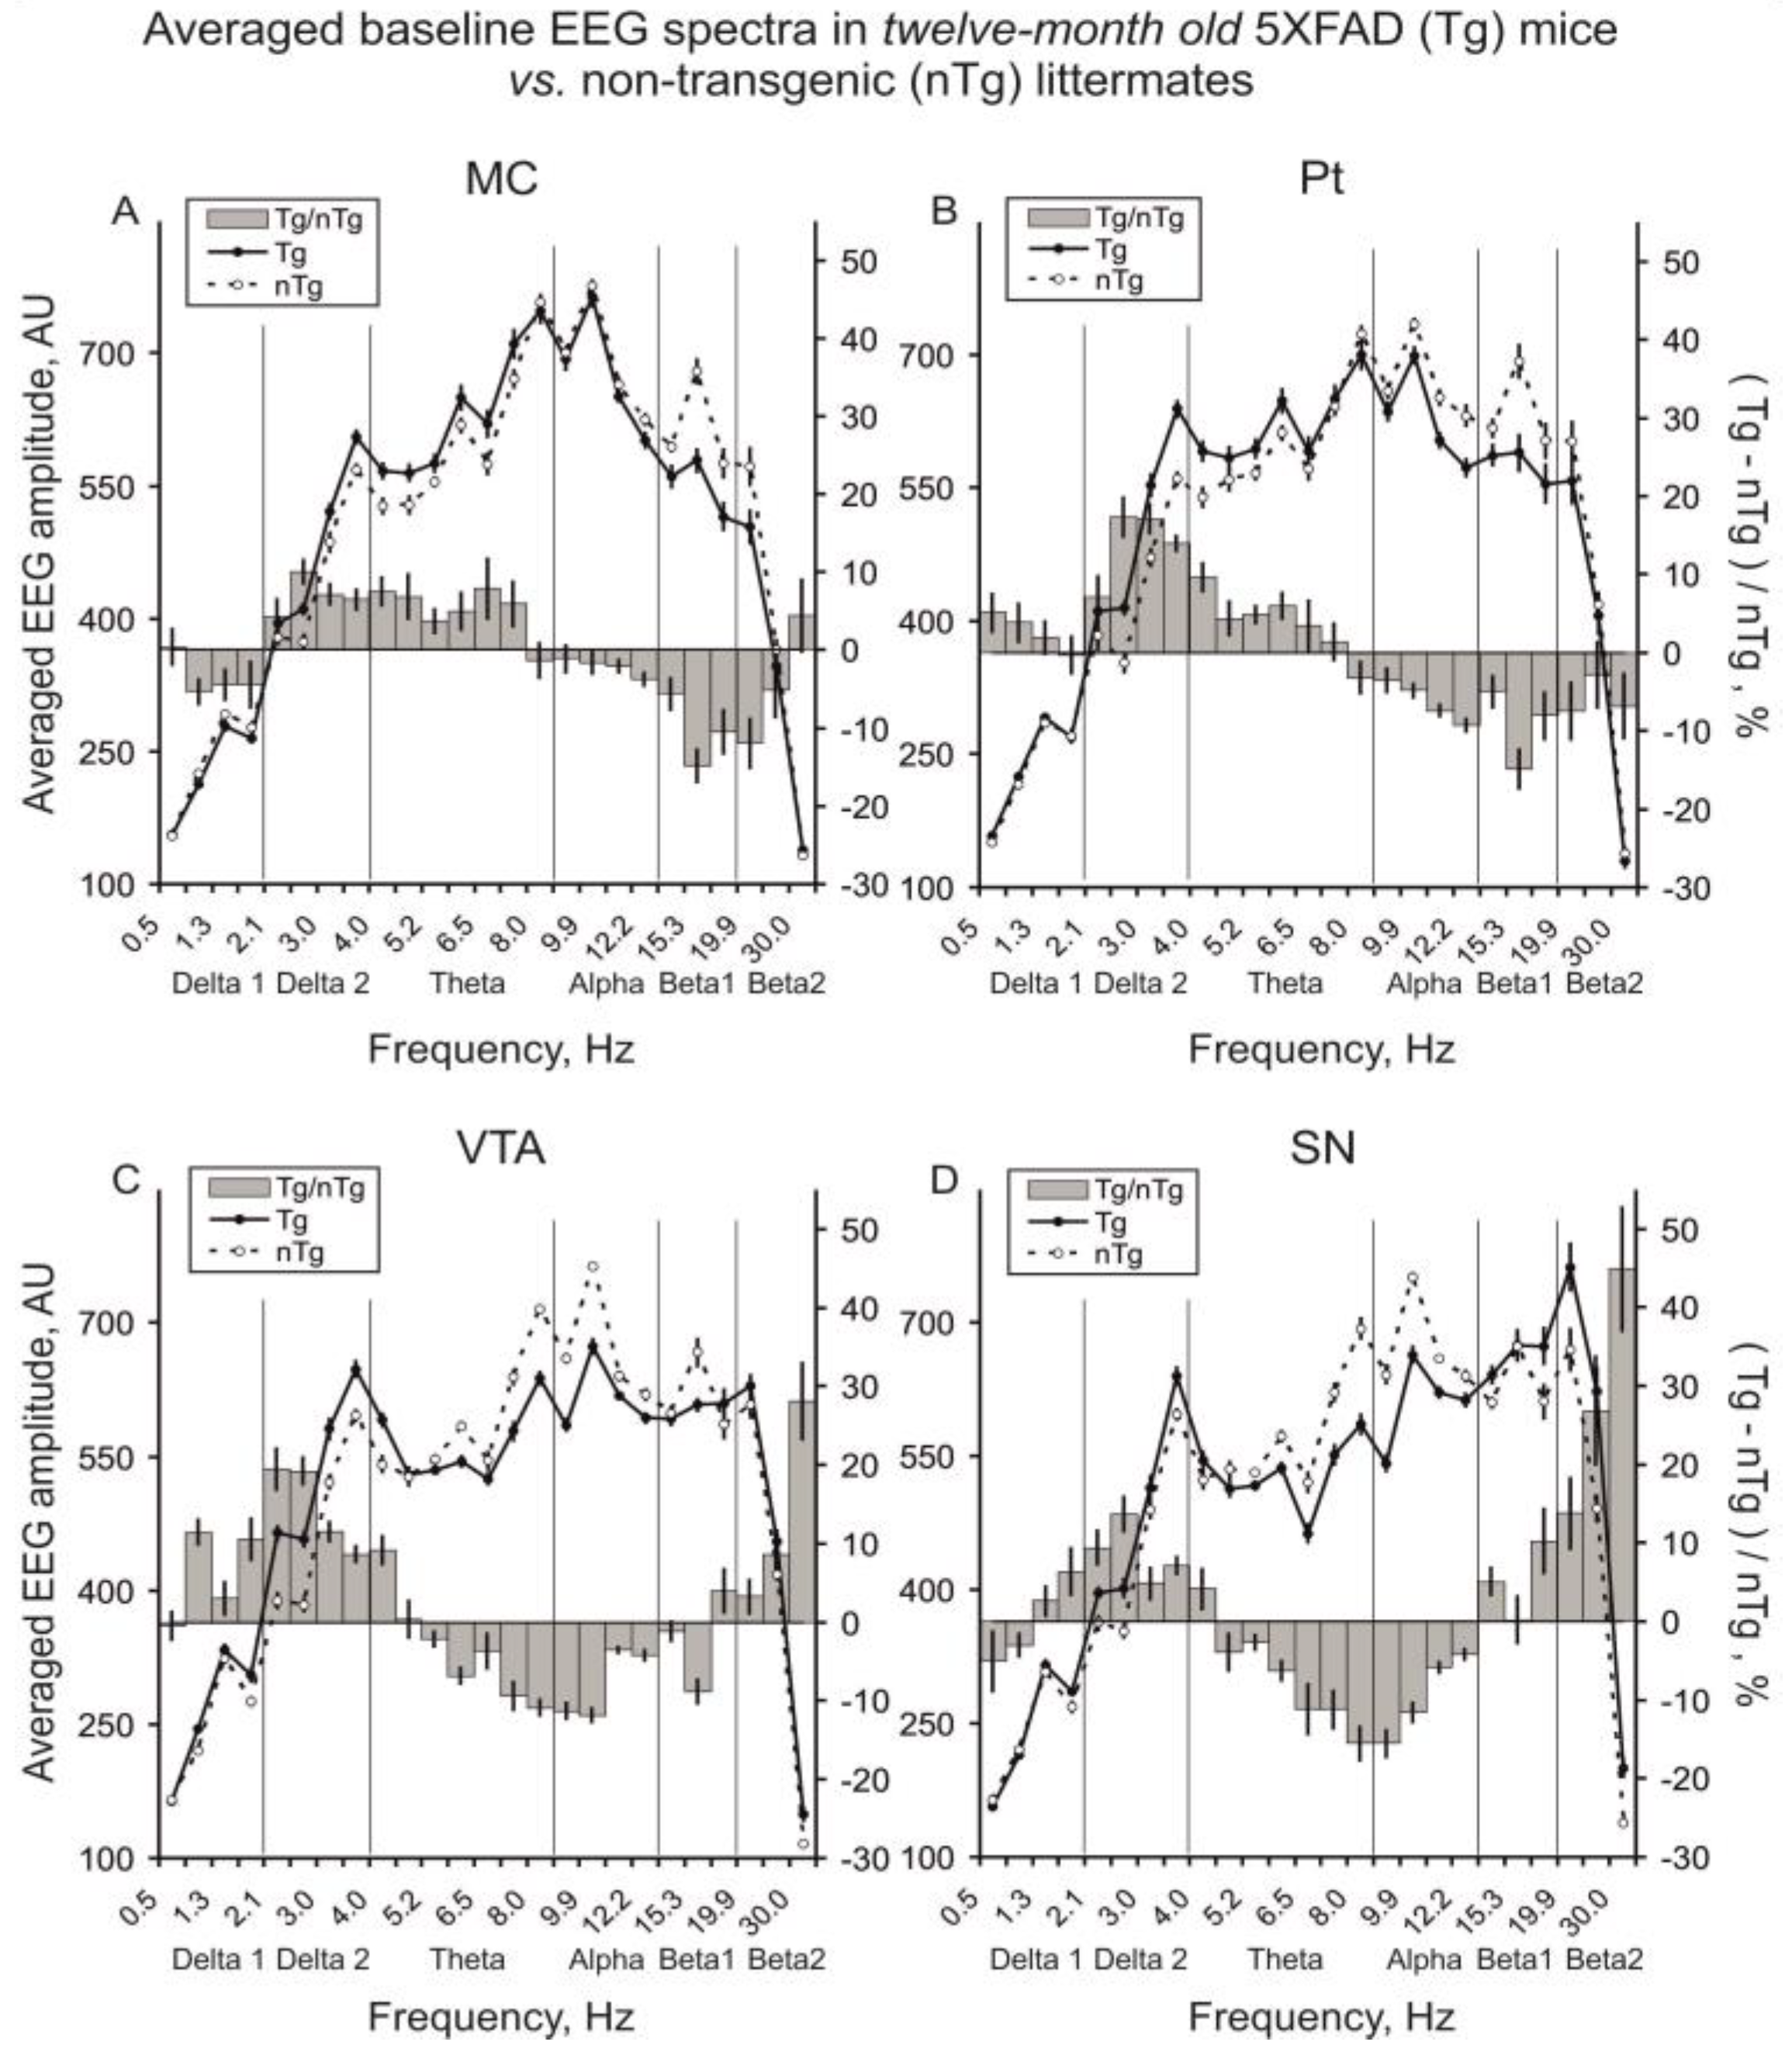
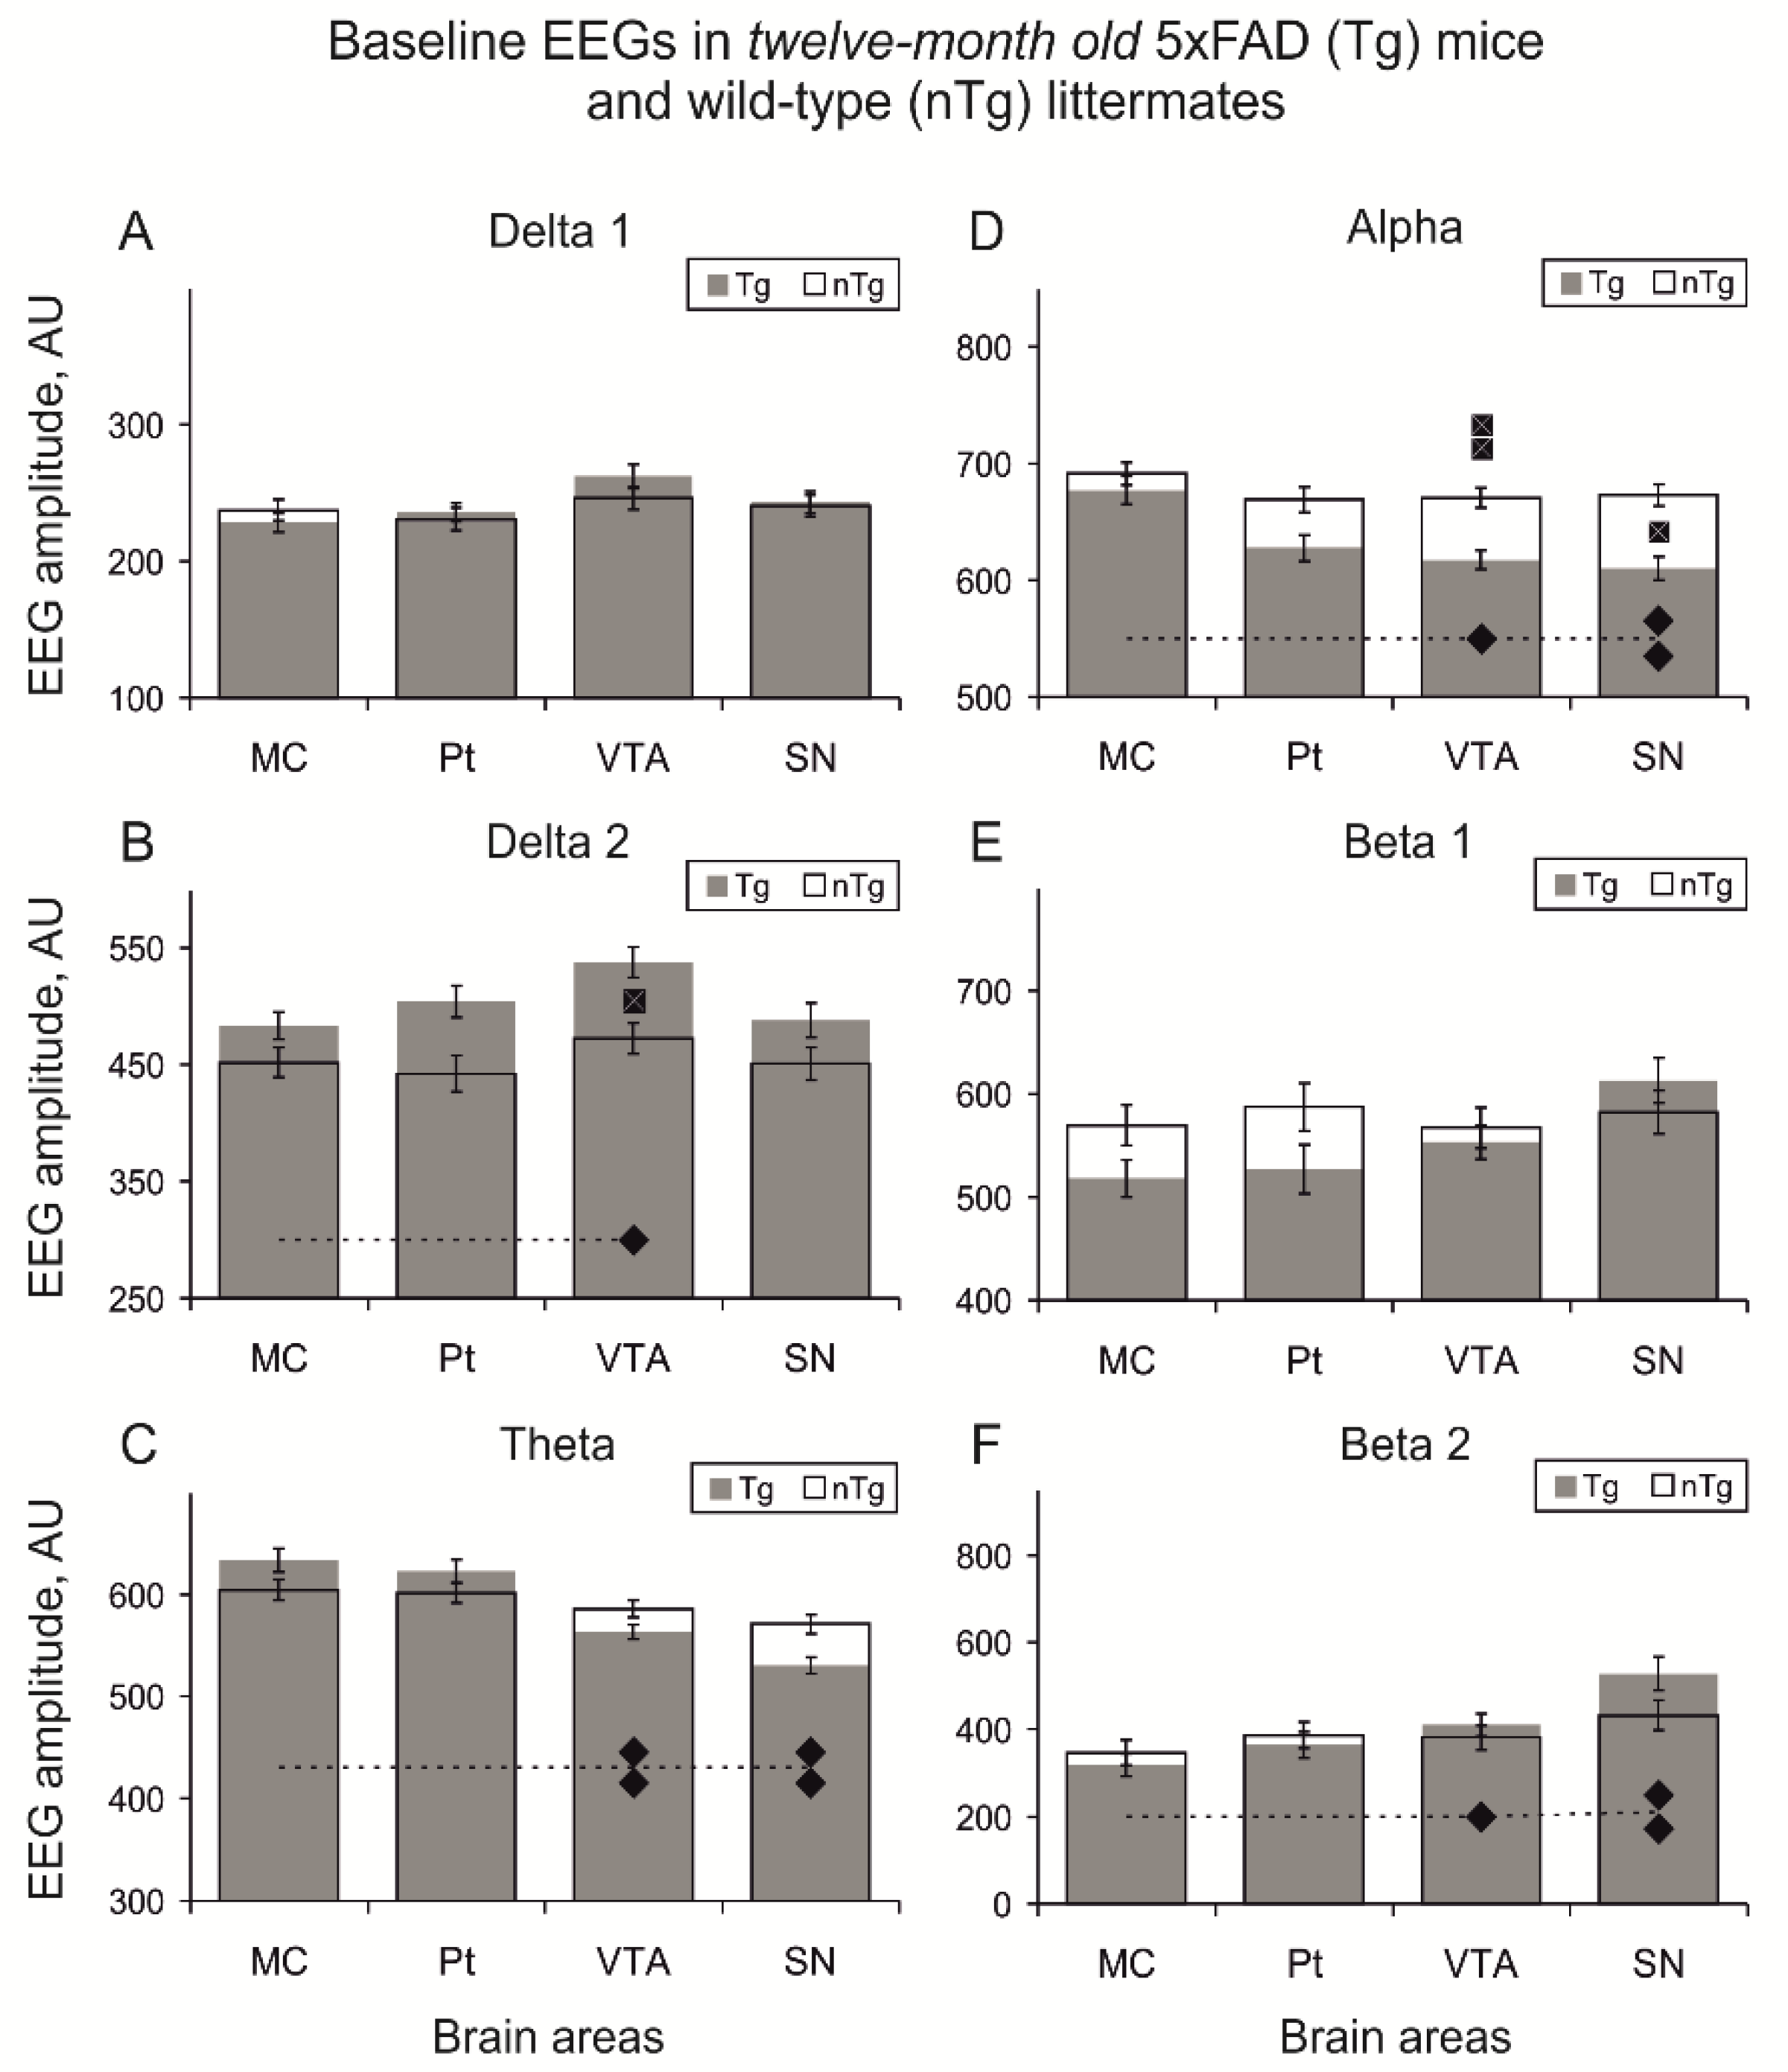
3.1. Baseline EEG
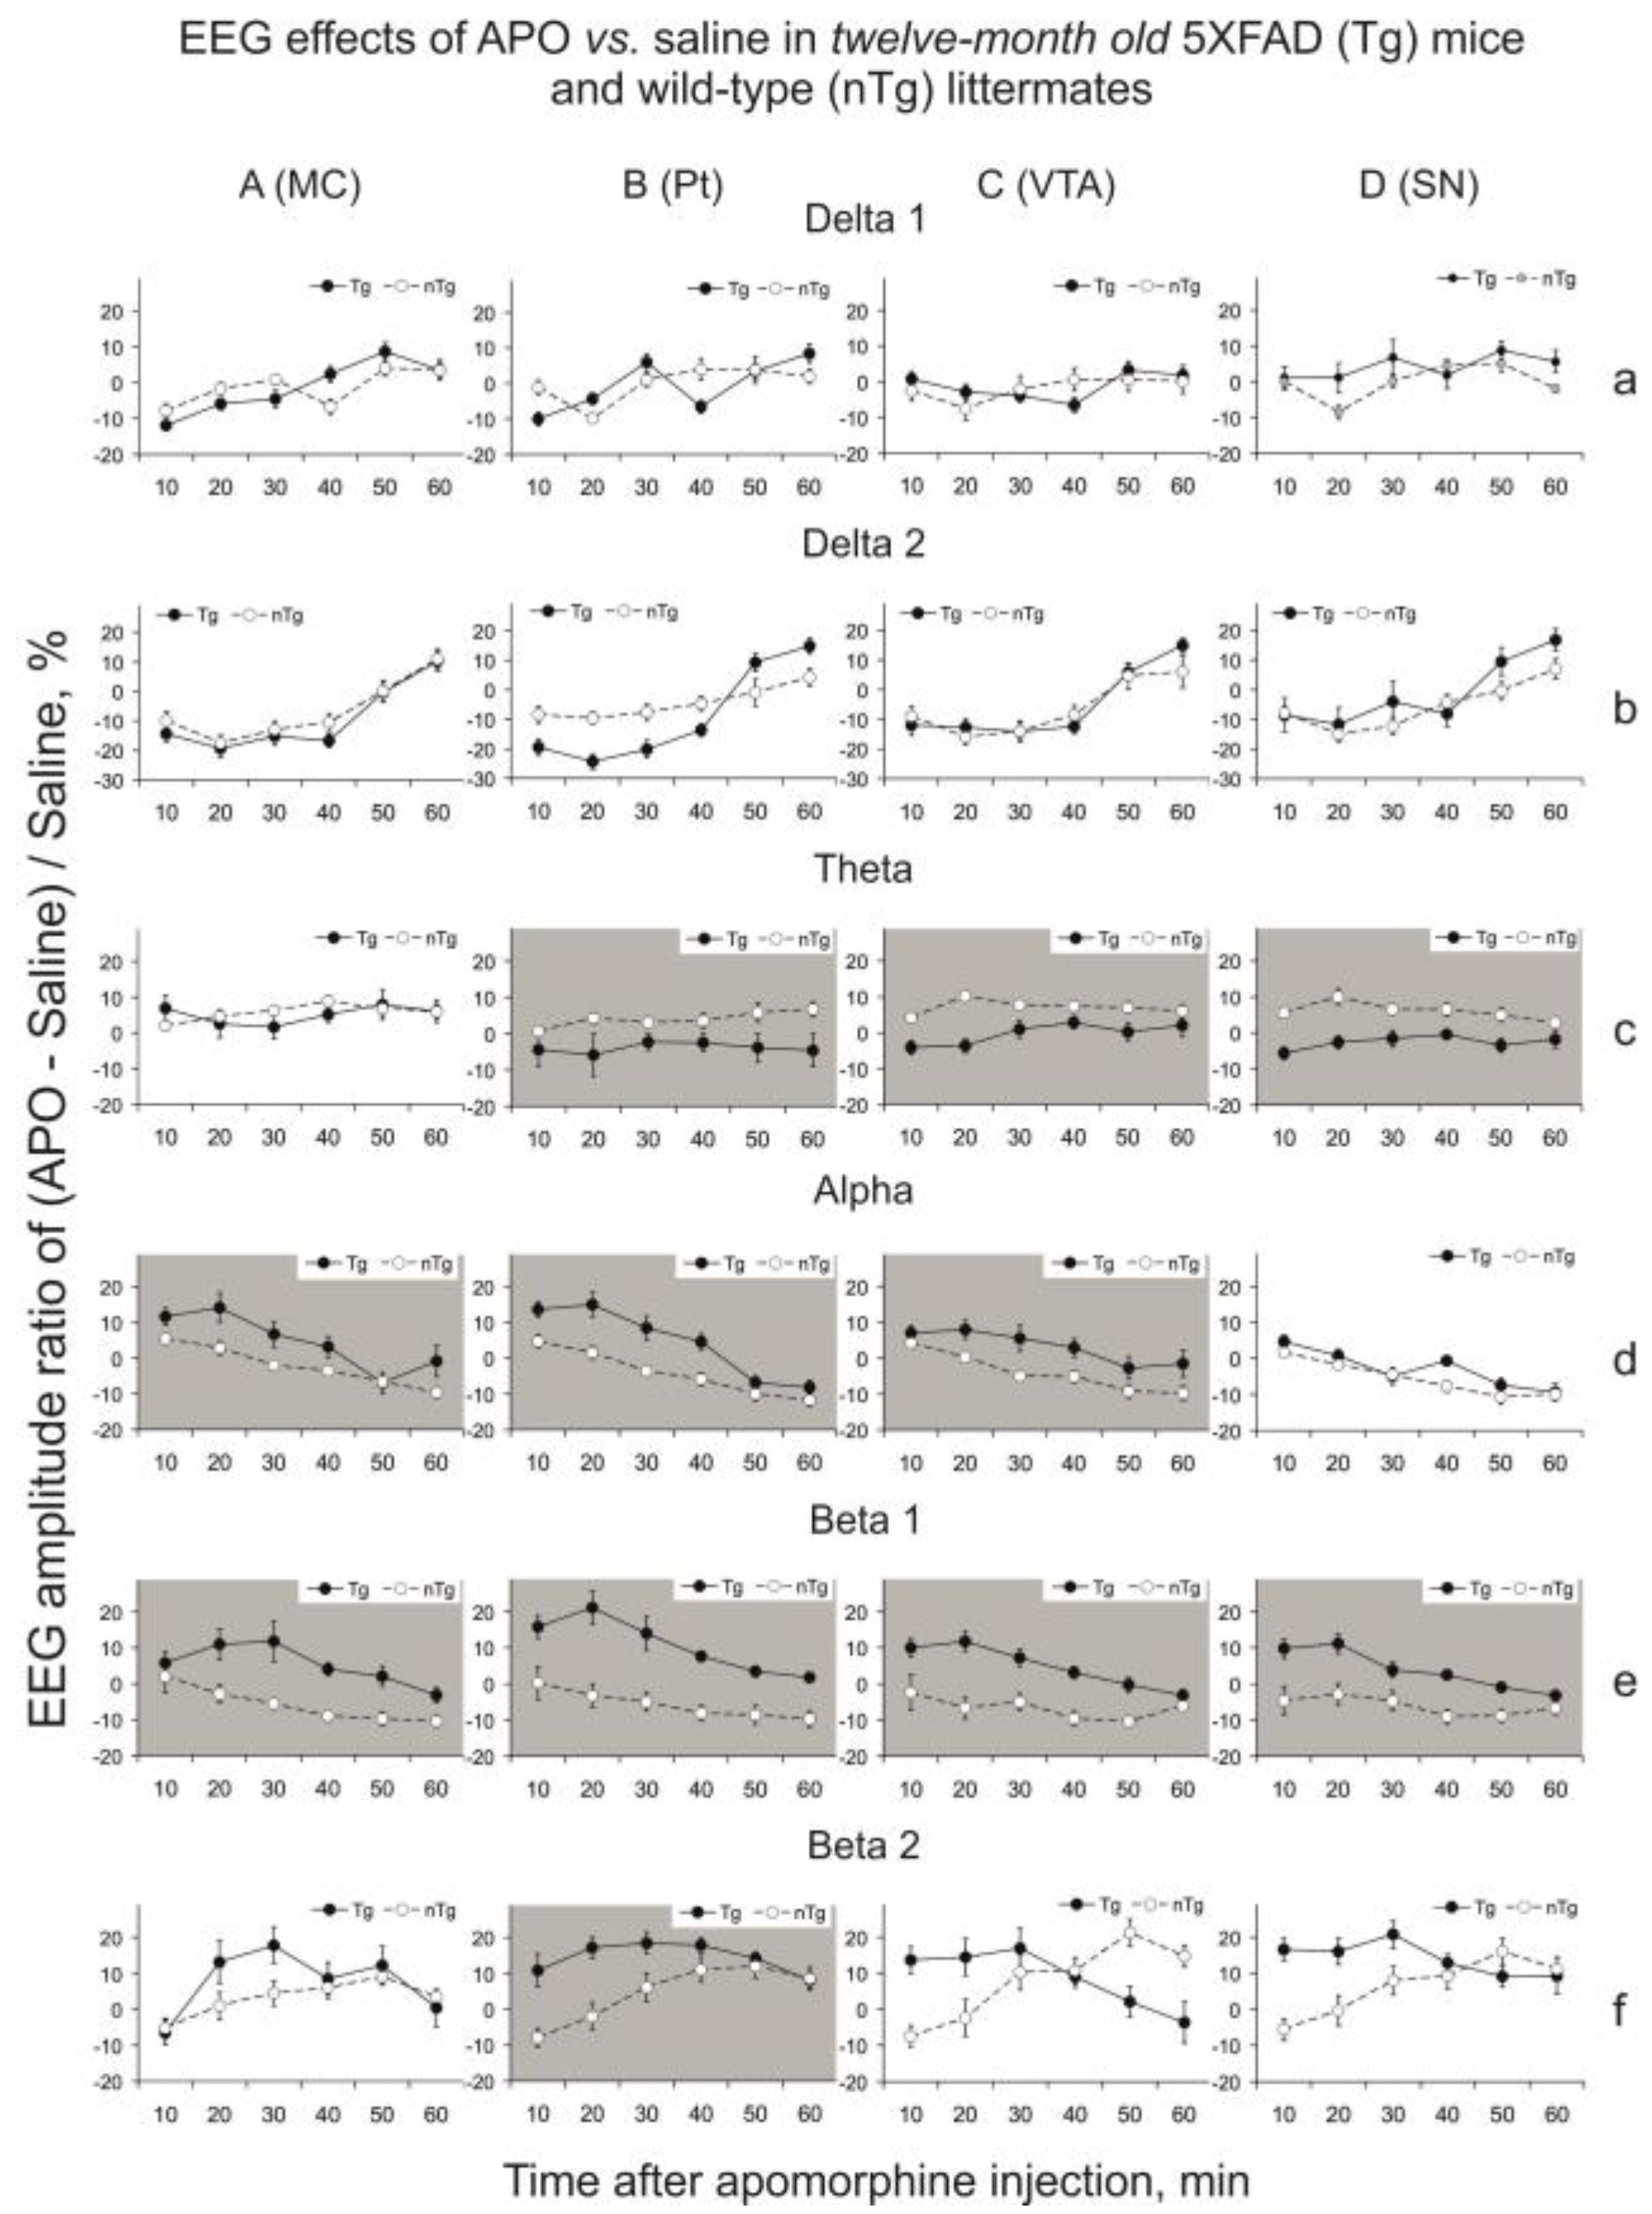
3.2. Apomorphine Effects
4. Discussion
4.1. Baseline EEG
4.2. Apomorphine Effects
5. Conclusions
Supplementary Materials
Author Contributions
Funding
Institutional Review Board Statement
Informed Consent Statement
Data Availability Statement
Acknowledgments
Conflicts of Interest
References
- Peng, S.; Zeng, L.; Haure-Mirande, J.V.; Wang, M.; Huffman, D.M.; Haroutunian, V.; Ehrlich, M.E.; Zhang, B.; Tu, Z. Transcriptomic Changes Highly Similar to Alzheimer’s Disease Are Observed in a Subpopulation of Individuals during Normal Brain Aging. Front. Aging Neurosci. 2021, 13, 711524. [Google Scholar] [CrossRef] [PubMed]
- Wang, P.; Zhou, B.; Yao, H.; Zhan, Y.; Zhang, Z.; Cui, Y.; Xu, K.; Ma, J.; Wang, L.; An, N.; et al. Aberrant intra- and inter-network connectivity architectures in Alzheimer’s disease and mild cognitive impairment. Sci. Rep. 2015, 5, 14824. [Google Scholar] [CrossRef] [PubMed] [Green Version]
- Wu, Z.; Gao, Y.; Potter, T.; Benoit, J.; Shen, J.; Schulz, P.E.; Zhang, Y. The Alzheimer’s Disease Neuroimaging Initiative Interactions between Aging and Alzheimer’s Disease on Structural Brain Networks. Front. Aging Neurosci. 2021, 13, 639795. [Google Scholar] [CrossRef]
- Babiloni, C.; Blinowska, K.; Bonanni, L.; Cichocki, A.; De Haan, W.; Del Percio, C.; Dubois, B.; Escudero, J.; Fernández, A.; Frisoni, G.; et al. What electrophysiology tells us about Alzheimer’s disease: A window into the synchronization and connectivity of brain neurons. Neurobiol. Aging 2020, 85, 58–73. [Google Scholar] [CrossRef] [PubMed]
- Watanabe, H.; Bagarinao, E.; Maesawa, S.; Hara, K.; Kawabata, K.; Ogura, A.; Ohdake, R.; Shima, S.; Mizutani, Y.; Ueda, A.; et al. Characteristics of Neural Network Changes in Normal Aging and Early Dementia. Front. Aging Neurosci. 2021, 13, 747359. [Google Scholar] [CrossRef] [PubMed]
- Nimmrich, V.; Draguhn, A.; Axmacher, N. Neuronal Network Oscillations in Neurodegenerative Diseases. Neuromolecular Med. 2015, 17, 270–284. [Google Scholar] [CrossRef] [PubMed]
- Palop, J.J.; Mucke, L. Network abnormalities and interneuron dysfunction in Alzheimer disease. Nat. Rev. Neurosci. 2016, 17, 777–792. [Google Scholar] [CrossRef] [PubMed]
- Canter, R.G.; Penney, J.; Tsai, L.H. The road to restoring neural circuits for the treatment of Alzheimer’s disease. Nature 2016, 539, 187–196. [Google Scholar] [CrossRef] [PubMed]
- Buzsáki, G.; Anastassiou, C.A.; Koch, C. The origin of extracellular fields and currents—EEG, ECoG, LFP and spikes. Nat. Rev. Neurosci. 2012, 13, 407–420. [Google Scholar] [CrossRef]
- Koenig, T.; Prichep, L.; Dierks, T.; Hubl, D.; Wahlund, L.O.; John, E.R.; Jelic, V. Decreased EEG synchronization in Alzheimer’s disease and mild cognitive impairment. Neurobiol. Aging 2005, 26, 165–171. [Google Scholar] [CrossRef] [PubMed]
- Womelsdorf, T.; Schoffelen, J.M.; Oostenveld, R.; Singer, W.; Desimone, R.; Engel, A.K.; Fries, P. Modulation of neuronal interactions through neuronal synchronization. Science 2007, 316, 1609–1612. [Google Scholar] [CrossRef] [Green Version]
- Crouzin, N.; Baranger, K.; Cavalier, M.; Marchalant, Y.; Cohen-Solal, C.; Roman, F.S.; Khrestchatisky, M.; Rivera, S.; Féron, F.; Vignes, M. Area-specific alterations of synaptic plasticity in the 5XFAD mouse model of Alzheimer’s disease: Dissociation between somatosensory cortex and hippocampus. PLoS ONE 2013, 8, e74667. [Google Scholar] [CrossRef] [PubMed]
- Schneider, F.; Baldauf, K.; Wetzel, W.; Reymann, K.G. Behavioral and EEG changes in male 5XFAD mice. Physiol. Behav. 2014, 135, 25–33. [Google Scholar] [CrossRef]
- Siwek, M.E.; Müller, R.; Henseler, C.; Trog, A.; Lundt, A.; Wormuth, C.; Broich, K.; Ehninger, D.; Weiergräber, M.; Papazoglou, A. Altered theta oscillations and aberrant cortical excitatory activity in the 5XFAD model of Alzheimer’s disease. Neural Plast. 2015, 2015, 781731. [Google Scholar] [CrossRef] [PubMed] [Green Version]
- Vorobyov, V.; Kaptsov, V.; Gordon, R.; Makarova, E.; Podolski, I.; Sengpiel, F. Neuroprotective effects of hydrated fullerene C60, cortical and hippocampal EEG interplay in an amyloid-infused rat model of Alzheimer’s disease. J. Alzheimers Dis. 2015, 45, 217–233. [Google Scholar] [CrossRef]
- Gasiorowska, A.; Wydrych, M.; Drapich, P.; Zadrozny, M.; Steczkowska, M.; Niewiadomski, W.; Niewiadomska, G. The Biology and Pathobiology of Glutamatergic, Cholinergic, and Dopaminergic Signaling in the Aging Brain. Front. Aging Neurosci. 2021, 13, 654931. [Google Scholar] [CrossRef]
- Vorobyov, V.; Bakharev, B.; Medvinskaya, N.; Nesterova, I.; Samokhin, A.; Deev, A.; Tatarnikova, O.; Ustyugov, A.A.; Sengpiel, F.; Bobkova, N. Loss of Midbrain Dopamine Neurons and Altered Apomorphine EEG Effects in the 5XFAD Mouse Model of Alzheimer’s Disease. J. Alzheimers Dis. 2019, 70, 241–256. [Google Scholar] [CrossRef] [PubMed] [Green Version]
- Franklin, K.B.J.; Paxinos, G. The Mouse Brain in Stereotaxic Coordinates, 3rd ed.; Academic Press: New York, NY, USA, 2007. [Google Scholar]
- Al-Wandi, A.; Ninkina, N.; Millership, S.; Williamson, S.J.; Jones, P.A.; Buchman, V.L. Absence of alpha-synuclein affects dopamine metabolism and synaptic markers in the striatum of aging mice. Neurobiol. Aging 2010, 31, 796–804. [Google Scholar] [CrossRef] [PubMed] [Green Version]
- Connor-Robson, N.; Peters, O.M.; Millership, S.; Ninkina, N.; Buchman, V.L. Combinational losses of synucleins reveal their differential requirements for compensating age-dependent alterations in motor behavior and dopamine metabolism. Neurobiol. Aging 2016, 46, 107–112. [Google Scholar] [CrossRef] [PubMed] [Green Version]
- Goloborshcheva, V.V.; Chaprov, K.D.; Teterina, E.V.; Ovchinnikov, R.; Buchman, V.L. Reduced complement of dopaminergic neurons in the substantia nigra pars compacta of mice with a constitutive “low footprint” genetic knockout of alpha-synuclein. Mol. Brain 2020, 13, 75. [Google Scholar] [CrossRef] [PubMed]
- Hökfelt, T.; Martensson, R.; Björklund, A.; Kheinau, S.; Goldstein, M. Handbook of Chemical Neuroanatomy; Björklund, A., Hökfelt, T., Eds.; Elsevier Science B.V: Amsterdam, The Netherlands, 1984; Volume 2, pp. 277–379. [Google Scholar]
- Gal’chenko, A.A.; Vorobyov, V.V. Analysis of electroencephalograms using a modified amplitude-interval algorithm. Neurosci. Behav. Physiol. 1999, 29, 157–160. [Google Scholar] [CrossRef] [PubMed]
- Aron, L.; Zullo, J.; Yankner, B.A. The adaptive aging brain. Curr. Opin. Neurobiol. 2021, 72, 91–100. [Google Scholar] [CrossRef] [PubMed]
- Tsai, L.H.; Madabhushi, R. Alzheimer’s disease: A protective factor for the ageing brain. Nature 2014, 507, 439–440. [Google Scholar] [CrossRef] [PubMed]
- Del Percio, C.; Drinkenburg, W.; Lopez, S.; Infarinato, F.; Bastlund, J.F.; Laursen, B.; Pedersen, J.T.; Christensen, D.Z.; Forloni, G.; Frasca, A.; et al. On-going electroencephalographic rhythms related to cortical arousal in wild-type mice: The effect of aging. Neurobiol. Aging 2017, 49, 20–30. [Google Scholar] [CrossRef]
- Vyazovskiy, V.V.; Achermann, P.; Borbély, A.A.; Tobler, I. The dynamics of spindles and EEG slow-wave activity in NREM sleep in mice. Arch. Ital. Biol. 2004, 142, 511–523. [Google Scholar] [PubMed]
- Oakley, H.; Cole, S.L.; Logan, S.; Maus, E.; Shao, P.; Craft, J.; Guillozet-Bongaarts, A.; Ohno, M.; Disterhoft, J.; Van Eldik, L.; et al. Intraneuronal β-amyloid aggregates, neurodegeneration, and neuron loss in transgenic mice with five familial Alzheimer’s disease mutations: Potential factors in amyloid plaque formation. J. Neurosci. 2006, 26, 10129–10140. [Google Scholar] [CrossRef] [Green Version]
- Oblak, A.L.; Lin, P.B.; Kotredes, K.P.; Pandey, R.S.; Garceau, D.; Williams, H.M.; Uyar, A.; O’Rourke, R.; O’Rourke, S.; Ingraham, C.; et al. Comprehensive Evaluation of the 5XFAD Mouse Model for Preclinical Testing Applications: A MODEL-AD Study. Front. Aging Neurosci. 2021, 13, 713726. [Google Scholar] [CrossRef] [PubMed]
- Yanai, S.; Endo, S. Functional Aging in Male C57BL/6J Mice Across the Life-Span: A Systematic Behavioral Analysis of Motor, Emotional, and Memory Function to Define an Aging Phenotype. Front. Aging Neurosci. 2021, 13, 697621. [Google Scholar] [CrossRef] [PubMed]
- Krashia, P.; Nobili, A.; D’Amelio, M. Unifying Hypothesis of Dopamine Neuron Loss in Neurodegenerative Diseases: Focusing on Alzheimer’s Disease. Front. Mol. Neurosci. 2019, 12, 123. [Google Scholar] [CrossRef] [Green Version]
- Paladini, C.A.; Roeper, J. Generating bursts (and pauses) in the dopamine midbrain neurons. Neuroscience 2014, 282, 109–121. [Google Scholar] [CrossRef] [PubMed]
- Hage, T.A.; Khaliq, Z.M. Tonic firing rate controls dendritic Ca2+ signaling and synaptic gain in substantia nigra dopamine neurons. J. Neurosc.i 2015, 35, 5823–5836. [Google Scholar] [CrossRef] [PubMed] [Green Version]
- Ferreira, J.G.; Del-Fava, F.; Hasue, R.H.; Shammah-Lagnado, S.J. Organization of ventral tegmental area projections to the ventral tegmental area-nigral complex in the rat. Neuroscience 2008, 153, 196–213. [Google Scholar] [CrossRef] [PubMed]
- Golden, J.P.; Demaro, J.A., III; Knoten, A.; Hoshi, M.; Pehek, E.; Johnson, E.M., Jr.; Gereau, R.W., IV; Jain, S. Dopamine-dependent compensation maintains motor behavior in mice with developmental ablation of dopaminergic neurons. J. Neurosci. 2013, 33, 17095–17107. [Google Scholar] [CrossRef] [PubMed] [Green Version]
- Osterburg, H.H.; Donahue, H.G.; Severson, J.A.; Finch, C.E. Catecholamine levels and turnover during aging in brain regions of male C57BL/6J mice. Brain Res. 1981, 224, 337–352. [Google Scholar] [CrossRef]
- Noda, S.; Sato, S.; Fukuda, T.; Tada, N.; Hattori, N. Aging-related motor function and dopaminergic neuronal loss in C57BL/6 mice. Mol. Brain 2020, 13, 46. [Google Scholar] [CrossRef]
- Tong, Z.Y.; Overton, P.G.; Clark, D. Antagonism of NMDA receptors but not AMPA/kainate receptors blocks bursting in dopaminergic neurons induced by electrical stimulation of the prefrontal cortex. J. Neural Transm. 1996, 103, 889–904. [Google Scholar] [CrossRef]
- Au-Young, S.M.; Shen, H.; Yang, C.R. Medial prefrontal cortical output neurons to the ventral tegmental area (VTA) and their responses to burst-patterned stimulation of the VTA: Neuroanatomical and in vivo electrophysiological analyses. Synapse 1999, 34, 245–255. [Google Scholar] [CrossRef]
- Sesack, S.R.; Grace, A.A. Cortico-basal ganglia reward network: Microcircuitry. Neuropsychopharmacology 2010, 35, 27–47. [Google Scholar] [CrossRef] [Green Version]
- Lohr, K.M.; Masoud, S.T.; Salahpour, A.; Miller, G.W. Membrane transporters as mediators of synaptic dopamine dynamics: Implications for disease. Eur. J. Neurosci. 2017, 45, 20–33. [Google Scholar] [CrossRef] [Green Version]
- Nekrasov, P.V.; Vorobyov, V.V. Dopaminergic mediation in the brain aging and neurodegenerative diseases: A role of senescent cells. Neural Regen. Res. 2018, 13, 649–650. [Google Scholar] [CrossRef]
- Kostrzewa, R.M.; Kostrzewa, J.P.; Brown, R.W.; Nowak, P.; Brus, R. Dopamine receptor supersensitivity: Development, mechanisms, presentation, and clinical applicability. Neurotox. Res. 2008, 14, 121–128. [Google Scholar] [CrossRef] [PubMed]
- Prestia, A.; Baglieri, A.; Pievani, M.; Bonetti, M.; Rasser, P.E.; Thompson, P.M.; Marino, S.; Bramanti, P.; Frisoni, G.B. The in vivo topography of cortical changes in healthy aging and prodromal Alzheimer’s disease. Figure Clin. Neurophysiol. 2013, 62, 67–80. [Google Scholar]
Publisher’s Note: MDPI stays neutral with regard to jurisdictional claims in published maps and institutional affiliations. |
© 2022 by the authors. Licensee MDPI, Basel, Switzerland. This article is an open access article distributed under the terms and conditions of the Creative Commons Attribution (CC BY) license (https://creativecommons.org/licenses/by/4.0/).
Share and Cite
Vorobyov, V.; Deev, A.; Oganesyan, Z.; Sengpiel, F.; Ustyugov, A.A. Baseline Electroencephalogram and Its Evolution after Activation of Dopaminergic System by Apomorphine in Middle-Aged 5XFAD Transgenic Mice, a Model of Alzheimer’s Disease. Dynamics 2022, 2, 356-366. https://doi.org/10.3390/dynamics2040020
Vorobyov V, Deev A, Oganesyan Z, Sengpiel F, Ustyugov AA. Baseline Electroencephalogram and Its Evolution after Activation of Dopaminergic System by Apomorphine in Middle-Aged 5XFAD Transgenic Mice, a Model of Alzheimer’s Disease. Dynamics. 2022; 2(4):356-366. https://doi.org/10.3390/dynamics2040020
Chicago/Turabian StyleVorobyov, Vasily, Alexander Deev, Zoya Oganesyan, Frank Sengpiel, and Aleksey A. Ustyugov. 2022. "Baseline Electroencephalogram and Its Evolution after Activation of Dopaminergic System by Apomorphine in Middle-Aged 5XFAD Transgenic Mice, a Model of Alzheimer’s Disease" Dynamics 2, no. 4: 356-366. https://doi.org/10.3390/dynamics2040020