Abstract
The phenomena of electrical conductivity and electromigration in metallic systems are related, since in both cases the basic physical process is the scattering of conduction electrons by metal ions. Numerous searches have been made for equations connecting the conductivity with electromigration. In the case of a liquid metal, when using the Drude–Sommerfeld (DS) conductivity equation, it was not possible to obtain a quantitative relationship between these phenomena, which would be correct. Attempts to find such a relationship when taking into account the N. Mott correction (g-factor) in the DS equation were unsuccessful. This article proposes a different correction (b-factor) to the DS equation, which takes into account the possibility of varying the momentum transferred by the conduction electron to a metal ion during the scattering. This correction allows to establish a quantitative relationship between conductivity and electromigration as well as between electromigration in various binary systems with common components, in agreement with the experiment. The proposed theory describes well, in particular, two- and multi-component metal systems of any concentration (the consistency rule for triangles A–B, B–C, C–A). The value of the b-factor smoothly changes depending on the heat of vaporization of the metal, per unit volume.
1. Introduction
This article considers two phenomena that are close in physical nature: the electrical conductivity of a metal and the migration of metal components in an electric field. The closeness of these phenomena is beyond doubt, and therefore the search for relations linking them together began at the end of the first half of the last century. The objects of research were both solid and liquid solutions. The theory and practice of electromigration have been discussed in monographs [1,2,3,4,5,6,7,8,9]. Reviews of the experiment and theory of electromigration in liquid metals have been published in [10,11,12,13,14,15,16,17]. Significant contributions to the mathematical theory of the electromigration were given by V.B. Fiks [3,18,19], H. Huntington and A. Grone [11,20], R. Sorbello [21,22], B. Baranovski [23], D.K. Belashchenko [4,6], P.P. Kuzmenko and a number of others. Presently, interest in electromigration in liquid metals has somewhat decreased. As for solid solutions, on the contrary, interest in them has recently grown greatly, since electromigration is the main cause of degradation of large integrated circuits in computer processors and various microcircuits.
1.1. The Basics of the Theory of Electromigration
These basics were formalized mainly in the 1960s. Two forces act on a metal ion in the presence of an electric current—the field force and the electron wind force (Fiks [3,18,19], Bresler and Pikus [24], Verhoeven [12], Mangelsdorf [25], Belashchenko [4,26] and many others). The field force is expressed in terms of the coulombic (“true”) charge of the ion, and the wind force is described as the result of the friction between the ion and the electron flow or a consequence of electron scattering on the ion. There is no complete clarity regarding the true charge, but according to V.B. Fiks [27], this charge is equal to the number of electrons donated by the ion to the conduction band. This definition is accepted in many works (for example, Mangelsdorf [25], Belashchenko [4,6]). Most of the papers dealt with electromigration in crystalline metals with an activation diffusion mechanism, so that the properties of ions in the activated state were included in the discussion. For ions in the ground state, it was assumed that the total force acting on the ion is zero (Fiks [3], Bresler–Pikus [24]).
The discussion of the relationship between conductivity and electromigration was mainly reduced to the derivation of equations in which the effective charge of the ion during electromigration is expressed in terms of the electrical resistance increment due to an impurity in a crystalline or liquid solvent (see the review of J. Verhoeven [12]). For the electrical resistance in this case, the Drude–Sommerfeld equation generally is used (Bresler and Pikus [24], Mangelsdorf [25], Belashchenko [4,6] and others).
1.2. Calculation of Electrical Resistance of Metal
When calculating the interaction of ions with conduction electrons and calculating the electrical resistance of a metal, the main characteristics are the ion charge (“true”) and the scattering cross section of conduction electrons on metal ions. Liquid metals are an example of so-called monogenic systems, where the properties of all ions of a given component are the same (for example, there is no difference between the properties of particles in the ground and activated states). Let us consider the case when a one-component monogenic metal has a mean free path of conduction electrons.
The equation for the electrical resistance of a metal is well known. It was obtained by P. Drude in 1900 on the basis of classical physics:
Here, ρ is the electrical resistance, m and v are the mass and average velocity of conduction electrons, respectively, e is the elementary charge, n is the number of conduction electrons per unit volume and L is the mean free path. It can be derived in various ways, for example, as P. Drude did, calculating the average charge transfer rate along the direction of the field E. In Drude’s version, the velocity distribution of electrons was described by the Maxwell–Boltzmann formula. It was assumed that during each collision, the electron velocity becomes equal to zero, and between collisions, the electron moves uniformly accelerated in the field. The average time between collisions is τ = L/v and the average ion velocity (in the direction of the field) at the moment of collision is v = eEτ/m. The current density is j = nev = ne2E, and taking into account that τv = L, Formula (1) is obtained.
In A. Sommerfeld’s theory, instead of Maxwell–Boltzmann statistics, Fermi–Dirac statistics was used, and instead of direct electron–ion collisions, the concept of electron scattering by a potential field was introduced. Equation (1) has retained its form, but now only Fermi electrons that are on the Fermi surface and have a velocity vF participate in the scattering events. Accordingly, their momentum is equal to mvF = ћkF, where the Fermi vector is:
and n = naz is the number of conduction electrons per unit volume, where z is the ion charge. Obviously, na = N/V, where N is the Avogadro number and V is the molar volume. The equations for electrical resistance and conductivity take the form:
kF = π(3n/π)1/3
These equations are valid in the free electron approximation. This approximation will be taken into account in what follows.
In modern theories of conductivity, for example, in the J. Ziman theory [28,29], the wave function of an electron is chosen in the form of a plane wave ψ(r) = аехр(ikr), and the scattering cross section σ of electrons on the atom/ion is found, which determines the magnitude of the momentum transferred from the electron to the ion during scattering. The calculation of conductivity is reduced to determining the probability of deflection of a conduction electron upon scattering by a system of force centers with a given ion–electron interaction potential. In the case of an isotropic liquid metal, the Fermi surface has the shape of a sphere in k-space with radius kF. Substituting (2) into (3), we transform the conductivity (1) to the form:
Here, S = 4π is the area of the Fermi surface in k-space. The mean free path is related to the scattering cross section σ of electrons on an ion by the expression naLσ = 1, where na is the number of ions per unit volume. As a result, Equations (1) and (4) can be written as:
where z is the true charge of the ion. Considering multicomponent systems, one should move from the values of z and σ to the average and , respectively.
2. Materials and Methods
2.1. Modification of the Drude–Sommerfeld Equation. Variant N. Mott
As will be shown below, the Equations (3) and (4) for the conductivity of a liquid metal have low accuracies. It can be found out by considering the results of the theory in combination with data for the electromigration of metallic melts. The calculated conductivities may differ by several times from the experimental data. However, there are only two players in this field: the free path length L and the magnitude of momentum transfer mvF. How can the agreement of calculations with theory be improved?
N. Mott [30,31] used the Kubo–Greenwood formulas [32,33] to calculate the conductivity of liquid metals with a short mean free path. Estimates show that when deviating from the free electron model (FEM), the conductivity should depend on the relative density of states of electrons at the Fermi level:
Here, N(ε) is the density of states in the conduction band. Various options for the behavior of the density of states in liquid/amorphous conductors are shown in Figure 1:
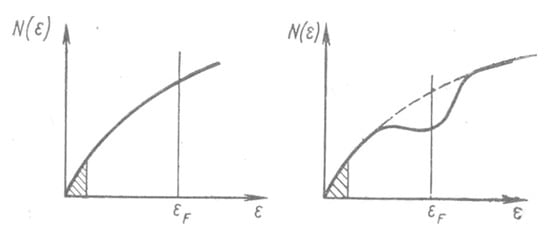
Figure 1.
Density of states in melts. The areas of localized states are shaded. εF is the Fermi energy. According to N. Mott, the g factor is the ratio of the density of states N(ε) at the Fermi level (solid line) to the density of states in the free electron model (dashed line).
According to N. Mott [30,31], in the case of poor conductors, the conductivity ϰ is expressed in terms of the factor g:
According to the meaning of this expression, the factor g should be close to unity for good conductors and less than unity for conductors with a reduced mean free path, in which the character of electron motion approaches hopping. N. Mott’s proposal is debatable. It was shown in [34] that taking into account the factor g, one obtains L = Lz/g2, where Lz is the mean free path calculated according to J. Ziman. The result is an equation for conductivity in the form:
where Sz is the area of the Fermi surface in the Ziman approximation. Thus, according to Faber [34], the conductivity should not depend on the presence of the factor g.
Below, it will be shown how the g factor of N. Mott can be calculated from the data of conductivity and electromigration.
2.2. Modification of the Drude–Sommerfeld Equation. Author’s Variant
Let us apply the phenomenological approach and return to the Equations (3)–(5), which determine the resistance or conductivity. Taking into account the form of these expressions, we can consider the factor (mvF) as the average value of the change in the electron momentum ΔP upon scattering by the ion: ΔP = 0 in the absence of deviation and ΔP = 2mvF with a deviation angle of π. Therefore, a variation in the value of ΔP should be allowed. The value of ΔP may depend on the shape of the scattering potential; the more backscattering dominates, the larger the average value of ΔP will be. Let us take as an average momentum change during scattering in a given metal the value ΔP = bmvF with a correction factor b. Then the Drude–Sommerfeld equation will be written with a correction in the form:
Comparing with (7), we see that the calculations of the alternative factor b can be carried out in exactly the same way as the calculations of the N. Mott factor g, but with subsequent replacement according to the formula 1/g2 → b. Of course, the meanings of the factors b and g are completely different. Factor b is responsible for the spatial shape of the probability of electron scattering, and the greater it is, the stronger the backscattering predominates. By the meaning of expression (9), it is assumed that b < 2. As will be shown below, the joint consideration of the data on electrical resistance and electromigration makes it possible to calculate the coefficients g and b and choose the correct interpretation of Equations (9) and (7).
3. Results
Electromigration Equations
When a current passes through a conductor, forces act on the particles of a metallic solution due to: (1) the presence of an electric field and (2) the scattering of conduction electrons by ions. The Fifield field forces depend on the true charges of the ions. Obviously, Fifield = eEzi, where e is the elementary charge and E is the field strength. By this relation, we determine the “true” charge of the ion zi. The concept of the “true” charge z in a metal is not simple and is determined by the type of experiment in which this charge is observed [13]. It was shown in [27] that the true charge z is equal to the number of electrons donated to the conduction band per atom (or the number of holes in the valence band with the opposite sign) if the contribution of Umklapp processes is small. There are no Umklapp processes in liquid and amorphous systems [29], so that z can be taken equal to the number of collectivized electrons per atom of the liquid metal, if no other specific effects inherent in the liquid appear.
We believe that the screening of the “true” ion charge could manifest itself in the same way in both phenomena—conductivity and electrotransport. The cross sections for scattering of electrons by ions also coincide in these phenomena. The vanishing or change of the field strength will violate the mechanical equilibrium and cannot really exist.
It is convenient to consider this question on the example of an ideal one-component metal without defects. In this case, the condition of mechanical equilibrium means that the total force exerted by the electric current on each atom is zero. Therefore, the force of the field and the force of the electron wind in such a metal are exactly equal to each other.
The second type of forces acting on metal ions are the electron wind forces, which depend on the scattering of conduction electrons on ions. Let us denote by σi the cross section of the scattering of conduction electrons by the i-th ion. The connection of these forces with the scattering cross sections was first established quantum-mechanically by V.B. Fiks [3]:
Fiwind = −eEnLσi
It is important that this formula can be obtained without introducing into consideration the details of the interaction of ions with electrons, but only taking into account the proportionality between the electron wind force, the field strength, the electron scattering cross section and the condition of mechanical equilibrium. Let us consider the monogenic multicomponent solutions, in which all particles of a given component behave in the same way [4,6]. Let us put:
where i is the number of the component, and q is the coefficient unknown so far. The total force of the electron wind acting on all particles of the solution can be written:
where ni is the number of particles of the i-th component, and the sum is taken over all components. Since the conductor as a whole is neutral, the total force acting on it from the electric current must be equal to zero. Therefore, the condition of mechanical equilibrium of all ions in an electric field looks like this:
or
Let us divide this equality by the total number of atoms/ions na. The ni/na ratios are the mole fractions Xi. From here, we find q:
Superscript symbols indicate average values. The mean cross section is related to the mean free path by the formula naL = 1 (see above). Consequently, q = naL = nL, and substituting into (11), we obtain V.B. Fiks Formula (10).
So, the total force acting on the i-th ion is equal to
Let us call the value in brackets the effective charge of the i-th ion :
This expression is the basic electromigration equation. With respect to monogenic solutions, it is accurate and does not require any corrections. The total force acting on the i-th ion is:
The total force acting on the all particles of a binary solution is equal to zero:
For the ratio of scattering cross sections, it follows from (12):
Let us write expressions for the effective charges of the components of a binary monogenic solution of any concentration. In this case, = X1σ1 + X2σ2 и = X1z1 + X2z2. Substituting these formulas into relation (12), we obtain
or
Similarly, for the second component we find: . We see that the effective charges are determined by the true charges of the ions and the ratio of the cross sections for the scattering of conduction electrons on the ions of the components.
As an example, Figure 2 shows the effective charges during electromigration in the Bi–Cd binary system at 300 °C. The measurements were carried out in vertical glass capillaries with an inner diameter of about 1 mm and a length of 40 mm, with a direct current of 1 A. The steady state was achieved after annealing for several days [6,13], with Cd ions moving upwards. After rapid cooling, the metal wire-like samples were removed from the capillary, cut into pieces 4 mm long and analyzed chemically or radiochemically. The effective charge was calculated according to the equation [4,13]:
where x is the sample length coordinate, ai is the thermodynamic activity of the i-th component, E is the field strength, e is the elementary charge, k is the Boltzmann constant and T is the temperature.
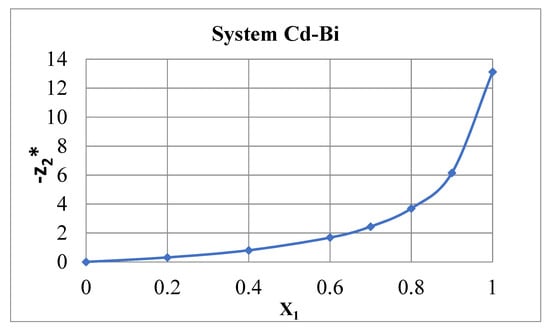
Figure 2.
Effective charges in the Cd–Bi system at 300 °C. X1—molar part of Cd. The Bi impurity in dilute Cd-based solutions has a large negative effective charge.
If in a given binary metallic system, the ion charges zi and the scattering cross section ratios σ2/σ1 do not depend on the concentration, then the expressions for the effective charges have the form:
and accordingly for . By measuring the concentration dependence of effective charges, one can calculate the ratios and estimate the ion charges zi. In the case of the Cd–Bi system, the effective charges at 300 °C are well described by the expression [4,13]:
= −1.286 XCd/(1 − 0.902 XCd); in the system Bi–Pb, in the system Cd–Pb, ; in the system Bi–Sn, ; in the system Pb–Sn, , etc.
The cross section ratios σB/σA can be calculated using Formulas (15) and (16). These ratios may depend on the concentration. Figure 3 shows the concentration dependences of the ratios σB/σA for some binary systems. These data can be used to estimate the average values of σB/σA. For Sn–Cd, Bi–Cd, Bi–Sn, Pb–Cd, Pb–Sn and Bi–Pb systems, they are 0.30, 0.13, 0.46, 0.23, 0.81 and 0.64, respectively [4]. If three binary systems formed by three components A, B and C are studied at the same temperature, then the values σA/σB, σB/σC and σC/σA can be determined for these systems. Their product must be equal to 1.00. For the Cd–Sn–Pb triangle, we get 0.30 × 0.46/0.13 = 1.06; for the Cd–Pb–Bi triangle, we find 0.23 × 0.64/0.13 = 1.13; for the Sn–Pb–Bi triangle, we find 0.81 × 0.64/0.46 = 1.12. The deviations from unity are reasonable here.
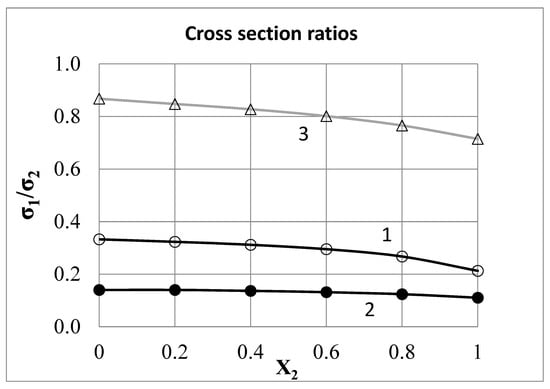
Figure 3.
Scattering cross section ratios σ1/σ2 for systems: 1—Cd–Sn at 300 °C, 2—Cd–Bi at 300 °C, 3—Sn–Pb at 350 °C.
Based on the estimated ratios of the cross sections σ2/σ1 given above, it is possible to calculate the ratios of the electrical resistances for pairs of pure liquid metals using the Sommerfeld Equation (5). They are shown in Table 1. The true charges of the ions were taken equal to the group number of the element in the Periodic system.

Table 1.
Checking the correspondence between the ratios σ2/σ1 from the equations of electrical conductivity (5) and electromigration (14).
It can be seen that in the above cases of the simplest eutectic systems, Equation (5) gives an error of up to 20–30%, so significant refinements are required.
So, the electrical resistance/conductivity of a metal is expressed in terms of the average electron scattering cross section on ions, and the effective charges are expressed in terms of the ratios σ2/σ1. Obviously, these phenomena are connected with each other, and it is required to find more exact correlations between them.
4. Discussing
4.1. Relationship between Effective Charge and Electrical Resistance. Drude–Sommerfeld Variant
Attempts to establish a relationship between electrical resistance and electrical transfer were made quite a long time ago [4]. They were based on the postulate that the scattering cross sections in the phenomena of conduction and electromigration coincide. We will also proceed from this postulate.
The theory was tested by comparing data on the effect of impurities on the electrical resistance of solvents and electromigration data in highly dilute solutions. Usually, in calculations, Equation (4) was used, written as:
where ρ is the electrical resistivity, (mv)F is the momentum of the Fermi electrons, and and are the average values for the components of the metallic solution. Let us calculate the derivative dln ρ/dX2, assuming the true ion charges z1 and z2 to be constant. In addition, we take into account that the scattering cross sections σ1 and σ2 are related by the Gibbs–Duhem equation X1dσ1 + X2dσ2 = 0 [6]. Then, for the averages and , it turns out:
Taking into account Equation (12), we obtain for a strongly diluted solution of the second component in the first, when и :
Accordingly, for = z1X1 + z2X2, we find, assuming the charges zi to be constants:
Hence, d (/ = − dX2. Taking into account (17), it turns out:
For extremely dilute solutions based on the first component, we have:
This equation was obtained earlier by E.I. Kharkov [35]. From this expression, it follows that the positive effective charge should have impurities that lower the electrical resistance of the solvent.
An addition should be made. Since Equation (17) includes the factor (mv)F = ћkF = πћ(3N/πV)1/3 (according to Sommerfeld), then ρ = a(/V)1/3 and lnρ = lna + (1/3) ln − (1/3) lnV (a is some constant number). Thus, we get an additional term to the right side of Equation (18):
This additive usually has a value of the order of 0.01–0.1 and does not play a significant role.
Relation (19) can be verified on amalgams. The data are given in Table 2. The ΔV values were calculated according to the additivity rule taking into account the molar volume of mercury V1 = 14.81 cm3/mol at 20 °C. Figure 4 shows the dependence of the function Ψ = − on for dilute solutions of impurities in mercury at 20 °С according to [1]. If Equation (19) is correct, the points in Figure 4 should be located on the diagonal passing through the origin and the first and third quadrants. In fact, Equation (19) does not hold well. In several cases, it is violated even in sign. However, it should be noted that the accuracy of electromigration parameters (10–20%) is lower than the conductivity data.

Table 2.
Electromigration in amalgams and influence of impurities on the resistance of mercury at 20 °C [1]. 1st component—Hg.
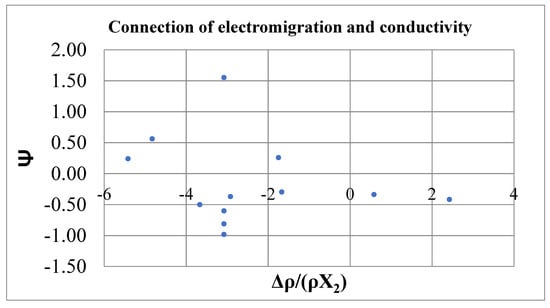
Figure 4.
Relationship between effective charges and resistance increments. Dilute solutions of impurities in mercury at 20 °C [1].
Another way to check Equation (17) is a direct comparison of the calculated resistances of liquid metals. In [37], the electrical resistance of a number of liquid metals was calculated using the expression following from Formula (17):
Here, ρA and ρB are the electrical resistivities of pure metals A and B, respectively. The cross section ratios σA/σB can be taken from the electromigration data when they depend little on concentration. Good agreement between calculation and experiment was obtained only for binary systems Cd–Pb, Cd–Bi, Cd–Hg, In–Tl and Sn–Sb (discrepancy less than 10%). For systems Cd–Sn, Ga–Hg, Hg–Tl, Hg–Sn, discrepancies reach 2–3 times [7].
The main reason for the failure of the above calculations is the deviation of the properties of liquid metals from the Drude–Sommerfeld model (17) and from Equation (1). Further development of the theory consists of taking into account deviations from this model.
4.2. N. Mott Variant. Integral Relations
Let us transform Equation (9), taking into account the fact that S = 4π and na = N/V, where N is the Avogadro number and V is the molar volume of the liquid. In these notations, the conductivity is equal to:
Let us apply this formula to calculate the cross section , assuming the factor g to be a given function of the concentration. In what follows, the results of [6,26,38] will be used. Let us express the cross section σi from Equation (12):
We multiply both sides of this equation by dXi, sum over all components and divide by :
On the left is just d/. Further, since = , the same reasoning as for the connection between and σi applies to the charges zi. Therefore, the equation d= must also hold. Taking these formulas into account, Expression (21) can be transformed: .
Integrating from the first composition of the solution to the second, we find:
Let us now express the cross section from Equation (20). Replacing the conductivity ϰ with ρ−1, we obtain [26,38]:
Here, the sum is taken over all components of the monogenic solution.
In the particular case of a two-component monogenic solution, Equation (22) can be simplified. The mechanical equilibrium condition takes the form [13]: = 0. Hence:
From here, for the transition from pure 1st component to the 2nd one:
The integral on the right has the meaning of the average value of the fraction <> over the concentration interval. The simplest systems to analyze are those in which the fraction depends little on the concentration. The error of calculations increases for systems with inversion of electromigration, where the effective charge of the component changes sign over the integration interval.
Let us express the effective charges in terms of the other characteristics of the solutions. Differentiating Equation (24) with respect to the concentration of solution (2), we obtain [6]:
Taking into account Formula (23), this gives:
Taking the usual expression kF = 2π, then finally we find:
If in a given binary system, the right side of Equation (25) vanishes at some concentrations, then = = 0. This is the condition for inversion of the direction of electromigration. Such an inversion was observed in some systems (Na–K [33,39]; Na–Hg, K–Hg, Ba–Hg [40]; Cd–Zn [41]; Al–Zn [42], etc.). In the particular case, when z1 = z2, V = const and g = const, it follows from Equation (25) that for = 0, we have dlnρ/dX1 = 0. This condition for inversion was proposed by E.I. Kharkov [35].
Let us differentiate Expression (25) with respect to temperature, assuming that the ion charges are independent of temperature. Then [6]:
This equation describes the temperature dependence of effective charges in a binary monogenic solution.
4.3. Consistency Rule
Let us take in the binary system some solution of arbitrary composition X (state 1), and pure second component at X2 = 1 as state (2). Then [6,26,38]:
and all factors with the index “2” on the left side refer to the pure second component. Let us denote the ratio k2Fg2/(k2Fg2)(2) = . Then it turns out:
If we take (X) = (1), then:
Here, the values with indices 1 and 2 refer to the pure first and second components, respectively. If we follow the theory of N. Mott, then as a result of calculations, we can obtain the ratio = for components of the binary system.
Let us consider three binary systems formed by three components A, B and C at the same temperature. Equation (28) can be used to determine the quantities , and for these systems. Their product, by definition of the function θ, must be equal to 1. From Formula (28), it follows that [6]:
This is the so-called consistency rule. It must be satisfied if the above assumptions about the monogeneity of solutions and the existence of a mean free path are valid. This rule gives also a way to test the assumptions about the behavior of the “true” ion charges in binary systems A–B, B–C and A–C.
In N. Mott’s variant, one can also check the consistency of data for three binary systems of a triangle by multiplying the ratios gA/gB, gB/gC and gC/gA calculated by (28). For the Ag–Cu–Sn triangle, three ratios of factors g are obtained [6]:
Accordingly, for the triangle Hg–In–Tl [6]:
Therefore, for these triangles, the consistency rule holds well. According to [6], good reliability of the consistency rule was also obtained for many other triangles (see Table 3).

Table 3.
Checking the consistency rule.
For all triangles, except K–Na–Cs, the consistency is very good. In the case of alkali metals, the calculation accuracy is reduced due to the presence of electromigration inversion.
From Table 3, it can be seen that the values of the true ion charges can be chosen taking into account the values of consistency. It can be assumed that the correct choice of the ion charges provides the best consistency of the triangle. Table 3 shows that the best choice for Tl ions is zTl = 3 everywhere.
The inclusion of the factor b in Equation (9) leads to an increase in the mean free path of electrons by a factor of b. The feasibility of the consistency rule means that the factor b of a given metal does not depend on the method of its calculation, that is, this factor is a function of the state.
4.4. Calculation of the Factor g
Knowing the behavior of the function , we can calculate the ratio g/g2, where g2 is the value of the factor g of the pure second component. From the formula for kF, it follows that . Obviously, this ratio has the meaning of θ when the condition g = l is satisfied. This ratio can be denoted by θFEM. Then:
So, one can calculate g/g2 for various melts of the binary system. For definiteness, we adopted the “cadmium” scale, at which gCd = 1.00. The Mott factors g calculated in this way are shown in Table 4.

Table 4.
Factors g on the Cadmium scale (gCd = 1.00).
The factual material is shown above on electromigration in binary systems, from which it is clear that the factor g is indeed a function of state. Table 4 shows the calculated values of the factor g for the studied liquids. The most significant fact that is not consistent with the theory of N. Mott is that the value of g is not directly related to the mean free path and the dimensionless free path criterion LkF. Metals with a long mean free path—liquid Cs, Na, K—are characterized by a small (less than unity) factor g. Metals with low conductivity and low LkF (Pb, Sb, Bi) have higher g values. Factor g does not correlate with either the electron concentration in the conduction band or properties such as melting point and critical temperature. However, data analysis reveals a good correlation between the value of g and the heat of vaporization of a unit volume of the substance ΔH/V, i.e., the volumetric binding energy density of the liquid metal. The dependence of g on (ΔH/V)1/3 turns out to be close to linear at (ΔH/V)1/3 > 2 (kcal/cm3)1/3 (Figure 5). At smaller values of ΔH/V, the points for Cs, K and Te also lie on a smooth curve.
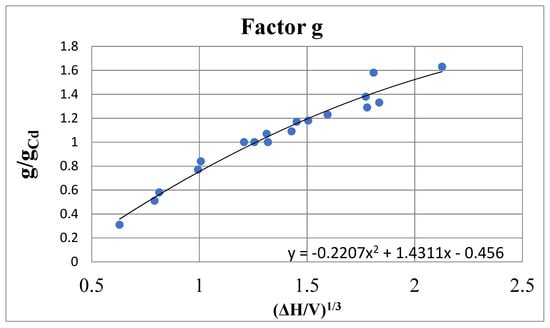
Figure 5.
Dependence of the factor g/gCd on the heat of vaporization of the metal per unit volume (ΔH/V)1/3 (kcal/cm3)1/3. Data from Table 3.
Hence, it follows that the factor g, not having the properties of the supposed N. Mott factor, nevertheless plays an important role in the processes of scattering of conduction electrons and has the properties of function of the state. Apparently, some other reason for deviations from the equations of conductivity and electromigration is hidden behind the factor g. In this regard, another version of the description of these processes, proposed below, should be considered.
4.5. Alternative Variant of the Author
In this option, it is required to calculate the factor b in the Drude–Sommerfeld Equation (9) using data on conductivity and electromigration. It has already been noted above that the calculations of the alternative factor b can be carried out in exactly the same way as the calculations of the Mott factor g, but with its subsequent replacement according to the formula 1/g2 → b. Of course, the meaning of the factors b and g is completely different. Factor b is responsible for the spatial shape of the probability of electron scattering, and the greater b is, the stronger the backscattering predominates. According to the meaning of the factor, it is assumed that b < 2. Formula (24) takes the form:
Instead of the factor g2 in the numerator, we get the factor b in the denominator. Therefore, the values of the factor b of the metals considered above can be determined by the formula 1/g2 → b, using the g values from Table 4. They are shown in the same table and in Figure 6. Factor b monotonically decreases with increasing ΔH/V, and for b < 2, the graph is described by the exponent y = 5.4612exp (−1.327x). The minimum value b = 0.38 was obtained for copper, which has the maximum volumetric heat of evaporation between the metals considered. The smooth dependence of b factor on the value ΔH/V allows to predict the factors b for some metals not studied up to now (Li, Rb, Au, Be, Mg, Ca, Ba, Si) [6].
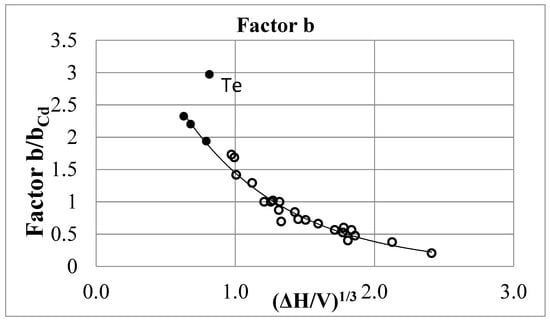
Figure 6.
Dependence of factor b on the heat of vaporization per unit volume of metal. The points at b > 1.75 for Cs, Rb and K were obtained by extrapolation. │ΔH/V│ = kcal/cm3.
These data are consistent with the meaning of the factor b, which is implied in the author’s version. The magnitude of the momentum change upon scattering is in most cases less than 2(mv)F and smoothly depends on the evaporation energy per unit volume. The abnormal value for Te is explained by the fact that this substance is a semimetal with high electrical resistance, and for it, the above theory requires correction.
A special group is formed from alkali metals Na, K, Rb and Cs, which are the components of many systems with inversion of electromigration. An example of such a system—Na–K—is shown in Figure 7. The electrical resistance isotherm is bell-shaped with a high maximum at 59 at % K [6].
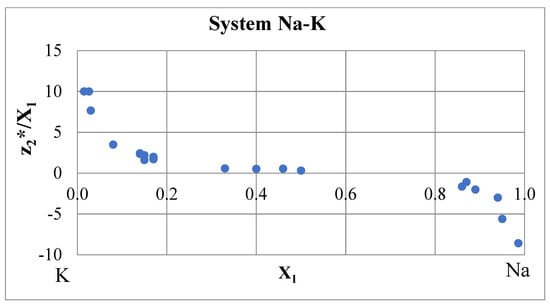
Figure 7.
Effective charges in the Na–K system at 110 °C [6,43].
The effective charge isotherm in Figure 7 has an almost symmetric shape, and the integral in Expression (28) is small due to the cancellation of the positive and negative contributions. Effective charges in dilute solutions strongly depend on concentration. In [44], the electromigration of traces of Na and K in liquid K and Na, respectively, was studied. The effective charges are approximately −20, that is noticeably more, than in Figure 7. Therefore, the error in calculating the area under the curve is rather large. This applies not only to the Na–K system, but also to similar Na–Cs and K–Cs systems [6,45].
The ratio of scattering cross sections σ2/σ1 in a binary system was calculated from electromigration data [Formula (12)]. Figure 8 shows how the ratio σ2/σ1 changes where the electrical resistance isotherms are bell-shaped. In the Na–K system at 110 °C and X1 ≈ 0, the ratio σ2/σ1 = 0.077, and at X1 ≈ 1, it is equal to σ2/σ1 = 10.74. It means that this ratio changes non-linearly ~140 times. Such cases are common when the resistivity isotherms go through high maximum. The new investigations of systems like Na–K and similar ones Na–Cs and K–Cs (Figure 7, Figure 8 and Figure 9) allow to verify our hypothesis that the cross sections σ1 and σ2 are partial values with respect to the mean cross section .
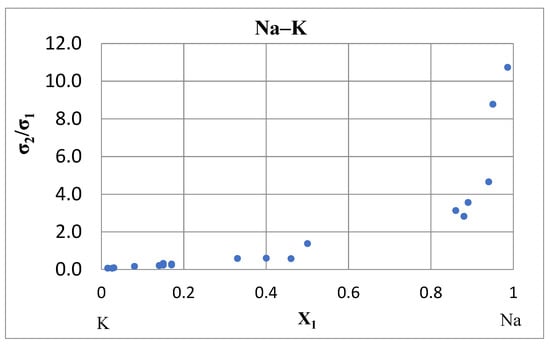
Figure 8.
The ratio of scattering cross sections σ2/σ1 in the Na–K system at 110 °C [43].
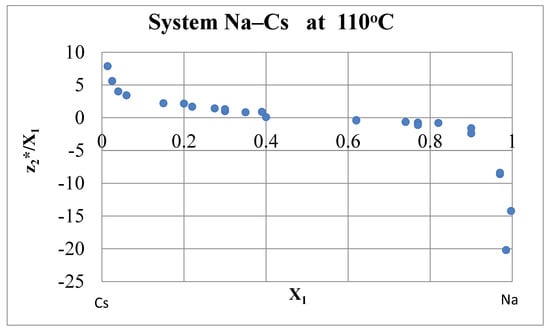
Figure 9.
Effective charges in the Na–Cs system at 110 °C [6,45].
Let us estimate the role of the integral (29) in calculating the factor b. For the Na–K system at 110 °C, ρ1 = 10.13 μΩ·cm, ρ2 = 17.35 μΩ·cm, V1 = 24.8 cm3/mol, V2 = 47.9 cm3/mol, the left side of Expression (29) is equal to ln = ln(bNa/bK) + 0.758, and with the hypothetical value of the integral (29) 0.5, we would get bK ≈ 1.84 (see Table 4). The actual value of the integral is difficult to estimate due to ambiguities in highly dilute solutions. For the Na–Cs system at 110 °С, ρ1 = 10.13 μΩ·cm, ρ2 = 46.6 μΩ·cm, V1 = 24.8 cm3/mol, V2 = 74.0 cm3/mol, so that the left side of Expression (29) is equal to ln = ln(bNa/bCs) + 1.890. Effective charges in the Na–Cs system at 110 °C are shown in Figure 9 [6,45]. The integral in Equation (29) for the Na–Cs system is clearly greater than zero, but it is rather difficult to estimate it without accurate data in highly dilute solutions.
The situation is similar in the K–Cs system [6,45]. Therefore, for the time being, we can accept the approximate values of the factors b/b(Cd) for K, Rb and Cs, obtained by extrapolation (see Figure 6).
5. Conclusions
A detailed evaluation of the Drude–Lorentz–Sommerfeld equation and electromigration equations shows that, taking into account the implied values of the momentum transfer of conduction electrons during scattering by metal ions/atoms, the original form of the conductivity Equation (1) or (4) leads to irremovable discrepancies in the experiment. These discrepancies can be eliminated by introducing an additional coefficient into the equation for conductivity/electrical resistance. The use of the correction factor g proposed by N. Mott makes it possible to eliminate these discrepancies, but the calculated corrections do not agree with the physical picture proposed by N. Mott. The author of this article substantiated the introduction of a correction b < 2 into the Sommerfeld conductivity equation, which takes into account variations in the mean magnitude of momentum transfer during the scattering of conduction electrons by ions. The main point is an account of internal connection between conductivity and electromigration.
Let us repeat again that some principal points were invented and applied in the discussion: (1) ion cross sections for conductivity and electromigration coincide, (2) cross sections of the components are partial values with respect to the mean cross section, (3) the basic equation of electromigration is established for monogenic solutions and (4) factor b is included in the Drude–Sommerfeld equation for conductivity. As a result, the consistency rule is discovered that connects the electromigration parameters in triangles of every three binary metallic systems A–B, B–C and C–A. The fulfillment of this rule allows to confirm the important properties of metallic systems.
The calculated values of factor b regularly change in accordance with the value of the volumetric heat of evaporation ΔH/V. This means that the interaction potentials between ions and conduction electrons play a decisive role both in the phenomenon of scattering and in the energetics of the metal.
Funding
This research received no external funding.
Acknowledgments
I express my deep gratitude to my wife Valentina Efanova for her constant help, understanding and support.
Conflicts of Interest
The author declares no conflict of interest.
References
- Schwarz, K.E. Elektrolytische Wanderung in Flüssigen und Festen Metallen; J. A. Barth: Leipzig, Germany, 1940. [Google Scholar]
- Seith, W.; Heumann, T. Diffusion in Metallen; Springer: Berlin/Heidelberg, Germany, 1955. [Google Scholar]
- Fiks, V.B. Ionic Conductivity in Metals and Semiconductors; Nauka: Moscow, Russia, 1969. (In Russian) [Google Scholar]
- Belashchenko, D.K. Transport Phenomena in Liquid Metals and Semiconductors; Atomizdat: Moscow, Russia, 1970. (In Russian) [Google Scholar]
- Kuzmenko, P.P. Electrotransfer, Thermal Transfer and Diffusion in Metals; Vishcha Shkola: Kyiv, Ukraine, 1983. (In Russian) [Google Scholar]
- Belashchenko, D.K. The Study of Liquid Metals by the Electromigration Method; Metallurgy: Moscow, Russia, 1974. (In Russian) [Google Scholar]
- Mikhailov, V.A.; Bogdanova, D.D. Electrotransfer in Liquid Metals; Nauka: Novosibirsk, Russia, 1978. (In Russian) [Google Scholar]
- Ho, P.S.; Kwok, T. Electromigration in metals. Rep. Prog. Phys. 1989, 52, 301–348. [Google Scholar] [CrossRef]
- Sorbello, R. Theory of Electromigration. J. Phys. C Solid State Phys. 1998, 51, 159–231. [Google Scholar]
- Kremann, R.; Müller, R. Elektromotorische Krafte, Elektrolyse and Polarisation, 2 Teil. In Handbuch der Allgemeine Chemie; Akademische Verlagsgesellschaft m.b.H.: Leipzig, Germany, 1931; Volume 8, p. 616. [Google Scholar]
- Huntington, H.B.; Grone, A.R. Current-Induced Marker Motion in Gold Wires. J. Phys. Chem. Solids 1961, 20, 76–87. [Google Scholar] [CrossRef]
- Verhoeven, J. Electrotransport in Metals. Metall. Rev. 1963, 8, 311–368. [Google Scholar] [CrossRef]
- Belashchenko, D.K. Electrotransfer in liquid metals. Adv. Chem. 1965, 34, 530–564. (In Russian) [Google Scholar]
- Black, J.R. Electromigration—A brief survey and some recent results. IEEE Trans. Electron Devices 1969, 16, 338–347. [Google Scholar] [CrossRef]
- Huntington, H.B. Diffusion in Solids: Recent Developments; Nowick, A.S., Burton, J.J., Eds.; Academic: New York, NY, USA, 1975; pp. 303–352. [Google Scholar]
- Tan, C.M.; Roy, A. Electromigration in ULSI interconnects. Mater. Sci. Eng. 2007, 58, 1–75. [Google Scholar] [CrossRef]
- Liu, Y.-C.; Lin, S.-K. A Critical Review on the Electromigration Effect, the Electroplastic Effect, and Perspectives on Effect of Electric Current upon Alloy Phase Stability. JOM 2019, 71, 3094–3106. [Google Scholar] [CrossRef]
- Fiks, V.B. On the mechanism of ion mobility in metals. Sov. Phys.—Solid State 1959, 1, 16–30. (In Russian) [Google Scholar]
- Fiks, V.B.; Kaganov, M.I.; Lifshits, I.M. On the scattering of an electron by an impurity center. Sov. Phys.—Solid State 1964, 6, 2723–2731. (In Russian) [Google Scholar]
- Huntington, H.B. Effect of driving forces on atom motion. Thin Solid Film. 1975, 25, 265–280. [Google Scholar] [CrossRef]
- Sorbello, R. A pseudopotential based theory of the driving forces for electromigration in metals. J. Phys. Chem. Solids 1973, 34, 937–950. [Google Scholar] [CrossRef]
- Sorbello, R.S. Electromigration in liquid metal alloys. Phys. Status Solidi (b) 1978, 86, 671–678. [Google Scholar] [CrossRef]
- Drakin, S.I. Transfer and distribution of metal alloy components in an electric field. Russ. J. Phys. Chem. 1953, 27, 1586–1593. (In Russian) [Google Scholar]
- Bresler, S.E.; Pikus, G.E. On the Theory of the Separation of Isotopes and of Components of Alloys by the Passage of Current Through Liquid Metal. Sov. Phys.—Tech. Phys. 1958, 3, 2094–2100. [Google Scholar]
- Mangelsdorf, P.C. Transport Processes in Liquid Alloys. II. The Electrical Force on an Ion. J. Chem. Phys. 1960, 33, 1151–1161. [Google Scholar] [CrossRef]
- Belashchenko, D.K. On the relationship between electrotransport and electrical conductivity of liquid metallic solutions in the Mott model. Russ. J. Phys. Chem. 1970, 44, 2907–2910. (In Russian) [Google Scholar]
- Fiks, V.B. Dynamic (effective) charge of metal ions. Sov. Phys.—Solid State 1964, 6, 2307. (In Russian) [Google Scholar]
- Ziman, J.M. A theory of the electrical properties of liquid metals. Philos. Mag. 1961, 6, 1013–1034. [Google Scholar] [CrossRef]
- Ziman, J.M. Electrons and Phonons. The Theory of Transport Phenomena in Solids; Oxford University Press: Oxford, UK, 1960. [Google Scholar]
- Mott, N.F. Electrons in Disordered Structures. Adv. Phys. 1967, 16, 49–144. [Google Scholar] [CrossRef]
- Mott, N.F. Conduction in non-crystalline materials. III Philos. Mag. 1969, 19, 835–852. [Google Scholar] [CrossRef]
- Kubo, R. A General expression for the conductivity tensor. J. Phys. 1956, 34, 1274–1277. [Google Scholar] [CrossRef]
- Greenwood, D.A. The Boltzmann Equation in the Theory of Electrical Conduction in Metals. Proc. Phys. Soc. Lond. 1958, 71, 585–596. [Google Scholar] [CrossRef]
- Faber, T.E. Optical Properties and Electronic Structure of Metals and Alloys. In Proceedings of the International Colliquium, Paris, France, 13–16 September 1965; North-Holland Publishing: Amsterdam, The Netherlands, 1966. [Google Scholar]
- Kharkov, E.I. Relation between the parameters of electrotransfer and electrical resistance of liquid binary alloys. Ukr. Phys. J. 1966, 11, 677–678. (In Russian) [Google Scholar]
- Shaw, R.E. Convection Effects during Electrotransport of Liquid Metals. Ph.D. Thesis, Iowa State University, Ames, IA, USA, 1972. (In Russian). [Google Scholar]
- Belashchenko, D.K. Electromigration in liquid binary alloys and its connection with electrical resistance. Izv. Vuzov Ferr. Metall. 1962, 120–125. (In Russian) [Google Scholar]
- Belashchenko, D.K.; Gushchina, E.I. Application of the electrotransport method for the analysis of electronic states in liquid metallic solutions based on the one-parameter Mott model. Met. Phys. Metallogr. 1970, 30, 295–302. (In Russian) [Google Scholar]
- Drakin, S.I.; Maltsev, A.K. Electrodiffusion in K-Na alloy. Russ. J. Phys. Chem. 1957, 31, 2036–2041. (In Russian) [Google Scholar]
- Kremann, R.; Bauer, F.; Vogrin, A.; Scheibel, H. Uber den Wechsel im Wanderungssinn der Alkali- und anderer Metalle bei der Elektrolyse der betreffenden Amalgame in Abhangigkeit von der Konzentration. Monatsh. Chem. 1930, 56, 35–65. [Google Scholar] [CrossRef]
- Rudenko, A.G.; Golovinsky, N.P.; Kharkov, E.I. Electrotransfer in the Cd-Zn system. Met. Phys. Metallogr. 1968, 25, 560–562. (In Russian) [Google Scholar]
- Zhmudsky, A.; Kharkov, E.I.; Rudenko, A.G. Double inversion of electrotransport in the Al-Zn system in the liquid state. Met. Phys. Metallogr. 1967, 23, 559–562. (In Russian) [Google Scholar]
- Aksenova, L.I.; Belashchenko, D.K. Electrotransport, electrical resistance and density of electronic states in melts of the Na-K system. High Temp. 1971, 9, 722–730. (In Russian) [Google Scholar]
- Larson, S.; Roxberg, C.; Lodding, A. Atomic Transport in Solids and Liquids, Proceedings of the Europhysics Conference, Marstrand, Sweden, 15–19 June 1970; Lodding, A., Lagerwall., T., Eds.; Verlag der Zeitschrift für Naturforschung: Tübingen, Germany, 1971; ISBN 3921015006/9783921015001. [Google Scholar]
- Aksenova, L.I.; Belashchenko, D.K.; Pertsin, A.I. Electrotransfer, electrical resistance and density of electronic states in Cs—K and Na—Cs melts. High Temp. 1971, 9, 1159–1167. (In Russian) [Google Scholar]
Disclaimer/Publisher’s Note: The statements, opinions and data contained in all publications are solely those of the individual author(s) and contributor(s) and not of MDPI and/or the editor(s). MDPI and/or the editor(s) disclaim responsibility for any injury to people or property resulting from any ideas, methods, instructions or products referred to in the content. |
© 2023 by the author. Licensee MDPI, Basel, Switzerland. This article is an open access article distributed under the terms and conditions of the Creative Commons Attribution (CC BY) license (https://creativecommons.org/licenses/by/4.0/).