Article

Influx of Near-Infrared Technology in Microplastic Community: A Bibliometric Analysis

Department of Mechanical and Industrial Engineering, University of Brescia & UdR INSTM of Brescia, 25123 Brescia, Italy
*
Author to whom correspondence should be addressed.
Microplastics 2023, 2(1), 107-121; https://doi.org/10.3390/microplastics2010008
Submission received: 13 October 2022 / Revised: 31 January 2023 / Accepted: 6 February 2023 / Published: 13 February 2023
(This article belongs to the Collection Current Opinion in Microplastics)

Abstract

:
The abundance of microplastics in the environment poses a constant threat to all parts of the ecosystem, and the scientific community is called upon to help solve the problem. Numerous studies have been published for microplastic analysis, especially in the last decade, with vibrational spectroscopy being the preferred method. According to recent literature, portable spectrometers operating in the near-infrared (NIR) range are being used for the analysis of different types of polymers, and this technique has recently found its way into the analysis of microplastics as a good alternative to expensive and complicated benchtop instruments, such as Fourier-transform infrared (FTIR) spectrometers. The aim of this study is to investigate and evaluate research trends, leading publications, authors, countries, and limitations of the use of NIR spectroscopy in microplastics research, with a comparison to the established FTIR technique.

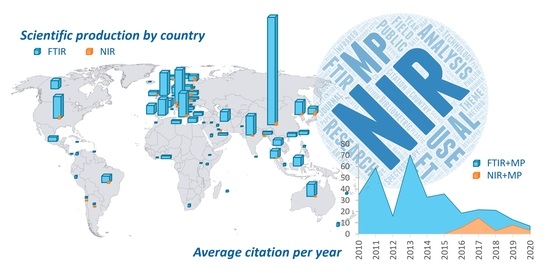
Graphical Abstract

1. Introduction

Since the publication in 2004 of the first paper motivating research on microplastics (MPs) [1], the investigations in this field have increased exponentially, especially in recent years [2,3,4]. Analysis of MPs has become increasingly common, with vibrational spectroscopic methods being the most recommended for the determination of polymer composition [5,6]. Over time, new technologies have been developed to compensate for the drawbacks of the pre-existing methods. According to recent publications, portable near-infrared (NIR) spectrometers are being used to analyse different types of polymers [7], and this technique has also very recently found its way into MP analysis [8,9], with the earliest applications of NIR in MP research documented for the imaging spectroscopic measurements on filtrates [10], analysis of coastal environments [11], and table sea salts [12]. NIR spectroscopy is gaining popularity as a non-destructive analytical technique and has become the tool of choice in a variety of sectors [13], including food [14], agriculture [15], textiles [16], cosmetics [17], pharmaceuticals [18], petrochemicals [19], medical applications [20], and chemicals such as polymers [21,22]. A notable adoption of this technology stems from its good synergy with the autonomous and portable spectrometers that can be used for on-site analysis in monitoring environmental pollutants, especially MPs. Although numerous review articles have been published regarding MP research, only a few have performed bibliometric analysis, mainly covering the evolution of MP research in marine or freshwater ecosystems [23,24,25], in the atmospheric compartment [26], in global food webs [27], in wastewater treatments [28], and considering the impacts on human health [29]. Emerging fields are frequently monitored through bibliometric analysis, a statistical method for identifying and evaluating publication trends applied to a collection of related literature [30,31]. Bibliometric analysis has already been used to identify trends in emerging disciplines, such as nanoparticle and nanomaterial toxicity [32,33].
More specifically, it is a quantitative analytical method that uses mathematics and statistics to identify journals, authors, institutions, universities, and the scientific activity of countries. It can help researchers in determining national and international contributions to the development of, and hot topics and research gaps in, the field. The findings could be useful for future studies and decisions [34].
This paper presents the first bibliometric analysis of NIR technology in MP analysis (updated to January 2022), with a comparison with the well-established Fourier-transform infrared spectroscopy (FTIR) technique [35], considered, together with Raman spectroscopy in combination with visual identification, the most preferred methods for MP analysis [6]. NIR technology has been used in plastics sorting since the 1990s, but has only recently been used in MP research, particularly due to the development of handheld instruments [8,9].
This study aims to provide a comprehensive overview of the application of NIR spectroscopy in MP analysis through a bibliometric analysis. A literature search of well-known databases revealed that there are at least 15 bibliometric studies on the trend of MPs and its environmental impact. However, to our knowledge, no comprehensive bibliometric analysis of the literature on NIR spectroscopy applied to MP research has been performed. This is the first study to address the bibliometrics of the field, with the aim of examining the trend of NIR spectroscopy over time, exploring the trending topics, recognizing productive scientists and their contributions to the field, and exploring publications.
The main research question that this study seeks to answer is: how has research in the field of MP analysis by NIR spectroscopy evolved over the years in terms of scientific productions, thematic breakthroughs, contributions of scientists, and future thematic directions?

2. Materials and Methods

2.1. Data Acquisition

Scopus provides an extensive citation index and is one of the largest databases of peer-reviewed publications [36]. It is a comprehensive and authoritative database larger than Web of Science [37] and covers content from a wide range of research areas. It currently contains more than 24,000 journals and 65 million articles and guarantees a quick and simple export of data. Scopus has two search methods (basic and advanced), which allow the creation of complicated and extensive search queries to reach the target with high validity. Scopus allows searching for terms in titles, titles/abstracts, journal names, author names, and affiliations.
In any bibliometric study, the main challenge is to create a legitimate search query that returns as many papers as possible while minimizing irrelevant (false-positive) results. The quotation marks were used to find the exact terms in Scopus, while the asterisk served as a wildcard.
For the present bibliometric analysis, the search was performed using the following sets of keywords:
(1)
(“Plastic Sorting*”) or (“Plastic Waste*”) or (“Plastic Identification”) AND (“Near Infrared*”) or (“NIR*”)
(2)
(“Microplastic*”) or (“Microplastics”) AND (“FTIR*”) or (“FT-IR”) or (“Fourier-Transform”)
(3)
(“Microplastic*”) or (“Microplastics*”) AND (“Near Infrared*”) or (“NIR*”)
The documents found through the search query on the use of FTIR to analyse MPs (set n. 2) were referred to as “FTIR-related literature”, while the documents found through the search query on the use of NIR technology to analyse MPs (set n. 3) were referred to as “NIR-related literature”.
To focus on the most representative research papers available in Scopus, “journal articles”, “reviews”, and “conference papers” were selected for the analysis. Other document types, including, “letter”, “early access”, “meeting abstract”, “correction”, “editorial material”, and “book chapter” were excluded. Language was restricted to English-language articles.

2.2. Bibliometric Analysis

The typical procedure of bibliometric analysis consists of five steps: research design, data collection, data analysis, data visualization, and interpretation. Currently, some software packages based on the R programming language are available to extract document information and integrate it based on various factors such as country/region, year of publication, citations, and so on. This study was conducted using the open-source tool Biblioshiny for Bibliometrix [38]. The articles were downloaded in a text format and loaded into Biblioshiny for Bibliometrix in R 4.0.0. The bibliometrix software package can be used for bibliometric analysis and visual representation during the procedure. For articles from the Scopus and Web of Science databases, statistical analysis, data pre-processing, co-occurrence matrix building, co-citation analysis, coupling analysis, co-word analysis, and cluster analysis are also possible. Bibliometrix offers a comprehensive set of literature information analysis tools and display of results by combining the visualization capabilities of a number of scientific mapping tools [38].

3. Results and Discussion

Results are presented in this section to reflect (i) the growth and trends of the two techniques (FTIR and NIR) used in MP analysis in terms of publication output and citations; (ii) productive scientists, affiliations, and social networks; (iii) thematic focus of the field of smart learning environments. FTIR spectroscopy was selected for comparison to map the growth of the emerging NIR technique side-by-side with the most recommended technique for MP analysis. Indeed, a purely arbitrary selection of evidence for the use of NIR in MPs is not fully representative of emerging trends in the field unless compared to the existing (and well-established) technique.

3.1. General Information

The development can be followed year by year in a time series, or it can be divided into stages. The keywords searched in Scopus were classified into the following groups:
(1)
Plastics + NIR
(2)
MP + FTIR
(3)
MP + NIR
These three groups were categorised to understand the influx of NIR technology in monitoring MPs. The starting year corresponds to the first publication covered by the search method used. From this point on, the study will be directed on the categories dealing only with MPs and NIR, from 2016–2021, and FTIR spectroscopy techniques from 2010–2021. Table 1 reports the general information regarding the data and document type retrieved from Scopus.
NIR technology is currently widely used in several industries, including petroleum, chemical, and pharmaceutical engineering. However, very few scientific papers have been published on the application of NIR spectroscopy in these fields, especially in the field of MPs. As shown in Table 1, the use of NIR technology in the field of plastic sorting is decades old, but its use in the MP community only started in 2016, while FTIR has been used since the beginning of MP research.

3.2. Annual Publication Output and Citations

Examination of the scientific literature on this current topic reveals a remarkable increase in the number of publications focusing on MP debris and their characterisation methods based on infrared spectroscopy in recent years. The year-by-year distribution of publications shows the progress of MP research over time. After the term MPs was introduced in 2004 [1], it took almost a decade for the MP problem to gain the attention of the world public, when plastic was declared as a global pollutant by the United Nations Environment Programme (UNEP) in 2011 and the severity of its impact on marine habitat was recognised, so that the annual growth rate in scientific publications increased to 32.33%. Methodologies have also evolved, and the original technique has been improved significantly thereafter. Similarly, visual observation was for a long time the most commonly used method for identifying plastic particles, although chemical characterisation using spectroscopic approaches is now often used. Even today, infrared spectroscopy is the most used technique for characterisation [6,39].
According to the analysis of the bibliometrix R tool, the use of FTIR in MP research has grown at a rate of 90.19% annually in terms of scientific production from 2016 to 2021, and in the first six years (2010–2015), the annual growth rate was 24.57%, while NIR research in the MP field has grown at the rate of 83.84% annually from 2016 to 2021, indicating the beginning of an impressive growth in publications in this field (Figure 1 and Figure 2).
In 2021, 21 articles describing the use of NIR technology in MP analyses were published after the first publication in 2016, whereas only six articles describing the use of FTIR technology in MP analyses were published in 2015, after it was first used to analyse MPs in 2010. Since the field of NIR in MP analysis is still in its infancy, it is expected that the scientific contribution will increase year by year, as evidenced by the results of the study.
It is also clear that the number of publications (Table 2) in both areas has increased significantly in recent years, demonstrating the progress and development in this area of study.
Table 2 shows the average number of citations received by MP papers using FTIR and NIR techniques per year. This metric measures the impact of a publication on the field per year. Focusing on NIR spectroscopy, the results show that the single publication in 2016, which represents the beginning of the field, received an average number of 5.88 citations, while the second publication in 2017 has 14.29 citations. This indicates that the work done by the authors of these publications had a good impact on the use of NIR technology for MP analysis. Despite the COVID-19 pandemic, the average citation per year for MP publications using NIR increased from 2.83 in 2018 to 8.05 in 2019, while with the popularity of FTIR technique for MP analysis, the average citation decreased from 21.23 to 12.73, respectively. This indicates the increasing use and popularity of the NIR technique among researchers in the MP community. The decrease in average citations and publications in both fields since 2020 can be attributed to the COVID-19 pandemic.

3.3. Active Journals

Since 2010, studies on MP analysis with FTIR have been published in 196 journals, while studies on MP analysis with NIR have been published in 20 journals. Table 3 shows the results of the top ten sources focused on producing publications on the use of FTIR and NIR for MP analysis.
This result is based on Scopus data retrieved in January 2022 (Table 3). Of the top 10 journals, six journals publish articles from both fields. Among them, the journal “Marine Pollution Bulletin” ranks first with 231 published articles on FTIR, accounting for 23.2% of the total with 11,149 citations, while only five articles were published for NIR until December 2021, accounting for 12.8% of the total publications with 135 citations of the journal. This low number of articles on the use of NIR in MP research is understandable considering that only 39 articles have been published since the first article on MP analysis using the NIR wavelength range was published in 2016. The use of NIR technology in MP research analysis is indicated by the fact that the top six journals are the same in both application areas. This indicates that NIR technology has been given relevant importance in MP research from the very beginning.

3.4. Distribution by Country

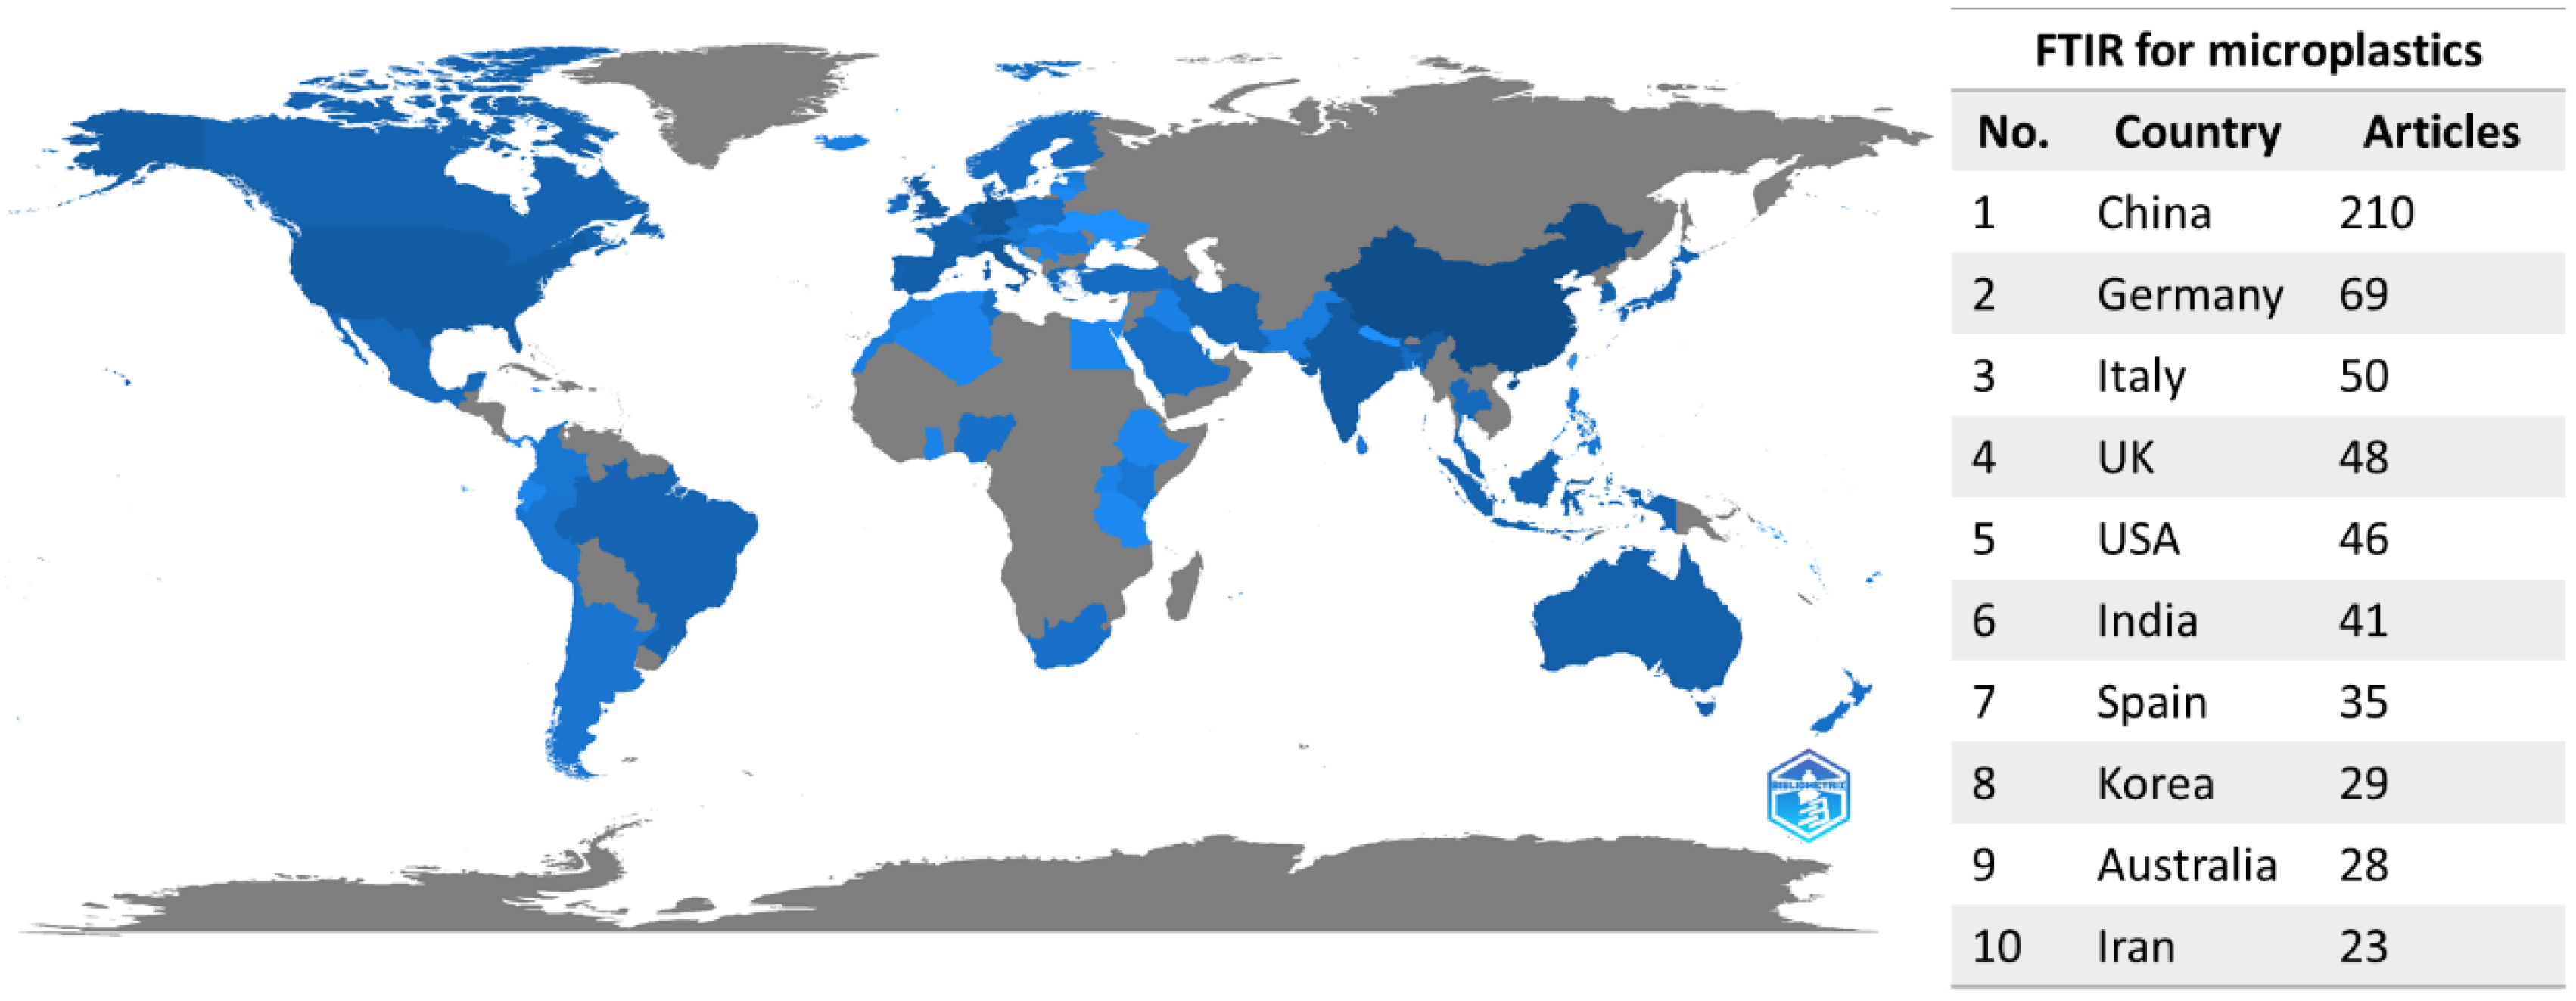
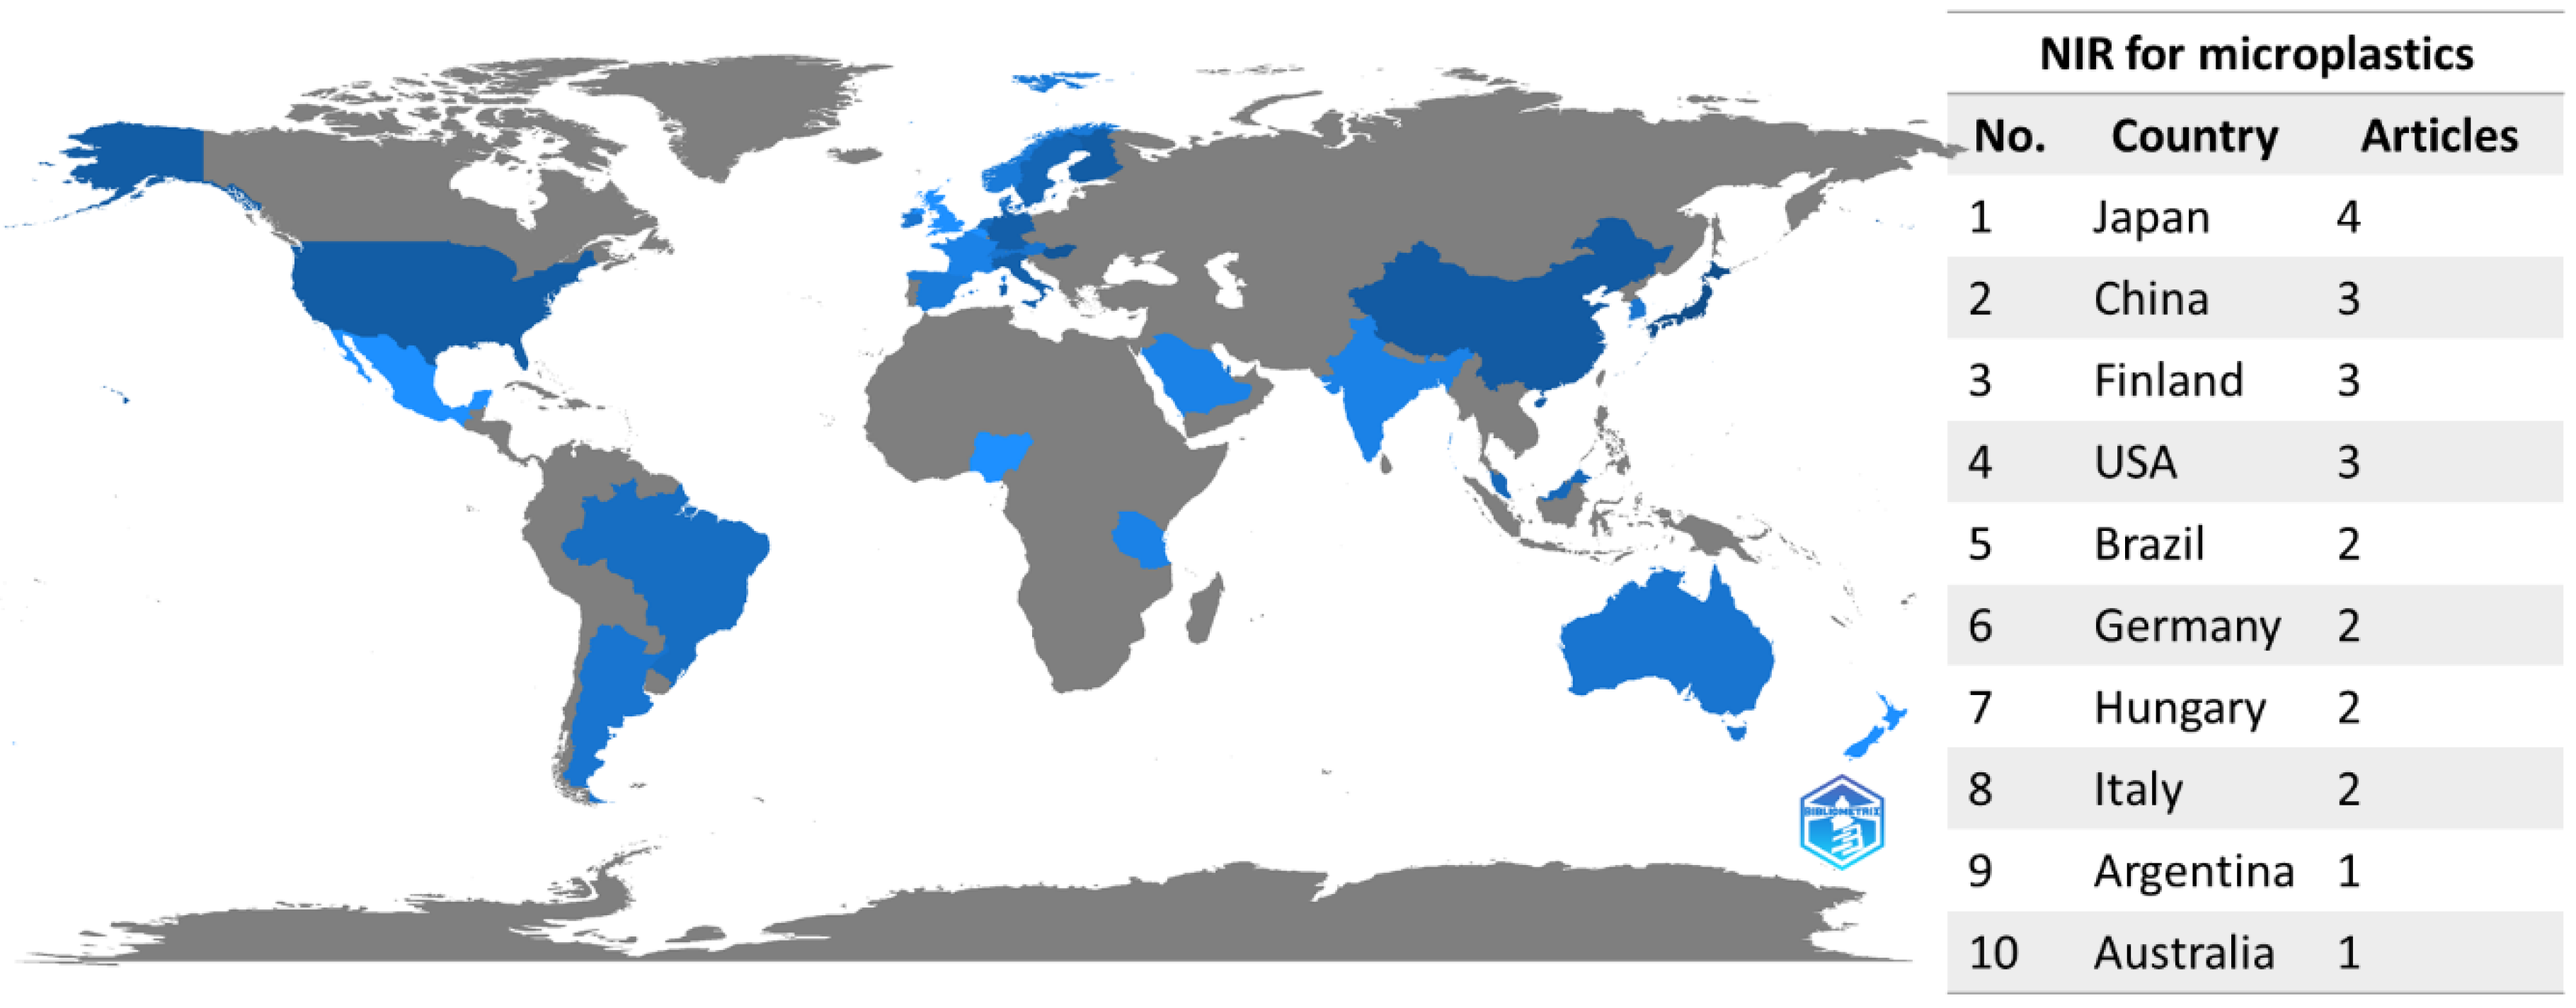
The number of published research papers is a key indicator of a country’s academic activity. A total of 998 articles describing the use of FTIR were published in 69 countries, while 39 articles describing the use of NIR were published in 21 countries. China published the most articles (210 articles or 21.04% of all sources) describing the use of FTIR for MP analysis, and Japan published four articles (10.2% of all sources) describing the use of NIR for MP analysis. The leading countries are shown in Figure 3 and Figure 4.
Six of the ten countries with the most publication using FTIR technique are developed countries, while four are emerging economies (India, China, Korea, and Iran). For the NIR technique, three of the top ten countries are developing (China, Brazil, and Argentina), while the remaining seven are developed countries. Most researchers in this discipline are in western Europe, with the majority in Germany and Italy.
This indicates that, with the exception of China and some other developing countries mentioned above, research on MPs is less advanced in developing countries than in developed countries. In general, emerging countries have a minor worldwide impact on the issue of MPs. Therefore, developing countries should increase their cooperation and exchange with developed countries and learn about their advanced research methodologies and diverse technologies to promote MP research. In addition, wealthy countries should support developing countries to grow together and close the gap. This includes providing access to expensive equipment (e.g., micro-FTIR, micro-NIR), improving the exchange of researchers, developing collaborative research, and building robust networks [34].

3.5. Quality of Publications

The most recent references with the highest citation frequency may be useful in examining the research frontiers’ knowledge base.
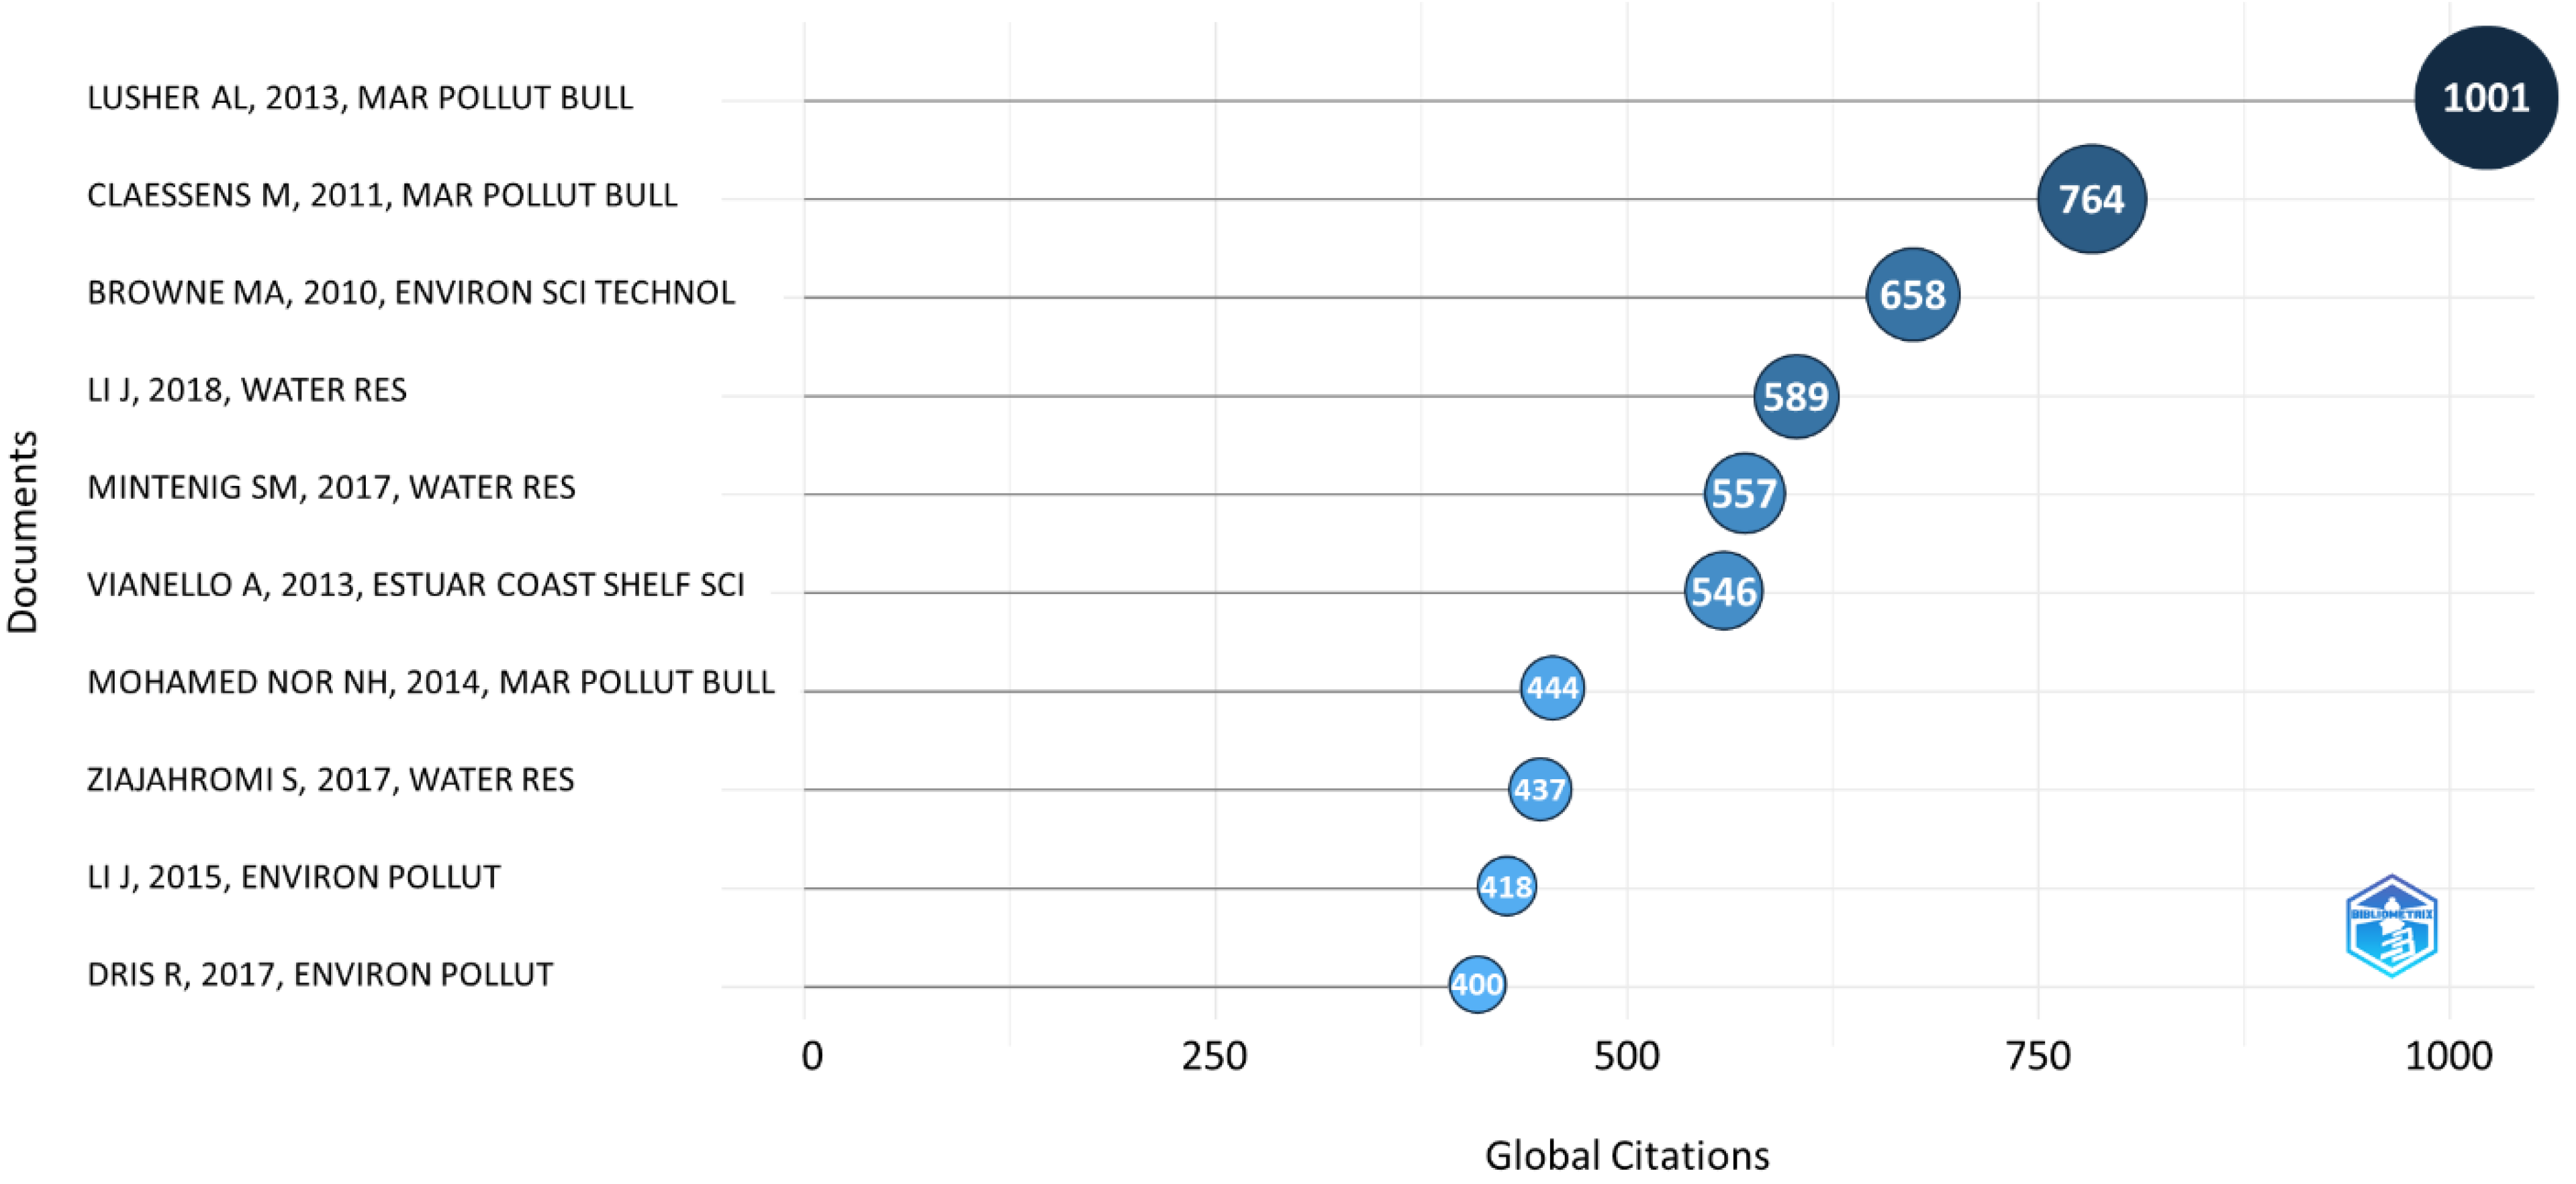
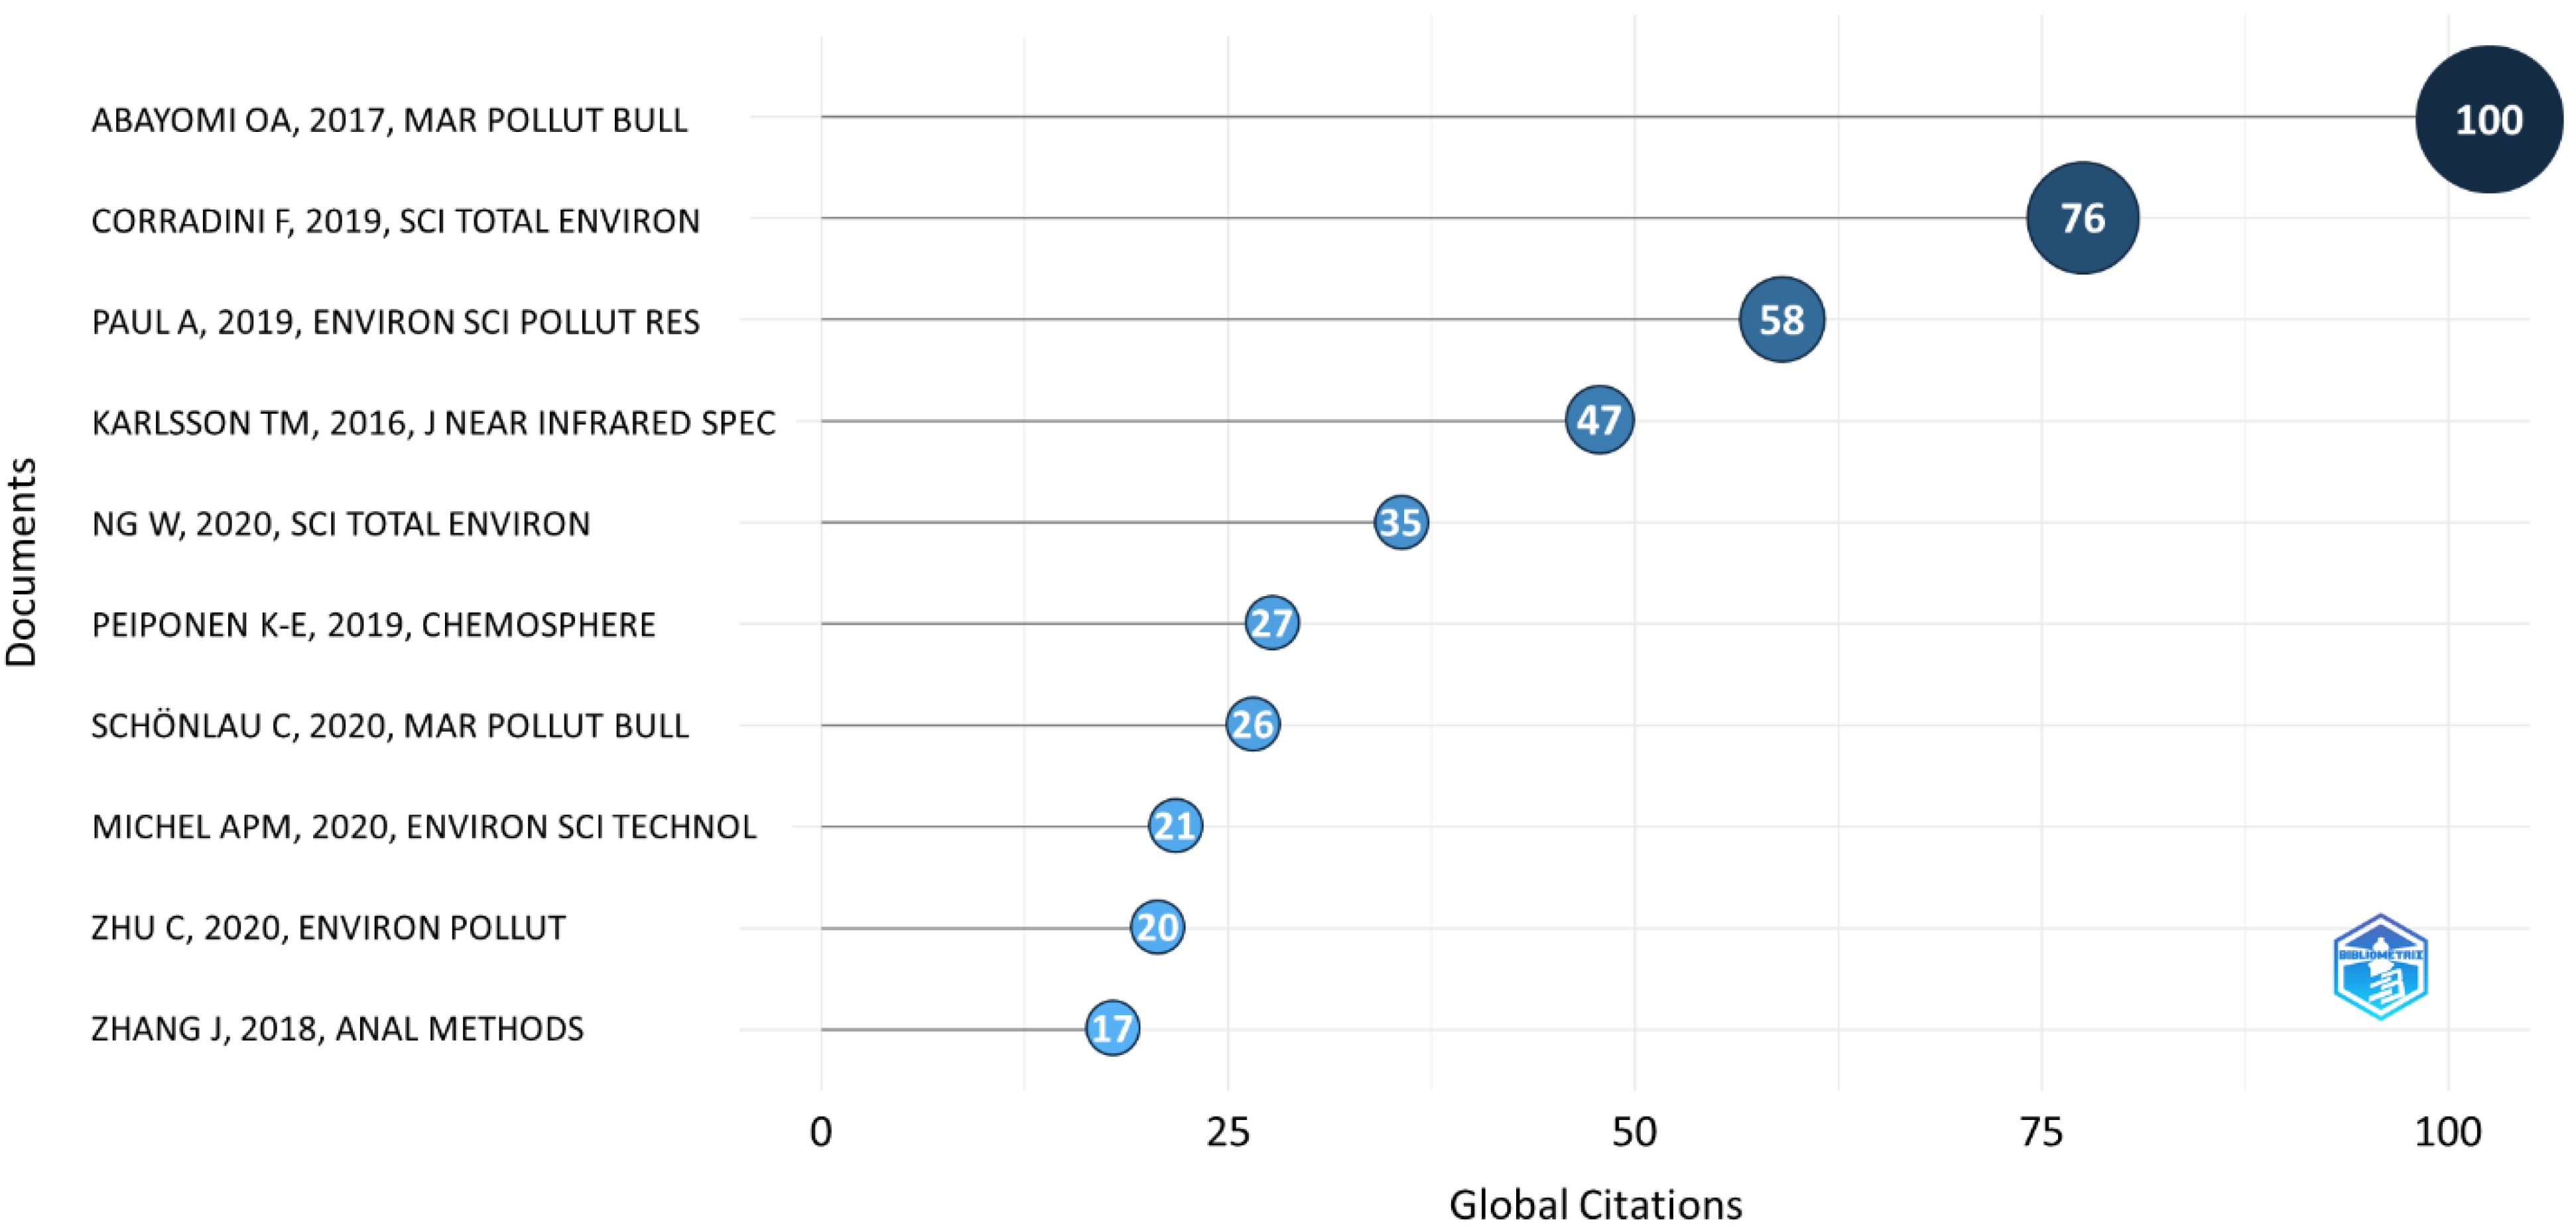
According to the present analysis (without cleaning repetitions of author names), 4421 authors have contributed to the MP research by using the FTIR method, while 193 authors have contributed to the emerging NIR technology in MP analysis. The top 10 cited documents worldwide and their authors are shown in Figure 5. Citation in scientific papers is another important sign of a paper’s quality and influence. The number of citations has long been considered a barometer of a country’s scientific research performance.
Three of the top 10 cited documents worldwide that mention the use of FTIR technique are from the United Kingdom. These two documents come from the group of Richard C. Thompson (Director of the Marine Institute School of Biological and Marine Sciences, Faculty of Science and Engineering), who published the first recent MP paper motivating the research. The second place in terms of most cited paper comes from four authors of western Europe, followed by Singapore with two authors in the list, while Chinese papers appear only once in the top 10 list (although China has published the most papers).
Regarding the NIR technique, the list is quite inconsistent (Figure 6), reflecting the early stages of the research field. Again, four of the ten publications come from Europe, two from the USA, and one each from Qatar, Japan, China, and Australia.

3.6. Co-Occurrence Network: Keyword Analysis

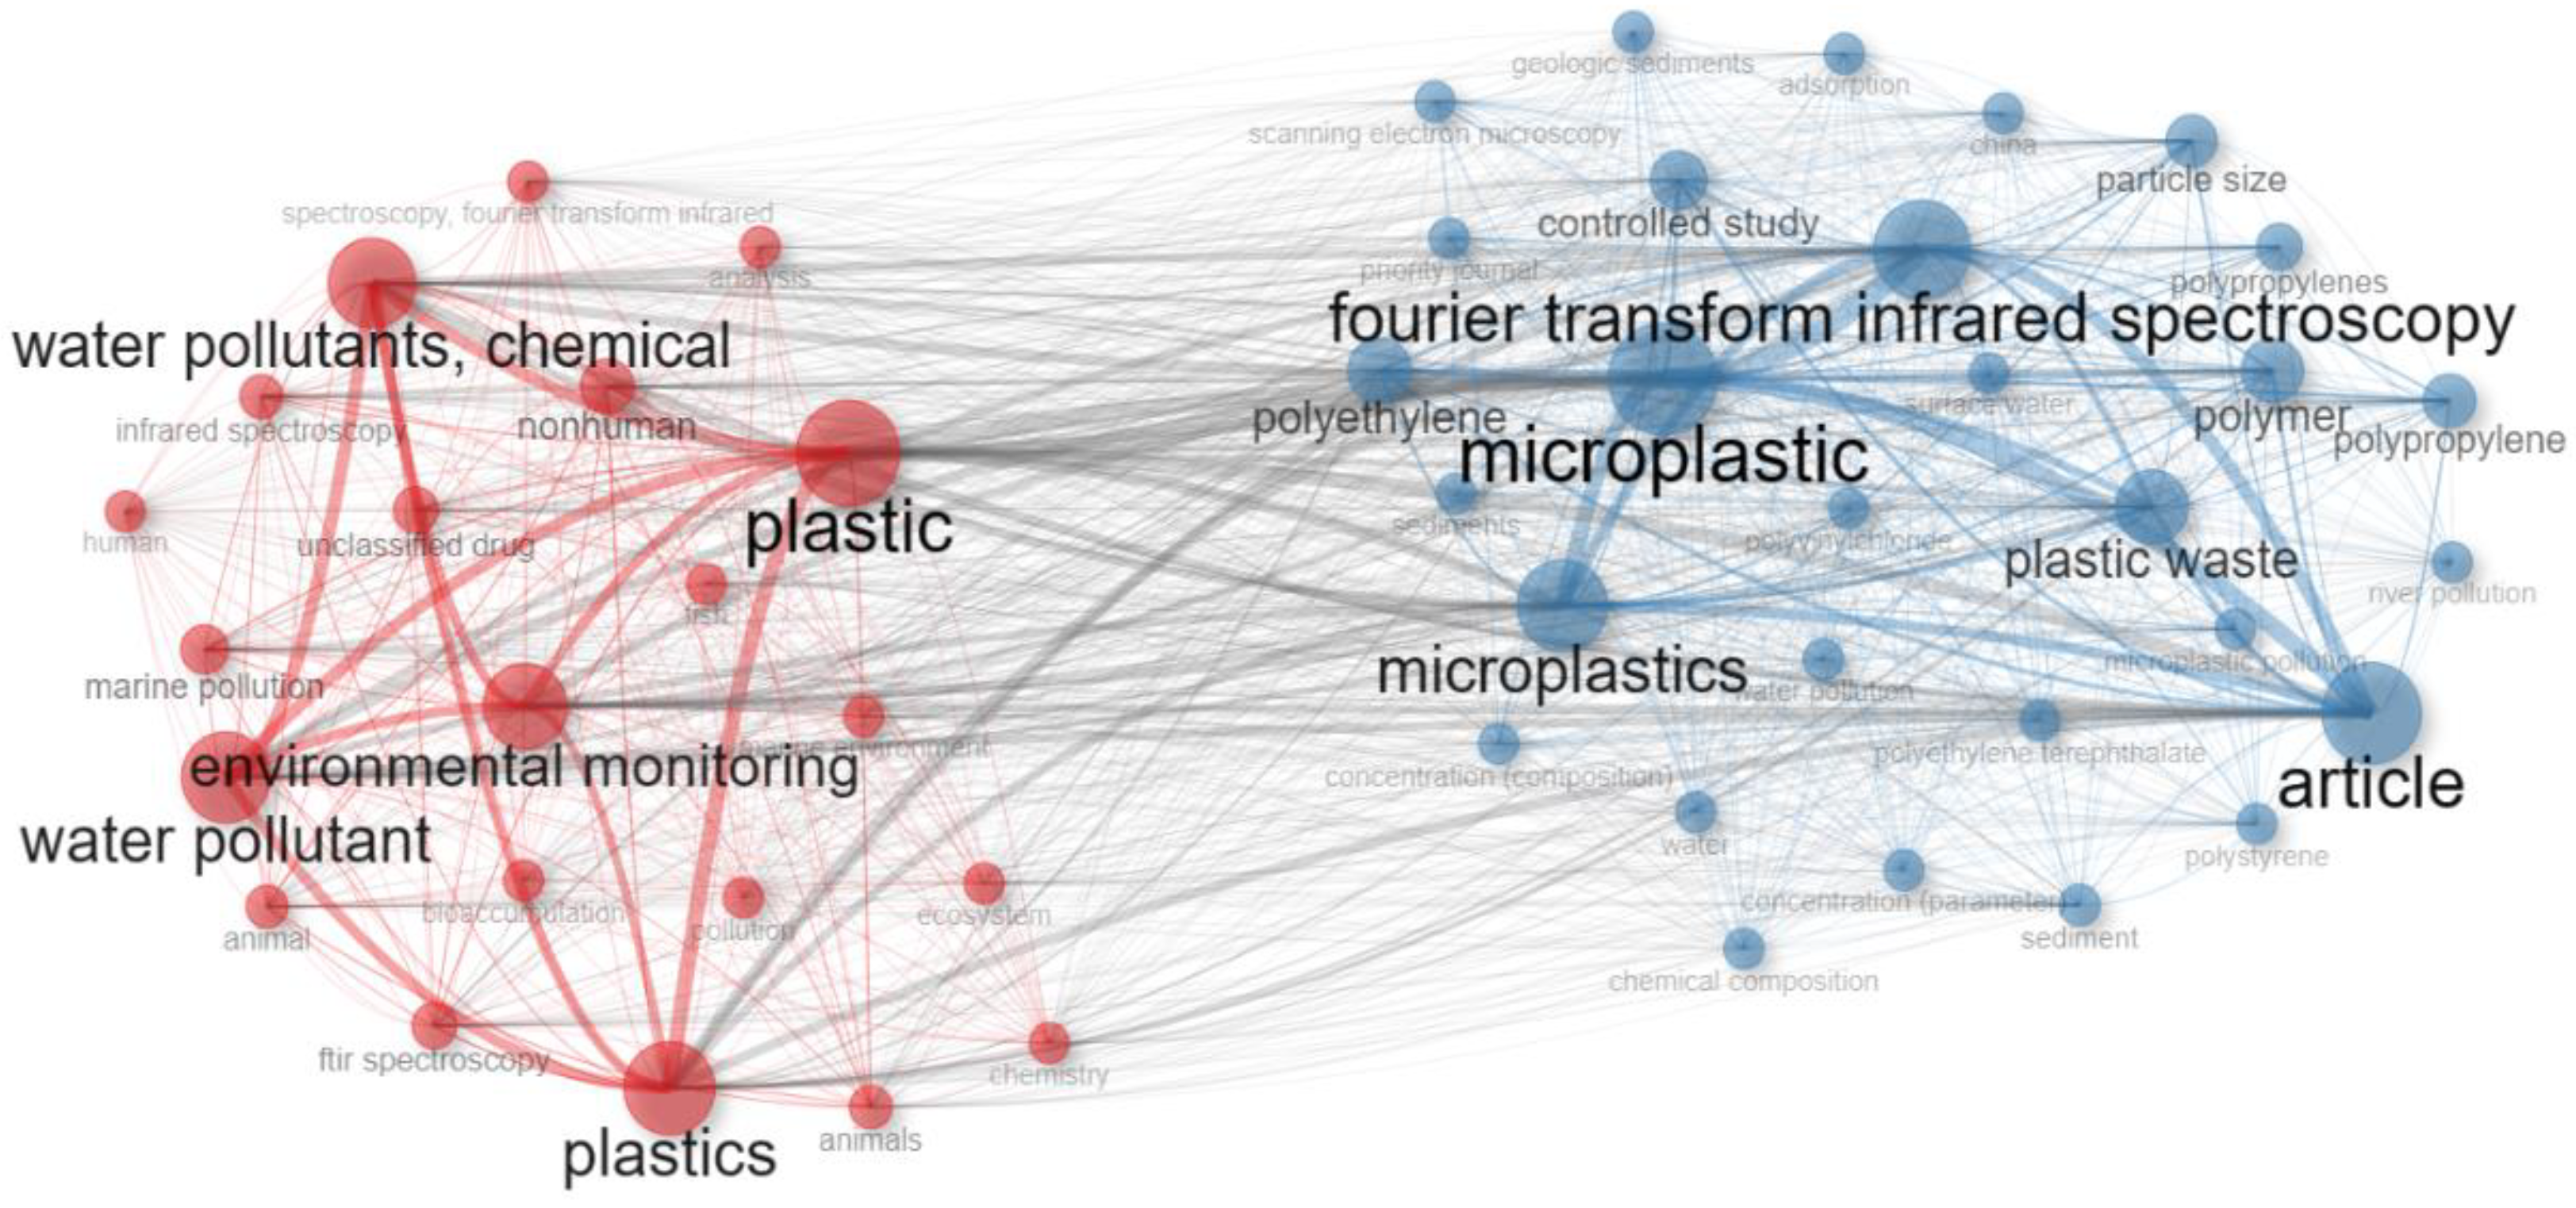
The keyword co-occurrence network entails looking at how keywords are used together in a research topic (i.e., co-occur). An arrow directs the connection between two different keywords and its thickness indicates the strength of the connection. When two keywords are next to each other and linked with an arrow, they are related and have a conceptual meaning. The diameter of the circles indicates the frequency of research: a larger circle signifies a more frequently investigated issue, observing how terms are used together in a research field (i.e., co-occur).
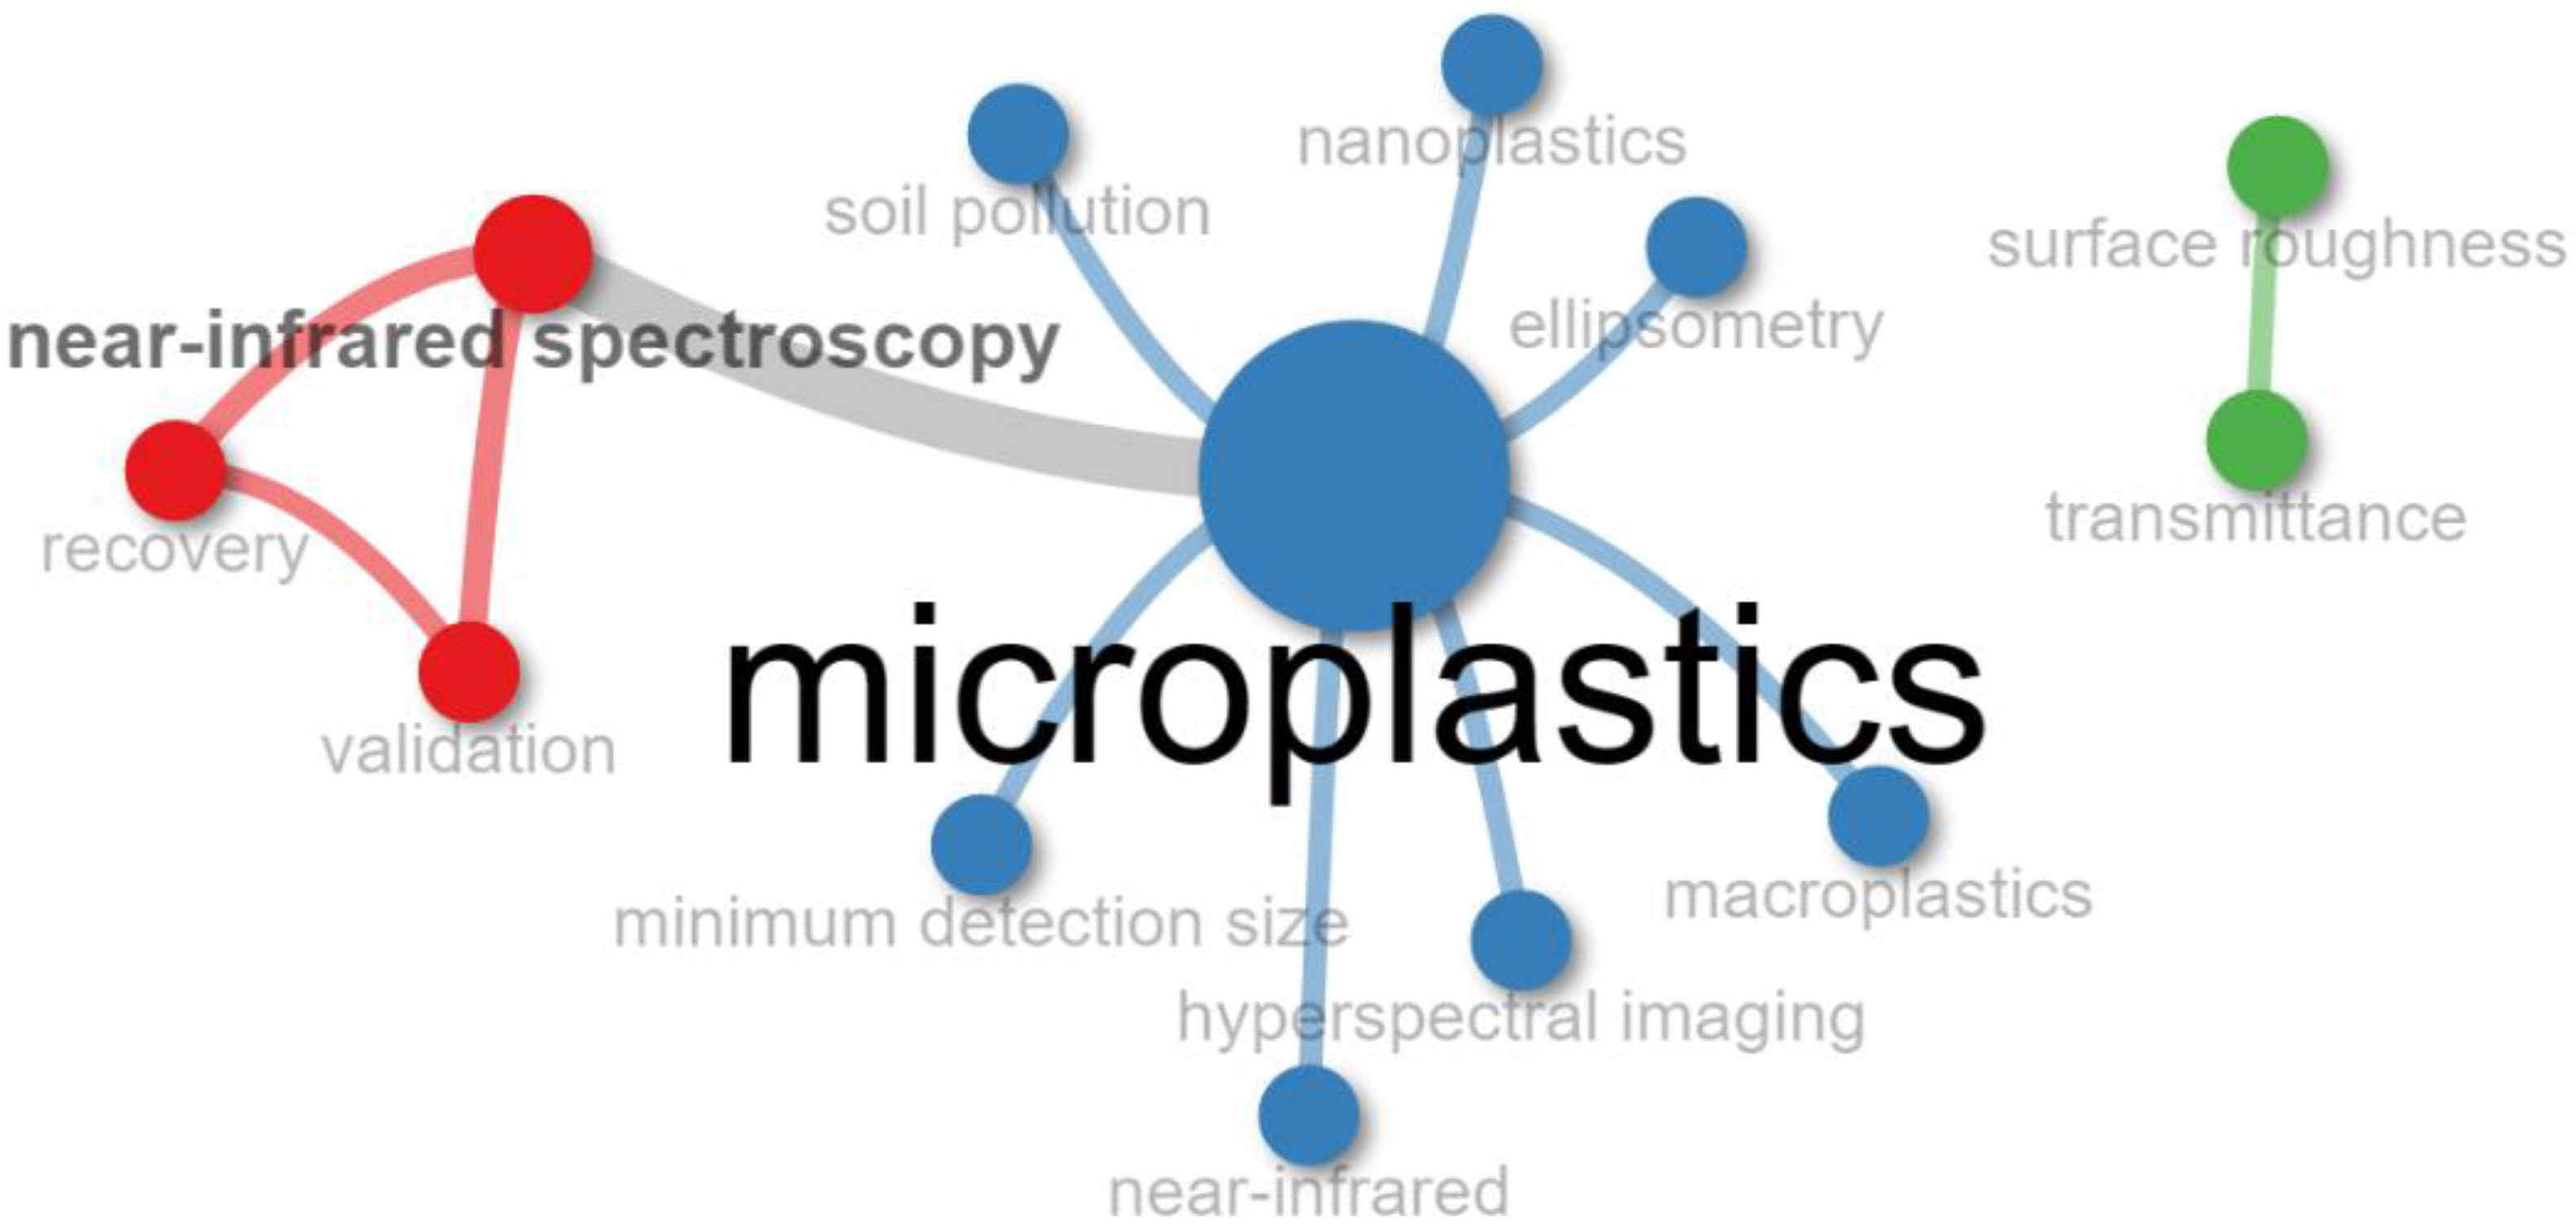
Figure 7 highlights the centrality of the four research topics: Fourier-transform infrared spectroscopy, environmental monitoring, microplastics, and water pollutants. These keywords were to be expected since the main focus of MP research is on monitoring pollutants in the marine environment. However, among the NIR-related methods (Figure 8), some interesting keywords are seen, such as: minimum detection size and hyperspectral imaging. Near-infrared hyperspectral imaging (NIR-HSI) is an extension of NIR that allows defining the sample surface and looking at homogeneity variations [57].

3.7. Thematic Map

Although the keyword co-occurrence network is effective in detecting relevance and relationships, further insights are needed to capture current patterns and future research topics. Thematic maps are easy-to-use diagrams that allow us to analyse themes based on the quadrant in which they are arranged along two axes according to their centrality and density rank values. A basic thematic map looks like the figure below (Figure 9).
(Q-1) Upper-right quadrant: motor themes—These are well-developed themes that are essential to the structure of the research field and are characterized by high centrality and density.
(Q-2) Lower-right quadrant: basic themes—The clusters are linked by numerous keywords, but differ greatly from each other. Promising or past themes that are part of the discipline are found here.
(Q-3) Upper-left quadrant: extremely specialized/niche themes—These are well-developed and very specialised themes, but play a minor role in the overall field.
(Q-4) Lower-left quadrant: emerging or disappearing topics—These themes can evolve to the right and gain centrality, and evolve upwards and gain density. They can be the starting point for new trends or developments in the field.
The centrality of a network is a measure of its interaction with other networks and is regarded “as a measure of the relevance of an issue in the evolution of the entire study field under consideration” [58]. The density indicates the degree of development of a theme and assesses the internal strength of the network. The number of occurrences of the keywords in the cluster, and thus the number of associated publications, determine its size. The label generated by the software corresponds to the dominant keyword. For this analysis, the two types of downloaded literature (FTIR-related literature, NIR-related literature) were combined.
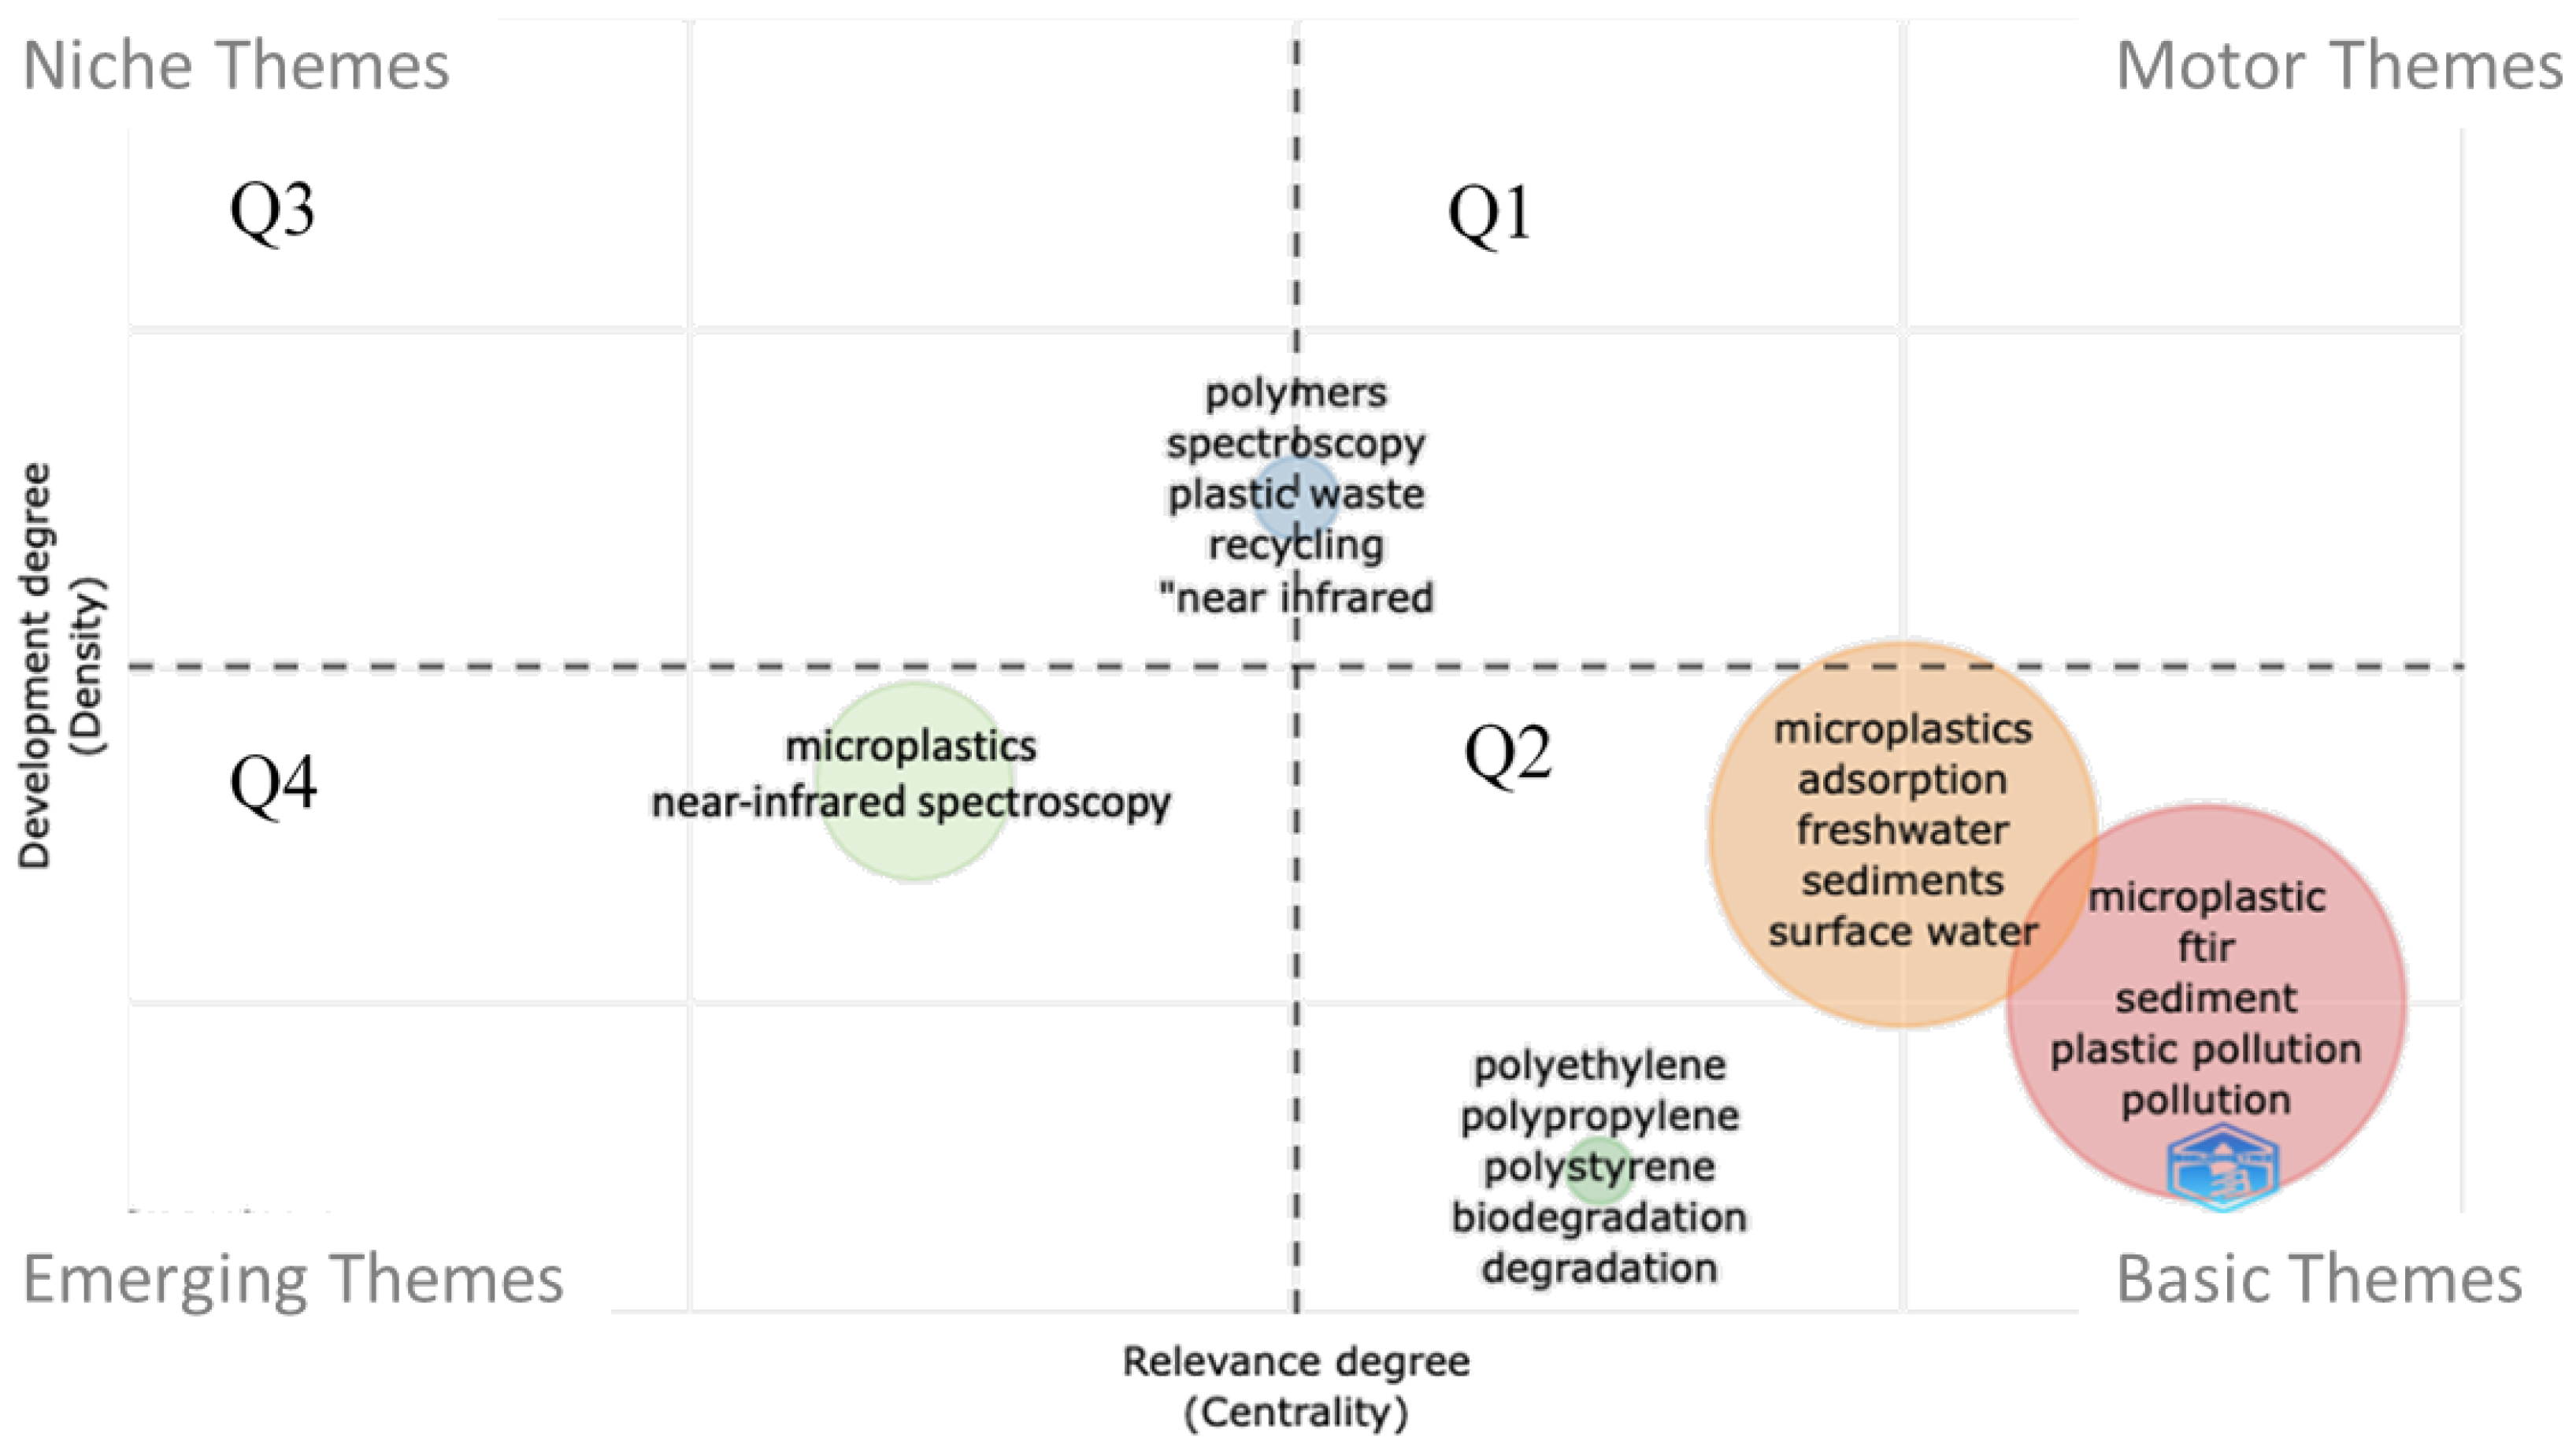
From the thematic map (Figure 10), the following observations are made:
  • Polyethylene, polypropylene, and polystyrene (Q2, basic theme) are the most studied MP polymer types and this result is consistent with the fact that these polymers account for the majority of plastic waste [59].
  • Notably, it can be seen that a theme such as MPs in freshwater and sediments at the edge of Q1 (motor theme) and in Q2 (basic theme) is able to structure the research field. In other words, MPs in the marine environment is the leading topic within the field, probably because MP research has focused on the marine environment from the beginning. In the Q2 region, FTIR with MPs and plastic pollution is seen, and it is clear that in the second quadrant promising and past themes that are part of the research field are found, and FTIR has been used from the beginning of the MP research.
  • Between Q1 (motor theme) and Q3 (niche theme) is a cluster of NIR, plastic waste, recycling, polymers, and spectroscopy that is predicted to move into Q1 in the coming years as NIR technology becomes more popular in plastic characterisation.
  • According to this analysis, MPs and NIR spectroscopy are identified as emerging topics (Q4), which is the underlying topic of this paper.
  • From Q3, it is evident that there are no fully developed themes in the field of MP analysis, neither by FTIR nor NIR methods, and it is well known that there are no standard methods to analyse MPs; however, vibrational spectroscopy-based methods are strongly preferred.
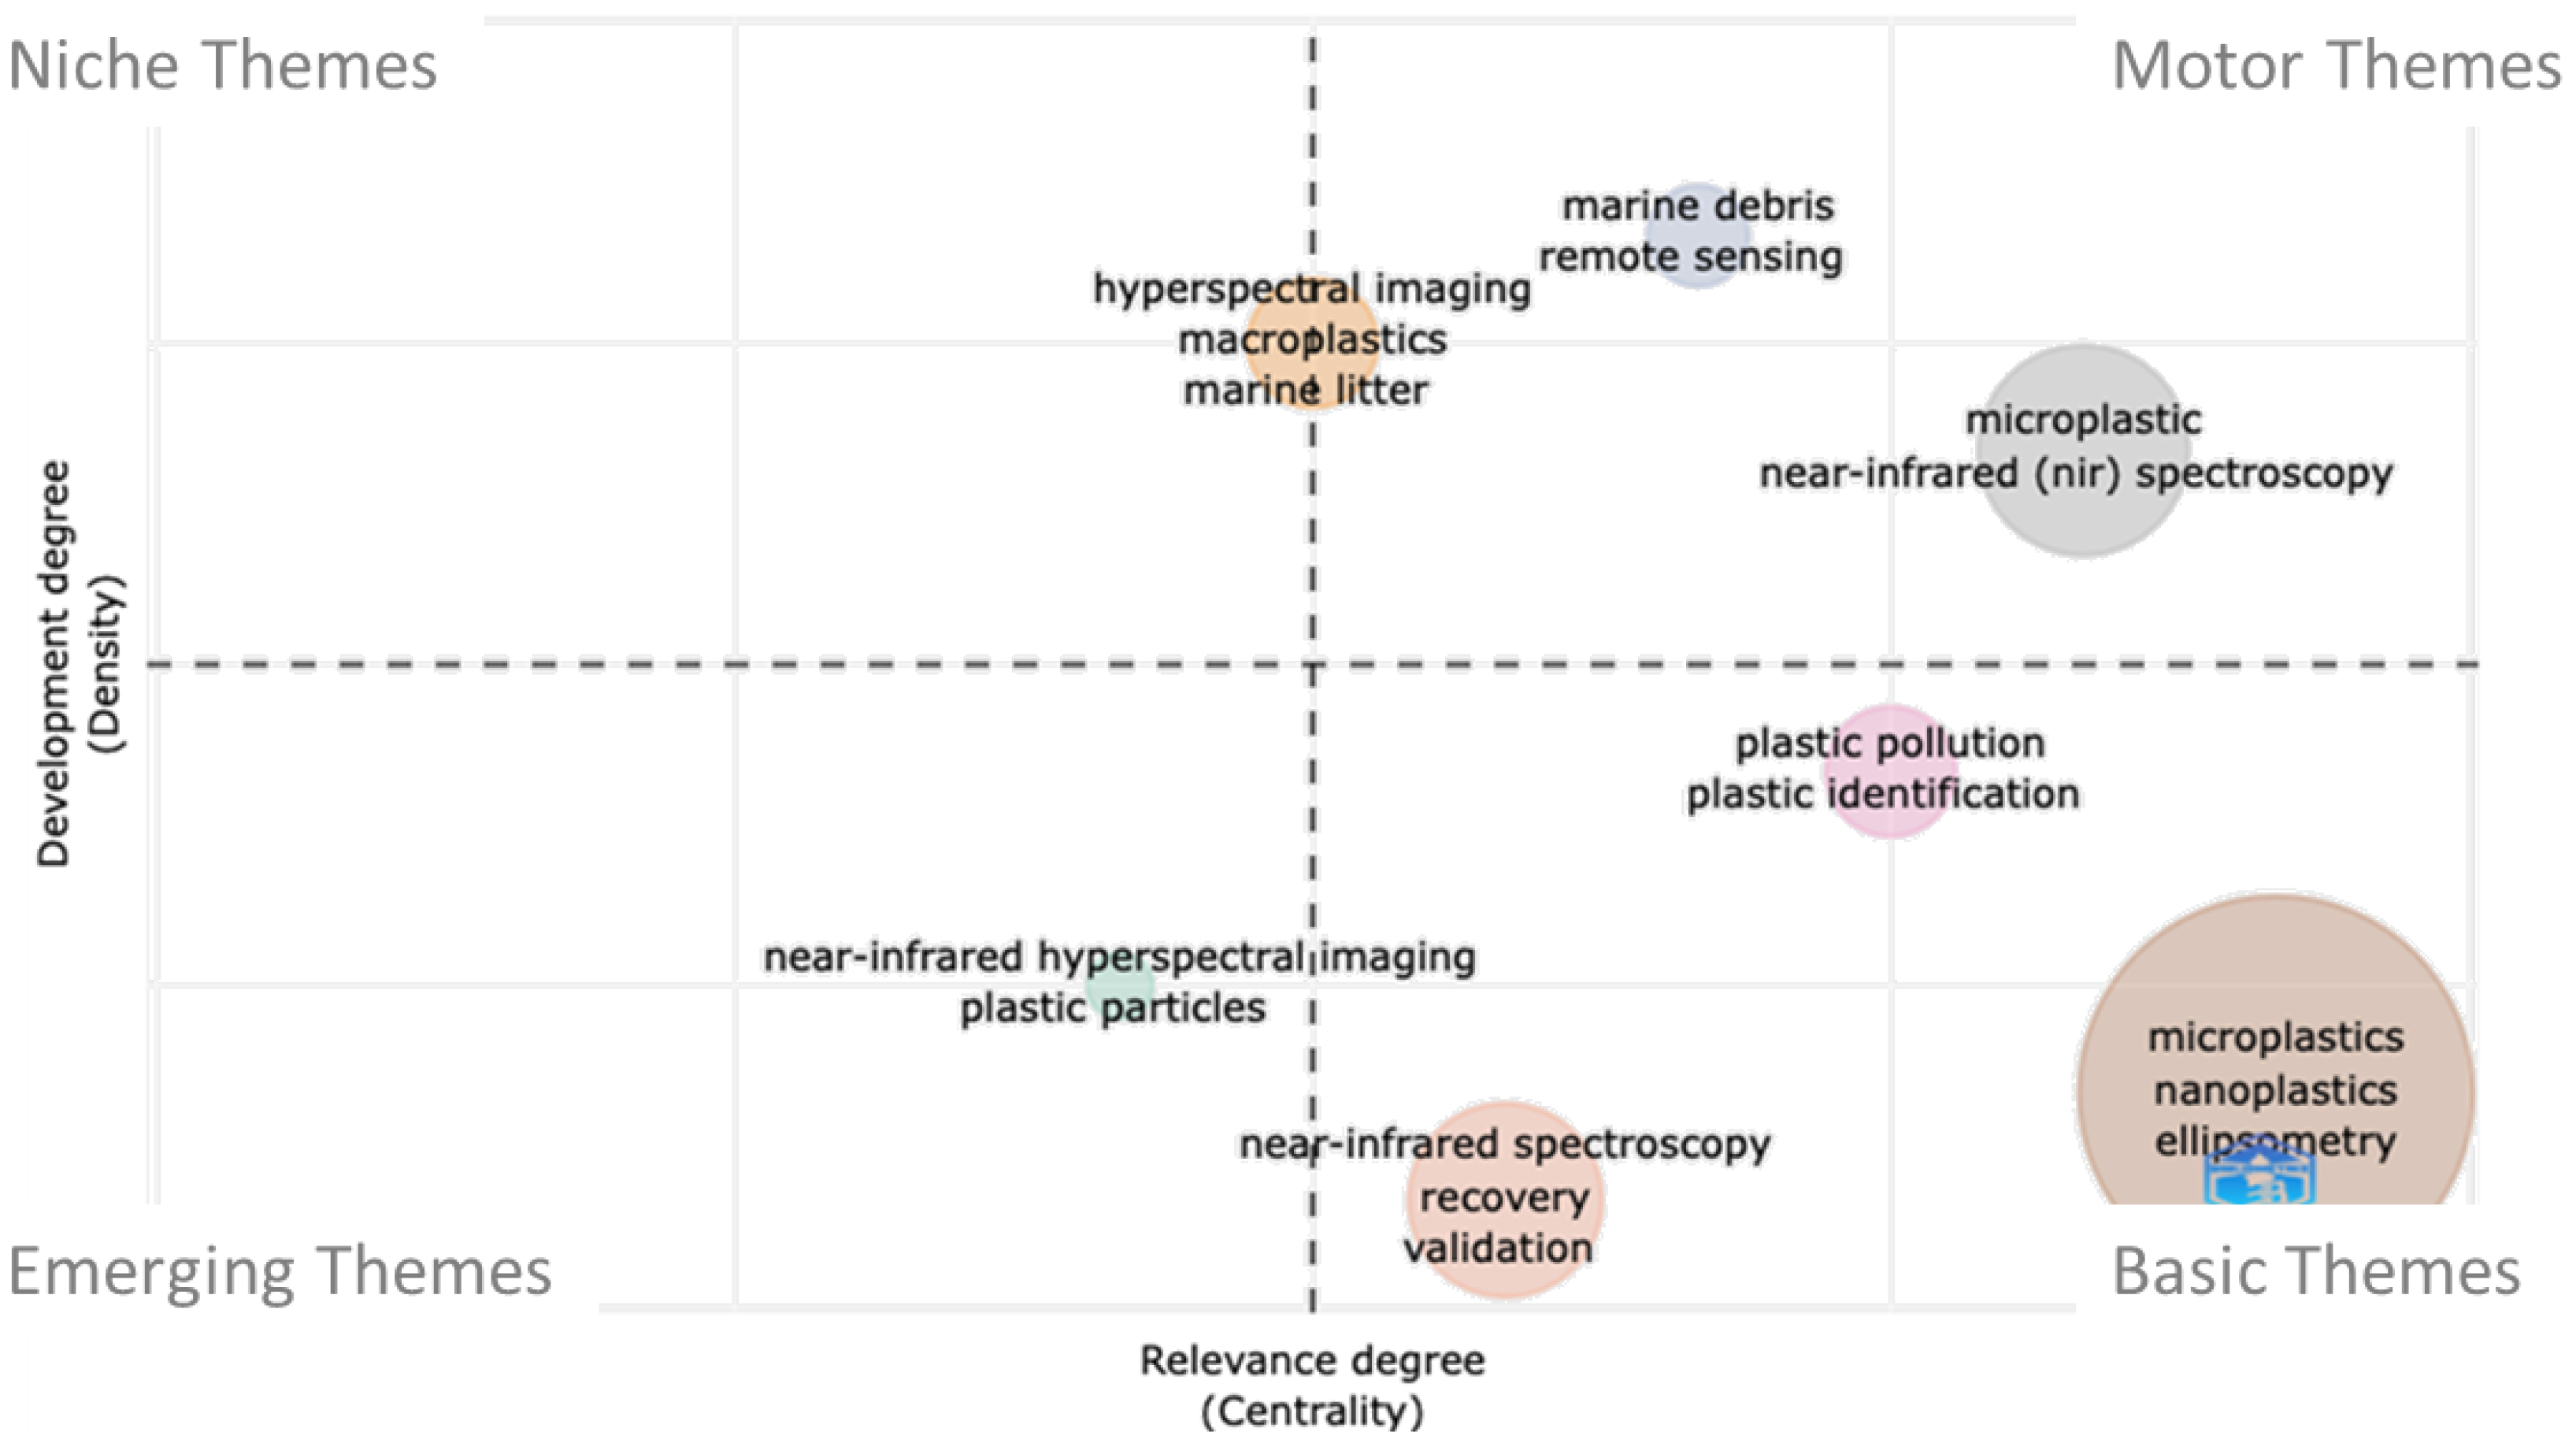
For a better understanding of the use of NIR in MP analysis, the thematic map was confined to NIR-related literature (Figure 11). As seen in the keyword analysis of NIR-literature (Figure 8), NIR hyperspectral imaging is confirmed as an emerging topic in this field (Q3). Plastic identification through chemical and optical properties is located among the basic themes, supported by the capability of NIR to differentiate plastics. MPs and NIR spectroscopy were identified as emerging topics combining FTIR- and NIR-related literature (Figure 10), motivating the direction of this paper, now further confirmed by the restricted analysis on NIR-related literature, where MPs and NIR spectroscopy, together with the possibility to investigate marine debris with remote sensing, are placed as motor themes, central and essential to the research field.

4. Limitations

The current study is limited by the research based on articles published in Scopus-indexed journals, not including grey literature or publications in non-indexed journals. As a result, publications from non-English-speaking countries may be underreported. This has implications for the top 10 countries, institutions, and authors. To overcome the risk that important contributions from outside ‘core’ journals might be missed, it can be also considered that interdisciplinary contributions place a different emphasis on publications in books, book chapters, or conference proceedings, such that some seminal publications might not necessarily appear in peer-reviewed journals. Moreover, new lines of enquiry can be added and suitable search strategies (e.g., suitable databases/sources, time periods, search terms/keywords) can be refined. Nevertheless, we believe that the articles included are a representative sample of research on the performance of authors and countries active in the two fields analysed.
Secondly, while the bibliometric method of analysis seems appropriate, it is only a tool that does not prevent a thorough reading of the articles to uncover the intellectual and conceptual structure of the field [60]. As a result, other types of analysis, such as bibliometric content analysis, can further explore the topic. In a subsequent study, different research approaches can be used to better understand how the research on the topic has progressed and to identify new gaps and future research goals.
The rapid rate of publication makes the tracking of relevant material difficult. The overwhelming amount of new information, conceptual developments, and data creates an environment in which bibliometric analysis becomes useful for providing a structured analysis of a large body of information, inferring trends over time, themes researched, identifying shifts in the boundaries of disciplines, identifying the most productive scientists and institutions, and revealing the “big picture” of existing research. This research can bring to light what would otherwise be called “invisible colleges.” In addition, long-term bibliometric analysis helps us better understand the most influential books, concepts, academics, schools of thought, and topics [60].

5. Conclusions

Research on MPs is currently particularly controversial due to the variety of research methods used. This study was conducted to provide a snapshot of the use of NIR technology to characterize MPs compared to the use of FTIR spectroscopy. Identifying the most influential papers, authors, and countries in MP research can help with regulatory decisions, research techniques, and definitions.
FTIR spectroscopy has been associated with MP analysis since its inception, while NIR spectroscopy has only recently been introduced. This field is still in its infancy, but is gaining popularity not only because of its advantages, such as portability and comprehensive measurements, but also thanks to the updated technology. Since the inception of NIR technology in MP research, it has grown rapidly. Many industrial companies are now participating in the development of instruments based on NIR technology, ranging from online analysis in factories to sensors in handheld devices. It is also worth mentioning that the “Marine Pollution Bulletin” ranks first in scientific publications on this topic, according to the citation analysis of journals, since it accepts FTIR for MP analysis, and the scientific production is geographically polarised in the European Union.

Author Contributions

Conceptualization, M.R., S.F.; Writing—original draft, M.R.; writing—review and editing, M.R., S.D., S.F., L.E.D. All authors have read and agreed to the published version of the manuscript.

Funding

This research received no external funding.

Institutional Review Board Statement

Not applicable.

Informed Consent Statement

Not applicable.

Data Availability Statement

The data presented in this study are available on request from the corresponding author.

Acknowledgments

This article is based upon work from COST Action CA20101 Plastics monitoRIng detectiOn RemedIaTion recoverY—PRIORITY, supported by COST (European Cooperation in Science and Technology). The authors acknowledge the project PON “R&I” 2014–2020: SIRIMAP—SIstemi di Rilevamento dell’Inquinamento MArino da Plastiche e successivo recupero-riciclo (No. ARS01_01183) CUP D86C18000520008.

Conflicts of Interest

The authors declare no conflict of interest.

References

  1. Thompson, R.C.; Olson, Y.; Mitchell, R.P.; Davis, A.; Rowland, S.J.; John, A.W.G.; McGonigle, D.; Russell, A.E. Lost at Sea: Where Is All the Plastic? Science 2004, 304, 838. [Google Scholar] [CrossRef] [PubMed]
  2. Kershaw, P.J.; Rochman, C.M. Sources, Fate and Effects of Microplastics in the Marine Environment: Part 2 of a Global Assessment. 2015. Available online: https://www.unep.org/resources/report/sources-fate-and-effects-microplastics-marine-environment-global-assessment (accessed on 12 October 2022).
  3. Li, M.; Wang, Y.; Xue, H.; Wu, L.; Wang, Y.; Wang, C.; Gao, X.; Li, Z.; Zhang, X.; Hasan, M.; et al. Scientometric analysis and scientific trends on microplastics research. Chemosphere 2022, 304, 135337. [Google Scholar] [CrossRef]
  4. Bank, M.S.; Mitrano, D.M.; Rillig, M.C.; Sze Ki Lin, C.; Ok, Y.S. Embrace complexity to understand microplastic pollution. Nat. Rev. Earth Environ. 2022, 3, 736–737. [Google Scholar] [CrossRef]
  5. Shim, W.J.; Hong, S.H.; Eo, S.E. Identification methods in microplastic analysis: A review. Anal. Methods 2017, 9, 1384–1391. [Google Scholar] [CrossRef]
  6. GESAMP Guidelines for the monitoring and assessment of plastic litter in the ocean. GESAMP Reports Stud. 2019, 99, 138.
  7. Rani, M.; Marchesi, C.; Federici, S.; Rovelli, G.; Alessandri, I.; Vassalini, I.; Ducoli, S.; Borgese, L.; Zacco, A.; Bilo, F.; et al. Miniaturized Near-Infrared (MicroNIR) Spectrometer in Plastic Waste Sorting. Materials 2019, 12, 2740. [Google Scholar] [CrossRef] [PubMed]
  8. Pakhomova, S.; Zhdanov, I.; van Bavel, B. Polymer type identification of marine plastic litter using a miniature near-infrared spectrometer (Micronir). Appl. Sci. 2020, 10, 8707. [Google Scholar] [CrossRef]
  9. Marchesi, C.; Rani, M.; Federici, S.; Alessandri, I.; Vassalini, I.; Ducoli, S.; Borgese, L.; Zacco, A.; Núñez-Delgado, A.; Bontempi, E.; et al. Quantification of ternary microplastic mixtures through an ultra-compact near-infrared spectrometer coupled with chemometric tools. Environ. Res. 2023, 216, 114632. [Google Scholar] [CrossRef]
  10. Karlsson, T.M.; Grahn, H.; Van Bavel, B.; Geladi, P. Hyperspectral imaging and data analysis for detecting and determining plastic contamination in seawater filtrates. J. Near Infrared Spectrosc. 2016, 24, 141–149. [Google Scholar] [CrossRef]
  11. Abayomi, O.A.; Range, P.; Al-Ghouti, M.A.; Obbard, J.P.; Almeer, S.H.; Ben-Hamadou, R. Microplastics in coastal environments of the Arabian Gulf. Mar. Pollut. Bull. 2017, 124, 181–188. [Google Scholar] [CrossRef]
  12. Zhang, J.; Tian, K.; Lei, C.; Min, S. Identification and quantification of microplastics in table sea salts using micro-NIR imaging methods. Anal. Methods 2018, 10, 2881–2887. [Google Scholar] [CrossRef]
  13. McClure, W.F. 204 Years of near infrared technology: 1800-2003. J. Near Infrared Spectrosc. 2003, 11, 487–518. [Google Scholar] [CrossRef]
  14. Woodcock, T.; Downey, G.; O’Donnell, C.P. Better quality food and beverages: The role of near infrared spectroscopy. J. Near Infrared Spectrosc. 2008, 16, 1–29. [Google Scholar] [CrossRef]
  15. Shenk, J.S.; Workman, J.J., Jr.; Westerhaus, M.O. Application of NIR spectroscopy to agricultural products. In Handbook of Near-Infrared Analysis; CRC Press: Boca Raton, FL, USA, 2007; pp. 365–404. ISBN 0429123019. [Google Scholar]
  16. Cleve, E.; Bach, E.; Schollmeyer, E. Using chemometric methods and NIR spectrophotometry in the textile industry. Anal. Chim. Acta 2000, 420, 163–167. [Google Scholar] [CrossRef]
  17. Blanco, M.; Alcalá, M.; Planells, J.; Mulero, R. Quality control of cosmetic mixtures by NIR spectroscopy. Anal. Bioanal. Chem. 2007, 389, 1577–1583. [Google Scholar] [CrossRef]
  18. Jamrógiewicz, M. Application of the near-infrared spectroscopy in the pharmaceutical technology. J. Pharm. Biomed. Anal. 2012, 66, 1–10. [Google Scholar] [CrossRef]
  19. Workman, J. A Brief Review of near Infrared in Petroleum Product Analysis. J. Near Infrared Spectrosc. 1996, 4, 69–74. [Google Scholar] [CrossRef]
  20. Ferrari, M.; Norris, K.H.; Sowa, M.G. Guest editorial: Medical near infrared spectroscopy 35 years after the discovery. J. Near Infrared Spectrosc. 2012, 20, vii–ix. [Google Scholar] [CrossRef]
  21. Heigl, N.; Petter, C.H.; Rainer, M.; Najam-ul-Haq, M.; Valiant, R.M.; Bakry, R.; Bonn, G.K.; Huck, C.W. Review: Near infrared spectroscopy for polymer research, quality control and reaction monitoring. J. Near Infrared Spectrosc. 2007, 15, 269–282. [Google Scholar] [CrossRef]
  22. Huck, C.W. The future role of near infrared spectroscopy in polymer and chemical analysis. NIR News 2016, 27, 17–23. [Google Scholar] [CrossRef]
  23. Zhou, C.; Bi, R.; Su, C.; Liu, W.; Wang, T. The emerging issue of microplastics in marine environment: A bibliometric analysis from 2004 to 2020. Mar. Pollut. Bull. 2022, 179, 113712. [Google Scholar] [CrossRef] [PubMed]
  24. Pauna, V.H.; Buonocore, E.; Renzi, M.; Russo, G.F.; Franzese, P.P. The issue of microplastics in marine ecosystems: A bibliometric network analysis. Mar. Pollut. Bull. 2019, 149, 110612. [Google Scholar] [CrossRef]
  25. Kasavan, S.; Yusoff, S.; Rahmat Fakri, M.F.; Siron, R. Plastic pollution in water ecosystems: A bibliometric analysis from 2000 to 2020. J. Clean. Prod. 2021, 313, 127946. [Google Scholar] [CrossRef]
  26. Can-Güven, E. Microplastics as emerging atmospheric pollutants: A review and bibliometric analysis. Air Qual. Atmos. Heal. 2021, 14, 203–215. [Google Scholar] [CrossRef]
  27. Wong, S.L.; Nyakuma, B.B.; Wong, K.Y.; Lee, C.T.; Lee, T.H.; Lee, C.H. Microplastics and nanoplastics in global food webs: A bibliometric analysis (2009–2019). Mar. Pollut. Bull. 2020, 158, 111432. [Google Scholar] [CrossRef] [PubMed]
  28. Palmas, S.; Vacca, A.; Mais, L. Bibliometric analysis on the papers dedicated to microplastics in wastewater treatments. Catalysts 2021, 11, 913. [Google Scholar] [CrossRef]
  29. Ebrahimi, P.; Abbasi, S.; Pashaei, R.; Bogusz, A.; Oleszczuk, P. Investigating impact of physicochemical properties of microplastics on human health: A short bibliometric analysis and review. Chemosphere 2022, 289, 133146. [Google Scholar] [CrossRef] [PubMed]
  30. Lima, P.; Steger, S.; Glade, T.; Murillo-García, F.G. Literature review and bibliometric analysis on data-driven assessment of landslide susceptibility. J. Mt. Sci. 2022, 19, 1670–1698. [Google Scholar] [CrossRef]
  31. Linnenluecke, M.K.; Marrone, M.; Singh, A.K. Conducting systematic literature reviews and bibliometric analyses. Aust. J. Manag. 2020, 45, 175–194. [Google Scholar] [CrossRef]
  32. Su, B.; Guan, Q.; Yu, S. The neurotoxicity of nanoparticles: A bibliometric analysis. Toxicol. Ind. Health 2018, 34, 922–929. [Google Scholar] [CrossRef]
  33. Bragazzi, N.L. Nanomedicine: Insights from a bibliometrics-based analysis of emerging publishing and research trends. Medicina 2019, 55, 785. [Google Scholar] [CrossRef] [PubMed] [Green Version]
  34. Federici, S.; Ademovic, Z.; Amorim, M.J.B.; Bigalke, M.; Cocca, M.; Depero, L.E.; Dutta, J.; Fritzsche, W.; Hartmann, N.B.; Kalčikova, G.; et al. COST Action PRIORITY: An EU Perspective on Micro- and Nanoplastics as Global Issues. Microplastics 2022, 1, 282–290. [Google Scholar] [CrossRef]
  35. Veerasingam, S.; Ranjani, M.; Venkatachalapathy, R.; Bagaev, A.; Mukhanov, V.; Litvinyuk, D.; Mugilarasan, M.; Gurumoorthi, K.; Guganathan, L.; Aboobacker, V.M.; et al. Contributions of Fourier transform infrared spectroscopy in microplastic pollution research: A review. Crit. Rev. Environ. Sci. Technol. 2021, 51, 2681–2743. [Google Scholar] [CrossRef]
  36. SCOPUS. Available online: https://www.scopus.com/ (accessed on 17 August 2022).
  37. Falagas, M.E.; Pitsouni, E.I.; Malietzis, G.A.; Pappas, G. Comparison of PubMed, Scopus, web of science, and Google scholar: Strengths and weaknesses. FASEB J. 2008, 22, 338–342. [Google Scholar] [CrossRef] [PubMed]
  38. Aria, M.; Cuccurullo, C. bibliometrix: An R-tool for comprehensive science mapping analysis. J. Informetr. 2017, 11, 959–975. [Google Scholar] [CrossRef]
  39. Federici, S.; Rani, M.; Depero, L.E. Results of VAMAS Survey Regarding Microplastic Issues. ChemRxiv 2021. preprint. [Google Scholar] [CrossRef]
  40. Lusher, A.L.; McHugh, M.; Thompson, R.C. Occurrence of microplastics in the gastrointestinal tract of pelagic and demersal fish from the English Channel. Mar. Pollut. Bull. 2013, 67, 94–99. [Google Scholar] [CrossRef] [PubMed]
  41. Claessens, M.; De Meester, S.; Van Landuyt, L.; De Clerck, K.; Janssen, C.R. Occurrence and distribution of microplastics in marine sediments along the Belgian coast. Mar. Pollut. Bull. 2011, 62, 2199–2204. [Google Scholar] [CrossRef] [PubMed]
  42. Browne, M.A.; Galloway, T.S.; Thompson, R.C. Spatial patterns of plastic debris along estuarine shorelines. Environ. Sci. Technol. 2010, 44, 3404–3409. [Google Scholar] [CrossRef]
  43. Li, J.; Liu, H.; Chen, J.P. Microplastics in freshwater systems: A review on occurrence, environmental effects, and methods for microplastics detection. Water Res. 2018, 137, 362–374. [Google Scholar] [CrossRef] [PubMed]
  44. Mintenig, S.M.; Int-Veen, I.; Löder, M.G.J.; Primpke, S.; Gerdts, G. Identification of microplastic in effluents of waste water treatment plants using focal plane array-based micro-Fourier-transform infrared imaging. Water Res. 2017, 108, 365–372. [Google Scholar] [CrossRef] [PubMed]
  45. Vianello, A.; Boldrin, A.; Guerriero, P.; Moschino, V.; Rella, R.; Sturaro, A.; Da Ros, L. Microplastic particles in sediments of Lagoon of Venice, Italy: First observations on occurrence, spatial patterns and identification. Estuar. Coast. Shelf Sci. 2013, 130, 54–61. [Google Scholar] [CrossRef]
  46. Mohamed Nor, N.H.; Obbard, J.P. Microplastics in Singapore’s coastal mangrove ecosystems. Mar. Pollut. Bull. 2014, 79, 278–283. [Google Scholar] [CrossRef]
  47. Ziajahromi, S.; Neale, P.A.; Rintoul, L.; Leusch, F.D.L. Wastewater treatment plants as a pathway for microplastics: Development of a new approach to sample wastewater-based microplastics. Water Res. 2017, 112, 93–99. [Google Scholar] [CrossRef] [PubMed]
  48. Li, J.; Yang, D.; Li, L.; Jabeen, K.; Shi, H. Microplastics in commercial bivalves from China. Environ. Pollut. 2015, 207, 190–195. [Google Scholar] [CrossRef]
  49. Dris, R.; Gasperi, J.; Mirande, C.; Mandin, C.; Guerrouache, M.; Langlois, V.; Tassin, B. A first overview of textile fibers, including microplastics, in indoor and outdoor environments. Environ. Pollut. 2017, 221, 453–458. [Google Scholar] [CrossRef]
  50. Corradini, F.; Bartholomeus, H.; Huerta Lwanga, E.; Gertsen, H.; Geissen, V. Predicting soil microplastic concentration using vis-NIR spectroscopy. Sci. Total Environ. 2019, 650, 922–932. [Google Scholar] [CrossRef]
  51. Paul, A.; Wander, L.; Becker, R.; Goedecke, C.; Braun, U. High-throughput NIR spectroscopic (NIRS) detection of microplastics in soil. Environ. Sci. Pollut. Res. 2019, 26, 7364–7374. [Google Scholar] [CrossRef]
  52. Ng, W.; Minasny, B.; McBratney, A. Convolutional neural network for soil microplastic contamination screening using infrared spectroscopy. Sci. Total Environ. 2020, 702, 134723. [Google Scholar] [CrossRef]
  53. Peiponen, K.E.; Räty, J.; Ishaq, U.; Pélisset, S.; Ali, R. Outlook on optical identification of micro- and nanoplastics in aquatic environments. Chemosphere 2019, 214, 424–429. [Google Scholar] [CrossRef]
  54. Schönlau, C.; Karlsson, T.M.; Rotander, A.; Nilsson, H.; Engwall, M.; van Bavel, B.; Kärrman, A. Microplastics in sea-surface waters surrounding Sweden sampled by manta trawl and in-situ pump. Mar. Pollut. Bull. 2020, 153, 111019. [Google Scholar] [CrossRef]
  55. Michel, A.P.M.; Morrison, A.E.; Preston, V.L.; Marx, C.T.; Colson, B.C.; White, H.K. Rapid Identification of Marine Plastic Debris via Spectroscopic Techniques and Machine Learning Classifiers. Environ. Sci. Technol. 2020, 54, 10630–10637. [Google Scholar] [CrossRef]
  56. Zhu, C.; Kanaya, Y.; Nakajima, R.; Tsuchiya, M.; Nomaki, H.; Kitahashi, T.; Fujikura, K. Characterization of microplastics on filter substrates based on hyperspectral imaging: Laboratory assessments. Environ. Pollut. 2020, 263, 114296. [Google Scholar] [CrossRef]
  57. Pieszczek, L.; Daszykowski, M. Near-infrared hyperspectral imaging for polymer particle size estimation. Measurement 2021, 186, 110201. [Google Scholar] [CrossRef]
  58. Cobo, M.J.; López-Herrera, A.G.; Herrera-Viedma, E.; Herrera, F. An approach for detecting, quantifying, and visualizing the evolution of a research field: A practical application to the Fuzzy Sets Theory field. J. Informetr. 2011, 5, 146–166. [Google Scholar] [CrossRef]
  59. Chubarenko, I.; Efimova, I.; Bagaeva, M.; Bagaev, A.; Isachenko, I. On mechanical fragmentation of single-use plastics in the sea swash zone with different types of bottom sediments: Insights from laboratory experiments. Mar. Pollut. Bull. 2020. [Google Scholar] [CrossRef]
  60. Ferreira, M.P.; Santos, J.C.; de Almeida, M.I.R.; Reis, N.R. Mergers & acquisitions research: A bibliometric study of top strategy and international business journals, 1980–2010. J. Bus. Res. 2014, 67, 2550–2558. [Google Scholar]
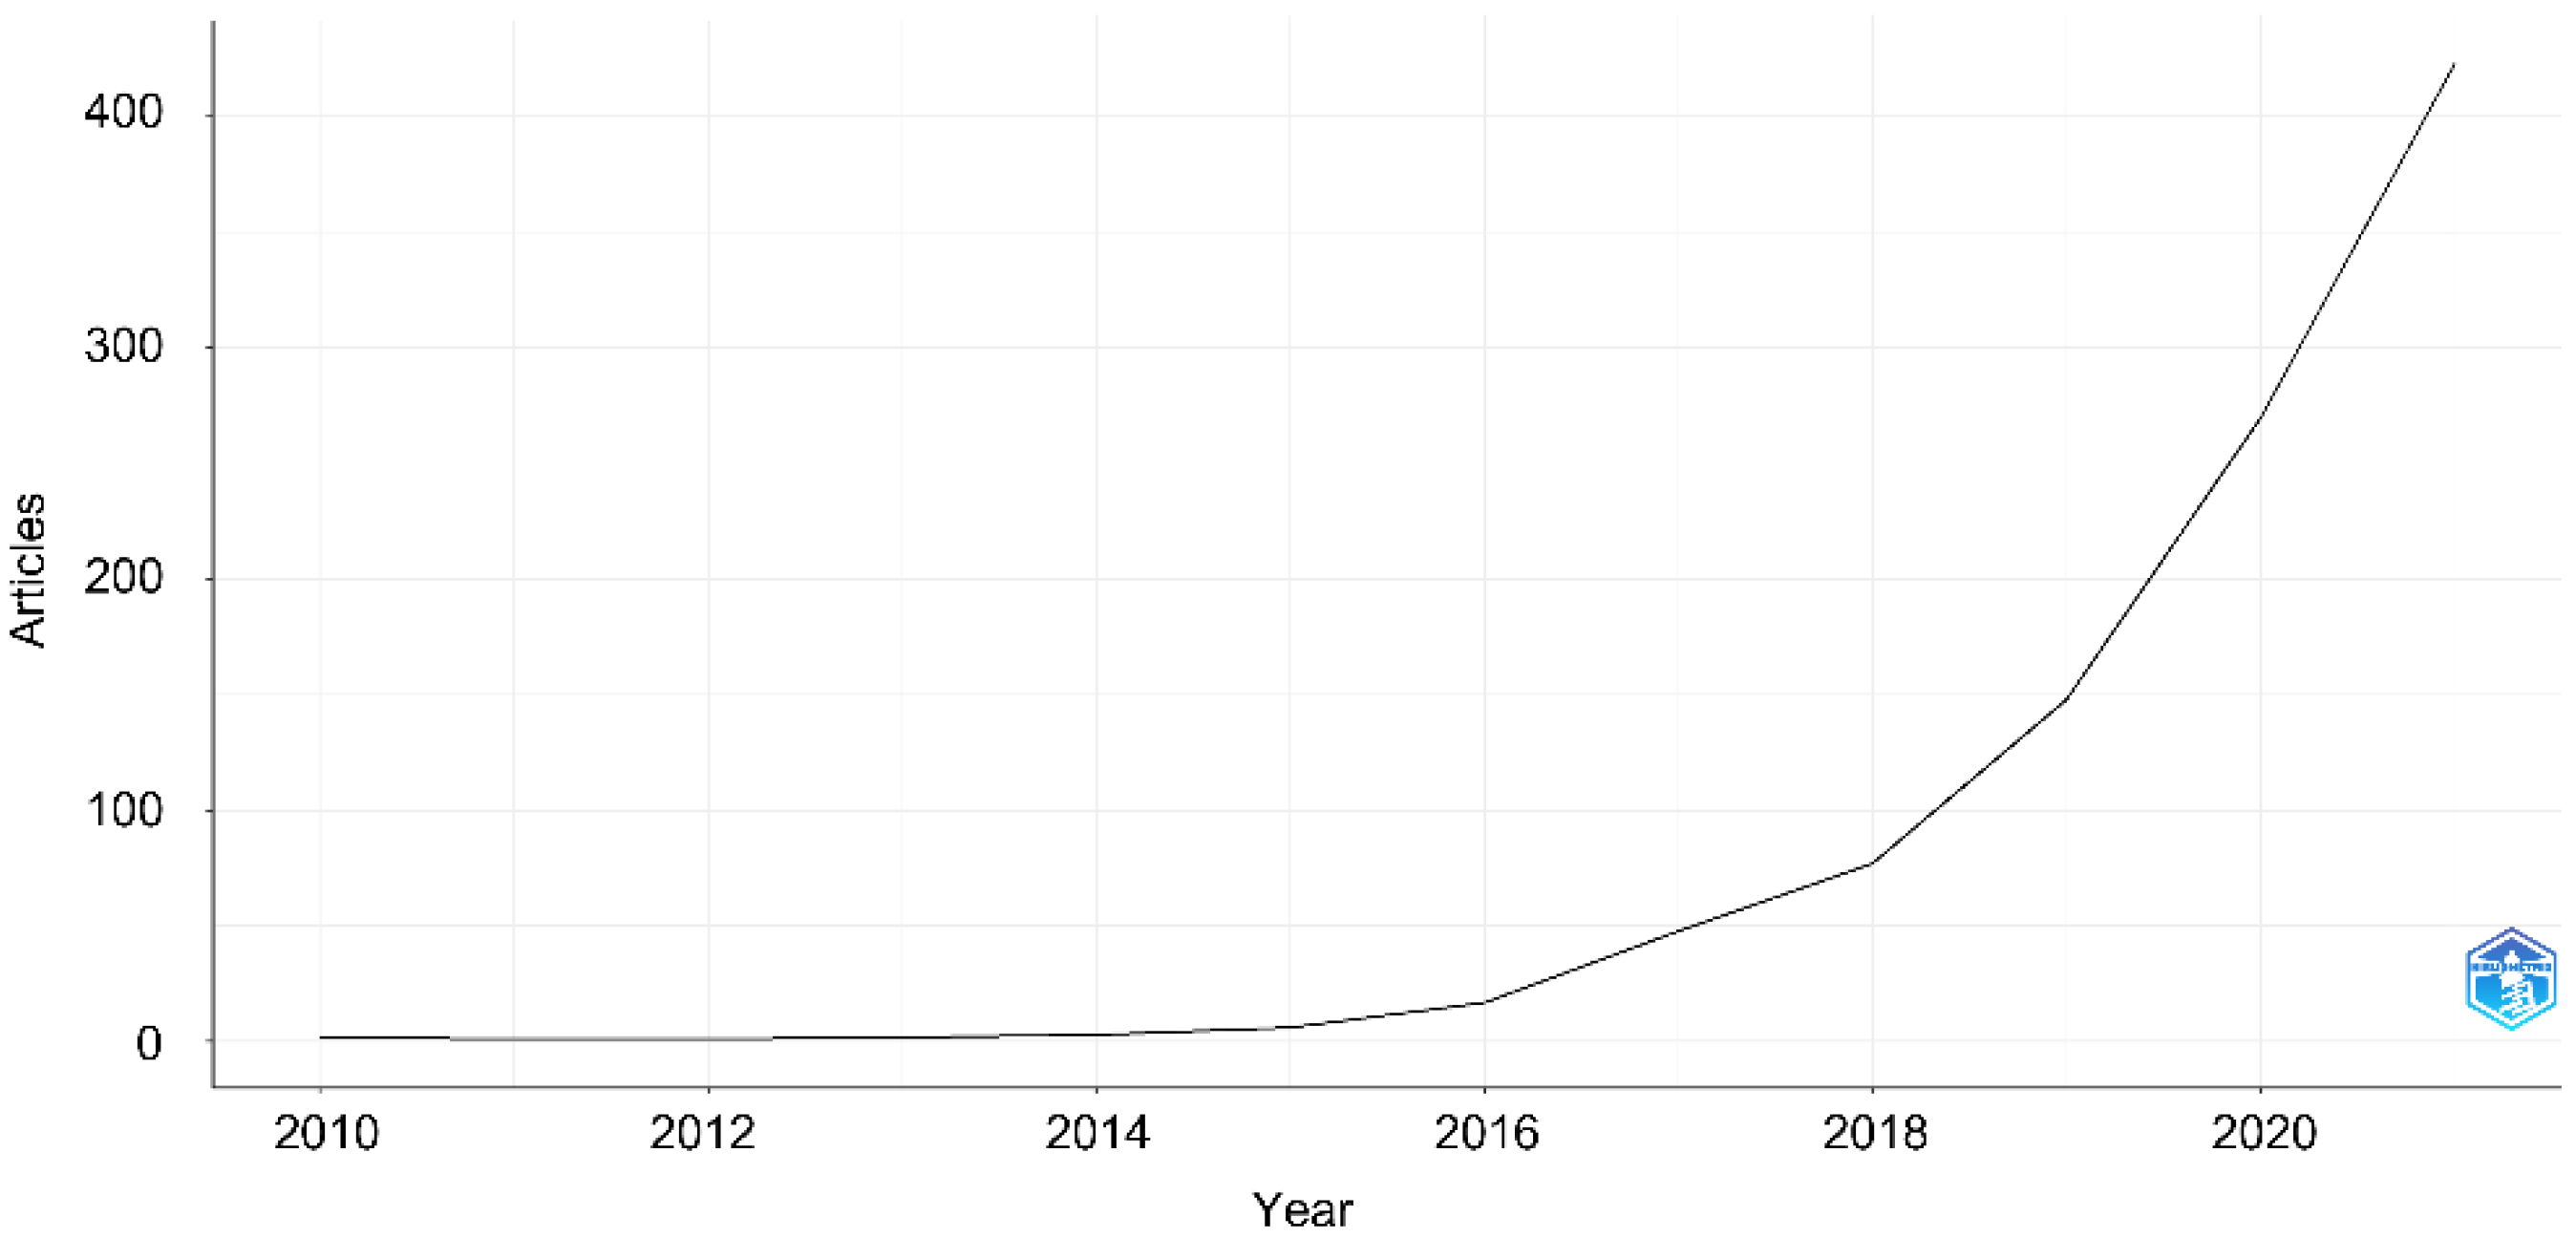
Figure 1. Annual Scientific Production of the publications mentioning the use of FTIR technology to analyse MPs. The plot was generated using the open-source tool Biblioshiny for Bibliometrix [38].
Microplastics 02 00008 g001
Figure 2. Annual Scientific Production of the publications mentioning use of NIR technology to analyse MPs. The plot was generated using the open-source tool Biblioshiny for Bibliometrix [38].
Microplastics 02 00008 g002
Figure 3. Scientific production by country-FTIR related Literature. The map was generated using the open-source tool Biblioshiny for Bibliometrix [38]. Different shades of blue indicate different productivity rate: dark blue  =  high productivity; grey  =  no articles. Number of documents is listed per corresponding author’s countries.
Microplastics 02 00008 g003
Figure 4. Scientific production by country-NIR related Literature. The map was using the open-source tool Biblioshiny for Bibliometrix [38]. Different shades of blue indicate different productivity rate: dark blue  =  high productivity; grey  =  no articles. Number of documents is listed per corresponding author’s countries.
Microplastics 02 00008 g004
Figure 5. Top 10 most globally cited documents with number of citations for FTIR-related literature [40,41,42,43,44,45,46,47,48,49]. The figure was generated using the open-source tool Biblioshiny for Bibliometrix (Aria and Cuccurullo 2017).
Microplastics 02 00008 g005
Figure 6. Top 10 most globally cited documents with number of citations for NIR-related literature [10,11,12,50,51,52,53,54,55,56]. The figure was generated using the open-source tool Biblioshiny for Bibliometrix [38].
Microplastics 02 00008 g006
Figure 7. The Co-Occurrence Keyword Analysis for FTIR-related literature. The figure was generated using the open-source tool Biblioshiny for Bibliometrix [38].
Microplastics 02 00008 g007
Figure 8. The Co-Occurrence Keyword Analysis for NIR-related literature. The figure was generated using the open-source tool Biblioshiny for Bibliometrix [38].
Microplastics 02 00008 g008
Figure 9. Basic themes of a thematic map.
Microplastics 02 00008 g009
Figure 10. Thematic Map: FTIR- and NIR-related literature combined. The main theme is in Q1, followed by highly developed and specialized themes that connect to the main theme in Q2, fading or emerging themes in Q3, and foundational and transversal themes in Q4. The map was generated using the open-source tool Biblioshiny for Bibliometrix [38].
Microplastics 02 00008 g010
Figure 11. Thematic Map limited to NIR-related literature. The main theme is in Q1, followed by highly developed and specialized themes that connect to the main theme in Q2, fading or emerging themes in Q3, and foundational and transversal themes in Q4. The map was generated using the open-source tool Biblioshiny for Bibliometrix [38].
Microplastics 02 00008 g011
Table 1. General information regarding the data and document type from Scopus.
DescriptionResults
Main information about data1. Plastic + NIR2. MP + FTIR3. MP+ NIR
Timespan1993:20212010:20212016:2021
Source (Journals, book, etc.)6717425
Documents10299839
Average years from publication6.72.191.79
Average citation per document16.1646.5114.18
Average citations per year doc2.70310.784.044
Document Type
Article6891935
Conference Paper252502
Review095402
Table 2. Average number of citations received by analysis of MPs with FTIR and NIR papers per year.
YearFTIR + MP
Number of Publications
FTIR + MP
Average Citation per Year
NIR + MP
Number of Publications
NIR + MP
Average Citation per Year
2010234.89--
2011158.77--
2012115.83--
2013270.32--
2014332.77--
2015635.7--
20161718.5715.88
20174821.73114.29
20187721.2312.83
201914812.7348.05
20202707.12113.18
20214232.58211.40
Table 3. List of Top 10 Journals Publishing FTIR- and NIR-related literature.
FTIR + MPJournal
IF 2021
NIR + MPJournal
IF 2021
Marine Pollution Bulletin7.001Marine Pollution Bulletin7.001
Science of the Total Environment10.753Analytical Methods3.532
Environmental Pollution9.988Chemosphere8.943
Chemosphere8.943Environmental Pollution9.988
Journal of Hazardous Materials14.224Science of the Total Environment10.753
Water Research13.400Journal of Hazardous Materials14.224
Environmental Science and Technology11.357Water Research13.400
Environmental Science and Pollution Research5.190ACS Applied Materials and Interfaces10.383
MethodsX2.21Applied Sciences (Switzerland)2.838
Environmental Toxicology and Chemistry4.218Chemosensors4.229
Disclaimer/Publisher’s Note: The statements, opinions and data contained in all publications are solely those of the individual author(s) and contributor(s) and not of MDPI and/or the editor(s). MDPI and/or the editor(s) disclaim responsibility for any injury to people or property resulting from any ideas, methods, instructions or products referred to in the content.