Communication

Detection of Secondary Microplastics in an Aquatic Mesocosm by Means of Object-Based Image Analysis

by
Dahlia E. Carmona-Valdivieso
1,
Tizziana Valdivieso
2 and
Víctor D. Carmona-Galindo
3,*
1
Department of Psychology and Public Health, José Simeón Cañas Central American University, Los Próceres Boulevard, San Salvador 01-168, El Salvador
2
Department of Education Sciences, José Simeón Cañas Central American University, Los Próceres Boulevard, San Salvador 01-168, El Salvador
3
Biology Department, Natural Science Division, University of La Verne, 1950 Third Street, La Verne, CA 91750, USA
*
Author to whom correspondence should be addressed.
Microplastics 2023, 2(3), 268-277; https://doi.org/10.3390/microplastics2030022
Submission received: 15 May 2023 / Revised: 21 July 2023 / Accepted: 4 August 2023 / Published: 7 August 2023
(This article belongs to the Special Issue Monitoring, Detection and Mitigation of Micro and Nanoplastics)

Abstract

:
When plastics are discarded, they do not biodegrade and instead break down over time into progressively smaller particles, termed secondary microplastics, which adversely impact biota and human health as well as persist in the environment for centuries. Our research objective was to evaluate the capabilities of object-based image analyses in detecting compositionally varied microplastics suspended in an aquatic mesocosm under no-slip and turbulent water conditions. We found that the presence of polypropylene, polyethylene terephthalate, and low-density polyethylene microplastic pollution in both single-type and mixed-type suspensions was not detectable by either average red (R), average blue (B), average green (G), or average RBG pixel intensities, but was significantly detectable by means of total RBG pixel intensity from digital imagery of the surface-water. Our findings suggest that object-based image analyses of surface waters to quantify pixel information is better suited for monitoring the presence and absence of suspended microplastics, rather than for the stepwise determination of microplastic concentrations. We propose the development of a smartphone application to facilitate citizen-science monitoring of microplastic contamination as well as comment on future applications utilizing drone imagery to boost cloud-based mapping spatiotemporal plumes.

1. Introduction

The manufacture of plastics from fossil fuels has persisted for over 166 years [1]. The versatile properties of plastics (e.g., relatively low cost, lightweight, durability, and ability to be molded, extruded, or pressed) have led to diverse uses ranging from packaging and consumer products to industrial applications and medical equipment [2], which ultimately have contributed to an unsustainable throw-away culture [3]. For example, single-use plastics, items meant to be used just once and then discarded, currently account for approximately 40% of annual plastic production [4]. When plastics are discarded, they do not biodegrade readily [5] and instead break down over time into progressively smaller particles that adversely impact biota and human health [6] as well as persist in the environment for centuries [7].
Microplastics, by definition, are plastic particles that measure less than 5 mm in size and can be further classified by their origin: primary microplastics are designed for commercial applications (e.g., microbeads for use as abrasives in toothpaste or exfoliants in facial scrubs) and secondary microplastics result from the degradation of macroplastics (e.g., breakdown of plastic water bottles, bottle caps, straws, etc.) [8]. Single-use plastics are the principal source of secondary microplastics in the environment [9,10,11], specifically particles made from polyethylene, polypropylene, polystyrene, polyethylene terephthalate, and polyesters [12]. The microplastic cycle, the process by which microplastic pollution is generated and then spread, starts with its release (e.g., through industrial processes, single-use plastics, etc.) into the environment [13], transport (e.g., water discharge from land, atmospheric deposition, etc.) through the environment [14,15], accumulation in certain areas of the environment (e.g., bodies of water) [16], ingestion by organisms (e.g., plankton) in diverse environments [17], and sedimentation (e.g., marine benthos) [18] coupled with a less understood long-term fate [19,20].
When ingested, microplastics can lead to a wide range of detrimental effects, including: physical damage [21], chemical exposure [22], disruption of feeding behavior [23], transport of invasive species [24], and bioaccumulation [25]. Microplastics have both directly and indirectly entered the human food chain and have been detected in diverse human body tissues and fluids [15,26,27]. While lab-based microplastic detection methodologies have championed visual inspection, spectroscopy, microscopy, filtration, and chemical digestion, more research is needed in methodologies that facilitate the monitoring of microplastic pollution across the terrestrial, aquatic, atmospheric, and human body environments that interact with the microplastic cycle [28,29,30,31].
Our research objective was to study compositionally varied microplastics in a mesocosm experimental design [32,33,34] as a means to evaluate the capabilities of object-based (digital) image analyses in detecting microplastic suspended in no-slip (i.e., standing) and turbulent (i.e., mixing) water conditions. Object-based image analysis allows users to segment digital images into individual polygons and classify them based on characteristics of interest (e.g., size, color, shape, etc.) [35]. Applications for object-based image analyses in environmental biology include habitat and land-use mapping [36], environmental and biodiversity monitoring [35,37], as well as water quality monitoring [38]. We hypothesized that common secondary microplastic particles [12] of polypropylene, polyethylene terephthalate, and low-density polyethylene suspended in an aquatic mesocosm under different mixing conditions could be detected using pixel intensities (e.g., red, blue, green, average, and total) extracted from digital images of the water surface.

2. Materials and Methods

2.1. Mechanical Degradation of Plastics

Standard (commercially available) clear-transparent color drinking straws (i.e., polypropylene (PP)), both clear-transparent color and white-opaque color water bottles (i.e., polyethylene terephthalate (PET)), and both clear-transparent color and white-opaque color water-bottle caps (i.e., low-density polyethylene (LDPE)) were separately minced using a countertop blender and tap water in order to generate five different suspensions of microplastic fragments. Each suspension was poured over two different metal sieves with 1000 and 500 µm pore sizes so as to sort microplastic fragments into two different size ranges: 1000–500 µm (henceforth referenced as the 1000 µm size class) and <500 µm (henceforth referenced as the 500 µm size class). To achieve this, we eliminated any material that did not pass through the sieve with the pore size of 1000 µm and subjected the material that successfully passed through this sieve to an additional step of passing it through the sieve with the pore size of 500 µm. The material that did not pass through the second sieve was categorized as the 1000 µm size class, while the material that successfully passed through the second sieve was classified as the 500 µm size class. The microplastic fragments from the two size classes were each spread out atop Whatman filter paper and allowed to desiccate completely over a 24 h period. The microplastic fragment size classes were then corroborated using a compound microscope outfitted with a micrometer.

2.2. Controlled Aquatic Environment

Light blue cardstock (sky blue color; Recollections™, Irving, TX, USA) was used to line the bottom exterior surface of a standard open glass 37.8 L aquarium tank measuring 50.8 cm long, 25.4 cm wide, and 30.5 cm tall that was positioned atop a magnetic stirrer (Figure 1a). The sides along the length of the aquarium tank were marked on the exterior surface such that, when a digital photograph of the aquarium interior was captured from above the tank (Figure 1b), the corners of a 25.4 cm × 25.4 cm quadrat could be digitally benchmarked on a given image (Figure 1c). The magnetic stirrer allowed for the use of a 50 mm stir bar to agitate the water inside the aquarium tank, producing two different aquatic environments: no-slip conditions (i.e., water has zero velocity relative to the tank) and turbulence conditions (i.e., speed of water at a given point is continuously undergoing changes in both magnitude and direction).

2.3. Microplastic Treatments

The desiccated and sorted microplastic materials for each of the two size classes (i.e., 1000 and 500 µm) were used to prepare treatments composed of a single type of transparent microplastic fragment (i.e., PP, PET, and LDPE). All six (single-type) microplastic treatments (i.e., 2 size classes × 3 types of microplastics) consisted of 2.3 g of dried material suspended in 5 L of tap water (i.e., microplastic concentration of 460 ppm). The control consisted of 5 L of tap water (i.e., microplastic concentration of 0 ppm).
The dried microplastic material for the single size class of 1000 µm was also used to prepare two different mixture treatments that combined PET and LDPE as well as differed in terms of the translucence of the plastic. A transparent mixture with a concentration of 460 ppm microplastics was prepared by combining equal parts transparent PET and LDPE. An opaque mixture with a concentration of 460 ppm microplastics was prepared by combining equal parts opaque (i.e., white color plastic) PET and LDPE. Additionally, the dried material for the single size class of 1000 µm was used to prepare a gradient of 5 L PET microplastic concentrations: 230, 153, and 115 ppm.
Using a controlled experimental design, the given microplastic treatments (e.g., six single-type microplastic suspensions, two mixed microplastic suspensions, and the PET concentration gradient suspensions) were compared to a control (i.e., tap water free of microplastics) under two different aquatic environments: no-slip conditions and turbulence conditions.

2.4. Digital Image Processing

All digital images were captured during nighttime to minimize the variability of natural light sources in a well-lit room illuminated using 17-watt LED light sources with an intensity of 1600 lumens, equivalent to the illumination provided by 100-watt incandescent bulbs. Digital images of the interior of the aquarium were captured from above (Figure 1b) using a 13-megapixel cellphone camera (Motorola Moto G6 Forge; Schaumburg, IL, USA) with phase detection autofocus and f/2.0 aperture. Using the software package Sigma Scan Pro (v5) [39], benchmarks on the aquarium tank were used to delineate a 25.4 cm × 25.4 cm quadrat on the digital image (Figure 1c) where the following pixel intensities were measured: average red (R), average green (G), average blue (B), average RGB, and total RGB. Pixel intensities, which ranged in value between 0 (e.g., darker shades) to 250 (e.g., lighter shades), were measured on a single digital image taken from each of the microplastic suspension treatments as well as the control under two different aquatic environmental conditions: no-slip and turbulence.

2.5. Statistical Analyses

The underlying distribution of microplastic fragment sizes across both size classes was evaluated using a Shapiro–Wilks test for normality. The differences in the mean size of microplastic fragments between both size classes were evaluated using a parametric t test. The differences in the variance of microplastic fragment sizes between both size classes were evaluated using an F test. For both no-slip and turbulence conditions, differences in observed digital image pixel intensity values (i.e., average R, average G, average B, average RGB, or total RGB) for a given microplastic treatment (i.e., PP, PET, or LDPE) and respective size class (i.e., 500 or 1000 µm) were each evaluated relative to the expected values from a control using one-factor Chi-Square (χ2) analyses using the software package Statistica [40]. For both no-slip and turbulence conditions, differences in observed digital image pixel intensity values (i.e., average R, average G, average B, average RGB, or total RGB) for a given 1000 µm size class microplastic mix treatment (i.e., transparent or opaque) were each evaluated relative to the expected values from a control using one-factor Chi-Square (χ2) analyses. The relationship between digital image pixel intensity values (i.e., average R, average G, average B, average RGB, or total RGB) and the gradient concentration of 1000 µm size class PET microplastics (i.e., 230, 153, and 115 ppm) was evaluated using a linear regression analysis using the software package Statistica [40].

3. Results

3.1. Microplastic Size Classes

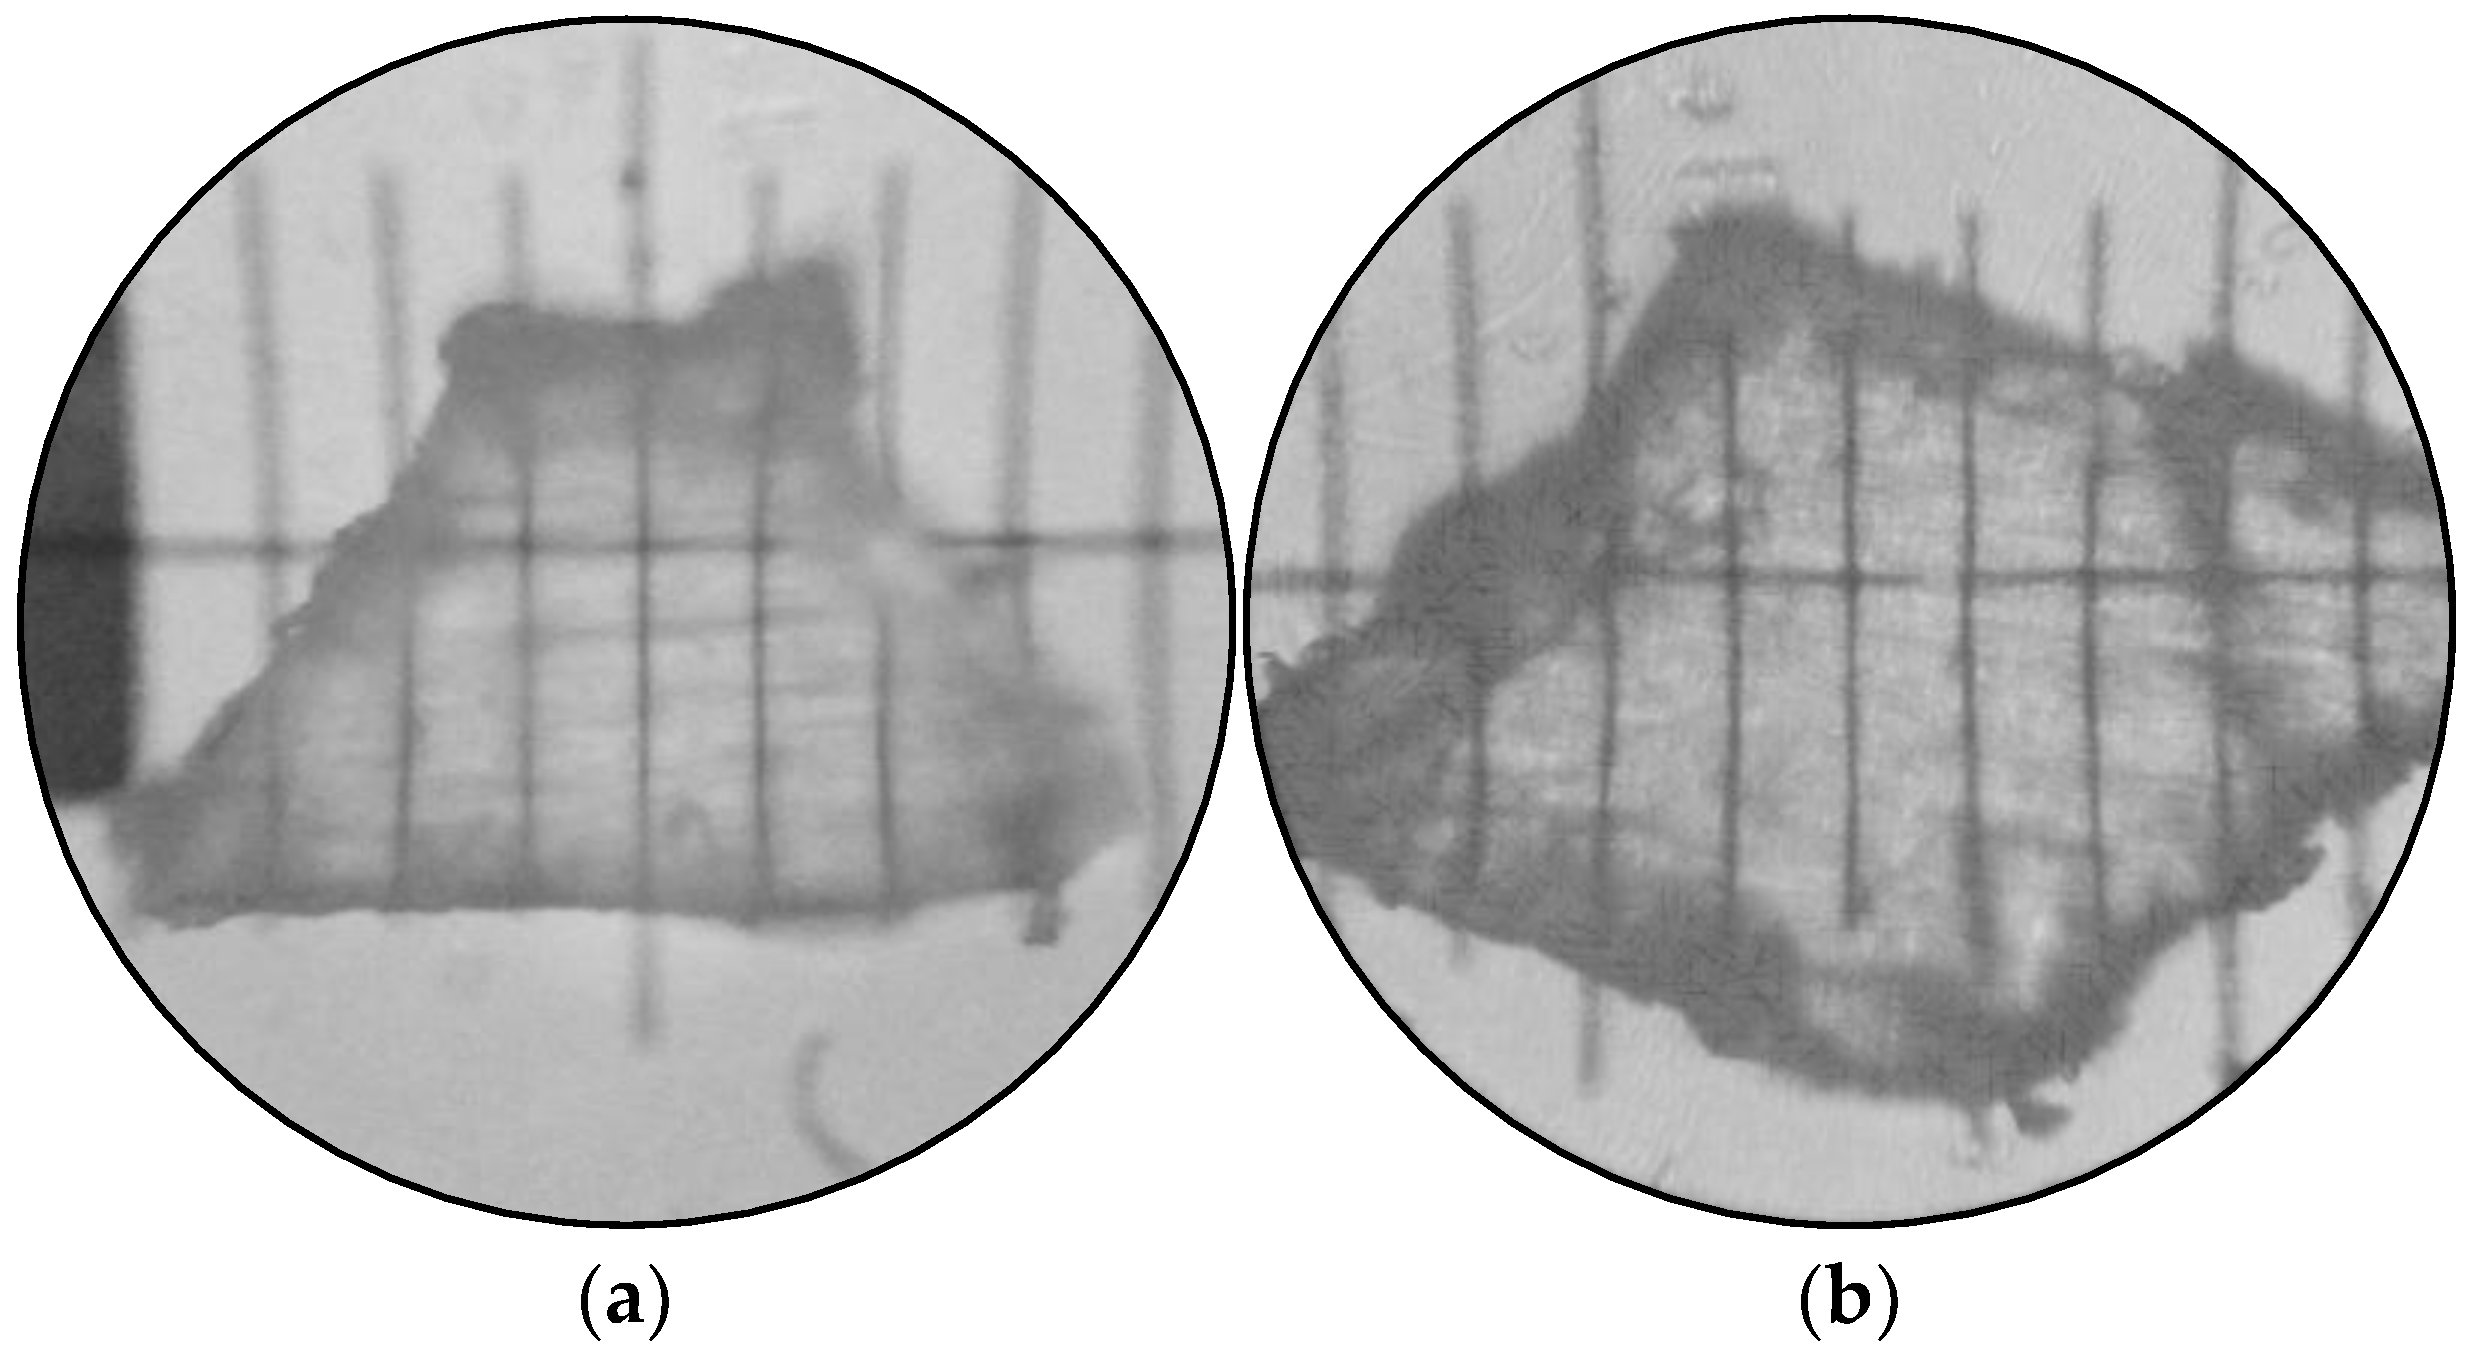
The sizes of microplastic fragments did not differ significantly from a normal distribution (W = 0.9605, p = 0.5530). While we found that the mean size of microplastic fragments differed significantly between the two size classes (t = −7.4509, p < 0.0001), we did not detect a significant difference in the size variance of microplastic fragments between the two size classes (F = 1.0104, p = 0.9880). Microscopic inspection of 10 microplastic fragments in size class 500 µm showed an average size (measured across the middle) of 61.8 µm ± 16.7 µm ( x ¯ ± s) (Figure 2a), while size class 1000 µm showed an average size of 117.5 µm ± 16.8 µm ( x ¯ ± s) (Figure 2b).

3.2. Single-Type Microplastics in No-Slip Aquatic Environments

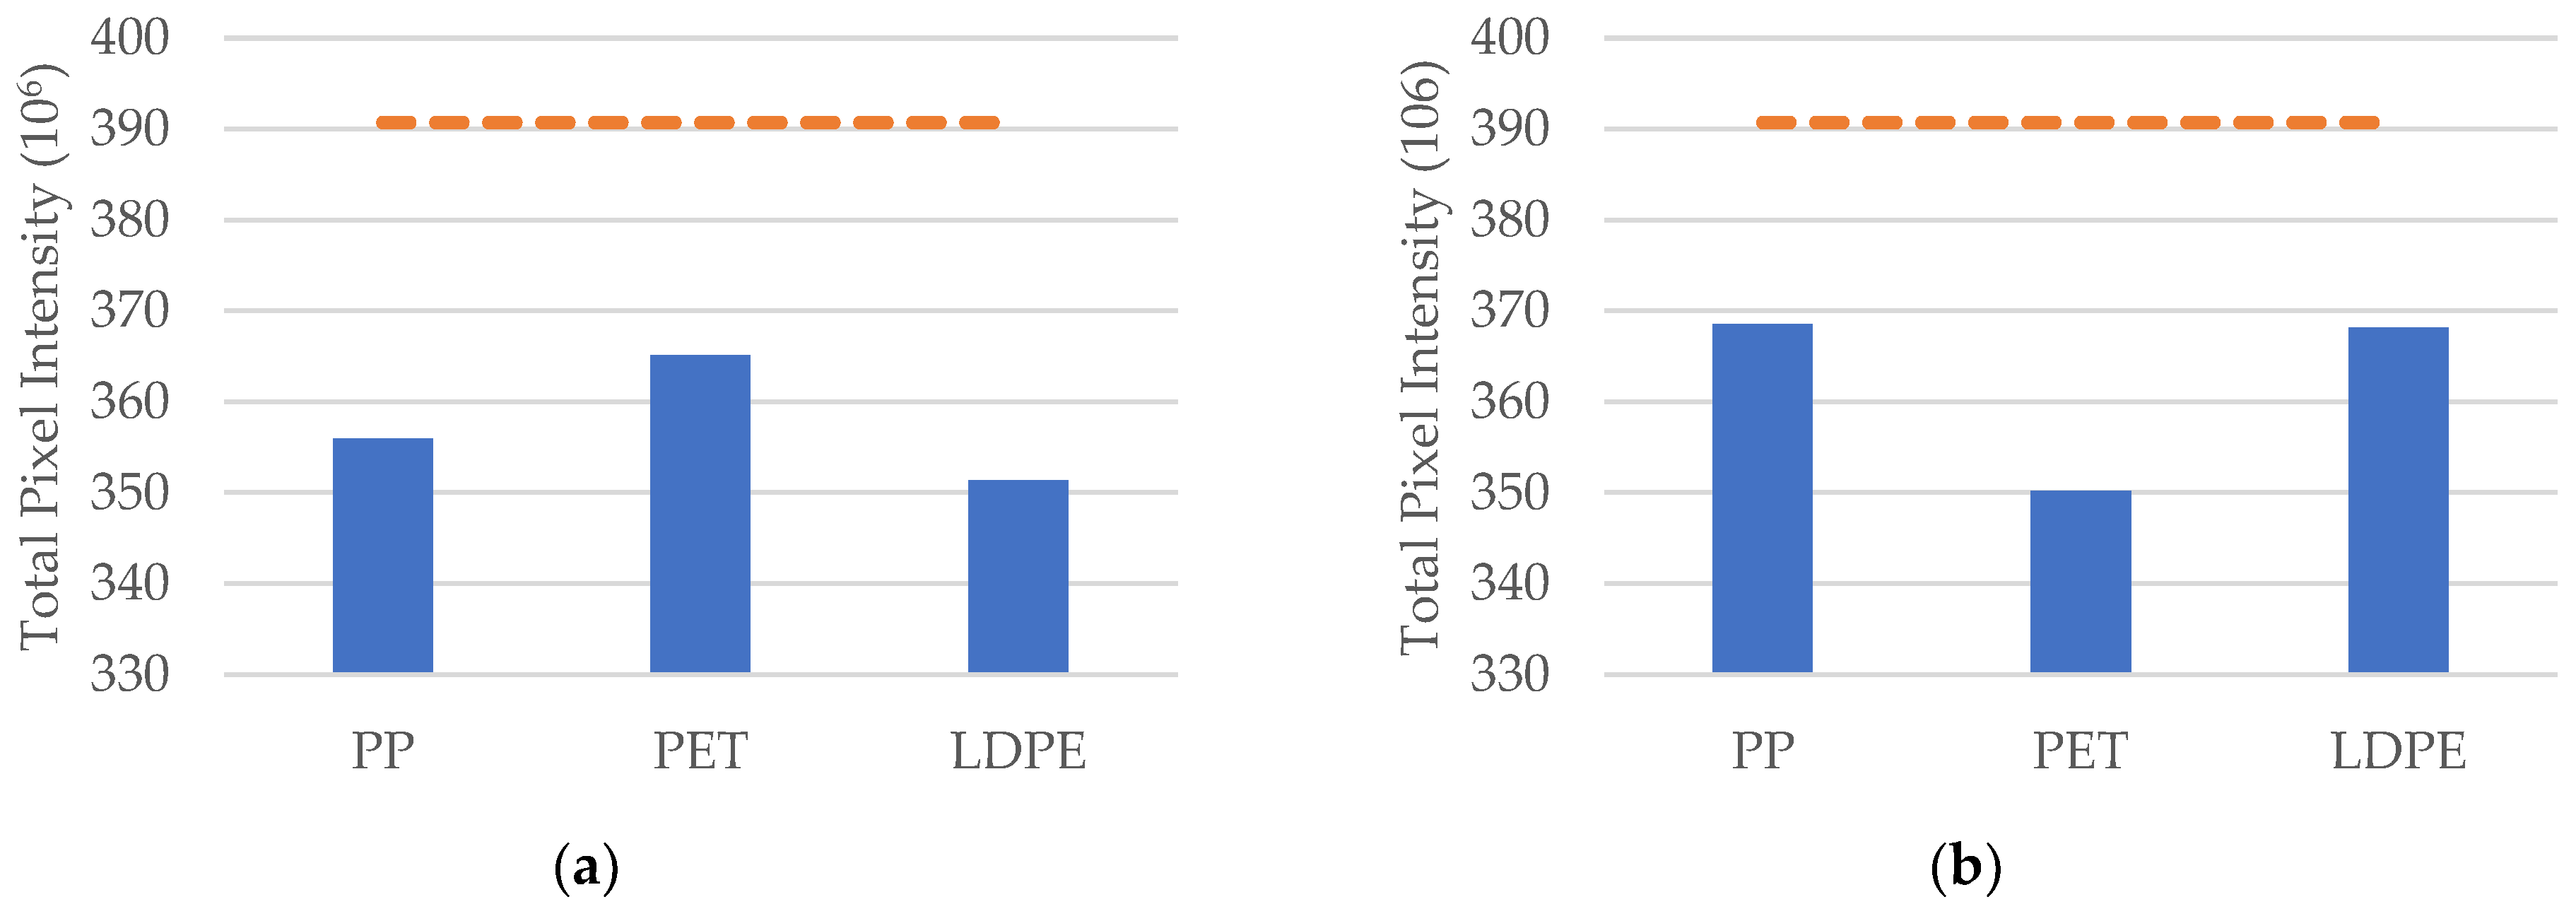
The distribution of pixel values observed across each of the 500 µm size class PP, PET, and LDPE microplastic suspensions did not differ significantly in terms of the average R pixel intensities (χ2 = 0.1756, d.f. = 3, p = 0.1756), average G pixel intensities (χ2 = 0.1122, d.f. = 3, p = 0.9454), average B pixel intensities (χ2 = 0.1644, d.f. = 3, p = 0.9211), or average RGB pixel intensities (χ2 = 0.1094, d.f. = 3, p = 0.9468) relative to the expected distribution of respective pixel values in the control. However, the distribution of pixel values observed across each of the 500 µm size class PP, PET, and LDPE microplastic suspensions differed significantly in terms of the total RBG pixel intensity (χ2 = 8,740,767.059, d.f. = 3, p < 0.0001) relative to the expected distribution in the control. For microplastics in the 500 µm size class, the total RGB pixel intensity values of the PP, PET, and LDPE suspensions scored below expected (Figure 3a).
The distribution of pixel values observed across each of the 1000 µm size class PP, PET, and LDPE microplastic suspensions did not differ significantly in terms of the average R pixel intensities (χ2 = 0.1871, d.f. = 3, p = 0.9110), average G pixel intensities (χ2 = 0.1033, d.f. = 3, p = 0.9501), average B pixel intensities (χ2 = 0.0619, d.f. = 3, p = 0.9691), or average RGB pixel intensities (χ2 = 0.0755, d.f. = 3, p = 0.9630) relative to the expected distribution of respective pixel values in the control. However, the distribution of pixel values observed across each of the 1000 µm size class PP, PET, and LDPE microplastic suspensions differed significantly in terms of the total RBG pixel intensity (χ2 = 6,752,429.176, d.f. = 3, p < 0.0001) relative to the expected distribution in the control. For microplastics in the 1000 µm size class, the total RGB pixel intensity values of the PP, PET, and LDPE suspensions scored below expected (Figure 3b).

3.3. Single-Type Microplastics in Turbulent Aquatic Environments

The distribution of pixel values observed across each of the 500 µm size class PP, PET, and LDPE microplastic suspensions did not differ significantly in terms of the average R pixel intensities (χ2 = 0.6669, d.f. = 3, p = 0.7164), average G pixel intensities (χ2 = 0.2419, d.f. = 3, p = 0.8861), average B pixel intensities (χ2 = 0.0736, d.f. = 3, p = 0.9639), or average RGB pixel intensities (χ2 = 0.1909, d.f. = 3, p = 0.9089) relative to the expected distribution of respective pixel values in the control. However, the distribution of pixel values observed across each of the 500 µm size class PP, PET, and LDPE microplastic suspensions differed significantly in terms of the total RBG pixel intensity (χ2 = 4,046,255.316, d.f. = 3, p < 0.0001) relative to the expected distribution in the control. For microplastics in the 500 µm size class, the total RGB pixel intensity values of the PP and PET suspensions scored above expected, while LDPE suspensions scored as expected (Figure 4a).
The distribution of pixel values observed across each of the 1000 µm size class PP, PET, and LDPE microplastic suspensions did not differ significantly in terms of the average R pixel intensities (χ2 = 0.9042, d.f. = 3, p = 0.6586), average G pixel intensities (χ2 = 0.7894, d.f. = 3, p = 0.6905), average B pixel intensities (χ2 = 0.5092, d.f. = 3, p = 0.7825), or average RGB pixel intensities (χ2 = 0.6930, d.f. = 3, p = 0.7209) relative to the expected distribution of respective pixel values in the control. However, the distribution of pixel values observed across each of the 1000 µm size class PP, PET, and LDPE microplastic suspensions differed significantly in terms of the total RBG pixel intensity (χ2 = 982,740.194, d.f. = 3, p < 0.0001) relative to the expected distribution in the control. For microplastics in the 1000 µm size class, the total RGB pixel intensity values of the PET suspension scored above expected, while both the PP and LDPE suspensions scored below expected (Figure 4b).

3.4. Mixed PET and LDPE Microplastics in Aquatic Environments

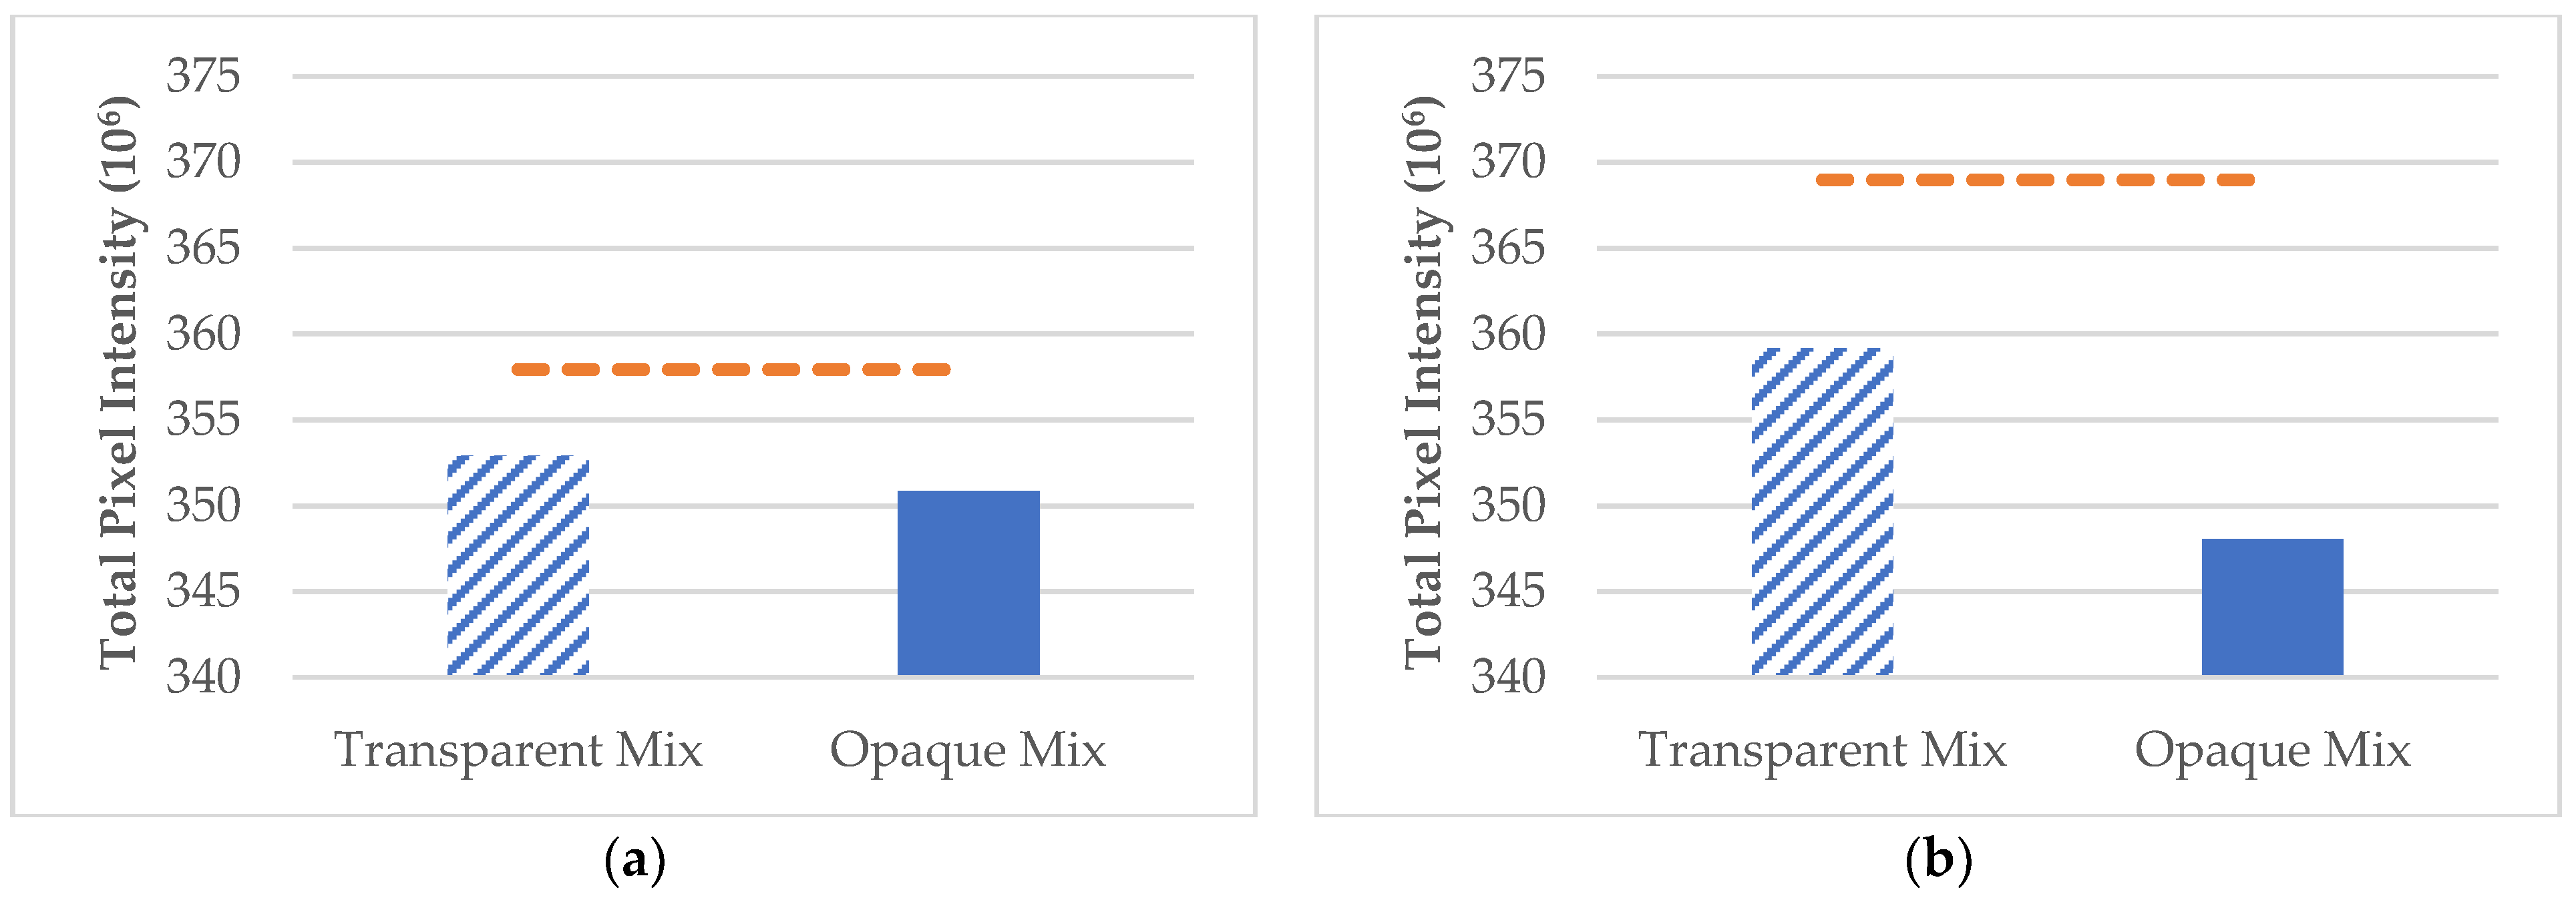
In no-slip conditions, the distribution of pixel values observed in each of the 1000 µm size class mixtures of transparent or opaque microplastics did not differ significantly in terms of the average R pixel intensities (χ2 = 1.7437, d.f. = 2, p = 0.1867), average G pixel intensities (χ2 = 1.9132, d.f. = 2, p = 0.1666), average B pixel intensities (χ2 = 2.8398, d.f. = 2, p = 0.0920), or average RGB pixel intensities (χ2 = 2.1885, d.f. = 2, p = 0.1390) relative to the expected distribution of respective pixel values in the control. However, in no-slip conditions, the distribution of pixel values observed in each of the 1000 µm size class mixtures of transparent or opaque microplastics differed significantly in terms of the total RBG pixel intensity (χ2 = 1,443,714.443, d.f. = 2, p < 0.0001) relative to the expected distribution in the control. The total RGB pixel intensity values of both transparent and opaque microplastic mixtures in no-slip conditions scored below expected (Figure 5a).
In turbulence conditions, the distribution of pixel values observed in each of the 1000 µm size class mixtures of transparent or opaque microplastics did not differ significantly in terms of the average R pixel intensities (χ2 = 0.8425, d.f. = 2, p = 0.3587), average G pixel intensities (χ2 = 1.0787, d.f. = 2, p = 0.2990), average B pixel intensities (χ2 = 0.7404, d.f. = 2, p = 0.3895), or average RGB pixel intensities (χ2 = 0.8960, d.f. = 2, p = 0.3439) relative to the expected distribution of respective pixel values in the control. However, in turbulence conditions, the distribution of pixel values observed in each of the 1000 µm size class mixtures of transparent or opaque microplastics differed significantly in terms of the total RBG pixel intensity (χ2 = 209,108.8592, d.f. = 2, p < 0.0001) relative to the expected distribution in the control. The total RGB pixel intensity values of both transparent and opaque microplastic mixtures in turbulence conditions scored below expected (Figure 5b).

3.5. PET Concentration Gradient in Aquatic Environments

In no-slip conditions, there was no significant relationship between changes in the concentration of 1000 µm size class PET microplastics and pixel intensity changes in the average R, average G, average B, average RGB, or total RGB (Table 1). In turbulence conditions, there was no significant relationship between changes in the concentration of 1000 µm size class PET microplastics and pixel intensity changes in the average R, average G, average B, average RGB, or total RGB (Table 1).

4. Discussion

We found that pixel intensities from object-based image analyses of the surface waters can be employed for the detection of compositionally varied secondary microplastics suspended in mesocosms under both no-slip and turbulent conditions. The use of R, G, B, or RGB average pixel intensities did not significantly differentiate (relative to controlled conditions) from among single-type (i.e., PP, PET, or LDPE) or mixed-type (i.e., PET and LDPE, either transparent or opaque) microplastic suspensions in either no-slip or turbulent mesocosm conditions. However, the use of RGB total pixel intensity significantly differentiated (relative to controls) from among single-type (i.e., PP, PET, or LDPE) as well as mixed-type (i.e., PET and LDPE, both transparent and opaque) microplastics suspended in both no-slip and turbulent conditions.
Our findings suggest that it is possible to detect as well as monitor the presence of microplastic pollution in both standing (e.g., ponds, small lakes, etc.) and flowing water (e.g., streams, creeks, etc.) by measuring the total RBG pixel intensity from a digital image taken atop an enclosed and portable aquatic environment (e.g., glass tube or cuvette). However, it is important to note that R, G, B, and RGB average pixel intensities and RGB total pixel intensity were unable to differentiate (relative to controls) gradient changes in microplastic PET concentration in an aquatic mesocosm. This further suggests that our application of object-based image analyses to quantify pixel information is better suited for the detection of the presence and absence of suspended microplastics, rather than for the stepwise determination of microplastic concentrations (e.g., via a calibration curve methodology).
The typical concentration of microplastics in aquatic environments can vary widely based on several factors, including the type of water body, location, proximity to pollution sources, and sampling methods [41]. In general, microplastics concentrations reported in the primary literature range 10–100 pmm in oceans and seas [42,43], 10–100 ppm in rivers and lakes [44,45], 100–1000 ppm in coastal environments [46,47], and 100–1000 ppm in sediments [47,48]. The wide spectrum of microplastic concentrations reported in diverse aquatic environments serves to emphasize the environmental relevance of our experimental mesocosm conditions and findings. Nevertheless, it is important to note that the ingestion of microplastics by aquatic organisms hints at a potential underestimation of microplastics retention in these environments [45,49].
We propose the development of a smartphone application that would employ the integrated camera [50], as well as perhaps a 3D printed attachment [51] for a modified glass vial, which would detect suspended microplastics in field conditions by means of RBG total pixel intensity. In field conditions, the issue of suspended biomaterials that affect water coloration, for example, tannins [52], could be addressed by utilizing the filtered supernatant from the specific point source under evaluation. However, we anticipate that this filtration process would require additional troubleshooting, as it might lead to a narrower focus on suspended microplastics (<5 mm) while potentially excluding nanoplastics (<1 µm) during field evaluations.
A smartphone application would furthermore empower a citizen-science approach for the real-time monitoring and cloud-based reporting of microplastic contamination (e.g., mapping spatiotemporal plumes) across a myriad of aquatic environments [53]. Future studies could furthermore explore applications of drone imagery (e.g., collected during delivery routes) coupled with machine learning algorithms as novel opportunities to monitor microplastic contamination in aquatic features in agricultural or urban landscapes (e.g., waterways, canals, bioswales, etc.) [54].

Author Contributions

Conceptualization, D.E.C.-V., T.V. and V.D.C.-G.; methodology, D.E.C.-V. and V.D.C.-G.; software, V.D.C.-G.; validation, V.D.C.-G.; formal analysis, D.E.C.-V., T.V. and V.D.C.-G.; investigation, D.E.C.-V., T.V. and V.D.C.-G.; resources, T.V. and V.D.C.-G.; data curation, D.E.C.-V. and V.D.C.-G., writing—original draft preparation, V.D.C.-G.; writing—review and editing, D.E.C.-V., T.V. and V.D.C.-G.; visualization, D.E.C.-V., T.V. and V.D.C.-G.; supervision, T.V. and V.D.C.-G.; project administration D.E.C.-V. and V.D.C.-G.; funding acquisition, T.V. and V.D.C.-G. All authors have read and agreed to the published version of the manuscript.

Funding

This research project received no external funding.

Data Availability Statement

The data that support the findings of this study are available from the corresponding author [V.D.C.-G.] upon reasonable request.

Conflicts of Interest

The authors declare no conflict of interest.

References

  1. Parkes, A. Improvements in the Manufacture of Parkesine or Compound of Pyroxyline, and also Solutions of Pyroxyline Known as Collodion. Patent No. 1313, 11 May 1857. [Google Scholar]
  2. Lau, W.W.Y.; Shiran, Y.; Bailey, R.M.; Cook, E.; Stuchtey, M.R.; Koskella, J.; Velis, C.A.; Godfrey, L.; Boucher, J.; Murphy, M.B.; et al. Evaluating scenarios toward zero plastic pollution. Science 2020, 369, 1455–1460. [Google Scholar] [CrossRef]
  3. Gibb, B.C. Plastics are forever. Nat. Chem. 2019, 11, 394–395. [Google Scholar] [CrossRef] [PubMed]
  4. Chen, Y.; Awasthi, A.K.; Wei, F.; Tan, Q.; Li, J. Single-use plastics: Production, usage, disposal, and adverse impacts. Sci. Total Environ. 2021, 752, 141772. [Google Scholar] [CrossRef]
  5. Tokiwa, Y.; Calabia, B.P.; Ugwu, C.U.; Aiba, S. Biodegradability of Plastics. Int. J. Mol. Sci. 2009, 10, 3722–3742. [Google Scholar] [CrossRef] [Green Version]
  6. Naidoo, T.; Rajkaran, A.; Sershen. Impacts of plastic debris on biota and implications for human health: A South African perspective. S. Afr. J. Sci. 2020, 116, 1–8. [Google Scholar] [CrossRef]
  7. Ward, C.P.; Reddy, C.M. We need better data about the environmental persistence of plastic goods. Proc. Natl. Acad. Sci. USA 2020, 117, 14618–14621. [Google Scholar] [CrossRef]
  8. Zhang, K.; Hamidian, A.H.; Tubic, A.; Zhang, Y.; Fang, J.K.H.; Wu, C.; Lam, P.K.S. Understanding plastic degradation and microplastic formation in the environment: A review. Environ. Pollut. 2021, 274, 116554. [Google Scholar] [CrossRef]
  9. Schnurr, R.E.J.; Alboiu, V.; Chaudhary, M.; Corbett, R.A.; Quanz, M.E.; Sankar, K.; Srain, H.S.; Thavarajah, V.; Xanthos, D.; Walker, T.R. Reducing marine pollution from single-use plastics (SUPs): A review. Mar. Pollut. Bull. 2018, 137, 157–171. [Google Scholar] [CrossRef]
  10. Morgana, S.; Casentini, B.; Amalfitano, S. Uncovering the release of micro/nanoplastics from disposable face masks at times of COVID-19. J. Hazard. Mater. 2021, 419, 126507. [Google Scholar] [CrossRef]
  11. Li, C.; Busquets, R.; Campos, L.C. Assessment of microplastics in freshwater systems: A review. Sci. Total Environ. 2020, 707, 135578. [Google Scholar] [CrossRef]
  12. Wu, W.-M.; Yang, J.; Criddle, C.S. Microplastics pollution and reduction strategies. Front. Environ. Sci. Eng. 2016, 11, 6. [Google Scholar] [CrossRef]
  13. Dissanayake, P.D.; Kim, S.; Sarkar, B.; Oleszczuk, P.; Sang, M.K.; Haque, M.N.; Ahn, J.H.; Bank, M.S.; Ok, Y.S. Effects of microplastics on the terrestrial environment: A critical review. Environ. Res. 2022, 209, 112734. [Google Scholar] [CrossRef]
  14. Luo, H.; Liu, C.; He, D.; Xu, J.; Sun, J.; Li, J.; Pan, X. Environmental behaviors of microplastics in aquatic systems: A systematic review on degradation, adsorption, toxicity and biofilm under aging conditions. J. Hazard. Mater. 2022, 423, 126915. [Google Scholar] [CrossRef] [PubMed]
  15. Huang, W.; Song, B.; Liang, J.; Niu, Q.; Zeng, G.; Shen, M.; Deng, J.; Luo, Y.; Wen, X.; Zhang, Y. Microplastics and associated contaminants in the aquatic environment: A review on their ecotoxicological effects, trophic transfer, and potential impacts to human health. J. Hazard. Mater. 2021, 405, 124187. [Google Scholar] [CrossRef] [PubMed]
  16. Sandgaard, M.; Palmqvist, A.; Bour, A.; Grønlund, S.N.; Hooge, A.; Selck, H.; Thit, A.; Syberg, K. Sediment matters as a route of microplastic exposure: A call for more research on the benthic compartment. Front. Mar. Sci. 2023, 9, 1100567. [Google Scholar] [CrossRef]
  17. Setala, O.; Fleming-Lehtinen, V.; Lehtiniemi, M. Ingestion and transfer of microplastics in the planktonic food web. Environ. Pollut. 2014, 185, 77–83. [Google Scholar] [CrossRef]
  18. Martin, C.; Baalkhuyur, F.; Valluzzi, L.; Saderne, V.; Cusack, M.; Almahasheer, H.; Krishnakumar, P.K.; Rabaoui, L.; Qurban, M.A.; Arias-Ortiz, A.; et al. Exponential increase of plastic burial in mangrove sediments as a major plastic sink. Sci. Adv. 2020, 6, eaaz5593. [Google Scholar] [CrossRef]
  19. Kane, I.; Clare, M. Dispersion, Accumulation and the Ultimate Fate of Microplastics in Deep-Marine Environments: A Review and Future Directions. Front. Earth Sci. 2019, 7, 80. [Google Scholar] [CrossRef] [Green Version]
  20. Yadav, S.; Gupta, E.; Patel, A.; Srivastava, S.; Mishra, V.K.; Singh, P.C.; Srivastava, P.K.; Barik, S.K. Unravelling the emerging threats of microplastics to agroecosystems. Rev. Environ. Sci. Bio/Technol. 2022, 21, 771–798. [Google Scholar] [CrossRef]
  21. Padervand, M.; Lichtfouse, E.; Robert, D.; Wang, C. Removal of microplastics from the environment. A review. Environ. Chem. Lett. 2020, 18, 807–828. [Google Scholar] [CrossRef]
  22. Koelmans, A.A.; Bakir, A.; Burton, G.A.; Janssen, C.R. Microplastic as a Vector for Chemicals in the Aquatic Environment: Critical Review and Model-Supported Reinterpretation of Empirical Studies. Environ. Sci. Technol. 2016, 50, 3315–3326. [Google Scholar] [CrossRef]
  23. Mak, C.W.; Yeung, K.C.-F.; Chan, K.M. Acute toxic effects of polyethylene microplastic on adult zebrafish. Ecotoxicol. Environ. Saf. 2019, 182, 109442. [Google Scholar] [CrossRef]
  24. Bowley, J.; Baker-Austin, C.; Porter, A.; Hartnell, R.; Lewis, C. Oceanic Hitchhikers–Assessing Pathogen Risks from Marine Microplastic. Trends Microbiol. 2021, 29, 107–116. [Google Scholar] [CrossRef]
  25. Koelmans, A.A.; Besseling, E.; Wegner, A.; Foekema, E.M. Plastic as a Carrier of POPs to Aquatic Organisms: A Model Analysis. Environ. Sci. Technol. 2013, 47, 7812–7820. [Google Scholar] [CrossRef]
  26. Schwabl, P.; Koeppel, S.; Koenigshofer, P.; Bucsics, T.; Trauner, M.; Reiberger, T.; Liebmann, B. Detection of Various Microplastics in Human Stool A Prospective Case Series. Ann. Intern. Med. 2019, 171, 453–457. [Google Scholar] [CrossRef]
  27. Wang, W.; Gao, H.; Jin, S.; Li, R.; Na, G. The ecotoxicological effects of microplastics on aquatic food web, from primary producer to human: A review. Ecotoxicol. Environ. Saf. 2019, 173, 110–117. [Google Scholar] [CrossRef]
  28. Mai, L.; Bao, L.-J.; Shi, L.; Wong, C.S.; Zeng, E.Y. A review of methods for measuring microplastics in aquatic environments. Environ. Sci. Pollut. Res. Int. 2018, 25, 11319–11332. [Google Scholar] [CrossRef]
  29. Loeder, M.G.J.; Kuczera, M.; Mintenig, S.; Lorenz, C.; Gerdts, G. Focal plane array detector-based micro-Fourier-transform infrared imaging for the analysis of microplastics in environmental samples. Environ. Chem. 2015, 12, 563–581. [Google Scholar] [CrossRef]
  30. Lenz, R.; Enders, K.; Stedmon, C.A.; Mackenzie, D.M.A.; Nielsen, T.G. A critical assessment of visual identification of marine microplastic using Raman spectroscopy for analysis improvement. Mar. Pollut. Bull. 2015, 100, 82–91. [Google Scholar] [CrossRef]
  31. Claessens, M.; Van Cauwenberghe, L.; Vandegehuchte, M.B.; Janssen, C.R. New techniques for the detection of microplastics in sediments and field collected organisms. Mar. Pollut. Bull. 2013, 70, 227–233. [Google Scholar] [CrossRef]
  32. Petersen, J.E.; Cornwell, J.C.; Kemp, W.M. Implicit Scaling in the Design of Experimental Aquatic Ecosystems. Oikos 1999, 85, 3–18. [Google Scholar] [CrossRef]
  33. Boots, B.; Russell, C.W.; Green, D.S. Effects of Microplastics in Soil Ecosystems: Above and Below Ground. Environ. Sci. Technol. 2019, 53, 11496–11506. [Google Scholar] [CrossRef]
  34. Sendra, M.; Sparaventi, E.; Novoa, B.; Figueras, A. An overview of the internalization and effects of microplastics and nanoplastics as pollutants of emerging concern in bivalves. Sci. Total Environ. 2021, 753, 142024. [Google Scholar] [CrossRef]
  35. Yan, J.; Lin, L.; Zhou, W.; Ma, K.; Pickett, S.T.A. A novel approach for quantifying particulate matter distribution on leaf surface by combining SEM and object-based image analysis. Remote Sens. Environ. 2016, 173, 156–161. [Google Scholar] [CrossRef]
  36. Zhang, T.; Huang, B.; Yan, Y.; Lin, Y.; Wong, H.; Wong, S.Y.-s.; Chung, R.Y.-N. Street-view and traditional greenness metrics with adults’ sitting time in high-density living in Hong Kong: Comparing associations, air pollution and noise roles, and population heterogeneity. Sci. Total Environ. 2023, 870, 161778. [Google Scholar] [CrossRef]
  37. He, H.; Cheng, X.; Li, X.; Zhu, R.; Hui, F.; Wu, W.; Zhao, T.; Kang, J.; Tang, J. Aerial photography based census of Adelie Penguin and its application in CH4 and N2O budget estimation in Victoria Land, Antarctic. Sci. Rep. 2017, 7, 12942. [Google Scholar] [CrossRef] [Green Version]
  38. Rizeei, H.M.; Azeez, O.S.; Pradhan, B.; Khamees, H.H. Assessment of groundwater nitrate contamination hazard in a semi-arid region by using integrated parametric IPNOA and data-driven logistic regression models. Environ. Monit. Assess. 2018, 190, 633. [Google Scholar] [CrossRef]
  39. McCallum, J.B. SigmaScan Pro 5.0. (Brief Article). Science 2000, 289, 412–413. [Google Scholar] [CrossRef]
  40. Statistica (Data Analysis Software System), Version 13; TIBCO Software Inc.: Palo Alto, CA, USA, 2017.
  41. Koelmans, A.A.; Mohamed Nor, N.H.; Hermsen, E.; Kooi, M.; Mintenig, S.M.; De France, J. Microplastics in freshwaters and drinking water: Critical review and assessment of data quality. Water Res. 2019, 155, 410–422. [Google Scholar] [CrossRef]
  42. Ikenoue, T.; Nakajima, R.; Fujiwara, A.; Onodera, J.; Itoh, M.; Toyoshima, J.; Watanabe, E.; Murata, A.; Nishino, S.; Kikuchi, T. Horizontal distribution of surface microplastic concentrations and water-column microplastic inventories in the Chukchi Sea, western Arctic Ocean. Sci. Total Environ. 2023, 855, 159564. [Google Scholar] [CrossRef]
  43. Naidoo, T.; Glassom, D. Sea-surface microplastic concentrations along the coastal shelf of KwaZulu–Natal, South Africa. Mar. Pollut. Bull. 2019, 149, 110514. [Google Scholar] [CrossRef]
  44. Dris, R.; Gasperi, J.; Rocher, V.; Tassin, B. Synthetic and non-synthetic anthropogenic fibers in a river under the impact of Paris Megacity: Sampling methodological aspects and flux estimations. Sci. Total Environ. 2018, 618, 157–164. [Google Scholar] [CrossRef] [Green Version]
  45. Dahms, H.T.J.; van Rensburg, G.J.; Greenfield, R. The microplastic profile of an urban African stream. Sci. Total Environ. 2020, 731, 138893. [Google Scholar] [CrossRef]
  46. Talvitie, J.; Heinonen, M.; Pääkkönen, J.P.; Vahtera, E.; Mikola, A.; Setälä, O.; Vahala, R. Do wastewater treatment plants act as a potential point source of microplastics? Preliminary study in the coastal Gulf of Finland, Baltic Sea. Water Sci. Technol. 2015, 72, 1495–1504. [Google Scholar] [CrossRef]
  47. Harris, P.T. The fate of microplastic in marine sedimentary environments: A review and synthesis. Mar. Pollut. Bull. 2020, 158, 111398. [Google Scholar] [CrossRef]
  48. Fischer, E.K.; Paglialonga, L.; Czech, E.; Tamminga, M. Microplastic pollution in lakes and lake shoreline sediments—A case study on Lake Bolsena and Lake Chiusi (central Italy). Environ. Pollut. 2016, 213, 648–657. [Google Scholar] [CrossRef] [PubMed]
  49. Di Lorenzo, T.; Cabigliera, S.B.; Martellini, T.; Laurati, M.; Chelazzi, D.; Galassi, D.M.P.; Cincinelli, A. Ingestion of microplastics and textile cellulose particles by some meiofaunal taxa of an urban stream. Chemosphere 2023, 310, 136830. [Google Scholar] [CrossRef] [PubMed]
  50. Liu, Z.; Liu, K.; Zhang, J.; Yan, C.; Lock, T.R.; Kallenbach, R.L.; Yuan, Z. Fractional coverage rather than green chromatic coordinate is a robust indicator to track grassland phenology using smartphone photography. Ecol. Inform. 2022, 68, 101544. [Google Scholar] [CrossRef]
  51. Cai, F.; Lu, W.; Shi, W.; He, S. A mobile device-based imaging spectrometer for environmental monitoring by attaching a lightweight small module to a commercial digital camera. Sci. Rep. 2017, 7, 15602. [Google Scholar] [CrossRef] [PubMed] [Green Version]
  52. Cuthbert, I.D.; del Giorgio, P. Toward a standard method of measuring color in freshwater. Limnol. Oceanogr. 1992, 37, 1319–1326. [Google Scholar] [CrossRef]
  53. Barrows, A.P.W.; Cathey, S.E.; Petersen, C.W. Marine environment microfiber contamination: Global patterns and the diversity of microparticle origins. Environ. Pollut. 2018, 237, 275–284. [Google Scholar] [CrossRef] [PubMed] [Green Version]
  54. Balan, K.; Santora, M.; Faied, M.; Carmona, V. A Survey of Computational Intelligence Techniques in Ecology and Sustainability. Mich. Acad. 2021, 47, 36. [Google Scholar]
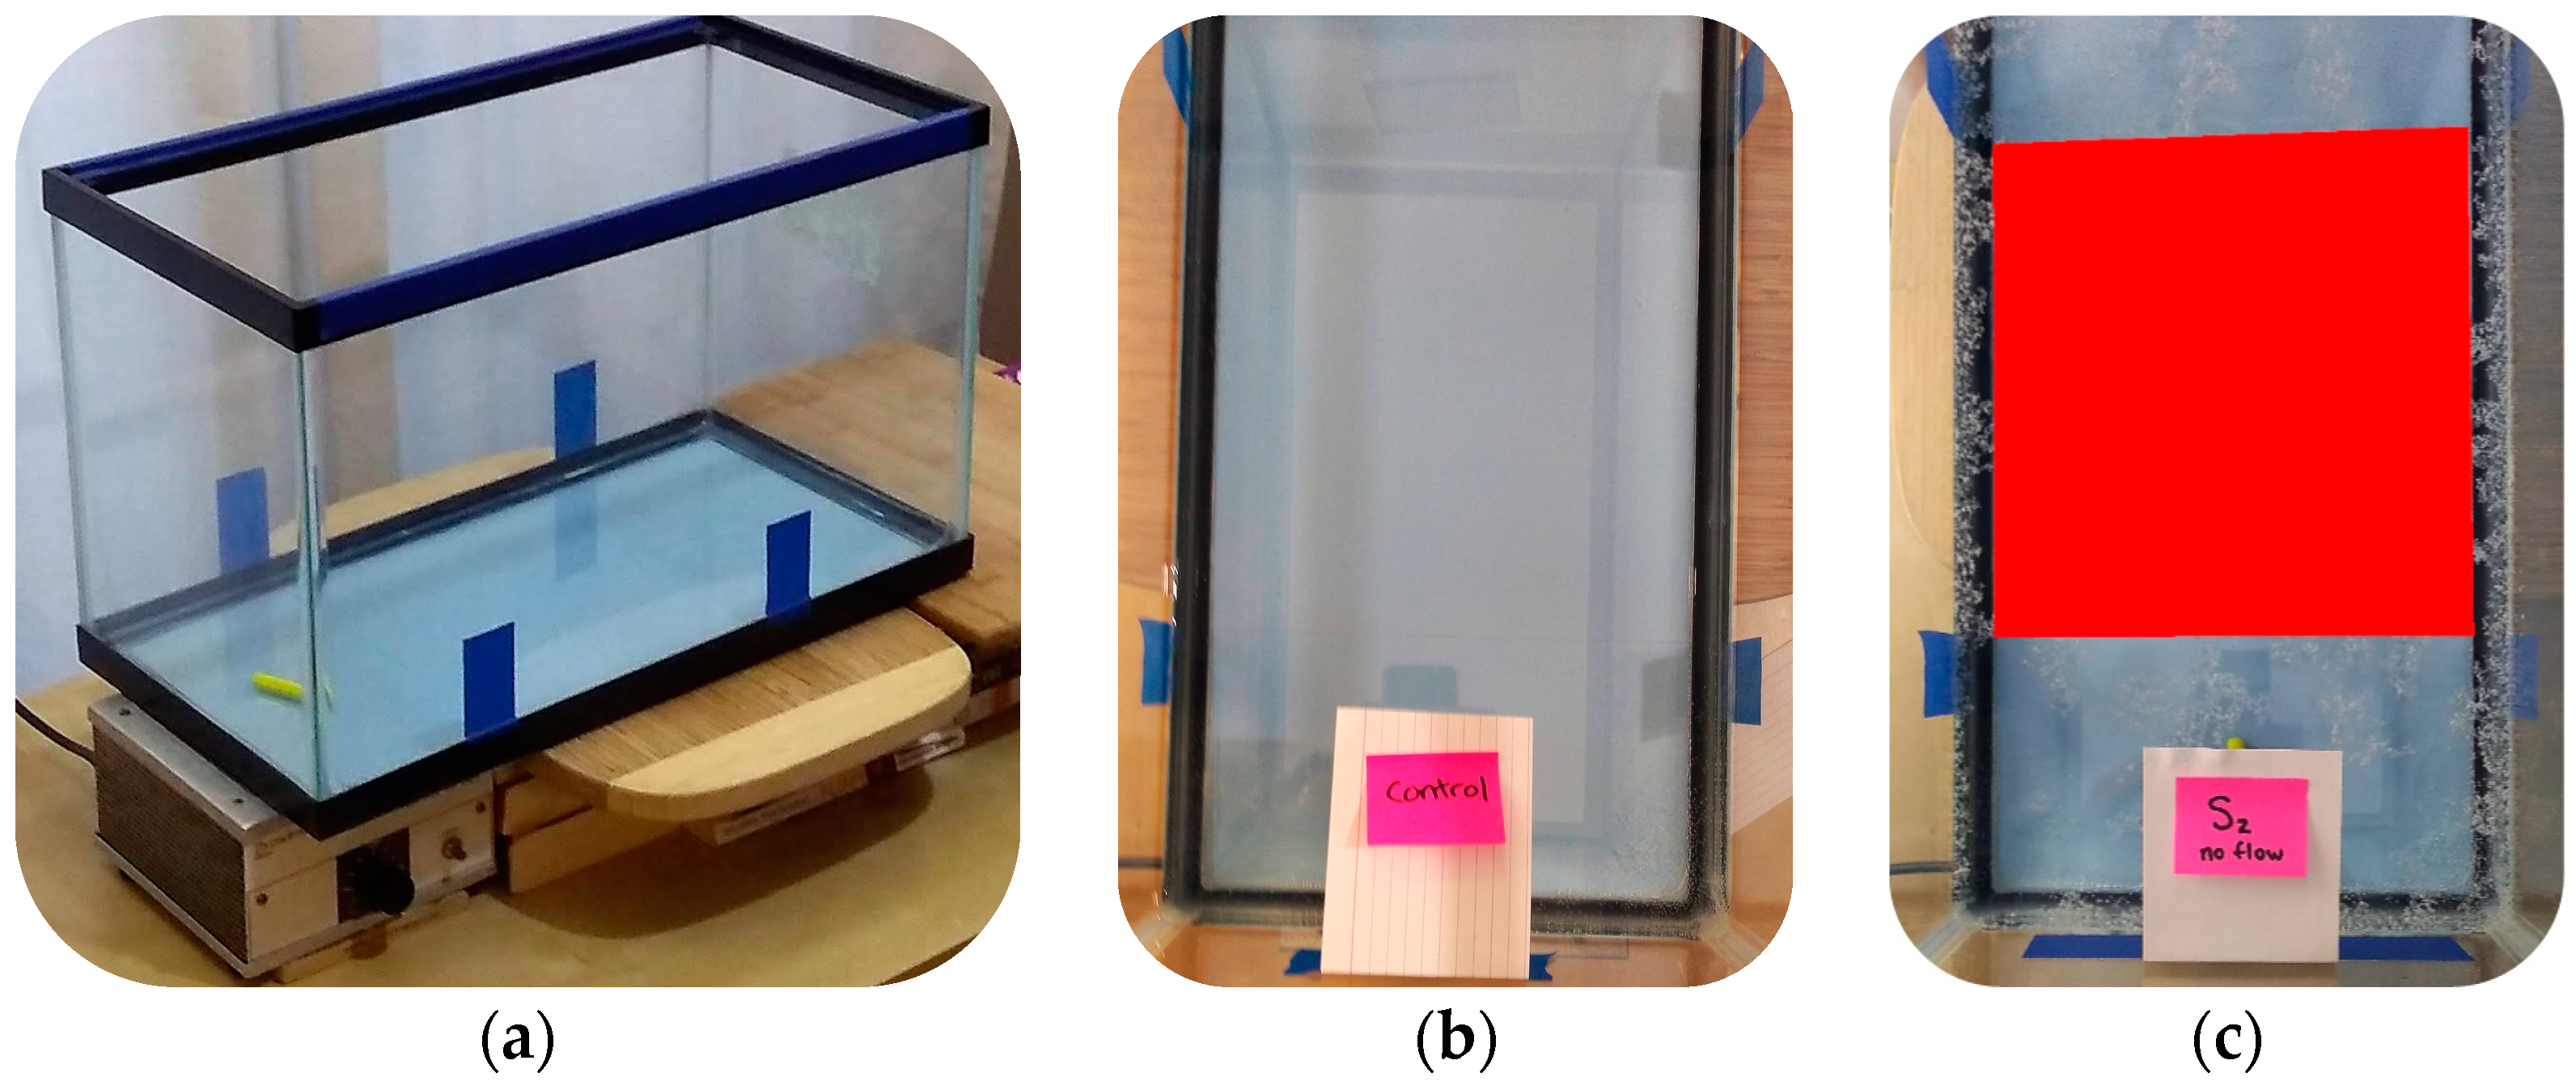
Figure 1. An aquarium tank with (a) light blue cardstock lining the bottom and positioned atop a magnetic stirrer was (b) marked along its length to delineate the four corners of a quadrat observable on digital images captured from above the tank (c) to serve as digital benchmarks on the given image.
Microplastics 02 00022 g001
Figure 2. Figure 2. Microscopic evaluation of microplastic fragments from size classes (a) 500 and (b) 1000 µm. Micrometer bars denote increments of 10 µm length.
Microplastics 02 00022 g002
Figure 3. Vertical bars denote total RGB pixel intensity values from microplastic suspensions under no-slip conditions for two size classes: (a) 500 and (b) 1100 µm. The horizontal dashed line denotes the total RGB pixel intensity values from control conditions.
Microplastics 02 00022 g003
Figure 4. Vertical bars denote total RGB pixel intensity values from microplastic suspensions under turbulence conditions for two size classes: (a) 500 and (b) 1100 µm. The horizontal dashed line denotes the total RGB pixel intensity values from control conditions.
Microplastics 02 00022 g004
Figure 5. Vertical bars denote total RGB pixel intensity values from 1000 µm microplastic suspensions under (a) no-slip and (b) turbulence conditions. The horizontal dashed line denotes the total RGB pixel intensity values from control conditions.
Microplastics 02 00022 g005
Table 1. Relationship between pixel intensity scores and a PET microplastic concentration gradient.
Pixel Intensity (PI)No-Slip ConditionsTurbulence Flow Conditions
β
(PI/ppm)
R2b
(PI)
pβ
(PI/ppm)
R2b
(PI)
p
Average Red (R)−0.00740.04143>0.050.00800.05141>0.05
Average Green (G)−0.00900.09145>0.050.00600.07142>0.05
Average Blue (B)−0.00510.01159>0.050.00710.04157>0.05
Average RGB−0.00700.07150>0.050.00700.12148>0.05
Total RGB−88,726.90.29396,370,873>0.0535,937.40.15369,510,089>0.05
Disclaimer/Publisher’s Note: The statements, opinions and data contained in all publications are solely those of the individual author(s) and contributor(s) and not of MDPI and/or the editor(s). MDPI and/or the editor(s) disclaim responsibility for any injury to people or property resulting from any ideas, methods, instructions or products referred to in the content.