Article

Separation of Microplastics from Blood Samples Using Traveling Surface Acoustic Waves

by
Pedro Mesquita
,
Yang Lin
*,
Liyuan Gong
and
Daniel Schwartz
Department of Mechanical, Industrial and Systems Engineering, University of Rhode Island, Kingston, RI 02881, USA
*
Author to whom correspondence should be addressed.
Microplastics 2024, 3(3), 449-462; https://doi.org/10.3390/microplastics3030028
Submission received: 27 June 2024 / Revised: 19 July 2024 / Accepted: 1 August 2024 / Published: 2 August 2024

Abstract

:
Microplastics have emerged as ubiquitous contaminants, attracting increasing global attention. Recent evidence confirms the presence of microplastics in human blood, suggesting their potential to interact with cells and induce adverse physiological reactions in various organs as blood circulates. To quantify the distribution of microplastics and assess their potential effects on human health, the effective separation of microplastics from blood is crucial. However, current methods for separating microplastics from blood are limited in effectiveness and simplicity. This study proposes a microfluidic device that utilizes traveling surface acoustic waves to separate microplastics from blood. While traveling surface acoustic waves have been employed to separate various particles, a systematic study on the separation of microplastics from blood samples has not been previously reported. Specifically, the theoretical values of the acoustic radiation factor for various types of microplastics and blood cells were investigated. The significant differences in resonant frequencies indicated the feasibility of separating microplastics of different sizes and types from blood cells. Experimental validation was performed using a polydimethylsiloxane microfluidic device on a piezoelectric lithium niobate substrate. The device successfully separated 5- and 10-micrometer polystyrene microplastics from blood samples. The effects of power and flow rate on separation efficiency were also systematically investigated. This study provides a novel approach for the effective separation of microplastics from blood, contributing to the assessment of their distribution and potential health impacts.

1. Introduction

Since their advent, plastics have rapidly become an integral part of everyday life due to their lightweight and durable properties [1,2]. Given the lack of alternative materials with similar characteristics and utility, the use of plastics is expected to persist for a long time [3]. However, the extensive and often excessive use of plastics has inevitably led to pollution across various ecosystems, contaminating water, soil, and air [4,5,6,7,8] and consequently posing negative impacts on public health [9,10]. Notably, microplastics, particles smaller than 5 mm, have been identified as the most abundant plastic pollutants in oceans [11,12,13]. Due to their small size, these microplastics can easily disperse globally [14], significantly increasing human exposure to plastic pollution [10,15].
It is estimated that humans inhale and ingest more than 70,000 microplastics per year [16]. Microplastics have been detected in various food sources, such as salt and seafood [17,18,19], as well as in drinking water [20,21] and air [22,23]. Schwabl et al. reported that human stool samples contained an average of 20 microplastic particles (50–500 µm) per 10 g of stool, with polypropylene and polyethylene being the most common types [24]. An average of 12 plastic particles, ranging in size from 5 to 10 µm, were found in placenta samples [25]. Microplastics sized between 4 and 30 µm were identified in the tissues of patients with cirrhotic liver injuries [26]. Additionally, human sputum samples were examined, revealing 21 types of plastic particles ranging from 44.67 to 210.64 µm [27].
The exposure to these particles has raised global concern about public health, with increasing evidence showing the adverse impacts of these pollutants [28,29]. For example, polystyrene microbeads can lead to undesired alterations in enzymatic activity [30,31]. Additionally, microplastics have been associated with genotoxicity and DNA damage [32,33]. Spermatogenesis dysfunction induced by polystyrene particles has been studied both in vivo (using mice) and in vitro, with results suggesting that microplastics can disrupt the blood–testis barrier (BTB) and cause an imbalance in the mammalian target of rapamycin (mTOR) pathway [34].
More recently, a study by Leslie et al. reported the presence of microplastics in human blood [35]. Five widely used polymers, including poly(methyl methacrylate) (PMMA), polypropylene (PP), polystyrene (PS), polyethylene (PE), and polyethylene terephthalate (PET), were identified in blood samples collected from 22 healthy donors, with an average concentration of 1.6 µg/ml. As blood plays a crucial role in connecting different organs, the presence of microplastics in blood indicates their uptake within the human body [36]. Despite this finding, it remains unclear how microplastics are transported and distributed in blood and the human body and whether these particles can potentially affect immune regulation and alter normal physiological activities. Therefore, effectively separating microplastics from blood samples is essential for public risk assessment, given the high levels of microplastic pollution worldwide [37,38]. However, sampling microplastics in blood is challenging due to their small size, typically only a few micrometers [35]. In the works reported by Leslie et al., Ragusa et al., and Schwabl et al., the approaches used for sampling require bulk filtering, which is both time-consuming and labor-intensive [24,25,35]. To provide a simpler and more efficient approach, we propose an acoustofluidic device to separate microplastics from blood samples. This device leverages the powerful particle manipulation capabilities of traveling surface acoustic waves (TSAWs) and operates in a non-contact, label-free manner. By exploiting the differences in acoustic properties between microplastics and blood cells, our method enables precise and rapid separation, significantly reducing processing time and minimizing sample handling.
As an emerging and promising tool, acoustofluidics has been widely used in multiple separation applications, including cancer cell, exosome, and blood–plasma separation [39,40,41,42]. To the best of our knowledge, acoustofluidics has not yet been applied to the separation of microplastics from blood samples. Fundamentally, particles can be manipulated using different types of acoustic waves, among which surface acoustic waves (SAWs) are commonly employed in microfluidic applications [42,43,44]. SAWs are generated by interdigitated transducers (IDTs), and by altering their geometry and layout, different acoustic fields can be created to achieve various purposes, such as particle focusing and separation [43,45]. Specifically, the layout of IDTs can produce two types of surface acoustic waves: standing surface acoustic waves (SSAWs) and traveling surface acoustic waves (TSAWs) [43,46]. In this study, TSAWs were employed to separate microplastics from blood samples. Initially, the theoretical values for the acoustic radiation factor of ten common types of plastics with sizes of 1, 3, 5, and 10 µm, as well as blood cells, were investigated. Experiments were then conducted to validate the theoretical acoustic radiation factor values for polystyrene particles of 5 and 10 µm. Polystyrene particles were chosen for their extensive use in microfluidics and their prevalence as one of the most abundant microplastics globally. To test the hypothesis that microplastics can be separated from blood cells, 5 and 10 µm polystyrene particles were successfully separated from blood cells. Lastly, the effects of power and flow rate on separation efficiency were systematically examined.

2. Materials and Methods

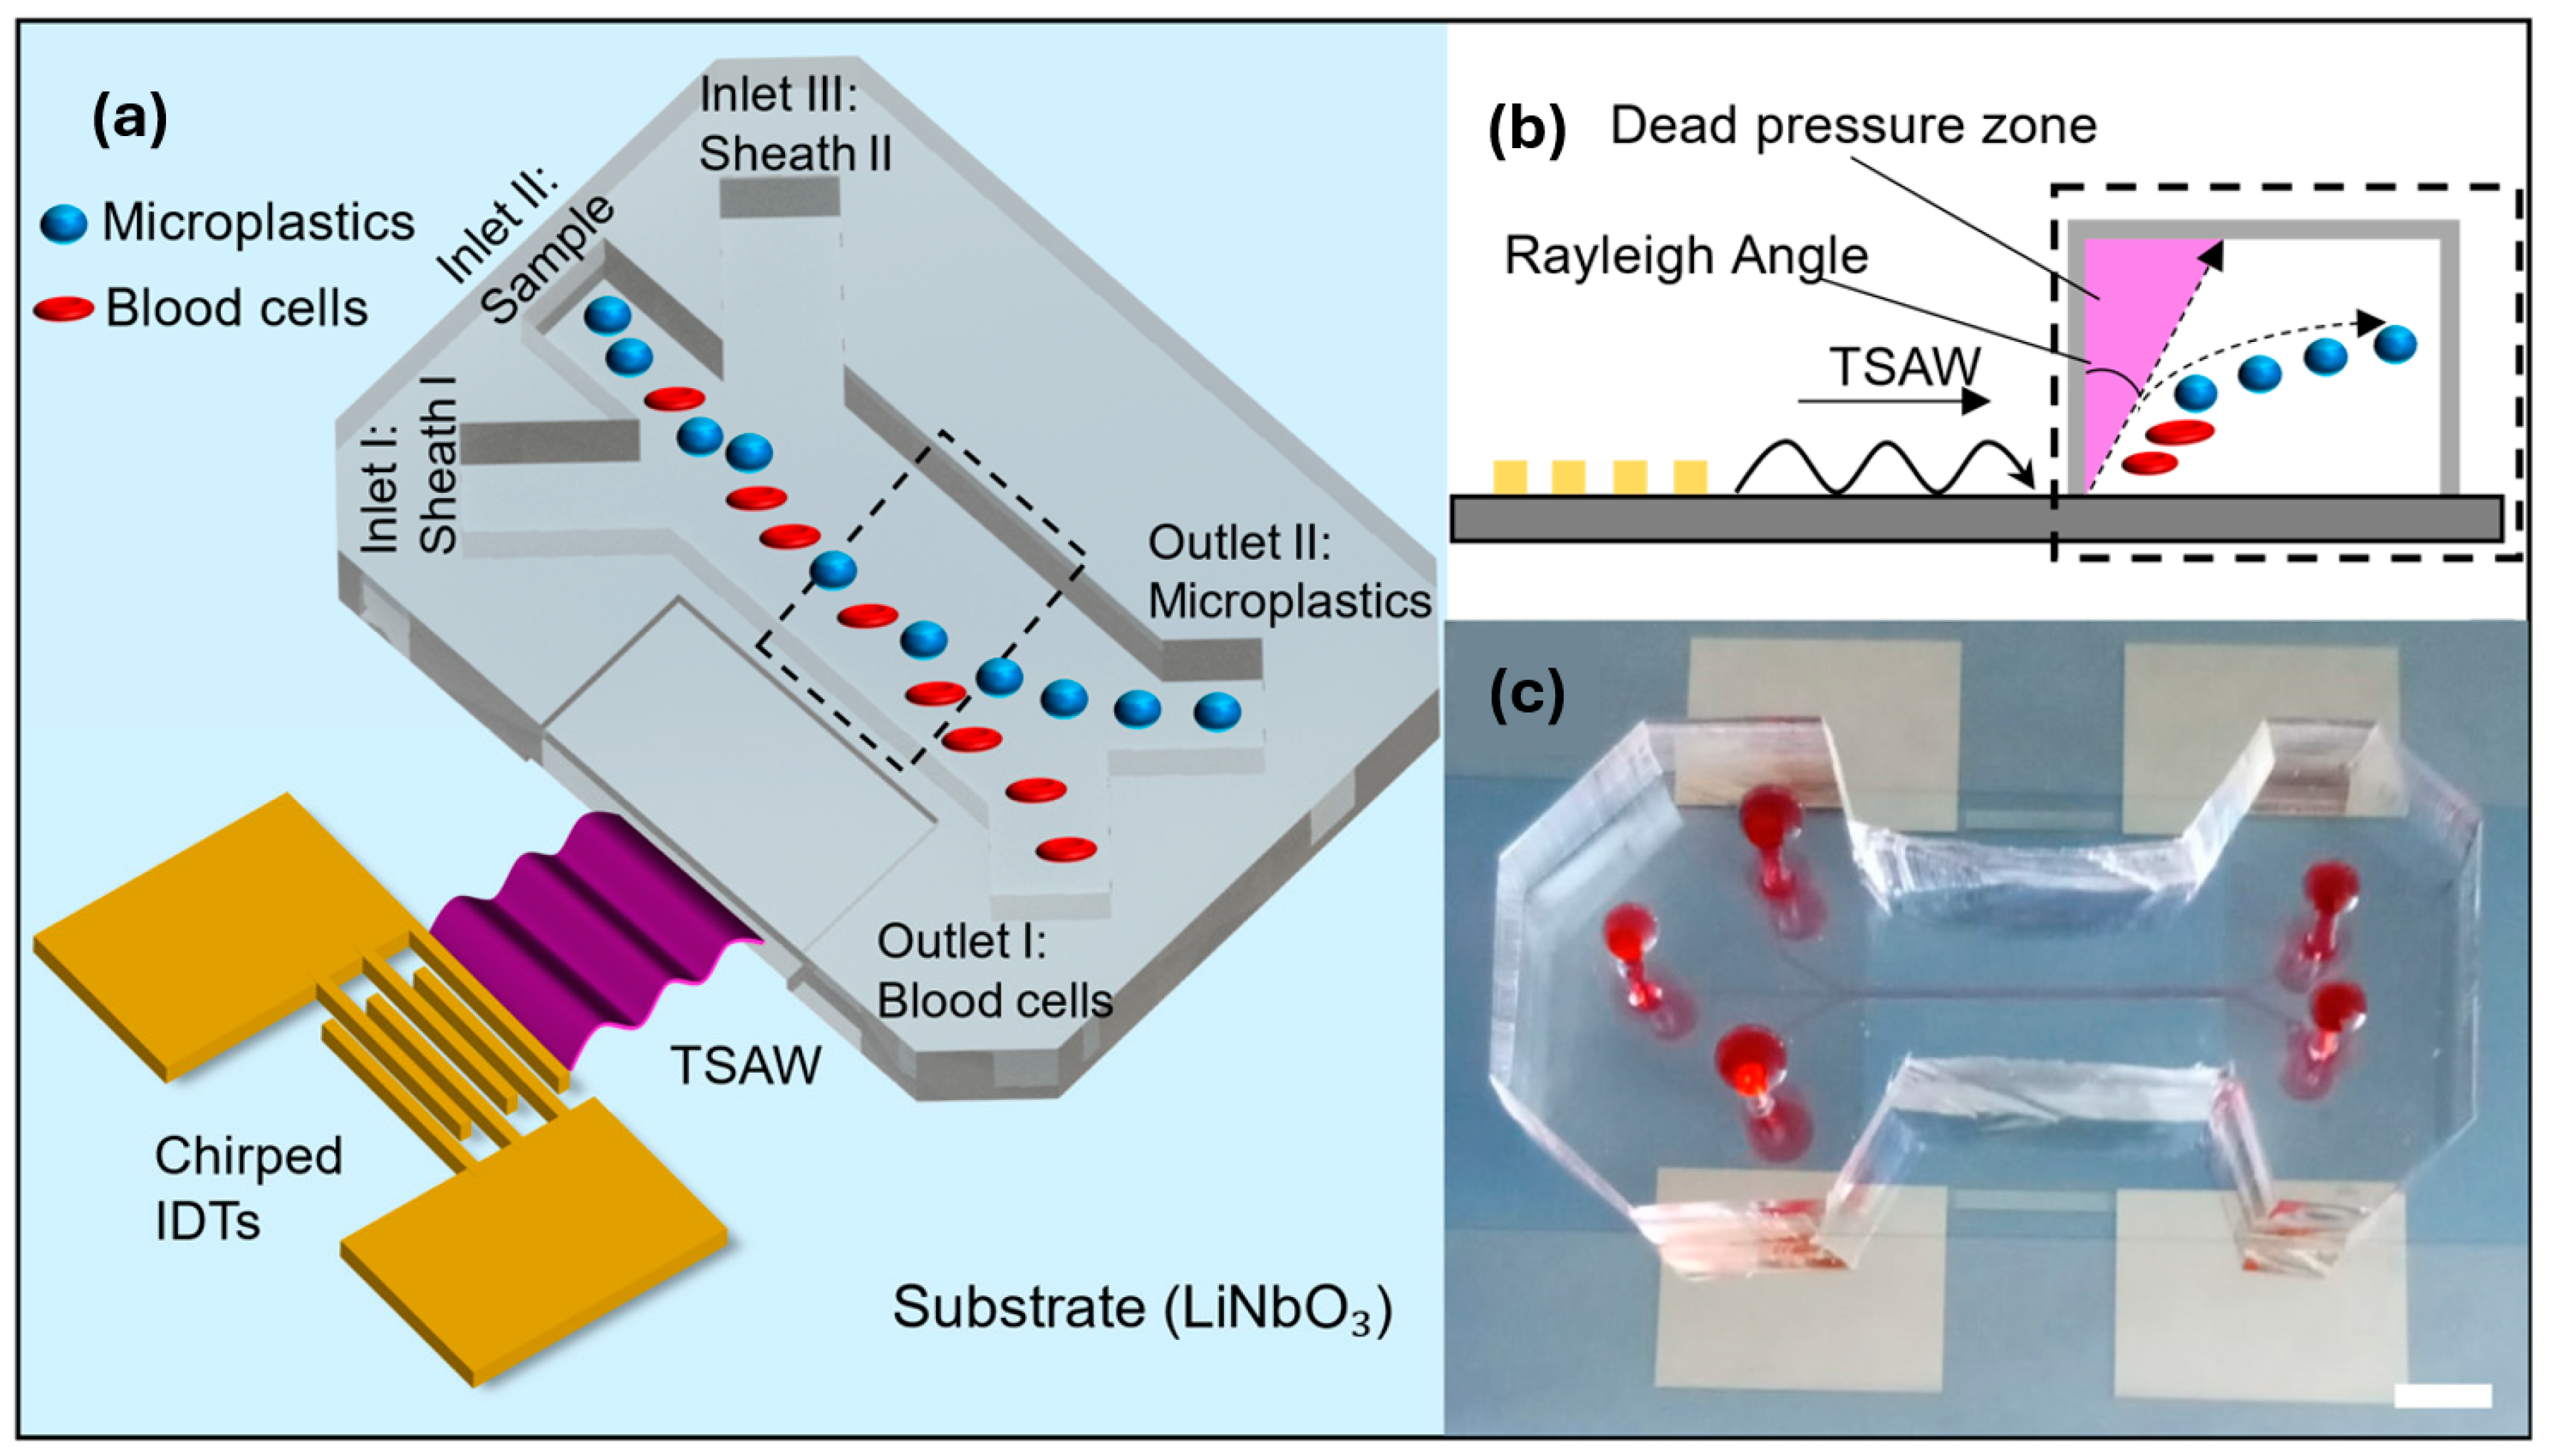
2.1. TSAW Microplastic Separation Mechanism

The mechanism of microplastic separation from blood samples is depicted in Figure 1. The device consists of a piezoelectric lithium niobate (LiNbO3) substrate and a polydimethylsiloxane (PDMS) microfluidic chip. Chirped IDTs were employed because they allow testing multiple frequencies [47,48]. The fabricated devices had IDTs with varying pitch from 6.8 to 22 µm, enabling operation between 45 and 145 MHz. A sinusoidal alternating current (AC) signal created by a waveform generator was amplified and applied to the IDTs to generate the TSAW (Figure 1a). The leaky TSAW propagates perpendicularly to the main microchannel and interacts with the fluid, generating a pressure gradient on the substrate surface, which propagates toward the fluid and induces particle displacement [48,49,50].
It is worth noting that the leaky wave generates a dead pressure zone, where particles are not subject to acoustophoretic effects (upper left corner of the channel, as shown in Figure 1b) [42,51]. The size of the dead pressure zone can be estimated by the Rayleigh angle, θ = s i n 1 c f / c L i N b O 3 22.8 ° , where c f and c L i N b O 3 are the speeds of sound in the fluid and substrate, respectively. The actual device can be seen in Figure 1c, with the microchannels highlighted using food coloring.
The device comprised three inlets: the central port for sample injection and the two side inlets for sheath flows. These sheath flows served to focus the sample at an optimal distance from the channel walls. Additionally, Sheath Flow I was crucial in preventing particles from being trapped in the dead pressure zone [47,48]. The focused sample then flowed through the main microchannel, reaching the region where the TSAW was applied. By using a resonant frequency that induced greater acoustophoretic effects on microplastic particles compared to blood cells, the TSAW deflected the microplastics transversely while leaving the blood cells largely unaffected. This process directed the microplastics to a designated separation outlet. The device was designed with two outlets to collect the separated blood cells and microplastics, respectively.

2.2. Fabrication of the Microfluidic Device

The substrate used for the SAW transducer was a Y + 128 X-propagation LiNbO3 wafer (University Wafer Inc., Boston, MA, USA). The IDTs design was patterned on the LiNbO3 wafer using a photolithography process (AZ nLOF 2035, Integrated Micro Materials Inc., Argyle, TX, USA) performed in a Maskless Aligner (MLA 150, Heidelberg Instruments Mikrotechnik GmbH, Heidelberg, Germany). Subsequently, a double metal layer (Cr/Au, 50 Å/800 Å) was deposited using an e-beam evaporator (Lesker Lab 18, Kurt J. Lesker Company, Jefferson Hills, PA, USA), followed by a lift-off process to obtain the desired IDTs for SAW generation. To enhance the bonding between the PDMS device and the LiNbO3 substrate, a 100 nm SiO2 layer was deposited on top of the final IDTs [52,53,54].
The PDMS device was fabricated using the standard soft-lithography method [55]. The main PDMS channel measures 400 µm in width and 40 µm in depth, with inlets measuring 133 µm × 40 µm and outlets measuring 200 µm × 40 µm. The PDMS device was permanently bonded to the LiNbO3 substrate via oxygen plasma treatment (50 sccm, 100 mTorr, 100 W, 2 min). Afterward, the devices were placed in an oven at 80 °C for 30 min. To test a wide range of frequencies, the devices were equipped with chirped IDT fingers featuring variable width and pitch. Two types of devices were fabricated for low- and high-frequency testing. The width and pitch were progressively increased by 0.5 µm, following guidelines from other studies [56,57,58]. The low-frequency device operated from 45 to 85 MHz (22–11.5 µm pitch and width), while the high-frequency device operated from 90 to 145 MHz (11–6.8 µm pitch and width).

2.3. Microplastics and Blood Preparation

Microplastic solutions were prepared by diluting synthetic microspheres in deionized water. The particles consisted of fluorescent PS with sizes of 5 and 10 µm (Thermo Fisher Scientific, Hanover Park, IL, USA). One droplet of PS particles was added to 10 mL of deionized (DI) water to create the microsphere suspension. Porcine whole blood (Innovative Grade US Origin Porcine Whole Blood K2 EDTA 100 mL, Innovative Research Inc., Novi, MI, USA) was diluted in phosphate-buffered saline (PBS) (Thermo Fisher Scientific, Hanover Park, IL, USA) according to the guidelines in [59]. To avoid clogging the microfluidic channels, the final diluted samples contained 20% blood and 80% PBS, totaling 10 mL of the diluted blood mixture. The diluted blood was gently mixed with the microplastics in a sterile conical Eppendorf tube to obtain the samples used for separation.

2.4. Separation Quantification and Data Analysis

An inverted microscope (Zeiss Axio Vert.A1) with a camera (VEO E310L, Phantom, Wayne, NJ, USA) was used to observe the flow and record images and videos. For the fluorescent particles, a fluorescence illuminator (X-Cite mini + 365 nm, Excelitas, Waltham, MA, USA) was used. Fluids were injected using syringe pumps (Fusion 200, Chemyx Inc., Stafford, TX, USA). The signal from a waveform generator (RIGOL DG4162 Arbitrary Waveform Generator—160 MHz, RIGOL Technologies Inc., Portland, OR, USA) was amplified by an amplifier (AR Microwave Instrumentation, Model 100A250A amplifier, Souderton, PA, USA) and then applied to the IDTs. The particle solution mixed with deionized water was injected through the device’s central inlet, while deionized water was used as the sheath flow and injected through inlets I and III (Figure 1). Separation efficiency was quantified by counting the particles collected from the outlets. Additionally, images and videos were recorded and analyzed using Phantom camera software (Phantom Camera Control and Phantom Video Player version 3.7, Phantom, Wayne, NJ, USA).

3. Results and Discussion

3.1. Theoretical Acoustic Radiation Force

The separation principle relies on the fact that particles with different physical properties experience different acoustophoretic forces ( F T S A W ) at the same operational frequency [48,60,61]. According to the theoretical description of the effects of TSAWs on particles, the properties that influence the acoustic radiation force/factor (ARF) include size, density, and compressibility (both longitudinal and shear speed of sound) [62]. To induce substantial particle displacement, the applied frequency must match the particle’s resonance frequency, thereby achieving a significant ARF and increasing the acoustophoretic force.
In this study, the acoustofluidic theory proposed by Hasegawa et al. was utilized to predict the force exerted by the TSAW on particles within the microfluidic channel [62]. The average force ( F T S A W ) induced by a TSAW on a spherical particle is expressed by Equation (1), where a is the particle diameter, E _ is the mean energy density from the TSAW, and Y P is the ARF.
F T S A W = Y P π a 2 E _
The equation suggests that while F T S A W can be increased by raising the applied power, its value also depends on Y P . If Y P is negligible, then the acoustophoretic force will also be small, regardless of the applied power. Equation (2) presents a numerical model to estimate Y P ; the details leading to the derivation of this equation can be found in the original article [62]. Since Y P is a function of the Helmholtz number, selecting the appropriate operational frequency is fundamental to the effectiveness of F T S A W .
Y P = 4 x 0 2 n = 0 n + 1 V n   U n + 1 U n   V n + 1 x 0 2 n n + 1 n + 2 V n U n + 1 U n V n + 1 + n n + 1 U n V n + 1 V n U n + 1 n + 1 n + 2 U n V n + 1 V n U n + 1 x 0 + n + 1 V n U n + 1 U n V n + 1 x 0 2
The Helmholtz number (Equation (3)) is a dimensionless parameter that relates the applied frequency, particle diameter, and speed of sound with the ARF.
x 0,1 , 2 = 2 π f a c f , l , s
where f is the frequency, c f is the fluid speed of sound, c l is the solid longitudinal speed of sound, and c s is the solid shear speed of sound. The subindices 0, 1, and 2 refer to c f , c l , and c s , respectively. The theoretical strength of a TSAW can be predicted based on the properties of the particle and the fluid.
Indeed, from the equations shown above, we can see that ARFs (or separation performance) depend on multiple physical properties of the suspended particles and the medium [48]. Therefore, determining the optimal operational frequency is essential to achieve the best separation performance for each type of particle. This section aims to explore the properties of microplastics and their influence on the ARF.
Given the properties shown in Table 1 and the particle sizes, we plotted the ARF as a function of the applied frequency. Specifically, ten types of microplastics were studied: Acrylonitrile-butadiene-styrene (ABS), Poly-DGEBA/PDA (Epoxy), Poly-hexamethylene adipamide (Nylon), Polycarbonate (PC), polyethylene (PE), Poly-methylmethacrylate (PMMA), polypropylene (PP), Poly-vinyl chloride (PVC), polystyrene (PS), and Polytetrafluoroethylene (Teflon®). The Supplementary Information provides the algorithm used for calculating the theoretical ARF, along with further details about the theoretical modeling.
Moreover, since particle size is another critical factor determining ARF, four different sizes were studied: 1, 3, 5, and 10 µm. As shown in Figure 2, all the particles exhibit multiple resonant peaks. Due to the potential overlap between peak frequencies (not necessarily the first resonance frequency), it is possible to simultaneously separate particles of different types and sizes. For example, using an input frequency around 125 MHz allows for the simultaneous separation of 5 and 10 µm particles made of Epoxy and PMMA, both achieving an acoustic radiation factor (ARF) of approximately 10. This indicates that by carefully selecting and tuning input frequencies, multiple microplastics with similar ARFs can be effectively targeted.
The resonance frequency range is another critical factor to consider. Certain plastic types, such as Epoxy, PMMA, and PS, exhibit wide resonance frequency ranges. For example, 5 µm PMMA particles show a high ARF in the frequency range from 125 MHz to 150 MHz, providing a broad spectrum (25 MHz range) for effective separation of PMMA particles. Conversely, microplastics such as ABS, PE, and Teflon® have narrow resonance frequency ranges. For instance, 10 µm ABS particles exhibit a high ARF within a narrow frequency range of around 50 MHz, making the selection of operational frequencies more challenging. However, this limitation can be advantageous when the goal is to selectively separate microplastics of a specific type and size.

3.2. Experimental Determination of ARF

Since the ARF cannot be directly measured experimentally, the average transversal particle velocity was used to indirectly quantify the resonance peaks [48,50], as larger F T S A W at resonant frequencies cause larger particle displacement velocities. Figure 3 compares the theoretical prediction of ARF with the experimental measurement of particle velocity for different-sized PS particles (selected models). Additionally, we investigated the acoustophoretic behavior of blood cells both theoretically and experimentally (also see the Supplementary Information). The longitudinal and shear speeds of sound used for the theoretical calculation of the ARF in red blood cells were 1510 m/s and 211 m/s, respectively [48,56,64,65,66,67]. For white blood cells, the speeds of sound were 1506 m/s and 210 m/s [65,67]. The density values used for the calculations were 1101 kg/m3 for red blood cells and 1054 kg/m3 for white blood cells [65].
Figure 2. The theoretical ARFs of microplastics of different types and sizes were analyzed as a function of the input frequency. The results suggest that the minimum frequency required to produce a significant ARF increases as the particle size decreases for all types of microplastics studied. The following subfigures show the ARF results for each type of microplastic: (a) ABS, (b) Epoxy, (c) Nylon, (d) PC, (e) PE, (f) PMMA, (g) PP, (h) PVC, (i) PS, and (j) Teflon®.
Microplastics 03 00028 g002
As shown in Figure 3a,b, a frequency sweep from 50 to 140 MHz, with intervals of 5 MHz, was conducted for both 5 µm and 10 µm PS particles to determine the frequency-dependent particle velocity. For 5 µm PS particles, the particle velocity became noticeable when the input frequency reached 80 MHz, and it continued increasing until the frequency reached 130 MHz. It is noteworthy that even though the theoretical ARF started to decrease after 110 MHz, the experimental particle velocity continued to increase, albeit at a slower rate. The discrepancy between the theoretical and experimental resonant frequencies may be attributed to differences in the particle and fluid properties used in theoretical derivation and experiments. The theoretical ARF was calculated assuming the particles were immersed in an inviscid fluid [62,68], whereas, in experiments, both water and blood were used. Additionally, the theoretical model did not account for the damping effect caused by the PDMS channels confining the particles. As with many other mechanical devices, the resonance peaks were also influenced by assembly variations and differences in part stiffness, as well as fabrication defects (e.g., lift-off errors, contamination) [69,70].
Size is another important factor determining ARF; thus, 10 µm PS particles were also used to examine the theoretical prediction of the acoustophoretic behavior of different-sized particles. In theoretical predictions (Figure 3b), there are four theoretical peaks within the studied frequency range (50–140 MHz). However, similar to the frequency shift observed in studies of 5 µm PS particles, only three experimental peaks were identified at 70, 105, and 130 MHz. It is expected that the fourth experimental peak was also shifted to a higher frequency beyond our test range. Figure 3c,d show the displacement of 5 µm PS particles at 95 MHz and 125 MHz, respectively. The higher ARF values at 125 MHz induced greater displacements in the particles compared to 95 MHz. The white arrow indicates the direction of the TSAW. The scale bar represents 100 µm.
Figure 3e presents the theoretical ARF for red and white blood cells. The results indicate that the ARF values for blood cells are substantially lower compared to those of microplastics except at their resonant frequencies. To effectively separate microplastics from blood cells, it is crucial to select operational frequencies that maximize the ARF for microplastics while minimizing any acoustophoretic effects on blood cells. By avoiding the resonant frequencies of blood cells, we anticipate enhanced separation efficiency. For example, targeting frequencies that induce a high ARF in microplastics, such as 90 MHz for 10 µm PS particles, while having minimal impact on blood cells, ensures that microplastics are deflected transversely by the TSAW. This approach directs microplastics to the separation outlet, achieving effective separation from the blood cells. In the following section, we will examine this hypothesis experimentally.

3.3. Separation of Microplastics from Blood Samples

Building on the theoretical and experimental insights from the previous sections, the continuous separation of microplastics from blood samples was demonstrated using the proposed microfluidic device. Specifically, 5 and 10 µm PS microplastics were used and successfully separated from blood. The theoretical analysis suggested that frequencies around 125 MHz would yield significant ARF values for both 5 and 10 µm PS particles while maintaining low ARF values for blood cells, thereby enhancing the separation efficiency. Guided by this information, experiments were conducted by sweeping the input frequency and observing the resulting acoustophoretic effects. The observations indicated that the acoustophoretic effect was most pronounced for the 5 and 10 µm PS microplastics while remaining minimal for blood cells at 128 MHz (details available in the Supplementary Information). Based on these findings, 128 MHz was selected as the optimal operational frequency for the separation process.
The sample-to-sheath flow ratio was selected as 1:1:3 (sheath–sample), which has been widely used in other SAW devices according to the literature [44,48,50]. The effects of flow rate and power on separation efficiency were investigated by performing separations at sample flow rates of 0.5, 1.0, 5.0, and 10 µL/min. The results indicated that lower flow rates and higher power levels resulted in the best separation performances (Figure 4a,b). Separation performance, defined as the recovery rate of microplastics (percentage of microplastics deflected toward the correct collection outlet), approached 100% at a flow rate of 1.0 µL/min. In contrast, at 10 µL/min, the performance did not exceed 60%. All flow rate experiments used a consistent power amplification of 50%, and the effect of power on separation efficiency was studied at a fixed flow rate of 5 µL/min. Increasing the power amplification from 40% to 70% improved the separation performance from 40% to nearly 100%. Lower flow rates increase the exposure time of particles to the acoustophoretic effects, enhancing particle displacement and separation efficiency. Conversely, higher flow rates reduce exposure time, but this can be compensated by using higher power levels. Videos demonstrating the separation process are available in the Supplementary Information.

4. Conclusions

The ability to separate microplastic particles from blood samples in a continuous manner was demonstrated using a TSAW microfluidic device. Theoretical values of the ARF for 10 common types of microplastics of four different sizes were estimated, highlighting their advantages and limitations. The ARF was experimentally determined to compare the theoretical predictions with the actual acoustophoretic strength; displacements for both microplastics and blood cells were observed under different frequencies to establish the optimal operational setup. The separation of 5 and 10 µm PS microplastics from blood samples using the same frequency (128 MHz) was successfully demonstrated. The effects of flow rate and power were analyzed, and the trends followed expectations, with lower flow rates and higher power providing higher separation efficiency.
Although not all plastic types and sizes can be separated simultaneously due to the need for multiple frequencies, samples could be run repeatedly using different frequencies to achieve comprehensive separation. Future applications might include the use of acoustic pumps to continuously alternate the frequency, enabling more effective separation processes. In addition, other methods (e.g., Raman spectroscopy, Particle Size Distribution) could be applied to further investigate the separated samples. These additional analyses would provide deeper insights into the characteristics and composition of the separated microplastics, enhancing the overall understanding of their potential health impacts. Given the growing concerns over microplastics and their recent detection in human samples, a device capable of separating microplastics from blood is urgently needed. The device demonstrated its usefulness by successfully separating microplastics from blood samples.
It is also acknowledged that more advanced theoretical models could be employed to enhance the accuracy of our predictions. The theory developed by Hasegawa and Yosioka, while useful, is not specifically tailored for Surface Acoustic Wave (SAW) applications. Consequently, other models that are specifically related to SAWs might provide more accurate and precise results. Future work will consider the implementation of these advanced models to further refine our understanding of the acoustic radiation forces at play and improve the overall performance of our microfluidic device. Additionally, the reality is more complex, considering the diversity of microplastics collected from the environment. The separation performance depends on multiple factors, such as the plastic type and size of microplastics, making it challenging to achieve precise separation by size or type. Future studies should focus on addressing these issues by developing advanced frequency modulation techniques and acoustic pump systems, which can dynamically adjust frequencies in real time to enhance separation efficiency. Additionally, integrating complementary separation methods, such as microfluidic sorting or optical trapping, could provide a more comprehensive approach. By implementing frequency sweeping and carefully avoiding the resonant frequencies of blood cells, acoustofluidics holds great promise as a novel and effective method for sampling and separating microplastics from blood. This innovative approach has the potential to significantly advance our understanding of microplastic contamination in biological systems and contribute to improved public health and environmental protection.

Supplementary Materials

The following supporting information can be downloaded at: https://www.mdpi.com/article/10.3390/microplastics3030028/s1.

Author Contributions

Conceptualization, P.M. and Y.L.; Data curation, P.M., Y.L., L.G. and D.S.; Formal analysis, P.M. and Y.L.; Funding acquisition, Y.L.; Investigation, P.M., Y.L., L.G. and D.S.; Methodology, P.M. and Y.L.; Project administration, Y.L.; Resources, Y.L.; Software, P.M.; Supervision, Y.L.; Validation, P.M. and Y.L.; Visualization, P.M., L.G. and D.S.; Writing—original draft, P.M.; Writing—review and editing, P.M., Y.L. and L.G. All authors have read and agreed to the published version of the manuscript.

Funding

This research was supported through the Water Resources Research Act Program funded by the U.S. Geological Survey (G21AP10622-02), the National Science Foundation (NSF, Grant 2347408), and Lin’s Start-up Funds.

Institutional Review Board Statement

Not applicable.

Data Availability Statement

The raw data supporting the conclusions of this article will be made available by the authors on request.

Conflicts of Interest

The authors declare no conflicts of interest.

References

  1. Prata, J.C.; da Costa, J.P.; Lopes, I.; Duarte, A.C.; Rocha-Santos, T. Environmental Exposure to Microplastics: An Overview on Possible Human Health Effects. Sci. Total Environ. 2020, 702, 134455. [Google Scholar] [CrossRef] [PubMed]
  2. Dick, V.A.; Juliette, L. Microplastics and Human Health. Science 2021, 371, 672–674. [Google Scholar] [CrossRef]
  3. Adyel, T.M. Accumulation of Plastic Waste during COVID-19. Science 2020, 369, 1314–1315. [Google Scholar] [CrossRef] [PubMed]
  4. MacLeod, M.; Arp, H.P.H.; Tekman, M.B.; Jahnke, A. The Global Threat from Plastic Pollution. Science 2021, 373, 61–65. [Google Scholar] [CrossRef] [PubMed]
  5. Gasperi, J.; Wright, S.L.; Dris, R.; Collard, F.; Mandin, C.; Guerrouache, M.; Langlois, V.; Kelly, F.J.; Tassin, B. Microplastics in Air: Are We Breathing It In? Curr. Opin. Environ. Sci. Health 2018, 1, 1–5. [Google Scholar] [CrossRef]
  6. Law, K.L.; Thompson, R.C. Microplastics in the Seas. Science 2014, 345, 144–145. [Google Scholar] [CrossRef] [PubMed]
  7. de Souza Machado, A.A.; Lau, C.W.; Till, J.; Kloas, W.; Lehmann, A.; Becker, R.; Rillig, M.C. Impacts of Microplastics on the Soil Biophysical Environment. Environ. Sci. Technol. 2018, 52, 9656–9665. [Google Scholar] [CrossRef]
  8. Colmer, J.; Hardman, I.; Shimshack, J.; Voorheis, J. Disparities in PM2. 5 Air Pollution in the United States. Science 2020, 369, 575–578. [Google Scholar]
  9. Silva, A.L.P.; Prata, J.C.; Walker, T.R.; Duarte, A.C.; Ouyang, W.; Barcelò, D.; Rocha-Santos, T. Increased Plastic Pollution Due to COVID-19 Pandemic: Challenges and Recommendations. Chem. Eng. J. 2021, 405, 126683. [Google Scholar] [CrossRef]
  10. Rochman, C.M.; Hoellein, T. The Global Odyssey of Plastic Pollution. Science 2020, 368, 1184–1185. [Google Scholar] [CrossRef]
  11. Cózar, A.; Echevarría, F.; González-Gordillo, J.I.; Irigoien, X.; Úbeda, B.; Hernández-León, S.; Palma, Á.T.; Navarro, S.; García-de-Lomas, J.; Ruiz, A. Plastic Debris in the Open Ocean. Proc. Natl. Acad. Sci. USA 2014, 111, 10239–10244. [Google Scholar] [CrossRef]
  12. Fok, L.; Cheung, P.K.; Tang, G.; Li, W.C. Size Distribution of Stranded Small Plastic Debris on the Coast of Guangdong, South China. Environ. Pollut. 2017, 220, 407–412. [Google Scholar] [CrossRef]
  13. Pedrotti, M.L.; Petit, S.; Elineau, A.; Bruzaud, S.; Crebassa, J.-C.; Dumontet, B.; Martí, E.; Gorsky, G.; Cózar, A. Changes in the Floating Plastic Pollution of the Mediterranean Sea in Relation to the Distance to Land. PLoS ONE 2016, 11, e0161581. [Google Scholar] [CrossRef]
  14. Rahman, A.; Sarkar, A.; Yadav, O.P.; Achari, G.; Slobodnik, J. Potential Human Health Risks Due to Environmental Exposure to Nano- and Microplastics and Knowledge Gaps: A Scoping Review. Sci. Total Environ. 2021, 757, 143872. [Google Scholar] [CrossRef]
  15. Rillig, M.C.; Lehmann, A. Microplastic in Terrestrial Ecosystems. Science 2020, 368, 1430–1431. [Google Scholar] [CrossRef]
  16. Cox, K.D.; Covernton, G.A.; Davies, H.L.; Dower, J.F.; Juanes, F.; Dudas, S.E. Human Consumption of Microplastics. Environ. Sci. Technol. 2019, 53, 7068–7074. [Google Scholar] [CrossRef]
  17. Liebezeit, G.; Liebezeit, E. Non-Pollen Particulates in Honey and Sugar. Food Addit. Contam. Part A 2013, 30, 2136–2140. [Google Scholar] [CrossRef]
  18. Neves, D.; Sobral, P.; Ferreira, J.L.; Pereira, T. Ingestion of Microplastics by Commercial Fish off the Portuguese Coast. Mar. Pollut. Bull. 2015, 101, 119–126. [Google Scholar] [CrossRef]
  19. Karami, A.; Golieskardi, A.; Keong Choo, C.; Larat, V.; Galloway, T.S.; Salamatinia, B. The Presence of Microplastics in Commercial Salts from Different Countries. Sci. Rep. 2017, 7, 46173. [Google Scholar] [CrossRef]
  20. Schwabl, P. Microplastics in Hot Water. Nat. Food 2020, 1, 671–672. [Google Scholar] [CrossRef]
  21. Oßmann, B.E.; Sarau, G.; Holtmannspötter, H.; Pischetsrieder, M.; Christiansen, S.H.; Dicke, W. Small-Sized Microplastics and Pigmented Particles in Bottled Mineral Water. Water Res. 2018, 141, 307–316. [Google Scholar] [CrossRef] [PubMed]
  22. Prata, J.C. Airborne Microplastics: Consequences to Human Health? Environ. Pollut. 2018, 234, 115–126. [Google Scholar] [CrossRef] [PubMed]
  23. Vianello, A.; Jensen, R.L.; Liu, L.; Vollertsen, J. Simulating Human Exposure to Indoor Airborne Microplastics Using a Breathing Thermal Manikin. Sci. Rep. 2019, 9, 8670. [Google Scholar] [CrossRef] [PubMed]
  24. Schwabl, P.; Köppel, S.; Königshofer, P.; Bucsics, T.; Trauner, M.; Reiberger, T.; Liebmann, B. Detection of Various Microplastics in Human Stool. Ann. Intern. Med. 2019, 171, 453–457. [Google Scholar] [CrossRef] [PubMed]
  25. Ragusa, A.; Svelato, A.; Santacroce, C.; Catalano, P.; Notarstefano, V.; Carnevali, O.; Papa, F.; Rongioletti, M.C.A.; Baiocco, F.; Draghi, S.; et al. Plasticenta: First Evidence of Microplastics in Human Placenta. Environ. Int. 2021, 146, 106274. [Google Scholar] [CrossRef] [PubMed]
  26. Horvatits, T.; Tamminga, M.; Liu, B.; Sebode, M.; Carambia, A.; Fischer, L.; Püschel, K.; Huber, S.; Fischer, E.K. Microplastics Detected in Cirrhotic Liver Tissue. EBioMedicine 2022, 82, 104147. [Google Scholar] [CrossRef]
  27. Huang, S.; Huang, X.; Bi, R.; Guo, Q.; Yu, X.; Zeng, Q.; Huang, Z.; Liu, T.; Wu, H.; Chen, Y. Detection and Analysis of Microplastics in Human Sputum. Environ. Sci. Technol. 2022, 56, 2476–2486. [Google Scholar] [CrossRef]
  28. Schirinzi, G.F.; Pérez-Pomeda, I.; Sanchís, J.; Rossini, C.; Farré, M.; Barceló, D. Cytotoxic Effects of Commonly Used Nanomaterials and Microplastics on Cerebral and Epithelial Human Cells. Environ. Res. 2017, 159, 579–587. [Google Scholar] [CrossRef]
  29. Wu, B.; Wu, X.; Liu, S.; Wang, Z.; Chen, L. Size-Dependent Effects of Polystyrene Microplastics on Cytotoxicity and Efflux Pump Inhibition in Human Caco-2 Cells. Chemosphere 2019, 221, 333–341. [Google Scholar] [CrossRef]
  30. Prüst, M.; Meijer, J.; Westerink, R.H.S. The Plastic Brain: Neurotoxicity of Micro- and Nanoplastics. Part. Fibre Toxicol. 2020, 17, 24. [Google Scholar] [CrossRef]
  31. Ribeiro, F.; Garcia, A.R.; Pereira, B.P.; Fonseca, M.; Mestre, N.C.; Fonseca, T.G.; Ilharco, L.M.; Bebianno, M.J. Microplastics Effects in Scrobicularia Plana. Mar. Pollut. Bull. 2017, 122, 379–391. [Google Scholar] [CrossRef]
  32. Rubio, L.; Barguilla, I.; Domenech, J.; Marcos, R.; Hernández, A. Biological Effects, Including Oxidative Stress and Genotoxic Damage, of Polystyrene Nanoparticles in Different Human Hematopoietic Cell Lines. J. Hazard. Mater. 2020, 398, 122900. [Google Scholar] [CrossRef]
  33. Sun, T.; Zhan, J.; Li, F.; Ji, C.; Wu, H. Evidence-Based Meta-Analysis of the Genotoxicity Induced by Microplastics in Aquatic Organisms at Environmentally Relevant Concentrations. Sci. Total Environ. 2021, 783, 147076. [Google Scholar] [CrossRef]
  34. Wei, Y.; Zhou, Y.; Long, C.; Wu, H.; Hong, Y.; Fu, Y.; Wang, J.; Wu, Y.; Shen, L.; Wei, G. Polystyrene Microplastics Disrupt the Blood-Testis Barrier Integrity through ROS-Mediated Imbalance of MTORC1 and MTORC2. Environ. Pollut. 2021, 289, 117904. [Google Scholar] [CrossRef]
  35. Leslie, H.A.; van Velzen, M.J.M.; Brandsma, S.H.; Vethaak, A.D.; Garcia-Vallejo, J.J.; Lamoree, M.H. Discovery and Quantification of Plastic Particle Pollution in Human Blood. Environ. Int. 2022, 163, 107199. [Google Scholar] [CrossRef]
  36. Vethaak, A.D.; Leslie, H.A. Plastic Debris Is a Human Health Issue. Environ. Sci. Technol. 2016, 50, 6825–6826. [Google Scholar] [CrossRef]
  37. Kutralam-Muniasamy, G.; Shruti, V.C.; Pérez-Guevara, F.; Roy, P.D. Microplastic Diagnostics in Humans:“The 3Ps” Progress, Problems, and Prospects. Sci. Total Environ. 2022, 159164. [Google Scholar] [CrossRef]
  38. Fu, W.; Min, J.; Jiang, W.; Li, Y.; Zhang, W. Separation, Characterization and Identification of Microplastics and Nanoplastics in the Environment. Sci. Total Environ. 2020, 721, 137561. [Google Scholar] [CrossRef]
  39. Li, S.; Ma, F.; Bachman, H.; Cameron, C.E.; Zeng, X.; Huang, T.J. Acoustofluidic Bacteria Separation. J. Micromech. Microeng. 2016, 27, 15031. [Google Scholar] [CrossRef]
  40. Antfolk, M.; Magnusson, C.; Augustsson, P.; Lilja, H.; Laurell, T. Acoustofluidic, Label-Free Separation and Simultaneous Concentration of Rare Tumor Cells from White Blood Cells. Anal. Chem. 2015, 87, 9322–9328. [Google Scholar] [CrossRef]
  41. Fan, Y.; Wang, X.; Ren, J.; Lin, F.; Wu, J. Recent Advances in Acoustofluidic Separation Technology in Biology. Microsyst. Nanoeng. 2022, 8, 94. [Google Scholar] [CrossRef] [PubMed]
  42. Wu, M.; Ozcelik, A.; Rufo, J.; Wang, Z.; Fang, R.; Jun Huang, T. Acoustofluidic Separation of Cells and Particles. Microsyst. Nanoeng. 2019, 5, 32. [Google Scholar] [CrossRef] [PubMed]
  43. Gao, Y.; Wu, M.; Lin, Y.; Xu, J. Acoustic Microfluidic Separation Techniques and Bioapplications: A Review. Micromachines 2020, 11, 921. [Google Scholar] [CrossRef] [PubMed]
  44. Destgeer, G.; Lee, K.H.; Jung, J.H.; Alazzam, A.; Sung, H.J. Continuous Separation of Particles in a PDMS Microfluidic Channel via Travelling Surface Acoustic Waves (TSAW). Lab Chip 2013, 13, 4210–4216. [Google Scholar] [CrossRef] [PubMed]
  45. Zhao, S.; Wu, M.; Yang, S.; Wu, Y.; Gu, Y.; Chen, C.; Ye, J.; Xie, Z.; Tian, Z.; Bachman, H. A Disposable Acoustofluidic Chip for Nano/Microparticle Separation Using Unidirectional Acoustic Transducers. Lab Chip 2020, 20, 1298–1308. [Google Scholar] [CrossRef]
  46. Devendran, C.; Gunasekara, N.R.; Collins, D.J.; Neild, A. Batch Process Particle Separation Using Surface Acoustic Waves (SAW): Integration of Travelling and Standing SAW. RSC Adv. 2016, 6, 5856–5864. [Google Scholar] [CrossRef]
  47. Ma, Z.; Collins, D.J.; Ai, Y. Detachable Acoustofluidic System for Particle Separation via a Traveling Surface Acoustic Wave. Anal. Chem. 2016, 88, 5316–5323. [Google Scholar] [CrossRef] [PubMed]
  48. Ma, Z.; Collins, D.J.; Guo, J.; Ai, Y. Mechanical Properties Based Particle Separation via Traveling Surface Acoustic Wave. Anal. Chem. 2016, 88, 11844–11851. [Google Scholar] [CrossRef] [PubMed]
  49. Ding, X.; Li, P.; Lin, S.-C.S.; Stratton, Z.S.; Nama, N.; Guo, F.; Slotcavage, D.; Mao, X.; Shi, J.; Costanzo, F. Surface Acoustic Wave Microfluidics. Lab Chip 2013, 13, 3626–3649. [Google Scholar] [CrossRef]
  50. Destgeer, G.; Ha, B.H.; Jung, J.H.; Sung, H.J. Submicron Separation of Microspheres via Travelling Surface Acoustic Waves. Lab Chip 2014, 14, 4665–4672. [Google Scholar] [CrossRef]
  51. Fakhfouri, A.; Devendran, C.; Ahmed, A.; Soria, J.; Neild, A. The Size Dependant Behaviour of Particles Driven by a Travelling Surface Acoustic Wave (TSAW). Lab Chip 2018, 18, 3926–3938. [Google Scholar] [CrossRef] [PubMed]
  52. Weng, H.; Duan, F.L.; Xie, Z.; Liu, S.; Ji, Z.; Zhang, Y. LiNbO 3-Based SAW Sensors Capable to Measure up to 1100° C High Temperature. IEEE Sens. J. 2020, 20, 12679–12683. [Google Scholar] [CrossRef]
  53. Duan, F.L.; Xie, Z.; Ji, Z. Breakthrough of Upper Limit of Temperature Measurement of SAW Sensors for Wireless Passive Sensing inside Propulsion System. In Proceedings of the AIAA Propulsion and Energy 2020 Forum, Online, 24–28 August 2020; p. 3512. [Google Scholar]
  54. Freudenberg, J.; Von Schickfus, M.; Hunklinger, S. A SAW Immunosensor for Operation in Liquid Using a SiO2 Protective Layer. Sens. Actuators B Chem. 2001, 76, 147–151. [Google Scholar] [CrossRef]
  55. Xia, Y.; Whitesides, G.M. Soft Lithography. Annu. Rev. Mater. Sci. 1998, 28, 153–184. [Google Scholar] [CrossRef]
  56. Amin, R.; Knowlton, S.; Hart, A.; Yenilmez, B.; Ghaderinezhad, F.; Katebifar, S.; Messina, M.; Khademhosseini, A.; Tasoglu, S. 3D-Printed Microfluidic Devices. Biofabrication 2016, 8, 22001. [Google Scholar] [CrossRef] [PubMed]
  57. Bourquin, Y.; Reboud, J.; Wilson, R.; Cooper, J.M. Tuneable Surface Acoustic Waves for Fluid and Particle Manipulations on Disposable Chips. Lab Chip 2010, 10, 1898–1901. [Google Scholar] [CrossRef] [PubMed]
  58. Reboud, J.; Bourquin, Y.; Wilson, R.; Pall, G.S.; Jiwaji, M.; Pitt, A.R.; Graham, A.; Waters, A.P.; Cooper, J.M. Shaping Acoustic Fields as a Toolset for Microfluidic Manipulations in Diagnostic Technologies. Proc. Natl. Acad. Sci. USA 2012, 109, 15162–15167. [Google Scholar] [CrossRef] [PubMed]
  59. Xu, X.; Wang, R.K.; Elder, J.B.; Tuchin, V. V Effect of Dextran-Induced Changes in Refractive Index and Aggregation on Optical Properties of Whole Blood. Phys. Med. Biol. 2003, 48, 1205. [Google Scholar] [CrossRef] [PubMed]
  60. Qian, J.; Begum, H.; Lee, J.E.-Y. Acoustofluidic Localization of Sparse Particles on a Piezoelectric Resonant Sensor for Nanogram-Scale Mass Measurements. Microsyst. Nanoeng. 2021, 7, 61. [Google Scholar] [CrossRef]
  61. Wang, K.; Zhou, W.; Lin, Z.; Cai, F.; Li, F.; Wu, J.; Meng, L.; Niu, L.; Zheng, H. Sorting of Tumour Cells in a Microfluidic Device by Multi-Stage Surface Acoustic Waves. Sens. Actuators B Chem. 2018, 258, 1174–1183. [Google Scholar] [CrossRef]
  62. Hasegawa, T.; Yosioka, K. Acoustic-radiation Force on a Solid Elastic Sphere. J. Acoust. Soc. Am. 1969, 46, 1139–1143. [Google Scholar] [CrossRef]
  63. Sinha, M.; Buckley, D.J. Acoustic Properties of Polymers. In Physical Properties of Polymers Handbook; Springer: Berlin/Heidelberg, Germany, 2007; pp. 1021–1031. [Google Scholar]
  64. Carvalho, M.R.; Barata, D.; Teixeira, L.M.; Giselbrecht, S.; Reis, R.L.; Oliveira, J.M.; Truckenmüller, R.; Habibovic, P. Colorectal Tumor-on-a-Chip System: A 3D Tool for Precision Onco-Nanomedicine. Sci. Adv. 2019, 5, eaaw1317. [Google Scholar] [CrossRef] [PubMed]
  65. Cushing, K.W.; Garofalo, F.; Magnusson, C.; Ekblad, L.; Bruus, H.; Laurell, T. Ultrasound Characterization of Microbead and Cell Suspensions by Speed of Sound Measurements of Neutrally Buoyant Samples. Anal. Chem. 2017, 89, 8917–8923. [Google Scholar] [CrossRef] [PubMed]
  66. Sun, C.; Pye, S.D.; Browne, J.E.; Janeczko, A.; Ellis, B.; Butler, M.B.; Sboros, V.; Thomson, A.J.W.; Brewin, M.P.; Earnshaw, C.H. The Speed of Sound and Attenuation of an IEC Agar-Based Tissue-Mimicking Material for High Frequency Ultrasound Applications. Ultrasound Med. Biol. 2012, 38, 1262–1270. [Google Scholar] [CrossRef] [PubMed]
  67. Fung, Y.-C.; Fung, Y.-C. Bioviscoelastic Solids. In Biomechanics: Mechanical Properties of Living Tissues; Springer Science & Business Media: Berlin, Germany, 1993; pp. 242–320. [Google Scholar]
  68. King, L.V. On the Acoustic Radiation Pressure on Spheres. Proc. R. Soc. Lond. Ser. A Math. Phys. Sci. 1934, 147, 212–240. [Google Scholar]
  69. Leung, E.; Lee, C.P.; Jacobi, N.; Wang, T.G. Resonance Frequency Shift of an Acoustic Chamber Containing a Rigid Sphere. J. Acoust. Soc. Am. 1982, 72, 615–620. [Google Scholar] [CrossRef]
  70. Chanaud, R.C. Effects of Geometry on the Resonance Frequency of Helmholtz Resonators. J. Sound. Vib. 1994, 178, 337–348. [Google Scholar] [CrossRef]
Figure 1. The microfluidic device used for blood microplastic separation. (a) Schematic of the separation mechanism: Once the IDTs are actuated by electrical signals, the TSAW is established on the substrate surface, displacing particles according to their physical properties (e.g., size, compressibility). Separation is achieved if the microplastic particles have a higher ARF than blood cells at the same operational frequency, resulting in larger displacements of the microplastic particles. (b) Cross-sectional view of the separation process: The TSAW generates a pressure gradient that displaces the microplastics toward the separation region. Due to the Rayleigh angle, there is a dead pressure zone that traps particles and hinders their separation. This region is avoided with the use of Sheath Flow I. (c) Photo of the actual device: the scale bar represents 5 mm.
Microplastics 03 00028 g001
Figure 3. Comparison between theoretical prediction of ARF and experimental particle velocity. (a) Comparison between theoretical ARF and particle velocity for 5 µm polystyrene particles. (b) Comparison between theoretical ARF and particle velocity for 10 µm PS particles. (c) Displacement of 5 µm PS particles at 95 MHz. The scale bar represents 100 µm. (d) Displacement of 5 µm PS particles at 125 MHz. The larger ARF values at 125 MHz induce greater displacements of the particles compared to 95 MHz. The white arrow indicates the direction of the TSAW. The scale bar represents 100 µm. (e) Theoretical ARF for red and white blood cells. Blood cells were experimentally tested at the resonant frequencies of microplastics, such as 125 MHz, where no significant displacement was observed.
Microplastics 03 00028 g003
Figure 4. Separation of 5 and 10 µm PS microplastics from blood samples at the frequency of 128 MHz. (a) Effect of flow rate on separation efficiency, with power fixed at 50%. (b) Effect of power on separation efficiency, with flow rate fixed at 5 µL/min. (c) Separation at 128 MHz and 10 µL/min. The separation efficiency did not exceed 60%. The image shows a 5 µm PS particle (circled in blue) deflected toward the incorrect outlet, a 10 µm particle (circled in red) deflected toward the correct microplastics outlet, and blood cells (circled in green). Scale bar is 100 µm. (d) Separation at 128 MHz and 1 µL/min. Reducing the flow rate significantly increased the separation efficiency, achieving values close to 100%. The image shows both 5 and 10 µm PS particles (circled in red) displaced toward the microplastic collection outlet and blood cells (circled in green). Scale bar is 100 µm. Supplementary Information contains videos demonstrating the separation process.
Microplastics 03 00028 g004
Table 1. Material properties used to calculate the theoretical ARF [63].
AcronymPoly-Density (kg/m3) c l (m/s) c s (m/s)
ABSAcrylonitrile-butadiene-styrene10412160930
EpoxyDGEBA/PDA118428901290
NylonHexamethylene adipamide114727101120
PCCarbonate11942220909
PEEthylene9572430950
PMMAMethyl methacrylate119126901340
PPPropylene91326501300
PSStyrene105224001150
PVCVinyl chloride138623301070
Teflon®Tetrafluoroethylene21801410730
Disclaimer/Publisher’s Note: The statements, opinions and data contained in all publications are solely those of the individual author(s) and contributor(s) and not of MDPI and/or the editor(s). MDPI and/or the editor(s) disclaim responsibility for any injury to people or property resulting from any ideas, methods, instructions or products referred to in the content.

