Article

Seasonal and Distributional Changes in the Composition and Flux of Anthropogenic Microparticles in the Surface Waters of the Charles River, Massachusetts, United States

1
School for the Environment, University of Massachusetts Boston, Boston, MA 02125, USA
2
Independent Researcher, Boston, MA 02125, USA
*
Author to whom correspondence should be addressed.
Microplastics 2024, 3(4), 539-558; https://doi.org/10.3390/microplastics3040034
Submission received: 26 July 2024 / Revised: 28 August 2024 / Accepted: 14 September 2024 / Published: 30 September 2024

Abstract

:
Plastic is a growing global environmental problem. While much of the focus of anthropogenic microparticles has focused on microplastics and their occurrence in marine systems, anthropogenic microparticles are found in freshwater systems. The Charles River is a highly impacted and historically important river within Massachusetts and runs for 80 miles within the state of MA through a variety of land uses. Microparticle concentrations were found to vary along the length of the river and ranged in concentrations from 1–19 pieces/L, with generally higher concentrations downstream. Microfibers were the dominant (72%) type of microparticles found, and the majority (avg 76%) of microparticles were synthetic. The highest estimated flux of microparticles occurred in May, with an estimated flux of 2 billion microparticles per day via the Charles River into the Boston Harbor. The average annual concentration of microparticles was correlated with land use, with higher concentrations occurring in regions with higher impervious coverage and in areas designated as industrial or high-density residential. Polyester, polypropylene, and polyamides were the dominant plastic polymers. However, seasonal changes in the relative importance of each polymer, along with changes in the abundance and flux rates, indicate that there would be seasonal variability in the type of microparticles exported. Changes in composition occurred between stations and between the head and mouth of the river, suggesting particle retention due to either deposition, degradation, or biological consumption.

Graphical Abstract

1. Introduction

Microplastics, plastics that are <5 mm, are a dominant source of pollution in all types of waterways [1]. While most research on microplastics is focused on their presence and impact in marine environments, they are present in freshwater bodies such as lakes, ponds, streams, rivers, and sediments [2,3,4]. Differences in the physical characteristics of water bodies, e.g., water density, stratification, etc., can affect the behaviors and impacts of microplastics in aquatic systems [5,6,7]. Additionally, turbulent currents in streams and rivers can advance the mechanical breakdown of larger plastics into many microparticles and affect their deposition. Vertical mixing, seasonal turnover of water, and quiescent versus turbulent flow vary between the types of rivers, ponds, and lakes. These differences in the physical vertical structure of the water column, along with the geomorphology of the river, can affect the retention, deposition, and transport of particles [8,9]. River flow can transport plastics from input sources upstream and export them to another body of water [8], providing an important avenue for particle transport.
Globally, the estimates of riverine input into the oceans range from 0.5 to 2.41 million tons of plastic [10,11]. It is estimated that over 20–30 tons of plastic debris are exported into the North Sea and 120 tons into the Mediterranean Sea by rivers [12]. While these studies report on both macro- and micro-plastics present, they reveal that rivers can be an important avenue for plastic transport. Other studies suggest that much of the plastic debris within rivers is retained either by riparian vegetation, as well as in the river sediments or deposited near the mouth of a river [9,13]. Like oceans, rivers have been found to be dominated by microfibers [13,14,15,16], which include both natural, semisynthetic and synthetic fibers from textiles, ropes, cigarettes, tires, and sanitary products. Important sources of microplastics and microfibers to river systems include stormwater systems, wastewater treatment plants, combined sewer outfalls, and land use, along with the fragmentation of macro debris and inputs from aquatic industries and recreation (Figure 1). The abundance and distribution of microplastics in rivers can be related to land use, human population, and the natural and human built nature of the river [17,18,19,20]. Seasonal variations in the river discharge of plastics have been observed [21,22] and appear to be related to a combination of river vegetation, discharge rates, wind, precipitation, and land use. Currently, we do not understand all the variables that control and influence the concentration and flux of anthropogenic microparticles such as microplastics and microfibers in rivers [3,23].
Rivers are vital waterways, as they drain nearly 75% of the earth’s land surface; provide freshwater for irrigation, consumption, and transportation; are a source of energy; and provide critical habitats for many plants and animals. In 2011, over 50% of the world’s population lived within 3 km of a freshwater body [24], and historically, rivers have played an important role in human settlement, as well as in development and cultures [25,26]. Rivers are an important aspect of the landscape in the northeastern portion of the United States, and within Massachusetts, there are hundreds of rivers and streams that discharge into the Atlantic Ocean. The Charles River is the fourth longest river in Massachusetts and the largest river flowing into the Boston Harbor. It flows 80 miles through 58 cities and towns and through a variety of landscapes before flowing directly between Boston and Cambridge, MA and emptying into Boston Harbor. The Charles River watershed covers 308 square miles, transitioning from a more rural and wetland-spotted environment in the upper watershed to a more developed and urban lower watershed. There are 19 dams along the length of the Charles River that impact and regulate the flow of water. The river supports an ecosystem of freshwater fish, birds, and native plants. It is used heavily for recreation by its adjacent residents for swimming, fishing, rowing, and sailing in permitted areas. Due to its size and the variety of landscapes, e.g., marshes, small towns, and cities, examining the abundance of microplastics along the length of the Charles River allows us to examine how land use may affect microplastic abundance in what is ultimately a major urban river. The objectives of this study were the following:
  • Determine the concentration and composition of anthropogenic microparticles (microplastics and microfibers) in the Charles River;
  • Determine if the concentration or composition of the anthropogenic microparticles varied along the length of the river and between different sampling times, as well as if the variations were correlated to adjacent land use and impervious cover;
  • Estimate the export flux of anthropogenic microparticles into the Boston Harbor via the Charles River.

2. Materials and Methods

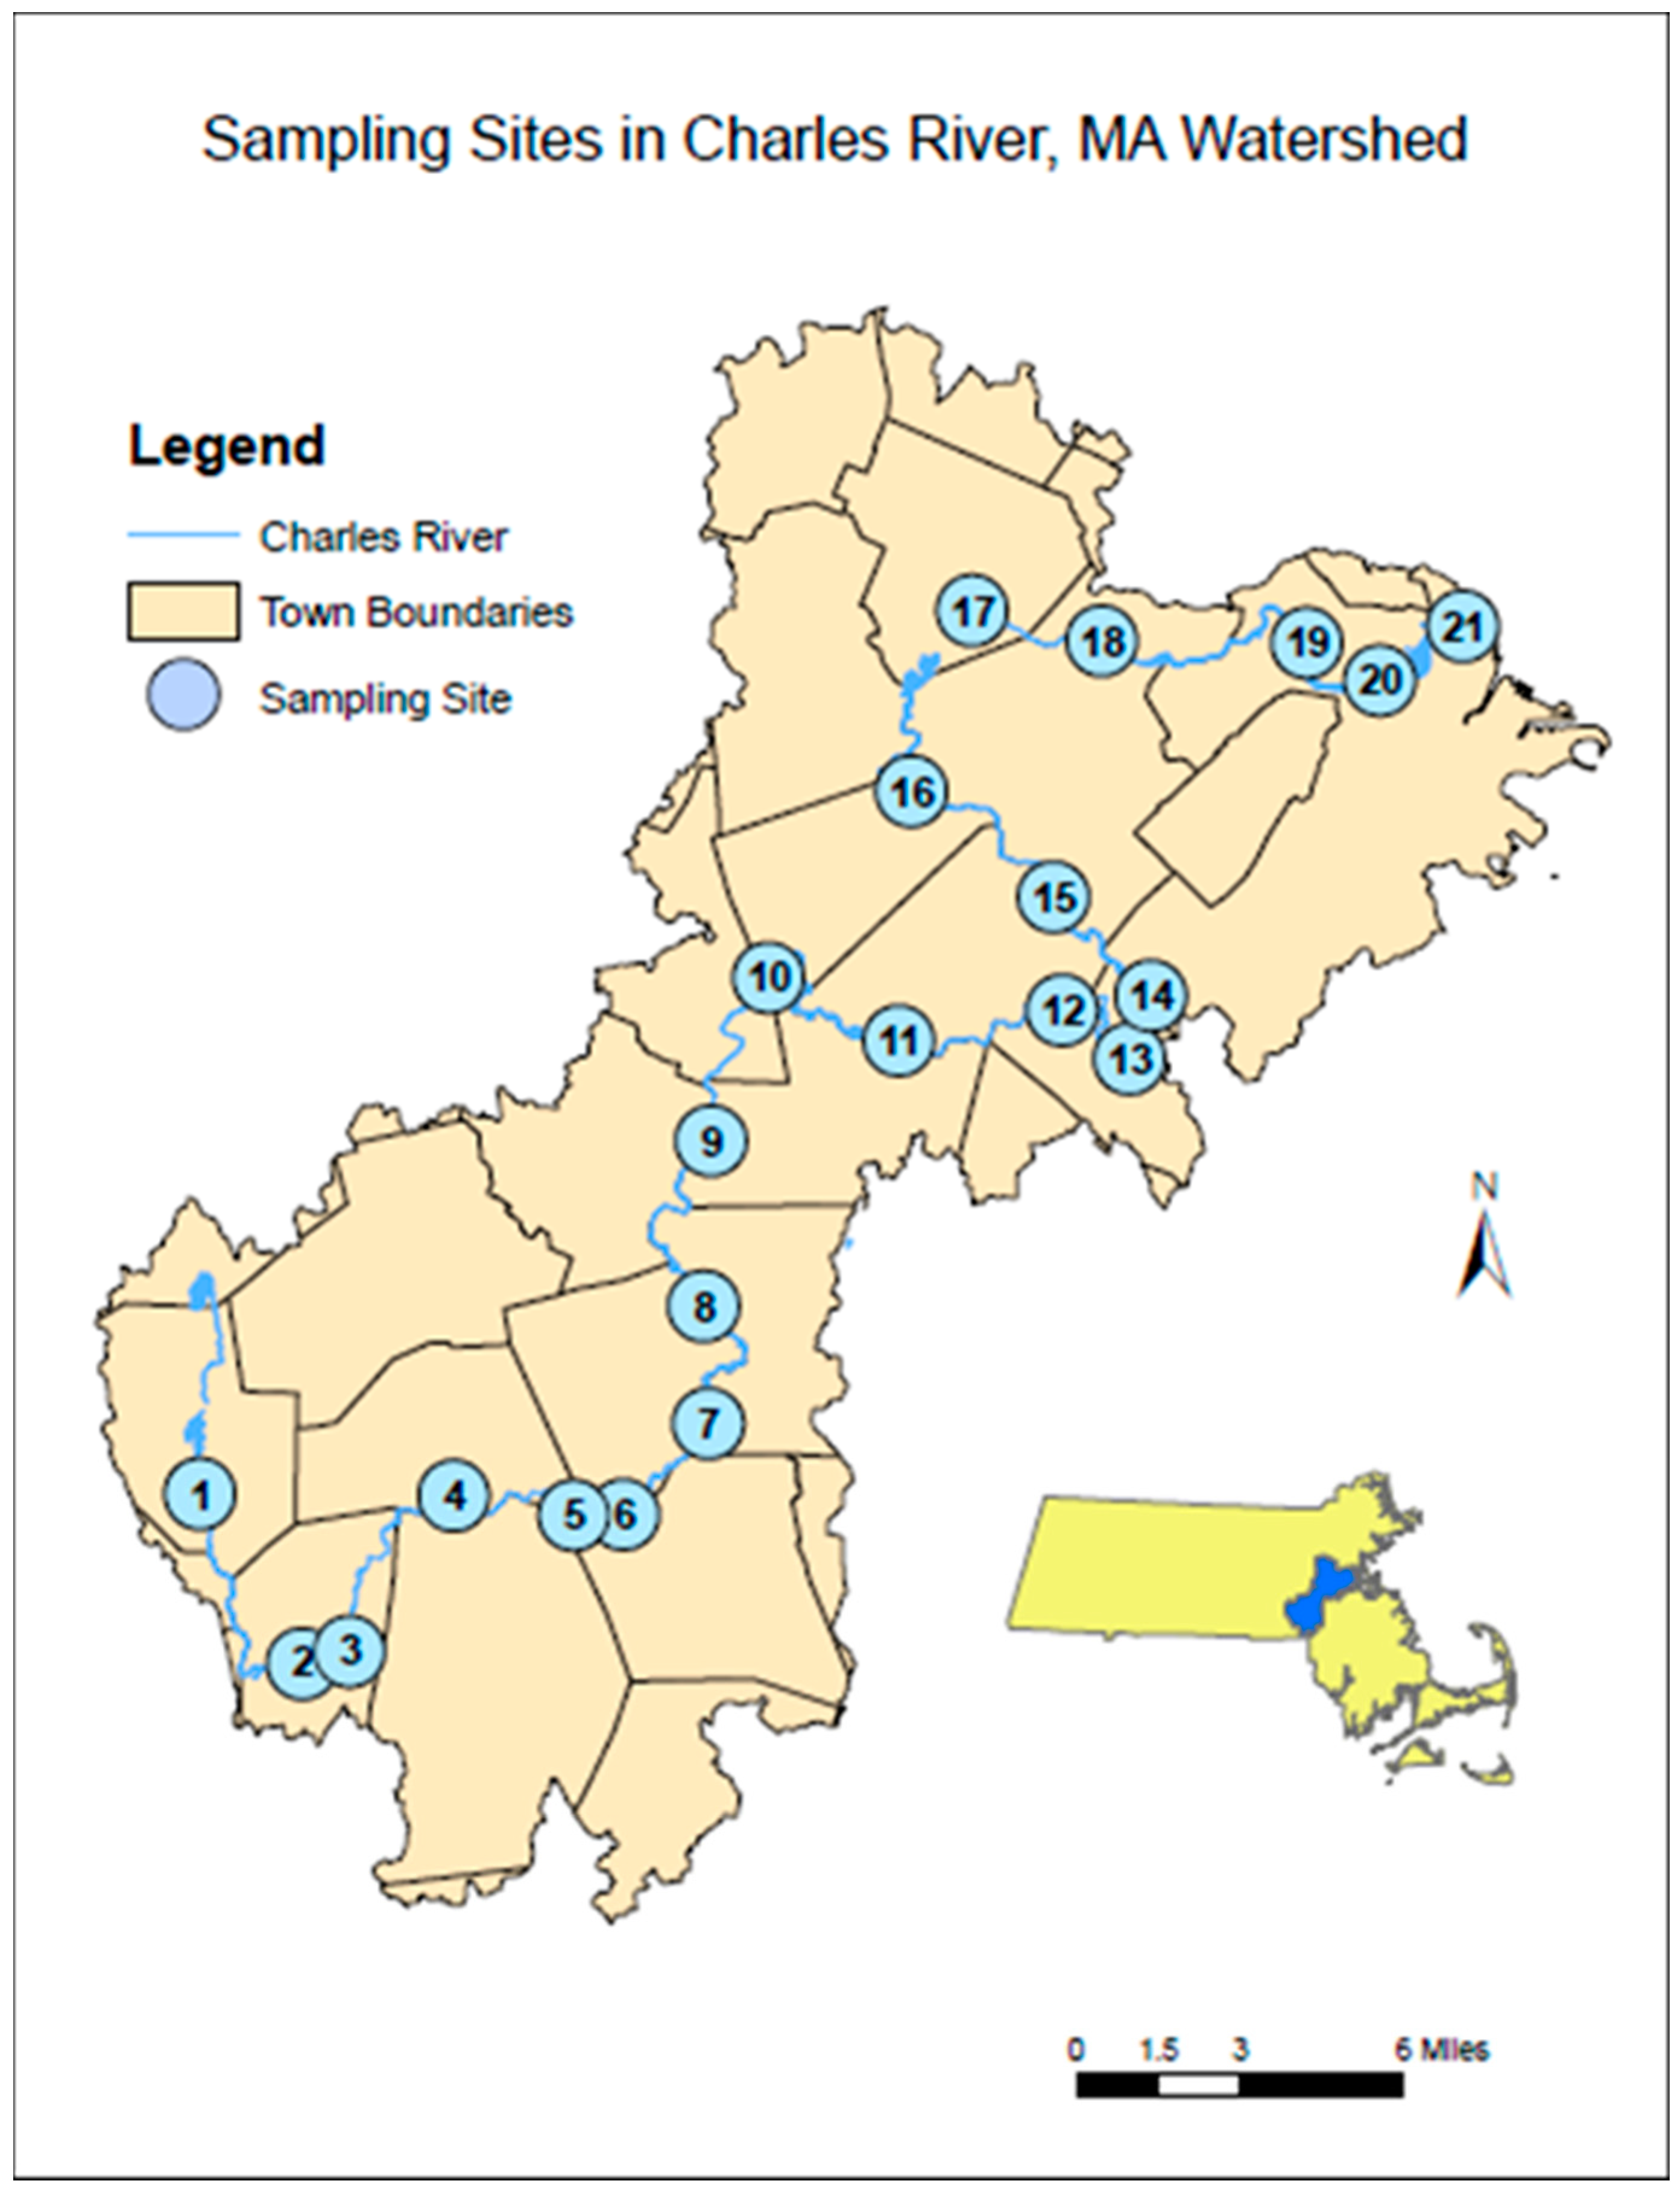
2.1. Charles River Sampling

Surface water samples for anthropogenic microparticles were collected from 21 sites using the water grab method [27] using a triple-rinsed metal bucket with neon green polypropylene rope. The rope was held out from the bridge to avoid any friction and to reduce input of fibers from the rope. The sample was poured into a triple-rinsed, 10 L carboy for storage until processing. Water depth and temperature measurements were taken at every sampling site for analysis (Appendix A). Sampling sites started at 3.1 miles downstream of the Charles River’s headwaters in Milford, MA, USA, and subsequent sites were less than 6 miles apart along the 80 miles of the Charles River at a total of 21 sampling sites (Figure 2). All but two sites were accessible by bridges that permitted sampling over the middle of the river; Site 20 was sampled at the edged due to the extreme height of the adjacent bridge; and Site 5 was sampled by wading into Populatic Pond to a depth of 1 m. Surface samples were taken from the middle of each bridge site on the upstream side except for Sites 2, 13, and 16—where access was blocked to sample over the upstream side of the bridge. Sites were sampled in a single day, from approximately 7:30 a.m. to 5:30 p.m., on 28 January 2019, 1 May 2019, 5 August 2019, and 25 October 2019. Collection began furthest downstream at the New Charles River Dam (Site 21) near downtown Boston, MA USA and ended at the Central Street (Site 1) in Milford, MA, USA. Immediately after collecting all samples, they were returned to the University of Massachusetts Boston and stored in a temperature-controlled room at 12 °C until processed, which occurred within 5 days.

2.2. Processing

Samples were processed by subsampling each 10 L carboy into three well-mixed, 3 L samples that were filtered through a 20 μm nitex mesh, digested using 3% H2O2 [28] to remove excess organic material and any biofilms, rinsed with 10 μm filtered DI water, and backwashed into a combusted glass beaker to a volume of 10 mL. This 10 mL volume of concentrated debris from the 3 L sample was pipetted onto a clean glass microscope slide placed on a warming plate situated in a laminar flow hood. The dried slides were stored in sealed cardboard slide trays to prevent contamination by atmospheric deposition before µFTIR analysis.

2.3. Blanks

Blanks were created by rinsing filtration equipment with 100 mL of DI water, which was the volume used during pre-rinsing and processing of a sample onto a 20 μm mesh filter. The contents of the filter were rinsed into a beaker to 10 mL and pipetted onto a clean glass slide and counted microscopically. Blank values were subtracted from each sample slide created in one processing period. Also, while counting sample slides under a microscope, a clean glass slide was set on the stage of the apparatus to the side of the slide being counted. This clean slide was counted after the sample slide to find if any plastic particles had accumulated by atmospheric deposition, and this number was subtracted from the sample slide. Additionally, any neon green fibers were not recorded, as they may have come from the rope used during sampling. Two sites along the river were sampled at the edge or by wading into a pond. To ensure that Site 20 (sampled at the edge) could be included in the analysis, a cross-section sample analysis was conducted just upstream of this location. Surface water samples were collected across the width of the Charles River at Site 19 to test for microplastic variability across the width of the river. Results showed that variation in microplastic concentrations across the width of the river was not significant, allowing for the data from Site 20 to be included in the analysis.

2.4. Verification

Initial verification of microplastics occurred using the hot needle test [29] when examining the samples under a microscope. The microscope was fitted with an adjustable polarized lens to aid in identifying plastics by their reflective properties under polarized light [30]. An Attenuated Total Reflectance Fourier Transform Infrared Spectroscopy (ATR-FTIR) microscope (Smiths IlluminatIR, Danbury, CT, USA coupled to an Olympus microscope) was used to determine composition of the microparticles. The ATR-FTIR was set to 4 cm−1 resolution, Objective 36×-ATR, full spectral range 650–4000. FTIR spectra were obtained in transmission mode, and CO2 interference was removed for clarity. The spectra were read by an integrated software (Spectral ID version 3.03) and then were matched to commercial libraries, Sigma Aldrich and Thermo-Fisher Scientific, Waltham, MA, USA and/or processed using Open Specy [31]. Spectral matches with a confidence greater than 70 percent were considered as positively identified. A total of 1331 particles were positively identified with an average of 333 for each sampling period.

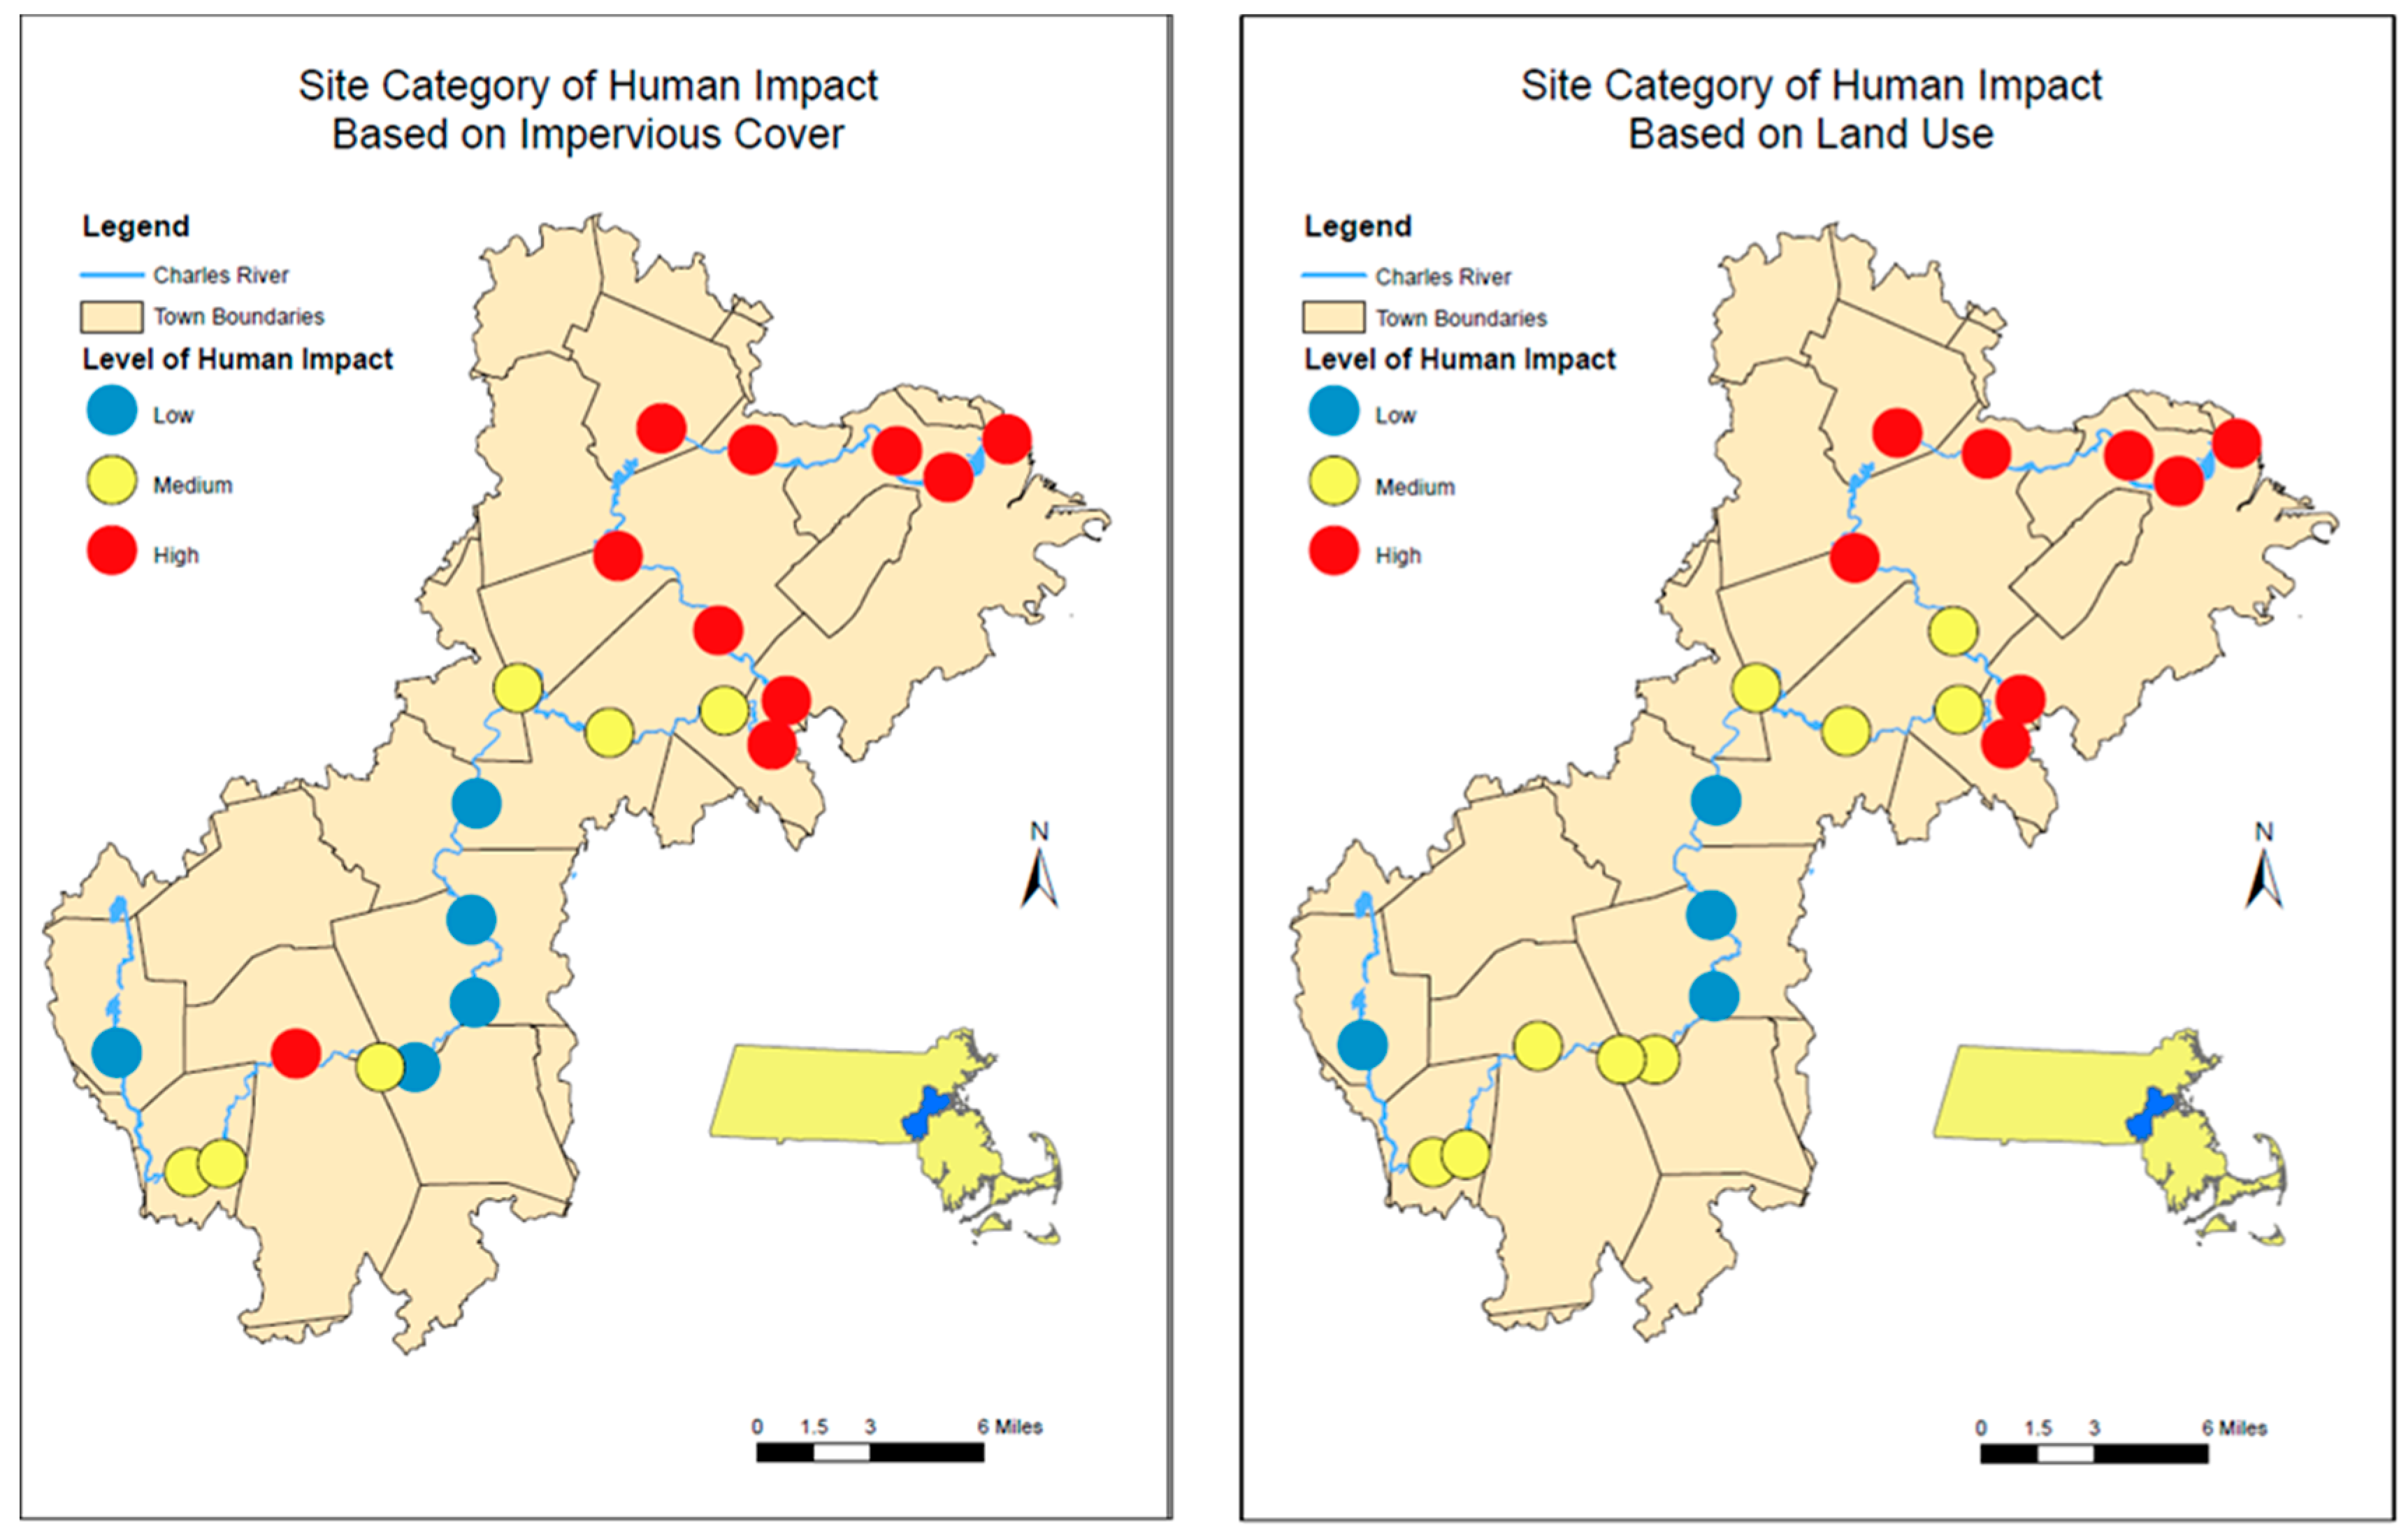
2.5. Impervious Cover and Land Use

Sampling sites were categorized in low, medium, or high human impact by two separate measures using MassGIS Data: impervious cover (IC) and adjacent land use (LU). ESRI ArcMap 10.7.1 was used to map the Charles River, its watershed, and the 21 sampling sites along the river. A 100 m buffer zone [32] from the edge of the river and associated water bodies was generated, which was then overlaid with data for IC and adjacent LU. This information (e.g., IC and LU) in the buffer zone between each site and the next upstream site was then designated into three categories of low, medium, and high human impact (Table 1). The IC data reflect the developed areas with impervious surface cover, with lower IC % suggesting low development and lower human impact versus higher IC % suggesting high development and higher human impact.
For adjacent land use within the buffer zone, the MassGIS LULC 2016 data were categorized in terms of Commercial; Industrial; Mixed Use, Other; Mixed Use, Primarily Residential; Open Land; Residential—Multi-Family; Residential—Single Family; Right-of-Way; Tax Exempt; and Unknown (Table 1). High human impact land use categories included Commercial; Industrial; Mixed Use, Other; and Mixed Use, Primarily Residential. Medium human impact land use categories included Residential Multi-Family; Residential Single Family; and Unknown. Low human impact land use categories included Open Land, Tax Exempt, and Right-of-Way. The percentage of land area used by each of these categories within the 100 m buffer zone designated to each site was calculated to determine which level of human impact held the highest percentage, as well as which level of low, medium, or high human impact could be attributed to its respective site. Figure 3 shows the distribution of sites based on low, medium, and high impact for both IC and LU.

2.6. Data Analysis

An analysis of variance test (ANOVA) was applied to both temporal and spatial variability to determine if there was a significant variability between sampling times and between sampling sites. Levine’s Test was performed to test the assumptions of normality for the low, medium, and high IC and LU categories, as there was an unequal number of sites for each category. Impervious coverage was then analyzed using an ANOVA in MATLAB, while the non-parametric Kruskal–Wallace Test was used for land use versus microplastic/fiber concentrations.

2.7. Estimation of Export Flux

An estimation of the flux of microplastics at each site along the river and export of microplastic particles to the Boston Harbor from the outlet of the Charles River at the New Charles River Dam was calculated using the method described by [14]. Flow data were collected from four USGS gages at Medway, Dover, Wellesley, and Waltham. Average flow rate data from USGS stream gages for each sampling day was converted from Fm (m3s−1) to FL (Ls−1). A proportional flow rate of depth for the top 18 cm of the water’s surface was calculated with the top proportion (Dp) equaling the top depth (Di), which is 18 cm divided by total depth (Dt).
Dp = Di/Dt
The proportional depth was multiplied by the flow rate (FL) to determine proportional flow (FLp). Then, the number of microfibers per liter found at a sampling site of interest (Mp) was multiplied by this proportional flow to approximate the number of microplastic particles traveling through that site during the time of collection (Nm).
Nm = FL × Mp
The range of potential discharge of microplastics in the Charles River into Boston Harbor was calculated from site data with the lowest concentration of microplastics, median concentration of microplastic found, and 3rd quartile concentration out of all sites.

3. Results

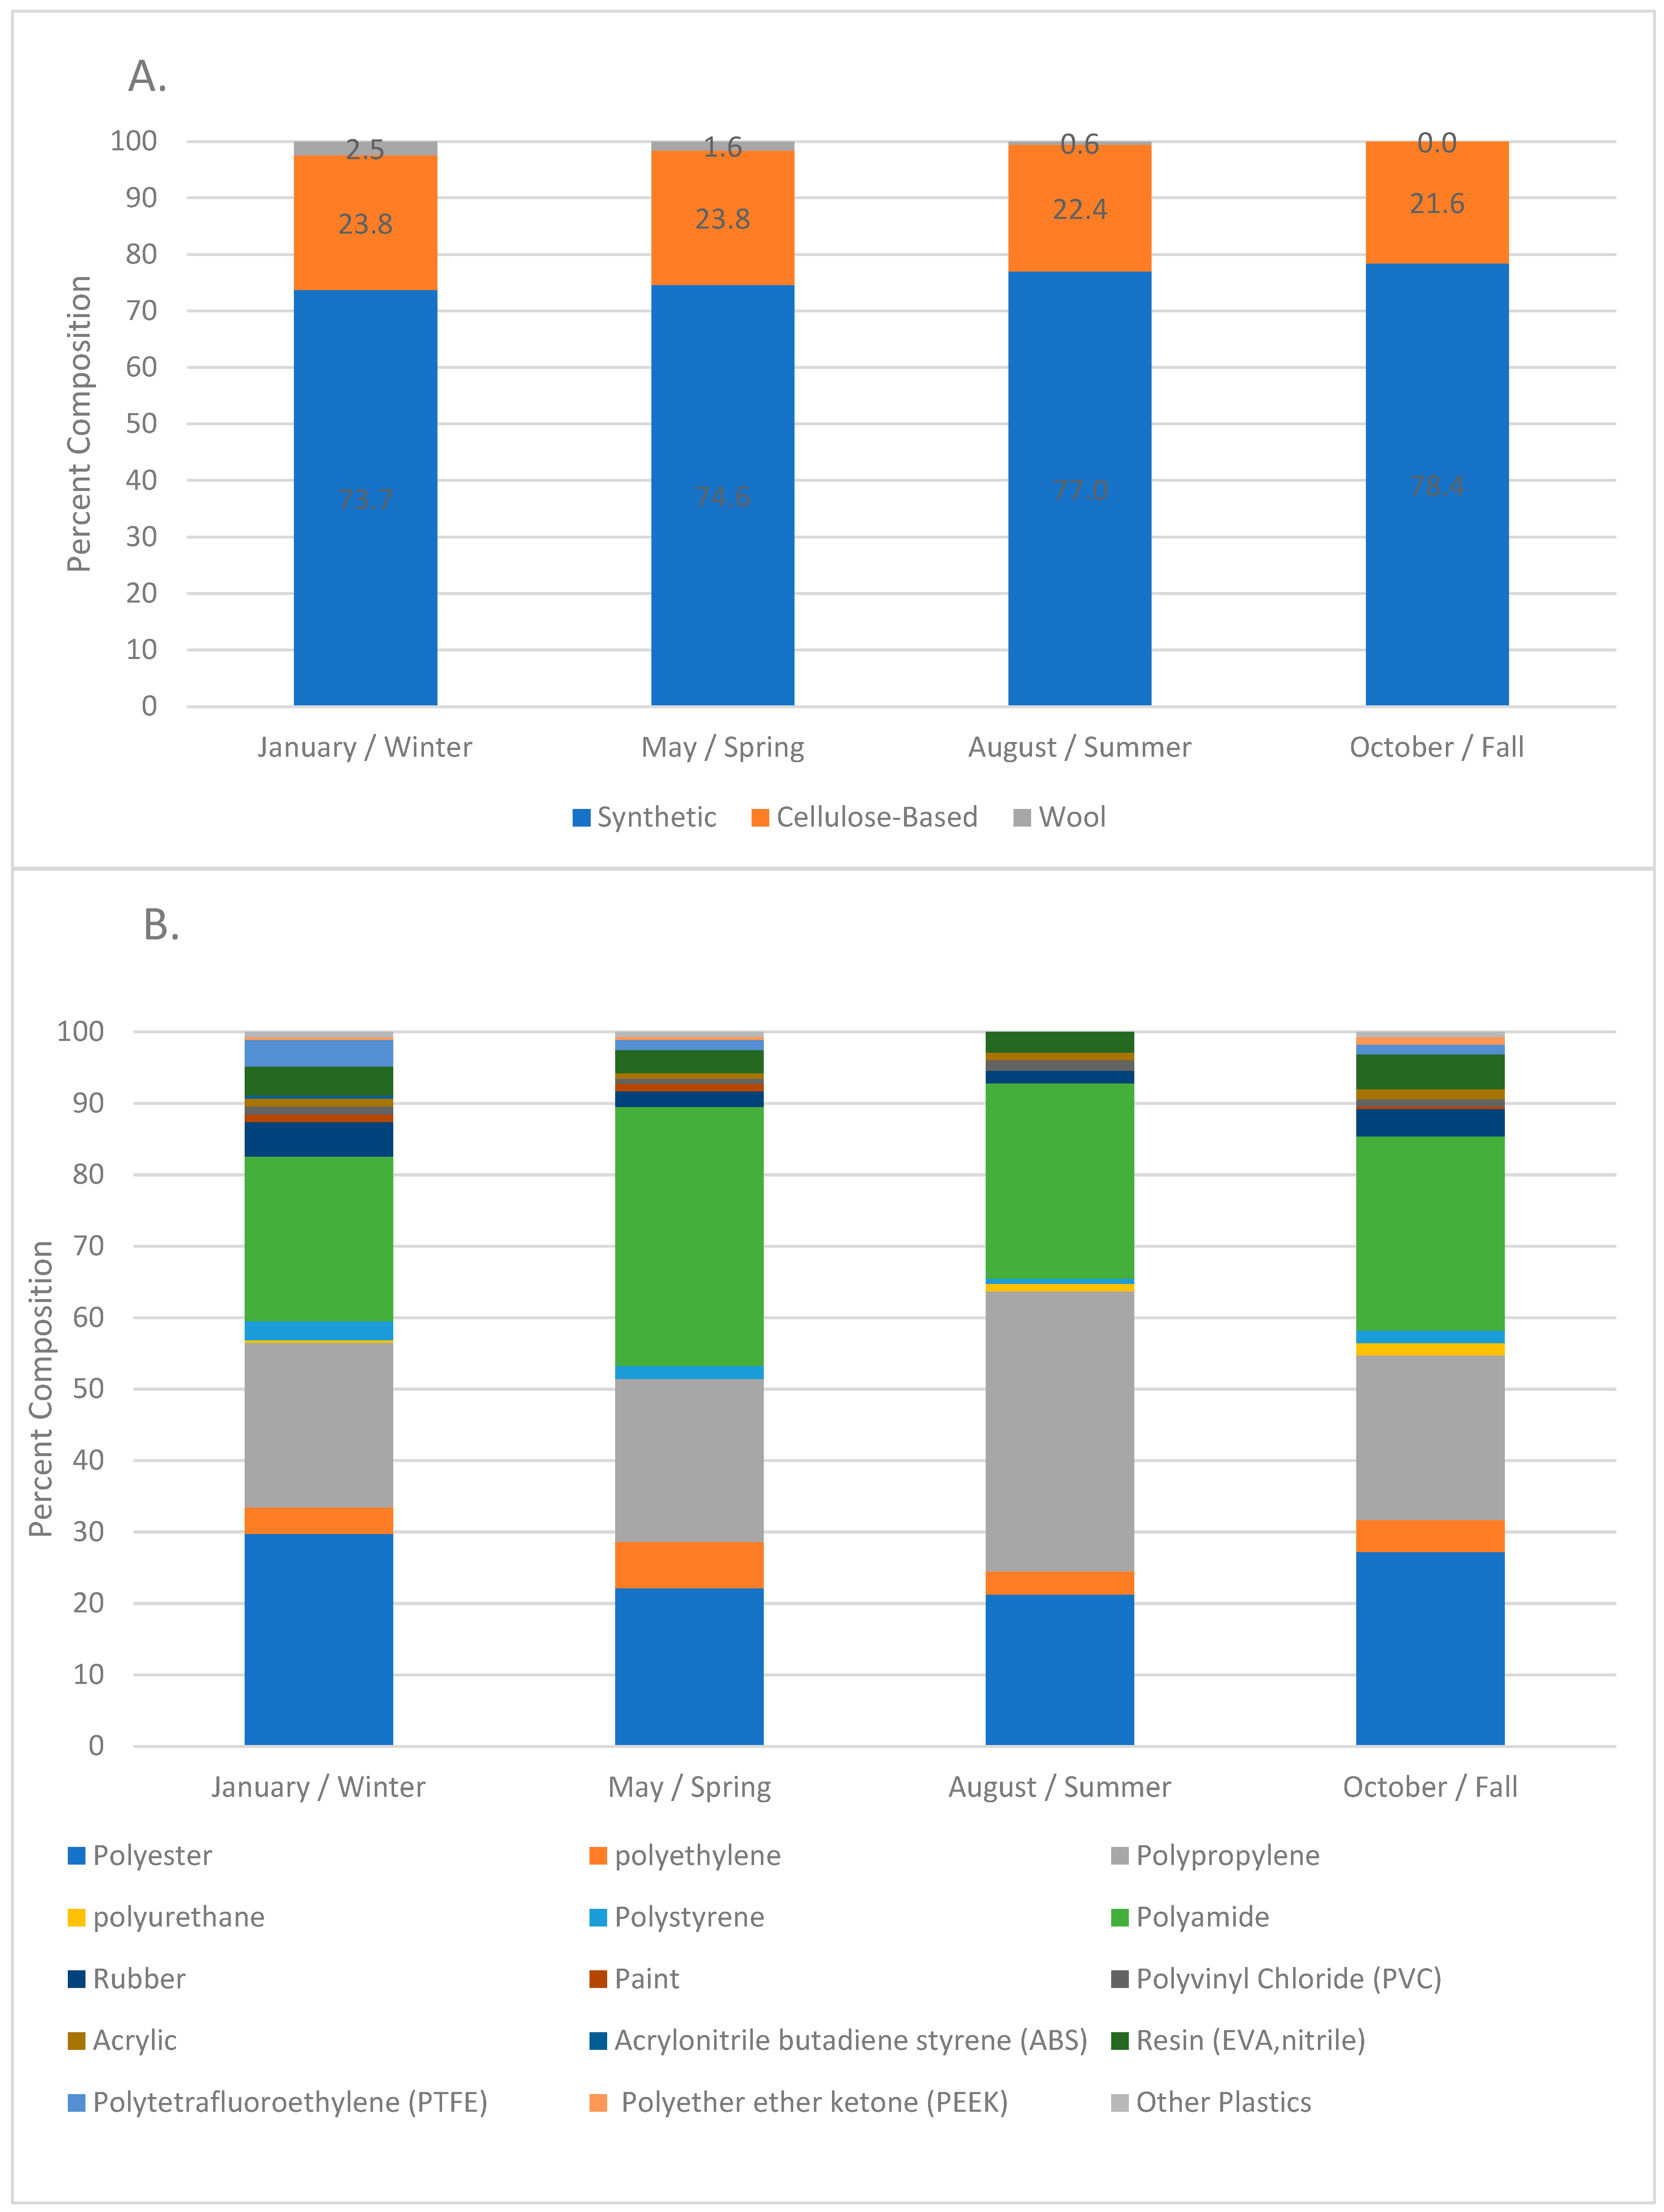
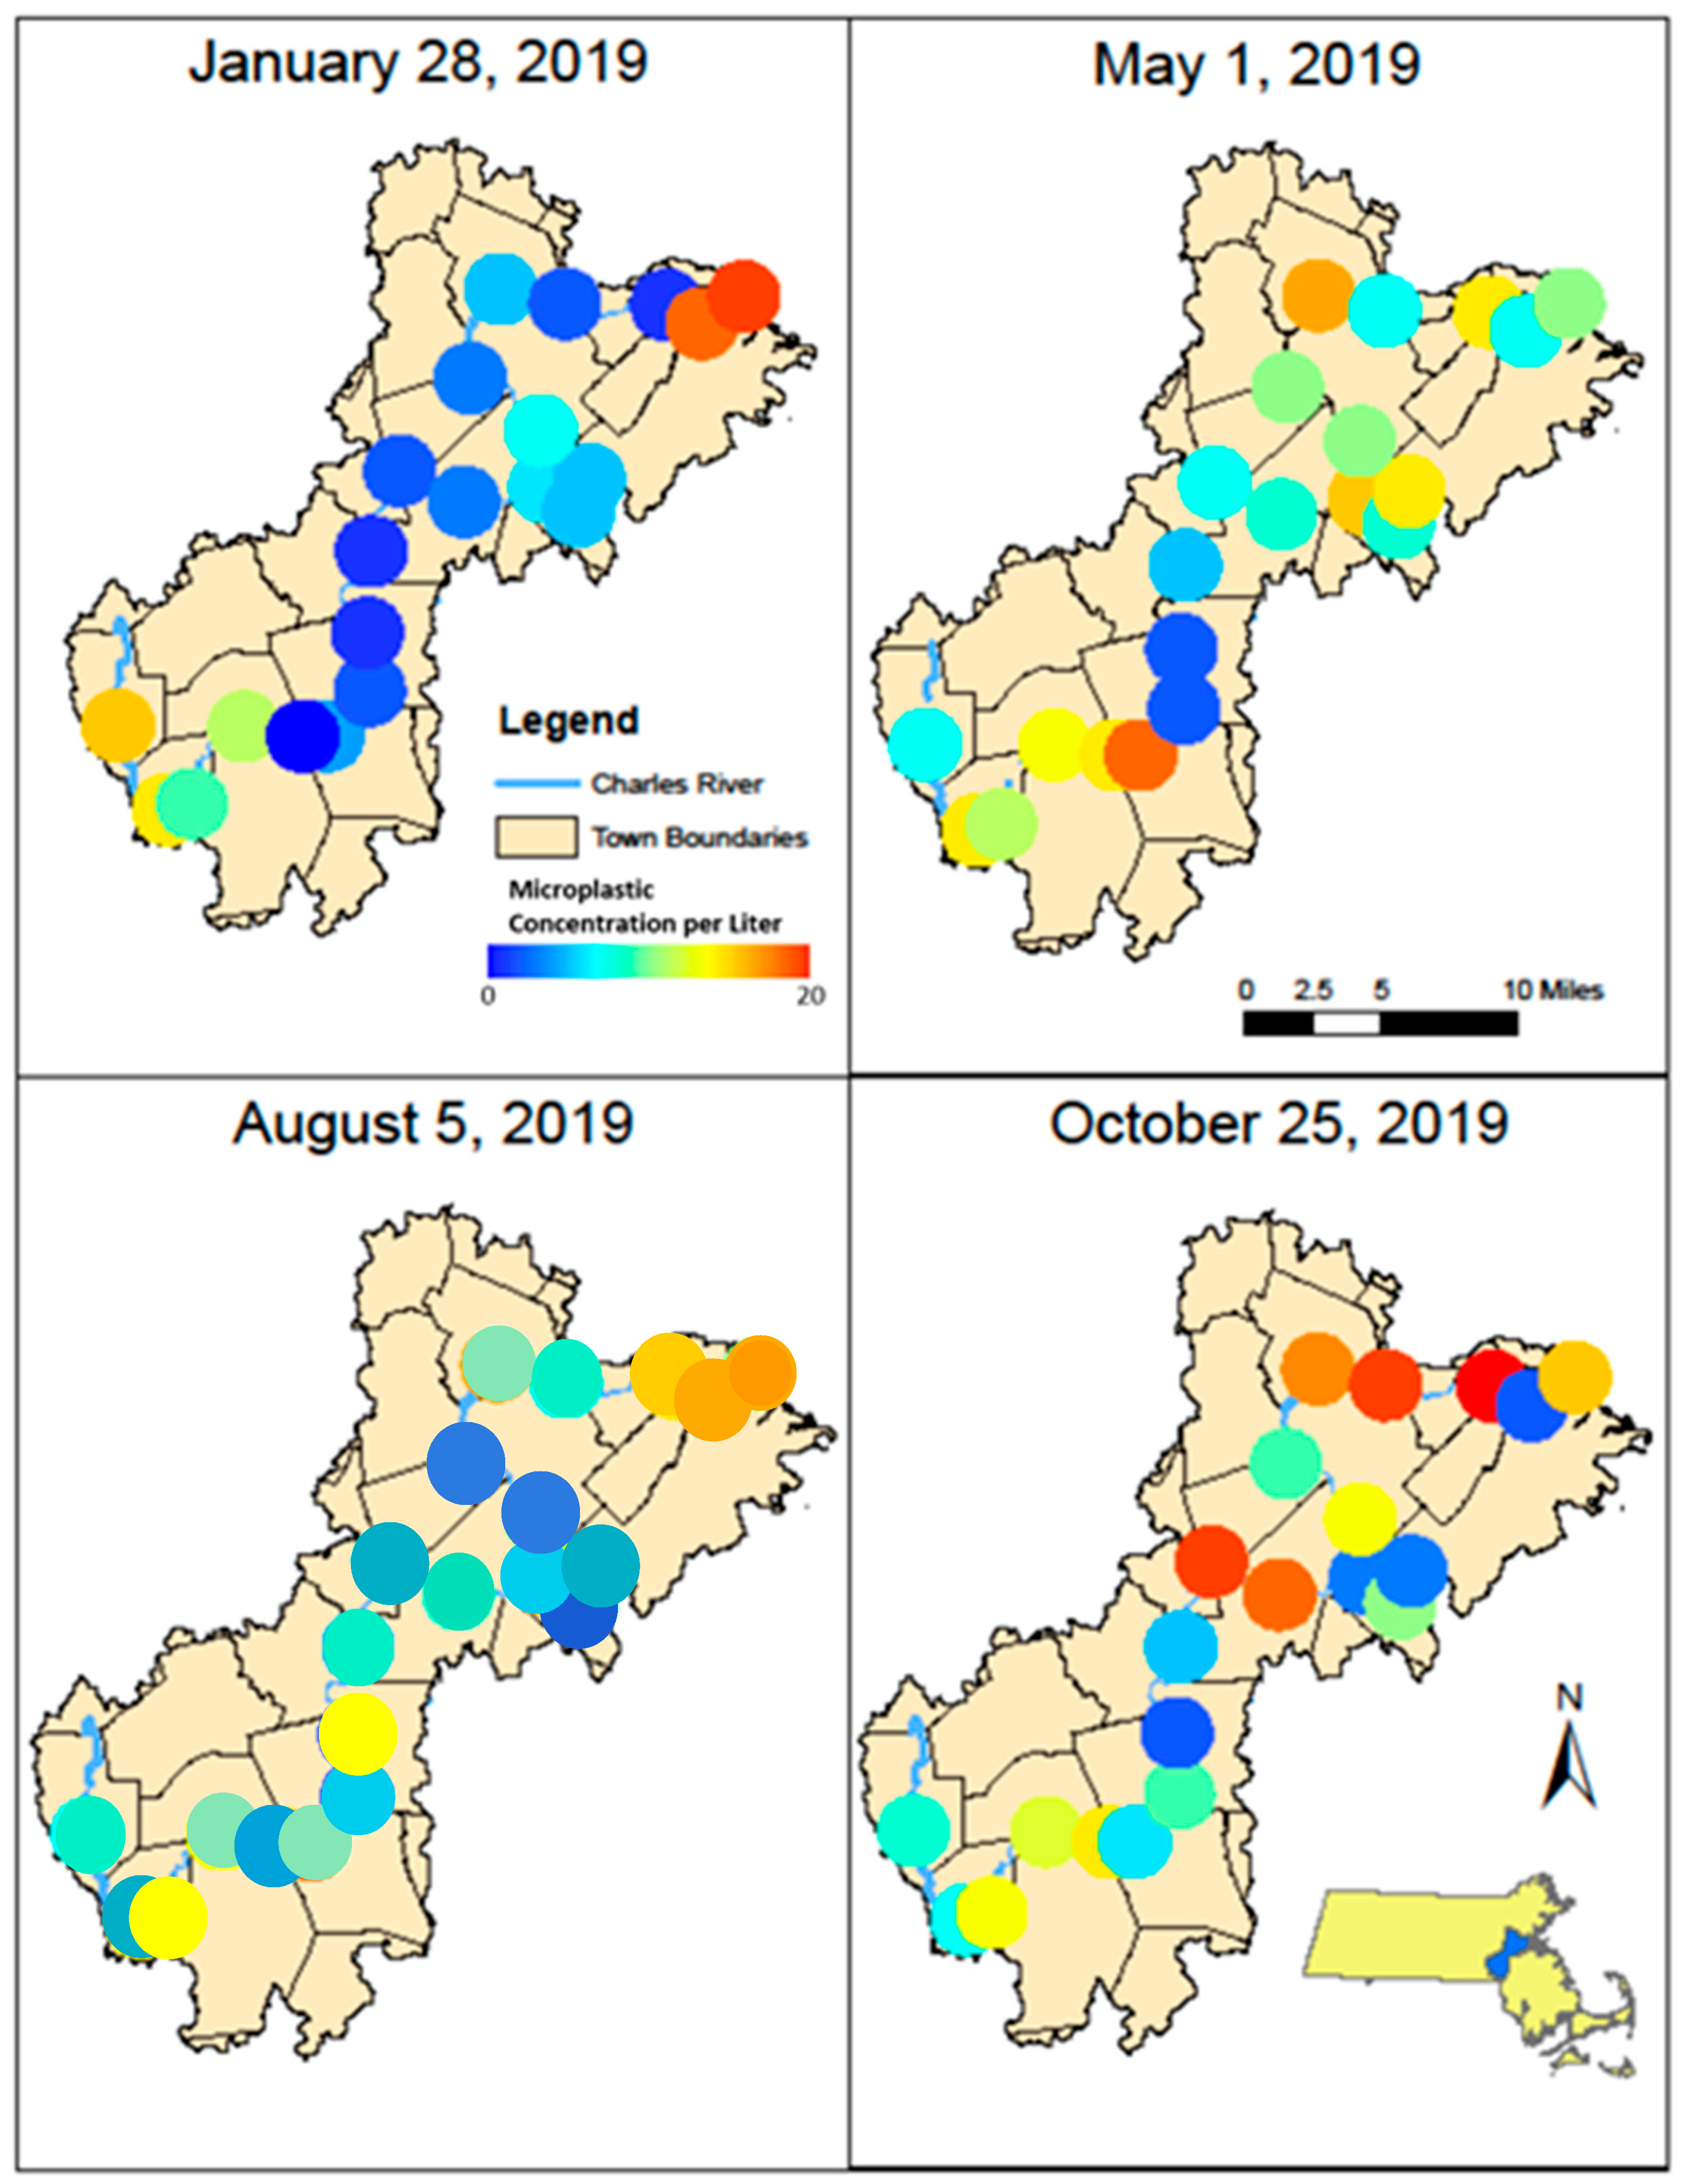
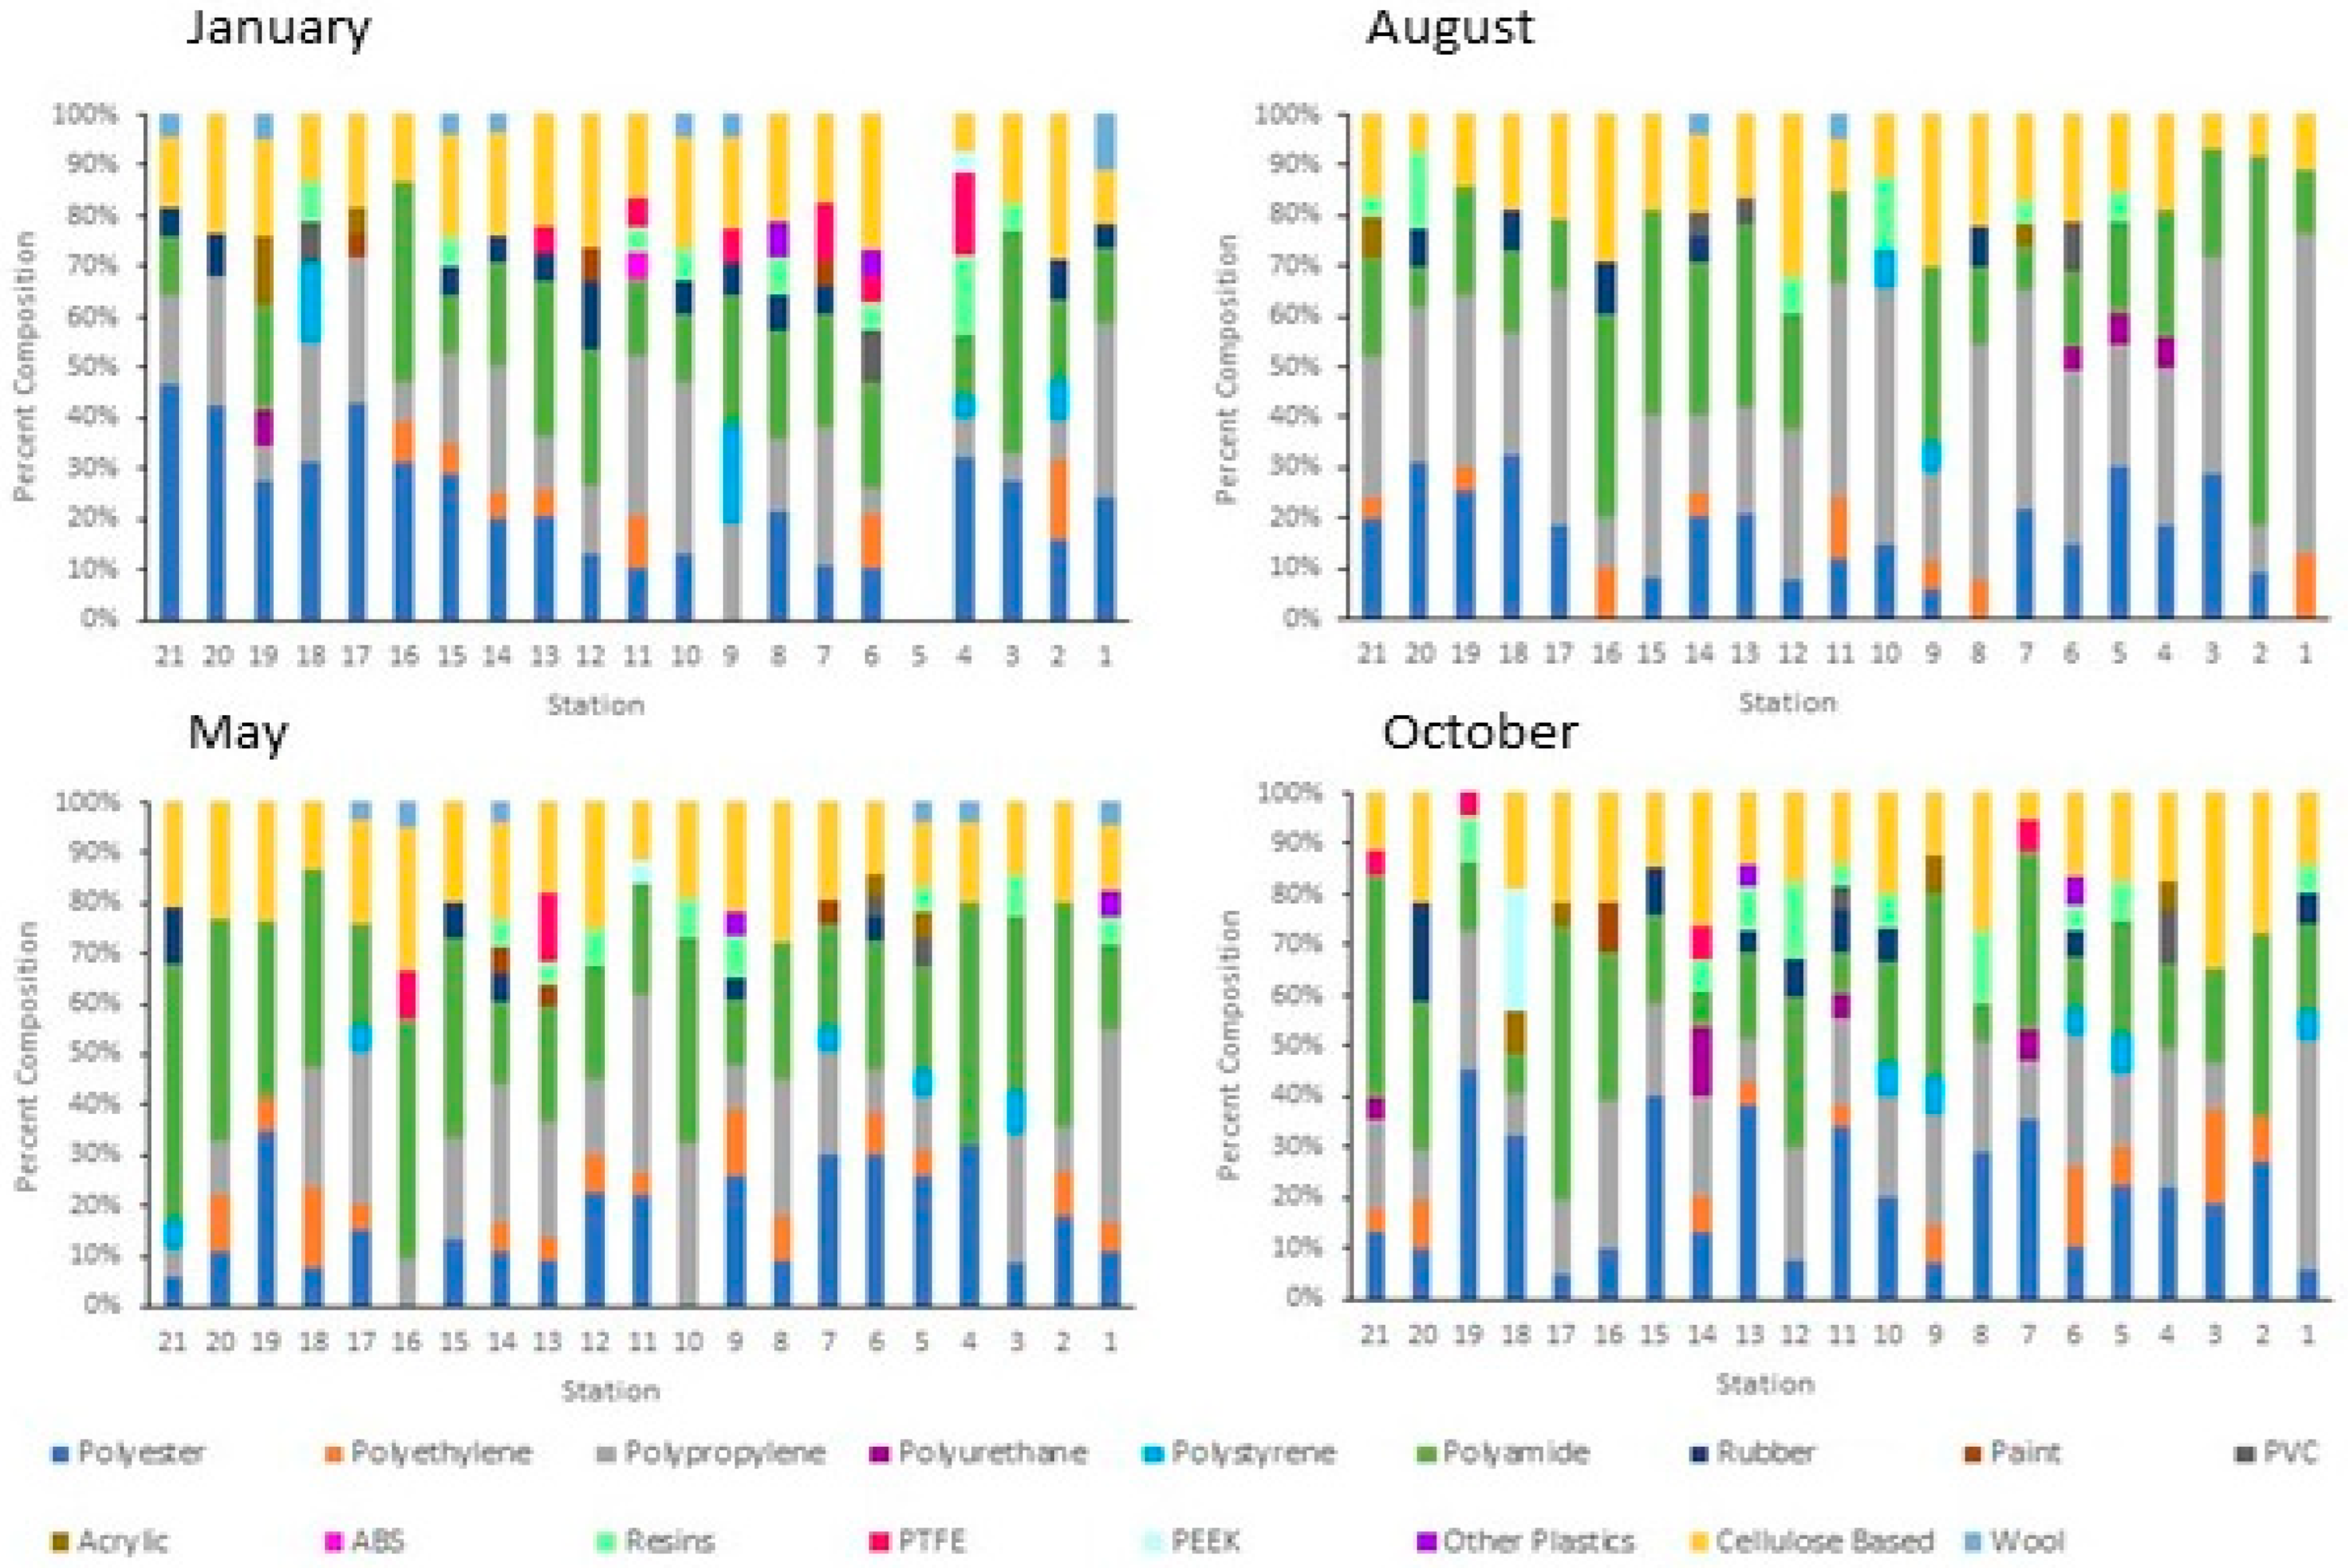
3.1. Anthropogenic Microparticle (MP) Abundance and Composition

Anthropogenic microparticles (MPs), including natural, semisynthetic, and synthetic polymers, were found at every site sampled in the surface water of the Charles River from near the headwaters to the mouth of the river in Boston—a distance of 77 miles—during each sample date. The combined microparticles and microfibers ranged from 1–19 MP/L with an average of 9 ± 4 MP/L (Table 2). Seventy six percent of the anthropogenic particles were synthetic, 23% were cellulose-based, and 1% were wool fibers. Polyester (PET), polypropylene (PP) and polyamides (PA) were the dominant polymers, comprising about 80% of the microplastics (Figure 4). Differences in the relative percent of microplastic particles to microfibers occurred (Table 3) such that August had a much lower ratio of microfibers to microparticles, and January, May, and October had similar ratios. Fibers comprised 0–100% of the microparticles, with an average of 72%, and the dominant colors were clear, red, yellow, brown, black, and blue.
Significant differences in the concentration of anthropogenic microparticles (ANOVA; p < 0.001) along the river within a single sampling time (Figure 5) were detected. Significant differences were also found at single sites between the four sampling times (ANOVA, p < 0.0001). Variation in the relative distribution of synthetic polymers occurred at sites along the Charles River (Figure 6) both within a single month and between months. The highest diversity of polymers occurred in the January and October sampling periods. Seasonal variation in polymer composition was also present with higher relative contributions from PP in the August, along with lower contribution from PET in the August (Figure 4B). The PP that was found near the head and middle of the Charles River was dominated by a mesh-type material (Figure 7), especially in the summer, where this material was not seen below Station 17; the PP in the lower basin of the Charles River constituted either fibers or fragment chunks. The vast majority of PET amounts collected were fibers, while PA amounts collected were primarily films and fibers. Overall, there was the greatest diversity of plastic polymer types in the winter samples.

3.2. Relationship to Impervious Coverage and Land-Use

The variation in anthropogenic microparticle concentrations along the Charles River was compared to the impervious coverage (IC) and to the land use (LU). The sites were grouped into low, medium, and high IC or LU. The low IC and LU sites comprised only 19–24% of the sites along the Charles River. In general, IC and LU sites were grouped in a similar manner, though there were a few differences (Figure 3). On an annual scale, sites categorized as low human impact for both IC and LU had significantly fewer (IC p = 0.0018; LU p = 0.0003) microplastics and/or microfibers present compared to the medium and high use sites, and there was no significant difference between medium and high IC and/or LU sites. However, when we look at individual sampling times, only May and October had significant relationships between IC and LU and microparticle concentrations (LU p << 0.001, p = 0.0176; IC p = 0.0135, p = 0.0074, respectively). Comparing the relative contribution of polymers versus IC and/or LU showed that annually, PP had a significant (ANOVA; p < 0.05) negative relationship with IC and LU, while PET had a positive trend with IC and LU. The greatest diversity of plastic types generally occurred at high or medium IC or LU sites, though two low IC/LU sites also had higher diversity.

3.3. Estimated Export Flux of Anthropogenic Microparticles into Boston Harbor

To determine the annual discharge of microparticles along the river, three different plastic concentrations (Cp) were used: the lowest positive concentration of any sample (1 MP L−1); the medium number of fibers (8 MP L−1); and the 3rd quartile concentration (13 MP L−1). Using the average flow data obtained from four USGS gages along the Charles River, annual average flux rates ranging from 459 to 11,092 microparticles per second were calculated (Table 4A). This indicates that between 40 and 960 million microparticles could have been flowing down the Charles River per day from its headwaters to the Boston Harbor, with a median average of 500 million microparticles per day, which could lead to an export of 182 trillion microparticles/year into the Boston Harbor. On an annual scale, the microparticle flux increased downriver (Table 4A).
Looking at individual sampling times, Table 4D shows that the lowest estimated flux of microparticles per second was 362 MP/s at the Medway gage station in August. In Table 4C, the highest estimated flux was 32,394 MP/s at the Waltham gage station in May. Based on the four sampling times, the Medway gage station, furthest upstream on the Charles River, consistently had the lowest estimated flux for each sampling time. The gage site with the highest estimated flux per sampling time varied between the other three downstream gages, indicating the potential removal of microplastics through sedimentation, fragmentation, or biological consumption before actual export into the Boston Harbor. Only May had the highest estimated flux at the lowest downstream station (Waltham) at 32,394 MP/s, suggesting continual addition of microparticles and transport along the river. Using the most downstream station (Waltham) at each sampling time showed a 6-fold variation in daily export potential (Table 4). Using the maximum export potential with the downstream station (Waltham) along with the percent composition of microparticles from the last four stations that occurred at and after the Waltham gage (Figure 6), indicates not only potential seasonal variation in the amount exported but also seasonal variation in the composition exported (Figure 8). January had the greatest variety of microparticle polymers and export was dominated by PET (35%), while May had the highest export potential and was dominated by PA (40%), August had the lowest export and was dominated by PP (29%), while October was relatively evenly distributed between PET (26%), PA (25%), and PP (17%).

4. Discussion

Anthropogenic microparticles were found at all 21 sampling sites along the Charles River during sampling in January, May, August, and October. Microparticle concentrations ranged from 1–19 MP/L, with an average concentration of 9 ± 4 MP/L (Table 2). Similar concentrations have been reported in other rivers in the United States [14,28]. Globally, concentrations of microplastic particles and/or fibers found in rivers range from 0.03 MP/L to 2867 MP/L [33,34]. Variation in collection methods and reporting methodology from the number of particles per volume or area or the weight of particles per volume or area can make comparisons between studies difficult and limit our understanding of global concentrations and variations within river systems [23].
The potential explanation for such a wide range of microparticle and fiber concentrations found across studies in freshwater environments may be due in part to the methodology [27,28,35,36], the geomorphology of the river [9,37], the surrounding land use, and the human density along the river [38], along with plastic waste management in the area [39]. Significantly higher concentrations of microparticles, particularly fibers, have been found using the water grab method compared to nets [27,35]. Additionally, the size of the net mesh can affect the amount of microplastics measured [36]. Yet, the significantly lower sample volume in water grab samples reduces the chance of detecting less abundant microparticles. The type of river, e.g., meandering or braided, along with changes in its geomorphology and its path, can affect the concentration and flux potential of microplastics [39]. Where rivers slow and form marshes macro- and microplastic debris is where they are more likely to settle and be buried in the sediments [9,40]. Macroplastic debris that are retained either in riparian vegetation or in the sediments have the potential to be a source of microplastics for years, as the macrodebris slowly fragment into smaller pieces through physical and biological processes [9]. Man-made modifications to rivers such as dams can also change the flow of rivers, artificially creating retention areas [41] and regions with exaggerated turbulence that can fragment larger debris. The Charles River has 19 remaining dams along its 80-mile path, along with culverts, bridges, and other man-made structures, which can impact the input, transport, and sedimentation of micro- and macrodebris. We still do not have a good understanding of how different structures within and along the shoreline of rivers, along with a river’s natural flow and morphology, affect microplastic sedimentation and transport.
Temporal and spatial changes in the concentration and composition of microparticles occurred along the Charles River (Figure 5 and Figure 6) in a similar manner to other river studies [14,42,43]. The vast majority of the anthropogenic particles, 72%, were microfibers. This is slightly lower than study on the Magdalena River in Neiva, Colombia where 84% of microparticles were fibers [44], yet they constitutedmore than the 58% of microparticles reported in the Snake and Lower Columbia River [35]. In a study examining 29 tributaries to the Great Lakes, fibers comprised 71% of microparticles [16]. Changes in the relative percentage of microfibers to microplastics were observed along the river and between sampling times (Table 3). Changes in microparticle concentrations were observed between sampling time periods (Figure 5), and generally higher concentrations were observed in May and October. Changes in the relative percentage of the dominant polymers were also observed between the seasons (Figure 4).
The microparticle concentration in the Charles River was significantly related to land use and impervious cover like what has been found in other studies of urbanized rivers [20,42,45]. Sites with low (<33%) impervious coverage (IC) or land use (LU) categorized as undeveloped land (e.g., forests, wetlands, etc.) had significantly lower microplastic concentrations than sites with high or medium impervious coverage or developed land (e.g., high-density residential, industrial, etc.). There was no detectable difference between sites with medium or high impervious coverage nor development suggesting that for a river flowing through primarily developed lands, where only large tracts of undeveloped forest/wetlands led to lower concentrations. The sites with low IC/LU levels were located more midstream (Figure 3), with higher concentrations of microparticles found both upstream and downstream suggesting riverine that processes such as deposition or biological consumption played a partial role in this relationship. The geomorphology of wetlands has slower flowing water, so microparticles have the potential to settle to the sediments and are regions that support more fish and bird life. Supporting this is the relative increase in polyethylene (PE), PP, and polystyrene (PS), which are all polymers with a density lighter than freshwater and the decrease in polyester (PET) and polyamide (PA), which are polymers with a density greater than freshwater (Figure 9). So, interactions between land use/impervious coverage (e.g., sources of the microparticles) and a river’s geomorphology may control the microplastic concentrations and compositions. A study found high concentrations of microplastics in the Snake River adjacent to land being used for large-scale agricultural farms in the Northwest United States [35], indicating that land use is an important influence on microplastic and fiber concentrations. Polymer composition alone does not reflect the whole story in the Charles River: if it did, one would expect the relative contribution of the lighter polymers to increase downstream, but this does not occur (Figure 9), and the loss of a distinctive PP particle (Figure 7) from the lower Charles River indicates that even these particles can either fragment, sink, or be consumed.
Studies have found that the primary sources of microplastics to the environment are textiles, landfills, wastewater treatment plants, abrasion from tires, road markings, paint, fragmentation of macroplastics, and dust [46,47,48]. Urban stormwater systems have been found to be a large source of microplastics [49,50,51], with estimates of up to 9.6 billion microplastics discharged into receiving waters from a single outfall in a rain event [50]. The changes in concentration and composition along the Charles River during each sample time suggest that localized sources of microparticles, along with river morphology and in situ processes, affect microparticle flux in the river, and to understand the impact of microplastic pollution now and into the future, we need to examine these processes, especially in impacted rivers. Water management of rivers, through diversions of water for agricultural irrigation, can change the distribution and sedimentation of microplastics [52].
Globally, it is estimated that 1.15 to 2.41 million tons of plastic waste enter the ocean yearly from rivers [11]. This includes both macroplastic and microplastic debris. Studies of European and Asian rivers have found averaged hourly flux rates of macroplastic to be from 3 to 10,000 pieces/hour [53], while our study was focused solely on microparticle flux. Microplastic concentrations (mp/L) are expected to be higher than macroplastic cocentrations, so a higher flux in terms of the number of particles would be expected from microplastic debris. Recent research has also shown that North American rivers tend to be dominated by microplastics compared to macroplastic debris [10]. The estimated export flux of microplastic particles from the Charles River into the Boston Harbor ranged from 40 to 960 microparticles per day, with an average of 500 microparticles per day. This is within the same range as that estimated for the export of microfibers from the Hudson River [14], but it is lower than that estimated for microplastics in-stream in the metropolitan area of Chicago, Illinois, USA [54] and for the Trent River in the United Kingdom [43]. This may be due in part to the size of the rivers and difference of methods used in estimating the flux. Maximum flux potential from the Charles River into Boston Harbor occurred during January and May which agree with the seasonal inputs of plastics from rivers to the ocean in New England [11]. The changes in the relative contribution of the main polymers (PET, PP and PA) suggest that more PET would be exported in January, more PA in May, and more PP in August. High concentrations of PET and PA in Boston Harbor support these results [55]. More research is needed to understand the flux of microplastics from the Charles River, as the estimated flux potential was not always highest at the gage and site furthest downstream (Table 4). This suggests behaviors of microplastic within the river, such as aggregation, sedimentation and/or consumption, can influence its flux potential. These processes may be influenced by dams along the river. This was seen in that the occurrence of PP mesh-type particles (Figure 7) were very abundant in the upper Charles River but were never seen in the lower Charles River (sites 21–18). While this study looked at the concentration and composition of anthropogenic microparticles along the Charles River in the surface water, we did not examine the impacts of man-made structures such as dams, bridges and/or culverts. This study shows that more work is needed to really understand the processes governing the transport of microplastics along an impacted river and the potential environmental impact of the microplastics throughout the river. It is estimated that by 2030 up to 90% of the world’s rivers will be impacted by at least one dam [56], with this continued growth and development of dams it is important to really understand their effect on microplastic transport, flux and sedimentation and their potential to create future environmental pollution hotspots.

5. Conclusions

Changes in microparticle composition have implications not only for the Charles River ecosystem but also for Boston Harbor. Results from this study show that fibers are the primary microparticle exported to Boston Harbor. However, microplastic particles (fragments, films, and foams) would be more likely exported to Boston Harbor during high flow seasons in January and May (Table 4B,C). Polyester and polyamides will be the dominant type of plastic exported during the high flow seasons. The impacts of microplastic particles and microfibers on the Charles River is not currently known, but their prevalence throughout the river suggests the impacts should be examined. With climate change, New England is experiencing more high intensity precipitation events [57,58] which could affect the input, distribution, and flux of plastic debris and microplastics from regional rivers and streams which will be important for management and mitigation efforts.

Author Contributions

L.M.: Conceptualization, methodology, validation, formal analysis, investigation, writing—original draft, project administration, J.U.-R.: investigation, writing—review & editing, visualization, supervision, funding acquisition. All authors have read and agreed to the published version of the manuscript.

Funding

This research was funded by a UMASS Boston Healey Grant to J.U.-R.

Institutional Review Board Statement

Not applicable.

Informed Consent Statement

Not applicable.

Data Availability Statement

Data are contained within the article.

Acknowledgments

We would like to acknowledge the Environmental Analytical Facilities at UMASS Boston for maintaining and providing access to the µFTIR.

Conflicts of Interest

The authors declare no conflicts of interest. The funders had no role in the design of the study; in the collection, analyses, or interpretation of data; in the writing of the manuscript; or in the decision to publish the results.

Appendix A

Record of GPS coordinates, site depth, and surface water temperature per sampling site.
28 January 20191 May 20195 August 201925 October 2019
Site #
GPS Coordinates
Depth (cm)Temp (°C)Depth (cm)Temp (°C)Depth (cm)Temp (°C)Depth (cm)Temp (°C)
1
(−71.512, 42.139)
645.34813.32527.33014
2
(−71.476,
42.094)
1405.4107146426.73612.8
3
(−71.459,
42.097)
1125.810214.67925.38613.2
4
(−71.422,
42.139)
2392.115213.48624.612411.9
5
(−71.379,
42.133)
NDND8914.710929.18413.6
6
(−71.362,
42.134)
1195.210213.347025.83012.5
7
(−71.332,
42.158)
2674.226413.31552516311.7
8
(−71.333,
42.189)
3563.435814.123926.723111.7
9
(−71.33,
42.233)
2903.531013.817328.216312.7
10
(−71.31,
42.276)
3053.431213.910726.316312
11
(−71.263,
42.259)
3303.735113.826726.732012.2
12
(−71.205,
42.267)
2443.319313.810725.414011.9
13
(−71.181,
42.254)
2293.322613.914726.213711.9
14
(−71.173,
42.271)
3233.227213.825725.921611.5
15
(−71.208,
42.297)
2722.925113.319126.718511.8
16
(−71.259,
42.325)
1682.827213.422625.64612.4
17
(−71.237,
42.373)
2842.621613.624426.724412.6
18
(−71.19,
42.365)
1422.516013.57425.26612.1
19
(−71.117,
42.364)
3842.548013.550826.150812.6
20
(−71.091,
42.354)
1372.51781422425.519812.6
21
(−71.061,
42.369)
8002.274213.976225.777712.6

References

  1. Barnes, D.K.; Galgani, F.; Thompson, R.C.; Barlaz, M. Accumulation and fragmentation of plastic debris in global environments. Philos. Trans. R. Soc. B Biol. Sci. 2009, 364, 1985–1998. [Google Scholar] [CrossRef] [PubMed] [PubMed Central]
  2. Cera, A.; Cesarini, G.; Scalici, M. Microplastics in Freshwater: What Is the News from the World? Diversity 2020, 12, 276. [Google Scholar] [CrossRef]
  3. Li, C.; Busquets, R.; Campos, L.C. Assessment of microplastics in freshwater systems: A review. Sci. Total Environ. 2020, 707, 135578. [Google Scholar] [CrossRef] [PubMed]
  4. Talbot, R.; Chang, H. Microplastics in freshwater: A global review of factors affecting spatial and temporal variations. Environ. Pollut. 2022, 292, 118393. [Google Scholar] [CrossRef]
  5. Wu, P.; Huang, J.; Zheng, Y.; Yang, Y.; Zhang, Y.; He, F.; Chen, H.; Quan, G.; Yan, J.; Li, T.; et al. Environmental occurrences, fate, and impacts of microplastics. Ecotoxicol. Environ. Saf. 2019, 184, 109612. [Google Scholar] [CrossRef] [PubMed]
  6. Zhou, Y.; Zhenyi, J.; Zheng, G.; Chen, L.; Zhang, Q.; Su, B.; Zhou, S. Microplastics in agricultural soils on the coastal plain: Spatial characteristics, influencing factors and sources. Sci. Total Environ. 2023, 901, 165948. [Google Scholar] [CrossRef]
  7. Mendrik, F.; Houseago, R.C.; Hackney, C.R.; Parsons, D.R. Microplastic trapping efficiency and hydrodynamics in model coral reefs: A physical experimental investigation. Environ. Pollut. 2023, 342, 123094. [Google Scholar] [CrossRef] [PubMed]
  8. Van Emmerik, T.; Strady, E.; Kieu-Le, T.C.; Nguyen, L.; Gratiot, N. Seasonality of riverine macroplastic transport. Sci. Rep. 2019, 9, 13549. [Google Scholar] [CrossRef]
  9. Van Emmerik, T.; Mellink, Y.; Hauk, R.; Waldschläger, K.; Schreyers, L. Rivers as plastic reservoirs. Front. Water 2022, 3, 212. [Google Scholar] [CrossRef]
  10. Strokal, M.; Vriend, P.; Bak, M.P.; Kroeze, C.; van Wijnen, J.; van Emmerik, T. River export of macro- and microplastics to seas by sources worldwide. Nat. Commun. 2023, 14, 4842. [Google Scholar] [CrossRef] [PubMed] [PubMed Central]
  11. Lebreton, L.C.M.; van der Zwet, J.; Damsteeg, J.-W.; Slat, B.; Andrady, A.; Reisser, J. River plastic emissions to the world’s oceans. Nat. Commun. 2017, 8, 15611. [Google Scholar] [CrossRef]
  12. Van der Wal, M.; van der Meulen, M.; Tweehuijsen, G.; Peterlin, M.; Palatinus, A.; Kovac Virsek, M.; Coscia, L.; Krzan, A. SFRA0025: Identification and Assessment of Riverine Input of (Marine) Litter. Final Report for the European Commission DG Environment; Ifremer: Plouzané, France, 2015. [Google Scholar]
  13. Weideman, E.A.; Perold, V.; Ryan, P.G. Limited long-distance transport of plastic pollution by the Orange-Vaal River system, South Africa. Sci. Total Environ. 2020, 727, 138653. [Google Scholar] [CrossRef] [PubMed]
  14. Miller, R.Z.; Watts, A.J.R.; Winslow, B.O.; Galloway, T.S.; Barrows, A.P.W. Mountains to the sea: River study of plastic and non-plastic microfiber pollution in the northeast USA. Mar. Pollut. Bull. 2017, 124, 245–251. [Google Scholar] [CrossRef] [PubMed]
  15. Vermaire, J.C.; Pomeroy, C.; Herczegh, S.M.; Haggart, O.; Murphy, M. Microplastic abundance and distribution in the open water and sediment of the Ottawa River, Canada, and its tributaries. Facets 2017, 2, 301–314. [Google Scholar] [CrossRef]
  16. Baldwin, A.K.; Corsi, S.R.; Mason, S.A. Plastic Debris in 29 Great Lakes Tributaries: Relations to Watershed Attributes and Hydrology. Environ. Sci. Technol. 2016, 50, 10377–10385. [Google Scholar] [CrossRef]
  17. Kunz, A.; Schneider, F.; Anthony, N.; Lin, H.T. Microplastics in rivers along an urban-rural gradient in an urban agglomeration: Correlation with land use, potential sources and pathways. Environ. Pollut. 2023, 321, 121096. [Google Scholar] [CrossRef]
  18. He, B.; Goonetilleke, A.; Ayoko, G.A.; Rintoul, L. Abundance, distribution patterns, and identification of microplastics in Brisbane River sediments, Australia. Sci. Total Environ. 2020, 700, 134467. [Google Scholar] [CrossRef]
  19. Townsend, K.R.; Lu, H.-C.; Sharley, D.J.; Pettigrove, V. Associations between microplastic pollution and land use in urban wetland sediments. Environ. Sci. Pollut. Res. 2019, 26, 22551–22561. [Google Scholar] [CrossRef]
  20. Yonkos, L.T.; Friedel, E.A.; Perez-Reyes, A.C.; Ghosal, S.; Arthur, C.D. Microplastics in Four Estuarine Rivers in the Chesapeake Bay, U.S.A. Environ. Sci. Technol. 2014, 48, 14195–14202. [Google Scholar] [CrossRef] [PubMed]
  21. Xia, F.; Tan, Q.; Qin, H.; Wang, D.; Cai, Y.; Zhang, J. Sequestration and export of microplastics in urban river sediments. Environ. Int. 2023, 181, 108265. [Google Scholar] [CrossRef] [PubMed]
  22. Mani, T.; Burkhardt-Holm, P. Seasonal microplastics variation in nival and pluvial stretches of the Rhine River—From the Swiss catchment towards the North Sea. Sci. Total Environ. 2020, 707, 135579. [Google Scholar] [CrossRef] [PubMed]
  23. Kye, H.; Kim, J.; Ju, S.; Lee, J.; Lim, C.; Yoon, Y. Microplastics in water systems: A review of their impacts on the environment and their potential hazards. Heliyon 2023, 9, e14359. [Google Scholar] [CrossRef] [PubMed] [PubMed Central]
  24. Kummu, M.; de Moel, H.; Ward, P.J.; Varis, O. How Close Do We Live to Water? A Global Analysis of Population Distance to Freshwater Bodies. PLoS ONE 2011, 6, e20578. [Google Scholar] [CrossRef]
  25. Anderson, E.P.; Jackson, S.; Tharme, R.E.; Douglas, M.; Flotemersch, J.E.; Zwarteveen, M.; Lokgariwar, C.; Montoya, M.; Wali, A.; Tipa, G.T.; et al. Understanding rivers and their social relations: A critical step to advance environmental water management. WIREs Water 2019, 6, e1381. [Google Scholar] [CrossRef] [PubMed]
  26. Fang, Y.; Jawitz, J.W. The evolution of human population distance to water in the USA from 1790 to 2010. Nat. Commun. 2019, 10, 430. [Google Scholar] [CrossRef]
  27. Barrows, A.P.W.; Cathey, S.E.; Petersen, C.W. Marine environment microfiber contamination: Global patterns and the diversity of microparticle origins. Environ. Pollut. 2018, 237, 275–284. [Google Scholar] [CrossRef]
  28. Wiggin, K.J.; Holland, E.B. Validation and application of cost and time effective methods for the detection of 3–500 μm sized microplastics in the urban marine and estuarine environments surrounding Long Beach, California. Mar. Pollut. Bull. 2019, 143, 152–162. [Google Scholar] [CrossRef]
  29. Hidalgo-Ruz, V.; Gutow, L.; Thompson, R.C.; Thiel, M. Microplastics in the Marine Environment: A Review of the Methods Used for Identification and Quantification. Environ. Sci. Technol. 2012, 46, 3060–3075. [Google Scholar] [CrossRef] [PubMed]
  30. Sierra, I.; Chialanza, M.R.; Faccio, R.; Carrizo, D.; Fornaro, L.; Pérez-Parada, A. Identification of microplastics in wastewater samples by means of polarized light optical microscopy. Environ. Sci. Pollut. Res. 2020, 27, 7409–7419. [Google Scholar] [CrossRef]
  31. Cowger, W.; Steinmetz, Z.; Gray, A.; Munno, K.; Lynch, J.; Hapich, H.; Primpke, S.; De Frond, H.; Rochman, C.; Herodotou, O. Microplastic Spectral Classification Needs an Open Source Community: Open Specy to the Rescue! Anal. Chem. 2021, 93, 7543–7548. [Google Scholar] [CrossRef] [PubMed]
  32. Allan, J. Landscapes and riverscapes: The influence of land use on stream ecosystems. Annu. Rev. Ecol. Evol. Syst. 2004, 35, 257–284. [Google Scholar] [CrossRef]
  33. Dris, R.; Imhof, H.; Sanchez, W.; Gasperi, J.; Galgani, F.; Tassin, B.; Laforsch, C. Beyond the ocean: Contamination of freshwater ecosystems with (micro-)plastic particles. Environ. Chem. 2015, 12, 539–550. [Google Scholar] [CrossRef]
  34. Kowalczyk, N.; Blake, N.; Charko, F.; Quek, Y. Microplastics in the maribyrnong and yarra rivers, melbourne, Australia. Port Phillip EcoCentre Clean Bay Bluepr. 2017, 1–36. [Google Scholar]
  35. Kapp, K.J.; Yeatman, E. Microplastic hotspots in the Snake and Lower Columbia rivers: A journey from the Greater Yellowstone Ecosystem to the Pacific Ocean. Environ. Pollut. 2018, 241, 1082–1090. [Google Scholar] [CrossRef] [PubMed]
  36. Kurki-Fox, J.J.; Doll, B.A.; Monteleone, B.; West, K.; Putnam, G.; Kelleher, L.; Krause, S.; Schneidewind, U. Microplastic distribution and characteristics across a large river basin: Insights from the Neuse River in North Carolina, USA. Sci. Total Environ. 2023, 878, 162940. [Google Scholar] [CrossRef] [PubMed]
  37. Van Thi, K.L.; van Emmerik, T.H.; Vermeulen, B.; Pham, N.Q.; Hoitink, A.T. Division and retention of floating plastic at river bifurcations. Environ. Pollut. 2024, 345, 123490. [Google Scholar] [CrossRef]
  38. Soltani, N.; Keshavarzi, B.; Moore, F.; Busquets, R.; Nematollahi, M.J.; Javid, R.; Gobert, S. Effect of land use on microplastic pollution in a major boundary waterway: The Arvand River. Sci. Total Environ. 2022, 830, 154728. [Google Scholar] [CrossRef]
  39. Nyberg, B.; Harris, P.T.; Kane, I.; Maes, T. Leaving a plastic legacy: Current and future scenarios for mismanaged plastic waste in rivers. Sci. Total Environ. 2023, 869, 161821. [Google Scholar] [CrossRef]
  40. Drummond, J.D.; Schneidewind, U.; Li, A.; Hoellein, T.J.; Krause, S.; Packman, A.I. Microplastic accumulation in riverbed sediment via hyporheic exchange from headwaters to mainstems. Sci. Adv. 2022, 8, 9305. [Google Scholar] [CrossRef]
  41. Watkins, L.; McGrattan, S.; Sullivan, P.J.; Walter, M.T. The effect of dams on river transport of microplastic pollution. Sci. Total Environ. 2019, 664, 834–840. [Google Scholar] [CrossRef] [PubMed]
  42. De Carvalho, A.R.; Garcia, F.; Riem-Galliano, L.; Tudesque, L.; Albignac, M.; ter Halle, A.; Cucherousset, J. Urbanization and hydrological conditions drive the spatial and temporal variability of microplastic pollution in the Garonne River. Sci. Total Environ. 2021, 769, 144479. [Google Scholar] [CrossRef] [PubMed]
  43. Stanton, T.; Johnson, M.; Nathanail, P.; MacNaughtan, W.; Gomes, R.L. Freshwater microplastic concentrations vary through both space and time. Environ. Pollut. 2020, 263, 114481. [Google Scholar] [CrossRef]
  44. Silva, P.M.; Nanny, M.A. Impact of Microplastic Fibers from the Degradation of Nonwoven Synthetic Textiles to the Magdalena River Water Column and River Sediments by the City of Neiva, Huila (Colombia). Water 2020, 12, 1210. [Google Scholar] [CrossRef]
  45. Kataoka, T.; Nihei, Y.; Kudou, K.; Hinata, H. Assessment of the sources and inflow processes of microplastics in the river environments of Japan. Environ. Pollut. 2019, 244, 958–965. [Google Scholar] [CrossRef] [PubMed]
  46. Birch, Q.T.; Potter, P.M.; Pinto, P.X.; Dionysiou, D.D.; Al-Abed, S.R. Sources, transport, measurement and impact of nano and microplastics in urban watersheds. Rev. Environ. Sci. Bio/Technol. 2020, 19, 275–336. [Google Scholar] [CrossRef]
  47. Siegfried, M.; Koelmans, A.A.; Besseling, E.; Kroeze, C. Export of microplastics from land to sea. A modelling approach. Water Res. 2019, 127, 249–257. [Google Scholar] [CrossRef] [PubMed]
  48. Jambeck, J.R.; Geyer, R.; Wilcox, C.; Siegler, T.R.; Perryman, M.; Andrady, A.; Narayan, R.; Law, K.L. Plastic waste inputs from land into the ocean. Science 2015, 347, 768–771. [Google Scholar] [CrossRef] [PubMed]
  49. Cho, Y.; Shim, W.J.; Ha, S.Y.; Han, G.M.; Jang, M.; Hong, S.H. Microplastic emission characteristics of stormwater runoff in an urban area: Intra-event variability and influencing factors. Sci. Total Environ. 2023, 866, 161318. [Google Scholar] [CrossRef] [PubMed]
  50. Ross, M.S.; Loutan, A.; Groeneveld, T.; Molenaar, D.; Kroetch, K.; Bujaczek, T.; Ruecker, N.J. Estimated discharge of microplastics via urban stormwater during individual rain events. Front. Environ. Sci. 2023, 11, 1090267. [Google Scholar] [CrossRef]
  51. Werbowski, L.M.; Gilbreath, A.N.; Munno, K.; Zhu, X.; Grbic, J.; Wu, T.; Sutton, R.; Sedlak, M.D.; Deshpande, A.D.; Rochman, C.M. Urban stormwater runoff: A major pathway for anthropogenic particles, black rubbery fragments, and other types of microplastics to urban receiving waters. ACS EST Water 2021, 16, 1420–1428. [Google Scholar] [CrossRef]
  52. Kukkola, A.; Runkel, R.L.; Schneidewind, U.; Murphy, S.F.; Kelleher, L.; Sambrook Smith, G.H.; Nel, H.A.; Lynch, I.; Krause, S. Prevailing impacts of river management on microplastic transport in contrasting US streams: Rethinking global microplastic flux estimations. Water Res. 2023, 240, 120112. [Google Scholar] [CrossRef] [PubMed]
  53. Van Calcar, C.J.; van Emmerik, T.H.M. Abundance of plastic debris across European and Asian rivers. Environ. Res. Lett. 2019, 14, 124051. [Google Scholar] [CrossRef]
  54. McCormick, A.R.; Hoellein, T.J.; London, M.G.; Hittie, J.; Scott, J.W.; Kelly, J.J. Microplastic in surface waters of urban rivers: Concentration, sources, and associated bacterial assemblages. Ecosphere 2016, 7, e01556. [Google Scholar] [CrossRef]
  55. Tobin, C.; Urban-Rich, J. A Localized Perspective—Are Microfibers a Problem in Boston Harbor? Environ. Sci. Pollut. Res. 2024; submitted. [Google Scholar]
  56. Van Cappellen, P.; Maavara, T. Rivers in the Anthropocene: Global scale modifications of riverine nutrient fluxes by damming. Ecohydrol. Hydrobiol. 2016, 16, 106–111. [Google Scholar] [CrossRef]
  57. Picard, C.J.; Winter, J.M.; Cockburn, C.; Hanrahan, J.; Teale, N.G.; Clemins, P.J.; Beckage, B. Twenty-first century increases in total and extreme precipitation across the Northeastern USA. Clim. Chang. 2023, 176, 72. [Google Scholar] [CrossRef]
  58. Douglas, E.M.; Fairbank, C.A. Is precipitation in northern New England becoming more extreme? Statistical analysis of extreme rainfall in Massachusetts, New Hampshire, and Maine and updated estimates of the 100-year storm. J. Hydrol. Eng. 2011, 16, 203–217. [Google Scholar] [CrossRef]
Figure 1. Sources of plastic debris (macro- and micro-sized) into New England Rivers. Blue lines represent environmental processes, while black lines represent man-made processes.
Microplastics 03 00034 g001
Figure 2. Charles River watershed map showing sampling sites, 1–21, in upstream (site 1) to downstream order (site 21). Insert of the state of Massachusetts, which shows the location of the Charles River watershed in blue.
Microplastics 03 00034 g002
Figure 3. Distribution of stations categorized as Low, Medium, and High Impact for the sampling sites along the Charles River base on (Left Panel) Impervious cover and (Right Panel) Land use.
Microplastics 03 00034 g003
Figure 4. (A). Percent composition of the anthropogenic particles during each sampling time; data from all the sites were combined (n = 343 January, n = 330 May, n = 323 August, n = 335 October). (B). Percent composition of the synthetic particles during each sampling time; data from all the sites were combined (n = 254 January, n = 246 May, n = 248 August, n = 265 May).
Microplastics 03 00034 g004
Figure 5. Maps showing microparticle concentration (MP/L) at each station along the Charles River during January, May, August, and October 2019.
Microplastics 03 00034 g005
Figure 6. Percent composition of the microparticles at each station along the Charles River at each sampling date. Station 1 is at near the head of the river in Milton, MA, and Station 21 is at the mouth in Boston, MA. Each station is about 3.5 miles apart. Samples were not collected at Station 5 during the winter.
Microplastics 03 00034 g006
Figure 7. Common miscellaneous fragment of Polypropylene (PP) that fragments into thinner “thread-like” pieces was found primarily in August at stations 1–15. FTIR Spectrum of the PP piece.
Microplastics 03 00034 g007
Figure 8. Estimated maximum export flux and composition of microparticles from the Charles River to Boston Harbor. This is estimated using the maximum concentration of microparticles in the river during this sampling time point, along with the percent composition of the microparticles determined from the most downstream stations located after the final stream gage. Cellulose-based particles include dyed cotton fibers and cellulose acetate.
Microplastics 03 00034 g008
Figure 9. Annual changes in the percent composition of the synthetic microparticles as they move from High/Medium land use in the upper river through the Low land use in the middle river to High/Medium land use in the lower Charles River adjacent to the city of Boston, MA. The percent composition of the dominant polymers—polyester, polyethylene, polypropylene, polystyrene, and polyamides—is shown on the figure.
Microplastics 03 00034 g009
Table 1. Land use and impervious cover low/medium/high human impact site categories. Data Source: MassGIS Land Use Land Cover 2016.
LowMediumHigh
Land UseOpen LandResidential
Multi-Family
Mixed Use, Primarily residential
Land UseTax ExemptResidential
Single-Family
Mixed Use, Other
UnknownCommercial
Right-of-WayIndustrial
Impervious Cover0% to 33%34% to 66%67% to 100%
Table 2. Average number of particles per liter (MP/L) ± standard deviation (n = 3) at each site along the Charles River in the surface water. Site 1 is near the head of the Charles, and Site 21 is near the mouth in Boston.
Site #JanuaryMayAugustOctoberAverage
115 ± 17 ± 28 ± 18 ± 29 ± 4
213 ± 214 ± 55 ± 37 ± 110 ± 5
39 ± 111 ± 412 ± 013 ± 111 ± 2
410 ± 312 ± 410 ± 212 ± 311 ± 3
5ND14 ± 64 ± 114 ± 311 ± 6
64 ± 118 ± 010 ± 36 ± 29 ± 6
72 ± 12 ± 16 ± 39 ± 15 ± 3
81 ± 22 ± 112 ± 22 ± 14 ± 5
91 ± 05 ± 28 ± 45 ± 35 ± 3
102 ± 27 ± 35 ± 219 ± 38 ± 7
113 ± 38 ± 77 ± 218 ± 49 ± 7
126 ± 215 ± 46 ± 33 ± 17 ± 5
135 ± 18 ± 12 ± 210 ± 16 ± 3
145 ± 114 ± 35 ± 13 ± 17 ± 5
157 ± 110 ± 33 ± 213 ± 18 ± 4
163 ± 110 ± 43 ± 29 ± 26 ± 4
17 5 ±216 ± 610 ± 317 ± 212 ± 6
18 2 ± 07 ± 59 ± 119 ± 129 ± 9
191 ± 113 ± 211 ± 420 ± 511 ± 8
2018 ± 27 ± 115 ± 22 ± 211 ± 7
2119 ± 210 ± 116 ± 215 ± 515 ± 4
Average7 ± 610 ± 58 ± 411 ± 79 ± 4
Table 3. Percent Fibers/Percent Particles (films, fragments, foams, beads) at each station along the Charles River. Average values were calculated for all stations within a sampling period. Site 1 is near the head of the Charles River, and Site 21 is near the mouth in Boston.
SiteJanuaryMayAugustOctober
198/286/1427/7320/80
287/1390/1053/479/91
395/592/886/1495/5
485/1592/854/4698/2
5ND53/4753/4770/30
666/3493/346/5418/82
777/230/10068/3292/8
8100/030/7036/6491/9
90/10078/2252/4899/1
1085/1590/1033/6790/10
1181/1990/1082/1880/20
1279/2195/553/4778/22
1380/2090/1053/4785/15
1481/1992/8623878/22
1572/2890/1038/6288/12
1632/6891/957/4397/3
1795/598/253/4795/5
1855/4587/1360/4096/4
1975/2597/356/4490/10
2090/1092/88/9273/27
2192/885/1550/5080/20
Average76/2482/1851/4977/23
Table 4. Estimated ranges of export flux of microplastics per second (MP/s) using USGS gage streamflow data at four gage sites and the measured lowest, medium, and 3rd Quartile MP/L concentration for (A) Annually, (B) January, (C) May, (D) August, (E) October.
A. Annual Lowest (MP/L = 1)Medium (MP/L = 8)3rd Quartile (MP/L = 13)
Gage SiteFlow (L/s)Total Depth (cm) (Dt)Depth Proportion (Dp)Flow w/Dp (L/s)Low (MP/s)Med (MP/s)3rd Q (MP/s)
Medway38371510.1245945936725966
Dover11,4793170.0665265252178477
Wellesley10,2722250.08823823658010,693
Waltham11,7092470.07853853682611,092
B. January Lowest (MP/L = 1)Medium (MP/L = 5)3rd Quartile (MP/L = 9)
Medway11,2362390.0884784742357623
Dover34,9713300.0519061906953217,157
Wellesley27,0862720.0717941794896916,145
Waltham29,8452840.0618881888944216,995
C. May Lowest (MP/L = 2)Medium (MP/L = 10)3rd Quartile (MP/L = 14)
Medway83941520.129911983991413,880
Dover34,5083510.051772354417,72124,809
Wellesley24,4522510.071750350117,50324,504
Waltham27,7532160.082314462823,13832,394
D. August Lowest (MP/L = 2)Medium (MP/L = 8)3rd Quartile (MP/L = 10)
Medway869860.2118136214491812
Dover34942670.0723647218862358
Wellesley32941910.0931162324903113
Waltham37632440.0727855622222778
E. October Lowest (MP/L = 2)Medium (MP/L = 10)3rd Quartile (MP/L = 15)
Medway13461240.1419538919462919
Dover42613200.0624047923963595
Wellesley52171850.10506101350657597
Waltham48182440.0735671135565335
Disclaimer/Publisher’s Note: The statements, opinions and data contained in all publications are solely those of the individual author(s) and contributor(s) and not of MDPI and/or the editor(s). MDPI and/or the editor(s) disclaim responsibility for any injury to people or property resulting from any ideas, methods, instructions or products referred to in the content.

