Article

Spatiotemporal Dynamics of Microplastics in Nakivubo Catchment: Implications for the Pollution of Lake Victoria

by
Simon Ocakacon
1,
Philip Mayanja Nyenje
1,*,
Herbert Mpagi Kalibbala
1,
Robinah Nakawunde Kulabako
1,
Christine Betty Nagawa
2,
Timothy Omara
3,*,
Christine Kyarimpa
4,
Solomon Omwoma Lugasi
5 and
Patrick Ssebugere
3
1
Department of Civil and Environmental Engineering, College of Engineering, Design, Art and Technology, Makerere University, Kampala P.O. Box 7062, Uganda
2
Department of Forestry, Biodiversity and Nature Conservation, College of Agricultural and Environmental Sciences, Makerere University, Kampala P.O. Box 7062, Uganda
3
Department of Chemistry, College of Natural Sciences, Makerere University, Kampala P.O. Box 7062, Uganda
4
Department of Chemistry, Faculty of Science, Kyambogo University, Kampala P.O. Box 1, Uganda
5
Department of Physical Sciences, Jaramogi Oginga Odinga University of Science and Technology, Bondo P.O. Box 210-40601, Kenya
*
Authors to whom correspondence should be addressed.
Microplastics 2025, 4(2), 21; https://doi.org/10.3390/microplastics4020021
Submission received: 24 March 2025 / Revised: 16 April 2025 / Accepted: 23 April 2025 / Published: 24 April 2025

Abstract

:
Microplastics (MPs) have been extensively studied in the marine environment, but reliable data on their sources and pathways in freshwater ecosystems, which are the main sources of such pollutants, are still limited. In this study, we investigated the spatiotemporal variations, characteristics, and sources of MPs in Nakivubo catchment, which drains waste and stormwater from Kampala city (Uganda) and empties it into Lake Victoria through the Nakivubo channel. Surface water samples (n = 117) were collected from thirteen sites in the Nakivubo catchment (S1 to S13) during the dry and wet seasons in 2022. The MPs were recovered by wet peroxide oxidation protocol, followed by salinity-based density separation, stereomicroscopy, and micro-attenuated total reflectance Fourier-transform infrared spectroscopy. All the samples had MPs, with mean concentrations ranging from 1568.6 ± 1473.8 particles/m3 during the dry season to 2140.4 ± 3670.1 particles/m3 in the wet season. Nakivubo catchment discharges an estimated 293.957 million particles/day into Lake Victoria. A Two-Way ANOVA revealed significant interactive effects of seasons and sampling sites on MPs abundance (p < 0.05). Spatially, the highest mean concentrations of MPs (5466.67 ± 6441.70 particles/m3) were in samples from site S3, which is characterized by poor solid waste and wastewater management practices. Filaments (79.7%) and fragments (17.9%) made of polyethylene (75.4%) and polyethylene/polypropylene co-polymer (16.0%) were the most common MPs. These are likely from single-use polyethylene and polypropylene packaging bags, water bottles, and filaments shed from textiles during washing. These results highlight the ubiquity of MPs in urban drainage systems feeding into Lake Victoria. To mitigate this pollution, urban authorities need to implement strict waste management policies to prevent plastic debris from entering drainage networks.

1. Introduction

Pollution of water resources by organic and inorganic contaminants, including microplastics, heavy metals, persistent organic pollutants, per- and polyfluoroalkyl substances, pharmaceutical residues, and polycyclic aromatic compounds, is one of the major drivers of water insecurity [1,2]. Microplastics are small synthetic plastic particles with their longest or widest dimensions less than 5 mm in size, that are intentionally produced or derived from the breakdown of macroplastics [3]. Microplastics (MPs) are grouped under contaminants of emerging concern, and their occurrence in the environment has been accelerated by the increased production and use of plastics, and mismanagement of the resulting wastes [4,5]. Microplastics are ubiquitous contaminants with the potential to bind, concentrate, and act as unneglectable vectors of other toxic compounds and pathogenic microorganisms [6,7].
Some of the sub-lethal, lethal, and toxic effects of MPs include neurotoxicity, mutagenicity, DNA damage, hepatotoxicity, genotoxicity, carcinogenicity, gastrointestinal and embryonic toxicity, chronic protein modulation, growth impairment, and oxidative stress [8]. Due to the potential toxic health risks of MPs in humans, animals, and ecosystems, they have been extensively studied in the marine environments, but reliable data on them in freshwater ecosystems remains comparatively scarce, especially in Sub-Saharan Africa [9,10]. Moreover, the available regulatory structures in developing countries are weak, and this results in unchecked pollution of water resources [3]. Quantification of plastic debris that enters lakes or marine environments from streams, rivers, and drainage channels is crucial for assessing their risks to human health and the environment. However, information on MPs entering freshwater from terrestrial sources is scarce, and the relative contributions of the different sources and pathways of the plastics are not well documented [4]. There is an urgent need to understand the characteristics and origin of MPs from both point and diffuse sources, such as surface runoffs, rainfall, and agricultural activities. The quantities or fluxes of MPs that are released into lakes from rivers, drainage channels, and wastewater treatment plants (WWTPs) on spatial scales are largely unknown, yet this is very crucial for assessing short- and long-term impacts caused by plastic litter [11].
Lake Victoria (L. Victoria) is the world’s largest tropical lake, and the second-largest freshwater lake (only after Lake Superior). It is the source of the Nile River, the longest river in Africa, that drains into the Mediterranean Sea. Lake Victoria is rated among the ten most polluted water bodies worldwide, and microplastic contamination of its surface water, superficial sediments, and fish has so far been documented [12,13,14,15,16,17]. To date, only one study assessed the occurrence of MPs in Nakivubo channel, which drains into L. Victoria [14]. The present study was conducted to investigate the spatial and temporal variations of MPs in Nakivubo catchment, which receives municipal and industrial wastes from Kampala city, Uganda, and drains them into L. Victoria. Unlike the previous study that solely focused on Nakivubo channel, the present study examined the entire Nakivubo catchment across two distinct seasons (i.e., the dry and wet seasons) with additional sampling at the onset of the rains. To better understand the implications for L. Victoria pollution, water flow measurements were conducted, and the daily particle load into the lake was calculated.

2. Methods

2.1. Study Area

This study was conducted on surface water samples collected from streams and channels (sites S1 to S13) in Nakivubo catchment, Uganda (Figure 1). The channel is approximately 9 km long, traversing a catchment area of 27 km2, and is joined by nine tributaries. It starts from springs located in the villages of Bat Valley, Wandegeya, and Makerere Kivulu, northwest of Kampala, the capital city, and runs southwards for 3 km to the city centre. It then runs eastwards for approximately 5 km through markets and the Kampala industrial area before draining its waters into Murchison Bay of Lake Victoria (the main source of drinking water for residents of Kampala city).
The catchment was chosen because it is under intense anthropogenic pressure from both demographic and ecological transformations, i.e., industrialization, urbanization, and informal settlements [18,19,20]. Given the lake’s rich biodiversity, its continued contamination with pollutants such as MPs and heavy metals can affect aquatic organisms and water quality, and, subsequently, humans. Thus, a comprehensive assessment of MPs’ abundance in water from the entire catchment could lead to more evidence-based decision-making for protecting its ecosystem and that of L. Victoria. Several anthropogenic activities were identified along the Nakivubo catchment (Table S1), and these include automobile repair, industries, markets and hotels, wastewater treatment plant factories, settlements, agriculture, abattoir, and dumping. The socio-economic activities within sampling sites S1 and S2 mainly included schools, hostels, garages, car parks, and markets. The likely source of MPs would be from dumpsites, Kisekka market, Shauri Yako market, Bus Park (Gateway Park), and grey water from hotels. The highest number of social economic activities surrounding sampling site S3 is characterized by plastic collection activity and poor waste disposal and the likely source of MPs includes Owino market/street vendors, new taxi park, Nakayiza Kisenyi Agroproduce market, solid wastes disposal along the channel, grey water from hotels, car washing bay and garages. Poor waste management was also observed, for example, domestic wastewater was discharged directly into the channel at site S5, a wastewater treatment plant discharged effluent into the channel at site S8, and solid waste was being discharged at a dumpsite from the informal settlement or the Kasanvu slum area at site S11. The main socio-economic activity identified at S12 and S13 included industry, schools, informal settlements, and dumpsites. The most likely MPs sources included wastewater from industry (Smile Plast, Blue Wave Beverages Limited), dumpsites from Kitintale informal settlement area, washing bay, and domestic wastewater.

2.2. Sampling Procedure

Water samples were collected from 13 sites in the Nakivubo catchment (Figure 1). These sites were selected based on various tributary characteristics and the activities in the vicinity of Nakivubo channel (Table S1). Sampling was conducted during the dry season (July 2022), the onset of rains (August 2022), and the wet season (October 2022). The mean monthly rainfall in Nakivubo catchment was 21.6 mm in July 2022, 142.186 mm in August 2022, 277.44 mm in September 2022, and 111.97 mm in October 2022 (Meteorological data from Trans-African Hydro-Meteorological Observatory (TAHMO), Mengo senior school weather station (Station number TA00650) run by Uganda National Meteorological Authority (UNMA). The water flow rates were also measured using the float area method [21] to enable quantification of microplastic loads. Water was sampled using the filtration method as described by Collicutt et al. [22]. Briefly, 40 L of surface water samples were collected in triplicate from each site using 20 L stainless steel buckets at 0–30 cm depth below the water surface and then filtered through a 5-mm stainless steel sieve. The filtrate was re-filtered through a 32-µm sieve, and the residue was rinsed into a 500 mL glass bottle using distilled water. The filtered samples were then transported in cooler boxes packed with dry ice to the Department of Chemistry, Makerere University, where they were preserved with 70% ethanol until commencement of analysis.

2.3. Microplastics Isolation

The retentate of the 32 µm sieve was transferred into a pre-weighed glass beaker using a spatula and rinsed with distilled water to ensure all solids were transferred into the beaker. The samples were then dried in an oven for 24 h at 90 °C [23]. The mass of the total solids was determined by subtracting the mass of the tared beaker from that of the beaker with the solids. Exactly 20 mL of 0.05 M ferrous sulphate solution and 20 mL of 30% hydrogen peroxide were added to the beaker containing the solids [24]. The mixture was allowed to stand at room temperature for 5 min and then heated to 75 °C on a hot plate in an extraction fume hood to digest organic matter. Plastic particles were separated from organic particles by adding 6 g of sodium chloride per 20 mL of the sample to increase the density of the solution [23]. These were reheated to 75 °C until the salt was completely dissolved. The resultant solution was transferred into a density separator, covered with aluminium foil, and allowed to settle. The MPs were carefully isolated using forceps. The floating solid was rinsed through the 32 µm sieve, transferred into a glass petri dish, covered with aluminium foil, and the contents air-dried for 24 h [12,23].

2.4. Stereomicroscopic Analysis

The petri-dishes were visually inspected under a Zeiss Stemi 508 stereomicroscope (Carl Zeiss microscopy GmbH, Jena, Germany) at ×20–50. The microscope was equipped with an AxioCamERc5s Rev2 camera for photographing the MPs to establish their forms and colors. Each identified particle was categorized as fragments, films, pellets, granules, filaments, or foam [25]. Both “break test” and “hot needle test” were employed to rule out false positives [26,27]. Subsequently, visual identification and counting of the number of MPs present in the samples were performed, and the results were normalized to the volume of water sampled.

2.5. Fourier-Transform Infrared Analysis

A representative portion (50%) of the samples was randomly selected, and five hundred (500) suspected plastic particles from them were analyzed. Micro-attenuated total reflectance Fourier-transform infrared (µATR-FTIR) spectroscopy was performed on an IRTracer-100/AIM-9000 infrared microscope (Shimadzu Corporation, Kyoto, Japan) at the Directorate of Government Analytical Laboratory, Kampala, Uganda. Prior to FTIR analysis of each particle, a background scan was performed. The spectra were recorded as an average of 20 scans in the range of 4500–400 cm−1 at a resolution of 4 cm−1. The chemical composition of the polymer was identified by comparing the entire spectral range of the unprocessed spectra with reference spectra in the polymer library of LabSolution IR software (version 2.2., Shimadzu Corporation, Kyoto, Japan). Overall, matches with >70% similarity were accepted while those with 60–70% similarity were individually examined to ensure that there was clear evidence of peaks from the samples corresponding to known peaks of standard polymers. Matches less than 60% were excluded [28].

2.6. Analytical Quality Assurance and Quality Control

To avoid cross-contamination, various measures were employed during sample collection and laboratory analyses. Sampling and laboratory experiments were executed while wearing latex gloves, pure cotton clothes, and facemasks to exclude any potential plastic contamination of materials such as analytical reagents, extracted MPs, and equipment. Furthermore, glass containers and aluminum foil were used throughout the study. Deionized water was analyzed as blank samples to assess if any potential cross-contamination arose from laboratory handling of the samples. In each group of the blank tests, deionized water was filtered instead of the samples and given the same treatment as the samples. No MPs were observed in the blanks.

2.7. Source Apportionment

To identify the sources of MPs, the individual plastic polymers profiled using µATR-FTIR spectroscopy, as well as the forms of the putative particles, were considered. Thereafter, the common uses and potential sources of the MPs were apportioned as described by previous authors [15,29]. These were then related to the observed socio-economic activities in the study area.

2.8. Statistical Analysis

Normality of the data on microplastic abundances and characteristics was checked using the Shapiro-Wilk test, and data were log-transformed where necessary to meet the assumption of normality and variance homogeneity. A Two-Way Analysis of Variance (ANOVA) with Turkey’s post hoc test was used to establish the effect of seasons and sampling site on microplastic abundances at p < 0.05. The analyses proceeded in R software (v4.2.2, R Core Team) while data visualization was done in Origin Pro 2025a (OriginLab Corporation, Northampton, MA 01060, USA). All statistical conclusions were reached at a 95% confidence interval.

3. Results and Discussion

3.1. Abundance and Spatial Distribution of MPs in Nakivubo Catchment

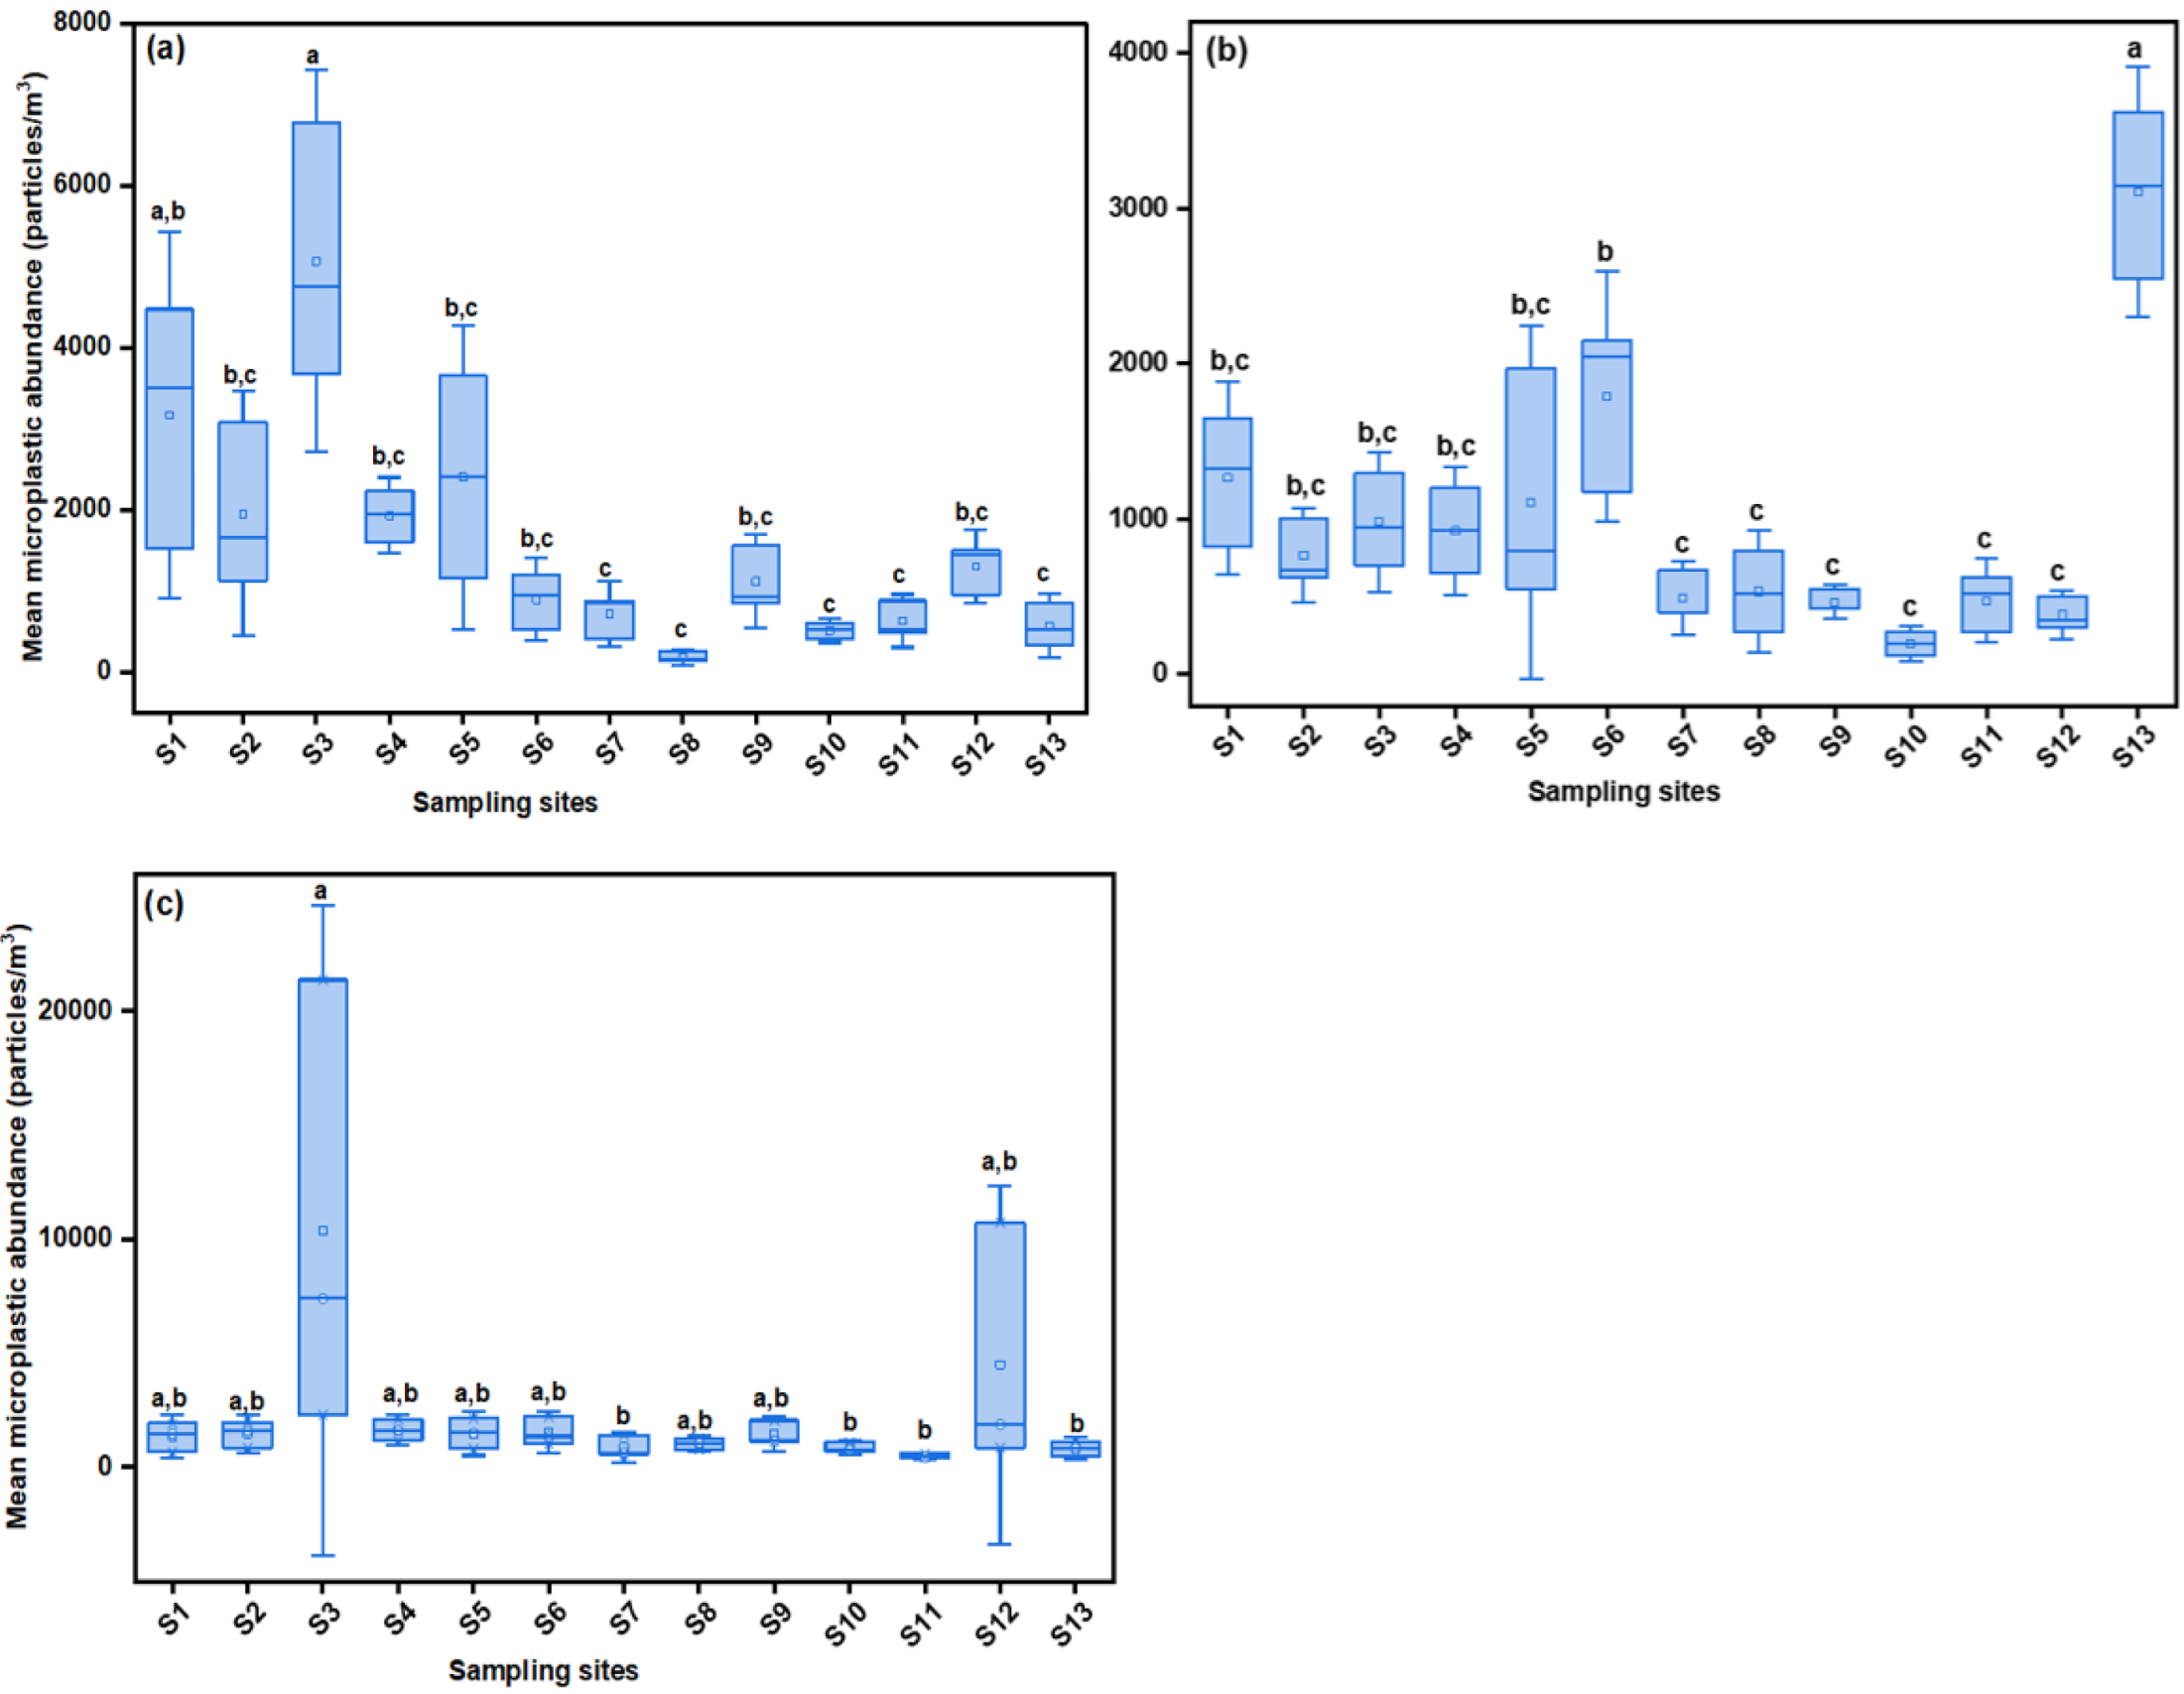
Figure 2 and Table S2 show the spatial and temporal distribution of MPs in the catchment. All the samples from the Nakivubo catchment had MPs (100% detection frequency). The highest mean concentration of MPs was in samples from site S3 (5466.67 ± 6441.70 particles/m3), followed by S12 (2055.56 ± 3296.85 particles/m3), S1 (1927.78 ± 1255.83 particles/m3), and then S5 (1663.89 ± 990.19 particles/m3). At sampling sites S13, S4, S6, S2, and S9, the concentration of MPs was high but relatively lower than observed at S3, S12, and S1. The lowest mean concentration of MPs was found in samples from sites S10 (522.22 ± 310.86 particles/m3), followed by S11 (530.56 ± 165.25 particles/m3), S8 (580.56 ± 416.42 particles/m3), and S7 (688.89 ± 322.86 particles/m3). Poor waste management practices within the sampling sites (i.e. from Owino market, Kisenyi bus park, car washing bays, as well as from the direct discharge of wastewater and domestic water from hotels and plastics collections and dumping sites) could be responsible for the high abundance of MPs at S3 located upstream and S12 downstream. Lower levels of MPs were measured at Bugolobi wastewater treatment plant (Site S8; 580.56 ± 416.42 particles/m3) than expected, and this is plausibly due to the removal of MPs by the wastewater treatment plant process [30].
Our findings at sampling sites S7, S8, S10, and S11 are comparable to the average MPs abundance (688 particles/m3) in water from Nakivubo channel and Murchison Bay of L. Victoria [14]. The levels of MPs in our study are lower than those that have been reported in some studies on urban drainage channels elsewhere (Table 1). For example, Tran-Nguyen et al. [4] found 630–3840 particles/m3 in water from an urban drainage channel (Phu Loc channel) in Da Nang City, Vietnam. Ross et al. [11] studying different catchments in Canada’s city of Calgary recorded up to 2,004,000 particles/m3 in stormwater, which is several folds higher than the highest concentration obtained in the present study. Consistent with our initial hypothesis, the highest concentrations of MPs were in the wet season, which could be associated with the remobilization of MPs within the urban drainage channel during intense rainfall events. This mobilization was evident at sites S3 and S12, which supposedly produce a high concentration of MPs. At other sites where the sources of MPs were low, dilution appeared to be taking place. These data provide evidence that the remobilization of MPs during rainfall events can be intense, especially in sub-catchments with potential sources of MPs [31,32]. Such a phenomenon was previously reported in some urban catchments of Canada and the Sucy-en-Brie catchment, Paris (France), in which higher concentrations of MPs were quantified during rain events [11,31].
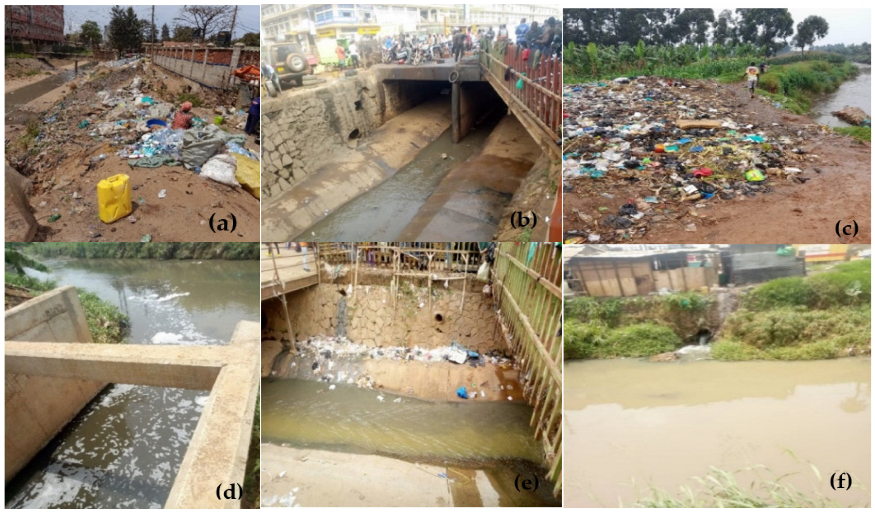
The high MPs fluxes in this study could be due to anthropogenic contributions, distinct economic activities along Nakivubo catchment such as garages, industries, markets and hotels, treatment plants, factories, settlements, agriculture, abattoirs, and garbage dumping sites (Table S1). In addition, the poor waste management practices within the markets, as well as the discharge of wastewater and/or domestic water from the Bugolobi treatment plant directly to the Nakivubo channel and its tributaries, could be responsible for the MP presence in the surface water samples. Furthermore, informal settlers at Katwe, Lubowa, and Kanvu slums discharge domestic waste to the channel (Figure 3). A study by Bbosa et al. [36] reported the presence of plastics in treated effluent from National Sewage Works, effluents from Uganda Batteries, Meat Parkers and Mukwano industries, which directly discharged into the Nakivubo channel. The average mean discharge of the Nakivubo channel tributaries was estimated as 0.505 m3/s, and the main channel discharge was approximately 19.25 m3/s during the wet season.
Based on the discharge measured in the present study, microplastic fluxes were calculated by multiplying concentration (particles/m3) with the discharge values (m3/s). Subsequently, the results (normalized to flow particles per day) showed that the mean fluxes differed considerably across sampling sites within the catchment (Table 2). Sampling site S13, located downstream (at the inlet into Lake Victoria), was used to deduce the microplastic output from Nakivubo catchment into the lake, which was up to 293.957 million particles/day. This value is by comparison lower than the individual outfalls of 1.9 million to 9.6 billion MPs discharged into the receiving waters of Bow and Elbow Rivers of Calgary, Canada [11] and 623 million particles/day conveyed by the Phu Loc channel of Vietnam into the Da Nang Bay [4].
The pooled mean microplastic concentrations were 1568.6 ± 1473.8, 961.5 ± 813.2 and 12,140.4 ± 3670.1 particles/m3 for the dry (July, monthly precipitation of 21.60 mm), onset (August, monthly precipitation of 142.17 mm) and wet seasons (October, monthly precipitation of 111.98 mm), respectively (Table 3). Statistical analysis showed that there were significant differences in MPs abundance (p < 0.05, Two-Way ANOVA) between the sampling seasons and sites. The differences between seasons could be attributed to combined sewer overflow, stormwater, or surface runoff mobilising MPs that enter into drainage channels during the rainy season [18,37].

3.2. Morphology of MPs

Filaments (79.7%) were the most abundant MPs, followed by fragments (17.9%), foam (1.4%), films (0.7%), and granules (0.4%) (Figure 4; Table S2). The distribution of microplastic morphologies varied by season and sampling site (p < 0.05). Filaments were consistently detected across seasons, but their proportion was very high in the wet season (up to 79.5%), with samples from sites S3 and S12 having 40% and 97.6% of the total MPs recorded in them as filaments. Fragments were the commonest microplastic form at site S12 (87.8% of 538 items identified at this site), representing 14.2% of the 3339 particles recovered in all the wet season samples. Granules (0.4%) were only recorded at site S3 during the wet season. At the onset of rains, filaments constituted 25.5% and 16% of the total number of MPs detected in samples from sites S13 and S6, respectively. In contrast, fragments had the highest occurrences at sites S3 (40.3%) and S1 (27.4%) during the dry season, i.e., 10.0% and 5.7% of the total MPs identified in this season. These variations can be attributed to the localized differences in waste input types and the potential contribution of stormwater and surface runoff in promoting plastic fragmentation and MPs formation. The spatiotemporal variations of MPs’ morphologies by particle count are detailed in Table S2.
The observed trends are similar to those made by Kakooza [14] in which the MPs in water samples from the Nakivubo channel were predominantly fibers, while those for the Murchison Bay samples were mainly fibers and fragments. Tran-Nguyen et al. [4] detected mainly fibers and fragments in water sampled from the Phu Loc channel (Vietnam). Similarly, Rose et al. [11] indicated fibers to be the most averagely prevalent MPs morphology (47.7%), followed by fragments (42.57%) in water from different catchments in Calgary city of Alberta Province, Canada. The variations in MPs morphology in our study, as compared to the preceding study on the Nakivubo channel, could be due to the fact that our study encompassed the whole catchment, not just the Nakivubo channel. Moreover, studies were performed in both the dry and wet seasons, which implies that these differences may also be related to the differences in the sampling periods considered. The abundance of microplastic filaments in water samples has always been associated with their shedding from synthetic textiles during the washing of clothes, fishing nets, and effluents from wastewater treatment plants [12,30].

3.3. Colour Diversity of MPs

Color is an important descriptor of MPs, as preferential ingestion by aquatic organisms can be influenced by particle color. Across the catchment, the most dominant colors were white/transparent (42.6–79.7%), blue (10.9–33.1%), and black (8.5–15.2%). Other colors, namely: red (0.5–6.3%), pink (0.1–0.7%), and green (0.1–0.4%) were present in lower proportions. As discussed for the morphologies, seasonal and spatial differences in MPs’ color distribution were evident. White/transparent particles were more prevalent during the dry season (69.1–80.5%), particularly at upstream sites S1 and S3, where they constituted 96.3% and 81.2% of MPs identified in these sites. Pink (0.1–0.7%) and green (0.1–0.4%) MPs were only present during the wet season at sites S2 and S8 (the discharge point for the Bugolobi Wastewater treatment plant). Blue and black MPs were detected more at sites S3 and S12 during the wet season, where they represented 66.8% and 24.2%, and 85.9% and 13.0% of the total MPs identified per site, respectively. These trends may reflect color-specific shedding from the microplastic sources, differential transport, and ultraviolet light-induced weathering effects during the dry season for the white/transparent MPs.
The colours of MPs observed are concordant with previous reports. Studies in Nakivubo channel and L. Victoria, for example, indicated that white/transparent and blue were the dominant colours of MPs in water, followed by green, black, yellow, purple, and red particles [12,14,38]. Blue and white were the colours of up to 42.5% and 41.8% of the colored fibrous MPs in water from Phu Loc channel (Vietnam) [4]. In Canada, water from catchments in Calgary city had on average black (33.5%), transparent (22.6%), and blue (16%) MPs [11]. Overall, the prevalence of blue-colored plastic debris can be attributed to blue being one of the most commonly used colors in synthetic materials worldwide [39,40,41]. Conversely, the dominance of white and transparent MPs is expected to arise from MPs’ exposure to ultraviolet radiation, which can cause the fading of their original colors [42].

3.4. Polymer Composition of the Identified MPs

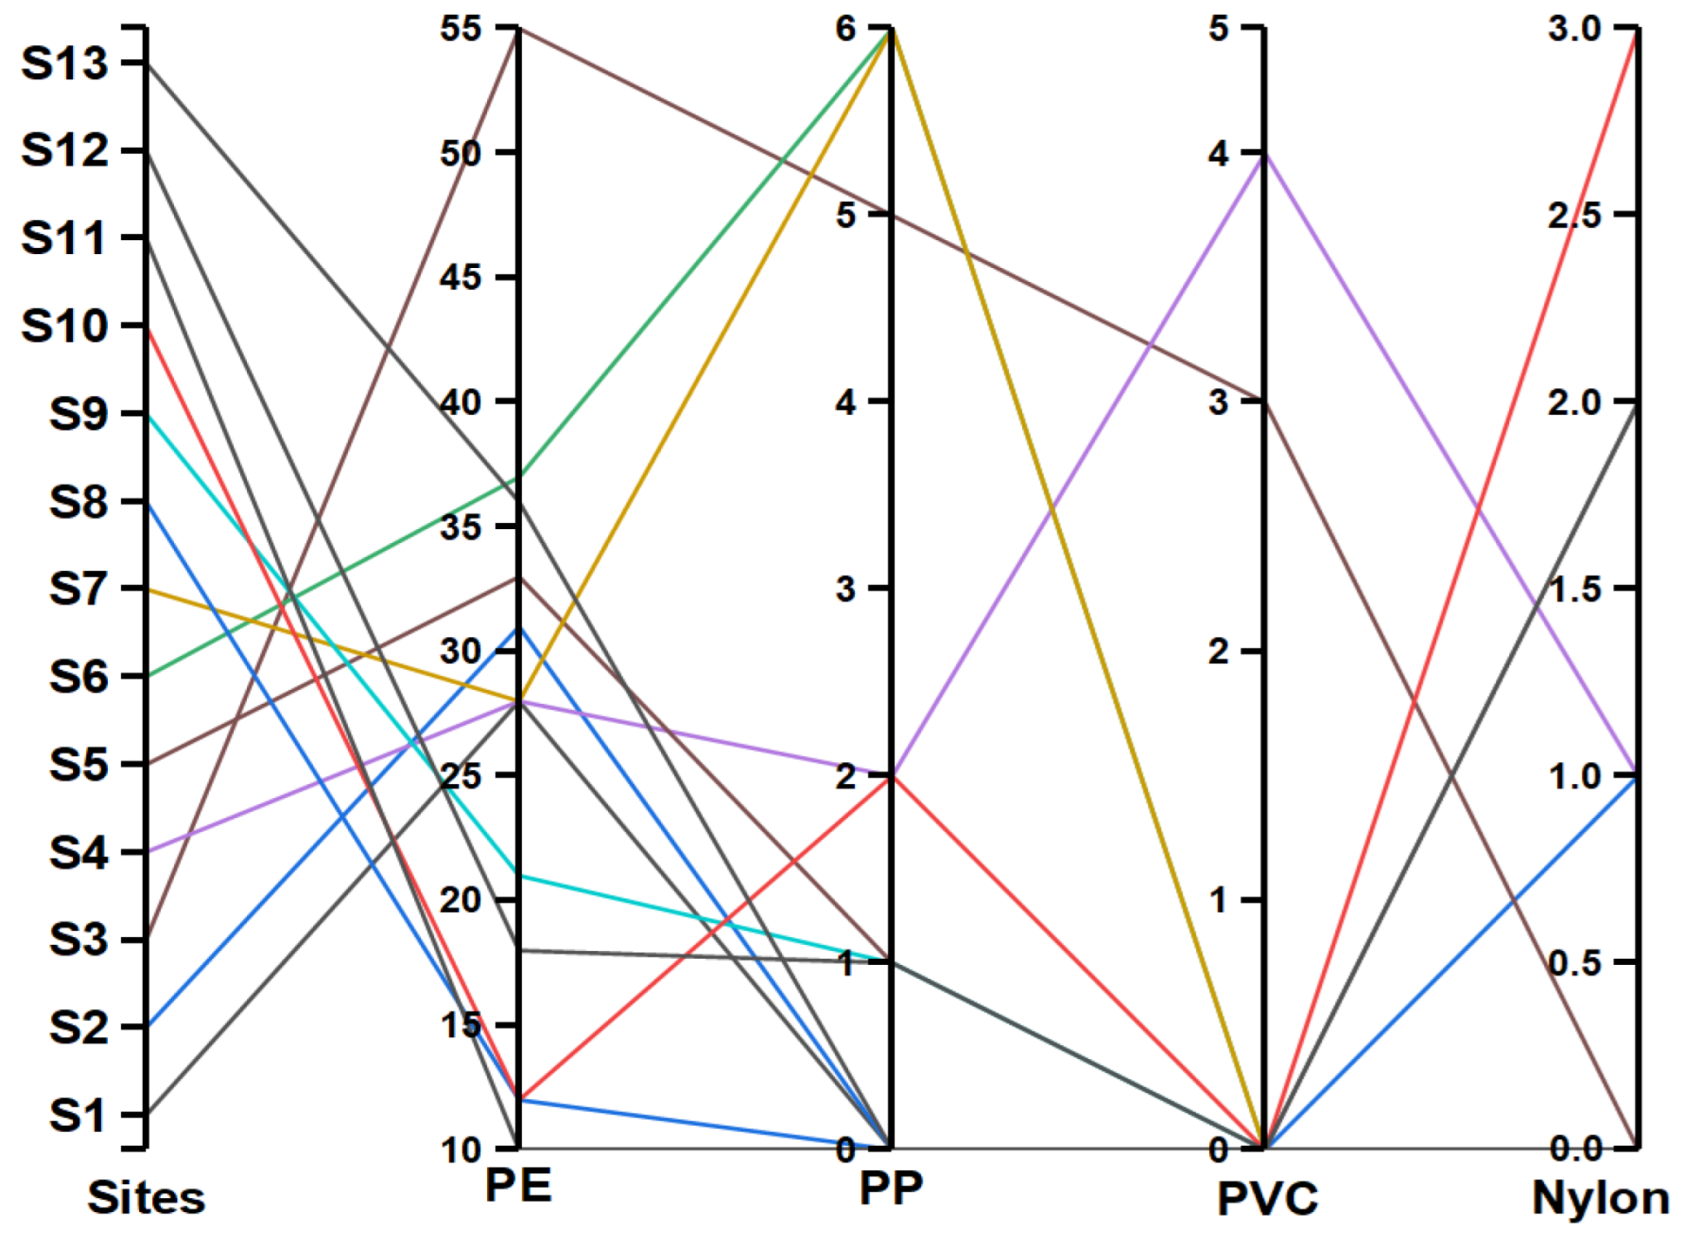
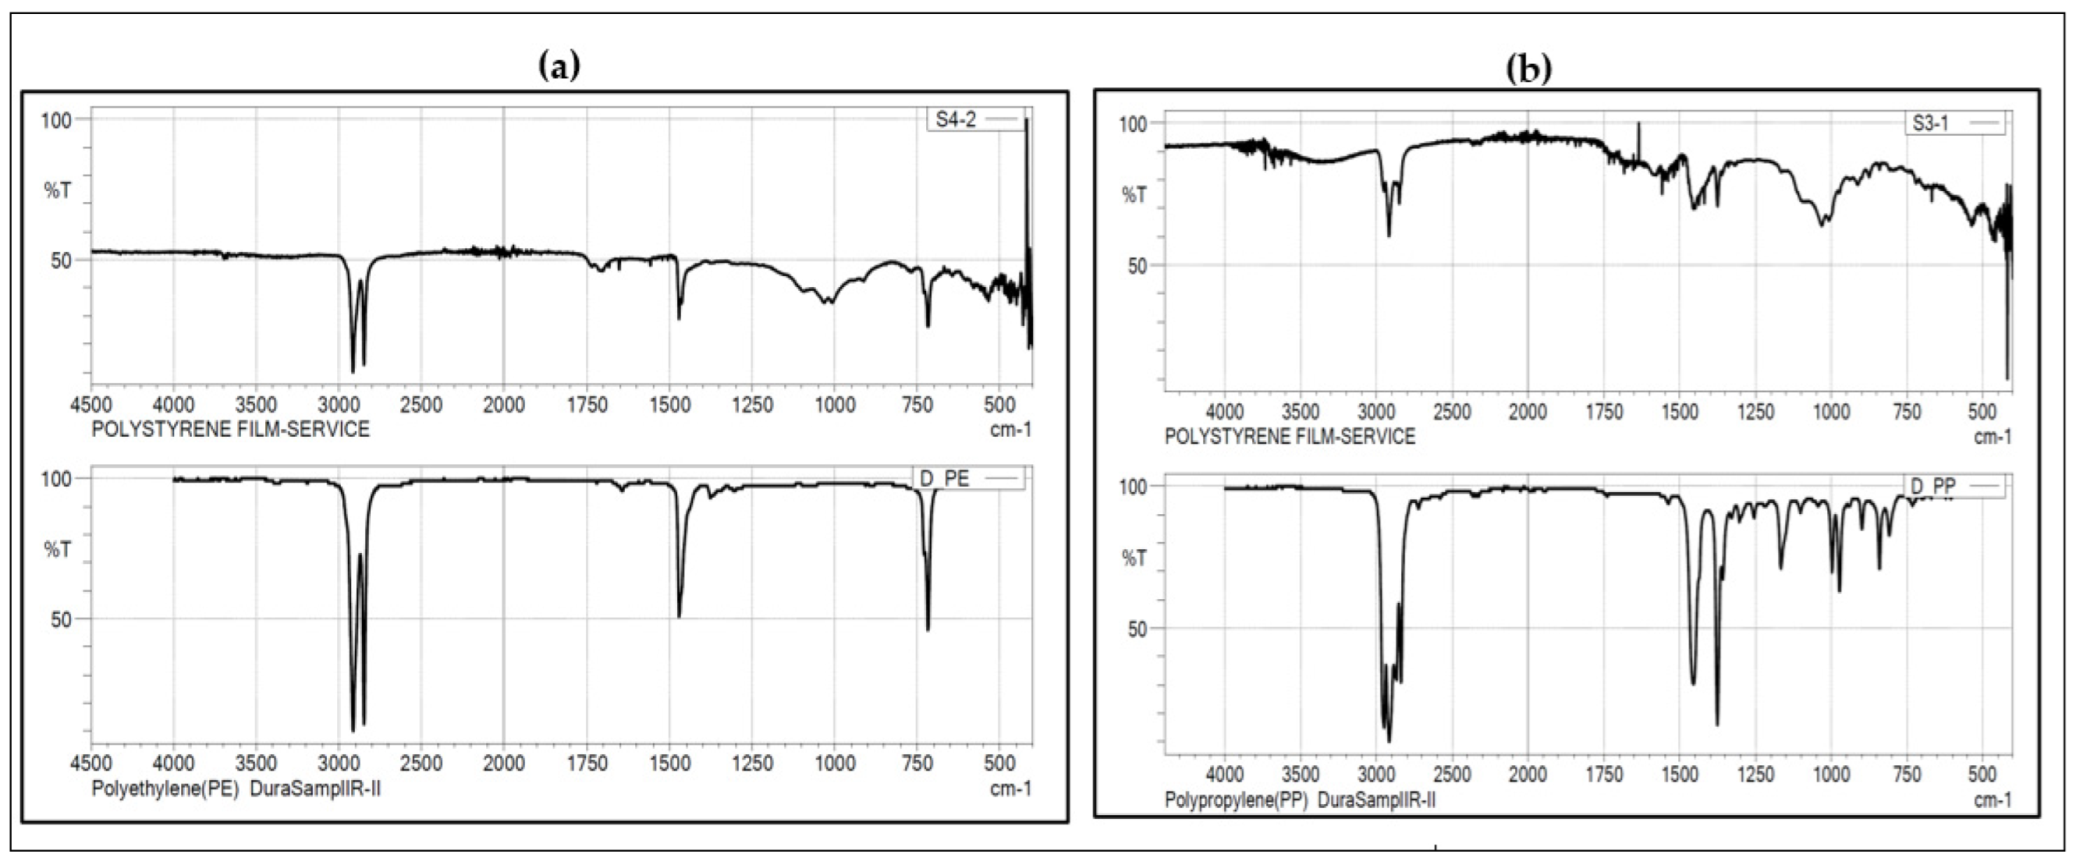
Following FTIR analysis, 463 (92.6%) of the 500 putative particles were confirmed to be MPs (Figure 5, Table S3). The most abundant polymer type for the pooled MPs data was polyethylene (75.38%), followed by polyethylene/polypropylene co-polymer (15.98%), polypropylene (5.18%), nylon (1.94%), and polyvinylchloride (1.51%). Spatially, this trend was the same, with polyethylene (PE) still being the most frequently encountered MPs (as seen in the dry season), followed by polyethylene/polypropylene co-polymer. Polyvinylchloride (PVC) was the polymer type of the two samples from sites S3 and S4 during the wet and dry seasons, respectively. Figure 6 shows representative µ-FTIR spectra of PE and PP MPs isolated from the water samples as compared with the spectra of authentic standard polymers in the LabSolutions IR library.
In water sampled from Murchison Bay of Lake Victoria, high-density PE, PP, polyvinyl stearate, and polystyrene were the major polymers [14]. Egessa et al. [12] found PE and PP as the major MPs polymers in surface water trawled from L. Victoria, including the Ggaba fish landing beach of Murchison Bay. A recent study in our research group using both µ-FTIR and pyrolysis gas chromatography-mass spectrometry confirmed that PE, PP, nylon 6 and nylon 66 were prevalent in water trawled from L. Victoria, and Port Bell (which by virtue of being part of the inner Murchison Bay indirectly receive stormwater from Nakivubo catchment) had the highest concentration of MPs quantified [38]. Elsewhere, PE, PP and polyester were found to be the synthetic MPs in water from catchments [4,11,31]. The results of these studies are in agreement with the polymers identified in the present study. The dominance of PE and PP in the catchment could be attributed to the widespread use of bags and drinking water bottles made from these polymers in the region [43,44]. The high frequency of PE and PP detection in microplastic studies is thus a trend that is consistent with their global production and use [45,46]. Although unexpected, PVC was detected in a small proportion (1.51%) of the samples. PVC is rarely detected in environmental studies due to its ease of photo-degradation, deterioration of its spectral features due to weathering, the effect of additives included in its formulations, or sample preparation procedures [47]. In principle, the use of sodium chloride solution (density~1.20 g/cm3) for salinity-based density separation in the present study should limit the recovery of denser polymers like PVC and PET (density~1.3–1.45 g/cm3). However, the available literature shows that sodium chloride can recover certain types of PVC particles, usually with lower efficiency than can be achieved with other denser salt solutions such as zinc chloride and sodium iodide [48]. Therefore, the observed levels of PVC in this study may be underestimated, and future studies could consider using denser salts such as zinc chloride and sodium bromide to uncover the full polymer profile of MPs in the study area and Lake Victoria.

3.5. Implications for Lake Victoria’s Pollution

Nakivubo catchment discharges an estimated 293.957 million MPs per day into L. Victoria. Polyethylene and PP are buoyant polymers dominant in the surface water samples and, thus, many of these particles are likely to remain in the upper column of the lake water, where they can be ingested by pelagic fish species. Studies in the Murchison Bay of Lake Victoria, which receives stormwater from Nakivubo catchment, have consistently detected MPs in fish gut and edible muscles [49,50], emphasizing that these MPs (sometimes loaded with functional additives) could pose adverse human and ecological health risks following potential biomagnification and trophic transfer. These findings underscore the urgent need for waste management interventions in the upstream sites as a strategy to protect Lake Victoria’s ecosystem and public health.

3.6. Study Limitations and Future Research Directions

Due to instrumental limitations, advanced techniques such as pyrolysis-gas chromatography/mass spectrometry and thermal desorption extraction analysis were not used to further confirm and quantify the polymer composition of the putative particles. In addition, the samples obtained per season are considered only for one to two months, although seasons in Uganda are known to occur over several months. Nevertheless, the present results provide a baseline for future studies in our research group (Environmental Chemistry for Sustainable Development-ECSDevelop), which will involve sampling of water, sediments and biota from selected fish breeding areas and fish landing beaches on L. Victoria, with size determination and thermoanalytical pyrolysis-gas chromatography/mass spectrometry quantification of MPs in these matrices.

4. Conclusions

This study provided quantitative evidence of ubiquitous MPs contamination in the Nakivubo catchment. The concentration of MPs was highest during the wet season, supporting the view that stormwater and surface runoff play a role in mobilizing plastic debris. Filaments were the most common MPs morphology, with the highest concentrations from sites with intense textile and domestic waste discharges. The MPs were predominantly white/transparent, blue particles made of polyethylene and polypropylene. With these findings, targeted interventions are required at the identified pollution hotspots to reduce MPs emissions. Waste management should be prioritized in markets, informal settlements, and industrial zones with direct connections to the Nakivubo channel. Future studies should employ time-weighted stormwater sampling at stormwater outlets from industrial and residential areas in the catchment to establish the emission characteristics, counts, and mass-based loads of the MPs. The depth of surface water should be considered, and sediments should be sampled to comprehensively understand the dynamics of MPs in different depths along the catchment.

Supplementary Materials

The following supporting information can be downloaded at: https://www.mdpi.com/article/10.3390/microplastics4020021/s1, Table S1: Description of sampling sites in Nakivubo catchment, Lake Victoria, Uganda; Table S2: Raw data on microplastics identified in water samples from Nakivubo catchment; Table S3: Polymer count of microplastics identified by µATR-FTIR spectroscopy.

Author Contributions

Conceptualization, S.O., P.M.N., H.M.K., C.B.N., C.K. and S.O.L.; methodology, S.O., P.M.N., H.M.K. and T.O.; software, S.O. and T.O.; validation, P.M.N., H.M.K., R.N.K., C.B.N., T.O., C.K. and S.O.L.; formal analysis, S.O.; investigation, S.O.; resources, C.B.N., C.K., S.O.L. and P.S.; data curation, S.O. and T.O.; writing—original draft preparation, S.O., P.M.N., H.M.K. and T.O.; writing—review and editing, R.N.K., C.B.N., C.K., S.O.L. and P.S.; visualization, S.O. and T.O.; supervision, P.M.N. and H.M.K.; project administration, C.B.N., C.K., S.O.L. and P.S.; funding acquisition, C.B.N., C.K., S.O.L. and P.S. All authors have read and agreed to the published version of the manuscript.

Funding

This study was funded by the Austrian Partnership Programme in Higher Education and Research for Development (APPEAR) through its academic partnership project 249: Environmental Chemistry for Sustainable Development (ECSDevelop) hosted at Makerere University, Uganda. APPEAR is a Programme of the Austrian Development Cooperation and is implemented by Austria’s Agency for Education and Internationalization (OeAD) under OEZA Project number: 0894-01/2020.

Institutional Review Board Statement

Not applicable.

Informed Consent Statement

Not applicable.

Data Availability Statement

The data supporting the conclusions of this study are available within this manuscript and its Supplementary Files.

Acknowledgments

We thank Peter Kavuma (Department of Chemistry, Makerere University) and Emmanuel Muhumuza (Molecular Biology Laboratory, Makerere University) for their support during microplastic isolation and stereomicroscopic analysis of the samples, respectively.

Conflicts of Interest

The authors declare no conflicts of interest.

References

  1. Misra, A.; Zambrzycki, C.; Kloker, G.; Kotyrba, A.; Anjass, M.H.; Castillo, I.F.; Mitchell, S.G.; Güttel, R.; Streb, C. Water Purification and Microplastics Removal using Magnetic Polyoxometalate Supported-Ionic Liquid Phases (magPOMSILPs). Angew. Chem. 2019, 59, 1601–1605. [Google Scholar] [CrossRef] [PubMed]
  2. Joo, S.H.; Liang, Y.; Kim, M.; Byun, J.; Choi, H. Microplastics with adsorbed contaminants: Mechanisms and Treatment. Environ. Chall. 2021, 3, 100042. [Google Scholar] [CrossRef]
  3. Aragaw, T.A. Microplastic pollution in African countries’ water systems: A review on findings, applied methods, characteristics, impacts, and managements. SN Appl. Sci. 2021, 3, 629. [Google Scholar] [CrossRef]
  4. Tran-Nguyen, Q.A.; Vu, T.B.H.; Nguyen, Q.T.; Nguyen, H.N.Y.; Le, T.M.; Vo, V.M.; Trinh-Dang, M. Urban drainage channels as microplastics pollution hotspots in developing areas: A case study in Da Nang, Vietnam. Mar. Pollut. Bull. 2022, 175, 113323. [Google Scholar] [CrossRef] [PubMed]
  5. Fu, Z.; Wang, J. Current practices and future perspectives of microplastic pollution in freshwater ecosystems in China. Sci. Total Environ. 2019, 691, 697–712. [Google Scholar] [CrossRef]
  6. Tumwesigye, E.; Nnadozie, C.F.; Akamagwuna, F.C.; Noundou, X.S.; Nyakairu, G.W.; Odume, O.N. Microplastics as vectors of chemical contaminants and biological agents in freshwater ecosystems: Current knowledge status and future perspectives. Environ. Pollut. 2023, 330, 121829. [Google Scholar] [CrossRef]
  7. Liu, S.; Shi, J.; Wang, J.; Dai, Y.; Li, H.; Li, J.; Zhang, P. Interactions Between Microplastics and Heavy Metals in Aquatic Environments: A Review. Front. Microbiol. 2021, 12, 652520. [Google Scholar] [CrossRef]
  8. Benson, N.; Agboola, O.; Fred-Ahmadu, O.; De-la-Torre, G.; Oluwalana, A.; Williams, A. Micro(nano)plastics Prevalence, Food Web Interactions, and Toxicity Assessment in Aquatic Organisms: A Review. Front. Mar. Sci. 2022, 9, 851281. [Google Scholar] [CrossRef]
  9. Rojas-Luna, R.A.; Oquendo-Ruiz, L.; García-Alzate, C.A.; Arana, V.A.; García-Alzate, R.; Trilleras, J. Identification, Abundance, and Distribution of Microplastics in Surface Water Collected from Luruaco Lake, Low Basin Magdalena River, Colombia. Water Res. 2023, 15, 344. [Google Scholar] [CrossRef]
  10. Migwi, F.K.; Ogunah, J.A.; Kiratu, J.M. Occurrence and Spatial Distribution of Microplastics in the Surface Waters of Lake Naivasha, Kenya. Environ. Toxicol. Chem. 2020, 39, 765–774. [Google Scholar] [CrossRef]
  11. Ross, M.S.; Loutan, A.; Groeneveld, T.; Molenaar, D.; Kroetch, K.; Bujaczek, T.; Kolter, S.; Moon, S.; Huynh, A.; Khayam, R.; et al. Estimated discharge of microplastics via urban stormwater during individual rain events. Front. Environ. Sci. 2023, 11, 1090267. [Google Scholar] [CrossRef]
  12. Egessa, R.; Nankabirwa, A.; Ocaya, H.; Pabire, W.G. Microplastic pollution in surface water of Lake Victoria. Sci. Total Environ. 2020, 741, 140201. [Google Scholar] [CrossRef]
  13. Egessa, R.; Nankabirwa, A.; Basooma, R.; Nabwire, R. Occurrence, distribution and size relationships of plastic debris along shores and sediment of northern Lake Victoria. Environ. Pollut. 2020, 257, 113442. [Google Scholar] [CrossRef] [PubMed]
  14. Kakooza, B. Assessment of the Occurrence, Abundance and Characteristics of microplastics in Nakivubo Channel and the Murchison Bay of Lake Victoria. Master’s Thesis, Makerere University, Kampala, Uganda, 2022. [Google Scholar]
  15. Biginagwa, J.F.; Mayoma, S.B.; Shashoua, Y.; Syberg, K.; Khan, F.R. First evidence of microplastics in the African great lakes: Recovery from Lake Victoria Nile perch and Nile tilapia. J. Great Lakes Res. 2016, 42, 146–149. [Google Scholar] [CrossRef]
  16. Gathu, S.W.; Kitaka, N.K.; Sitoki, L.M.; Otachi, E.O. Levels and Classification of Microplastics and Their Impact on the Wellbeing of Selected Commercially Important Fish Species in Kisumu Bay, Lake Victoria. Bull. Environ. Contam. Toxicol. 2024, 113, 65. [Google Scholar] [CrossRef]
  17. Onyango, J.; Huang, J.; Babu, K.; Njuguna, S.; Wanzala, W.; Yan, X. Evaluating the Interaction of Plant Communities with Microplastics Found in Water and Soil Sediments of Lake Victoria. Research Square. Available online: https://doi.org/10.21203/rs.3.rs-4513150/v1 (accessed on 13 March 2025).
  18. Kayima, J.; Kyakula, M.; Komakech, W.; Echimu, S.P. A study of the degree of Pollution in Nakivubo Channel, Kampala, Uganda. J. Appl. Sci. Environ. Manag. 2008, 12, 93–98. [Google Scholar] [CrossRef]
  19. Fuhrimann, S.; Stalder, M.; Winkler, M.S.; Niwagaba, C.B.; Babu, M.; Masaba, G.; Kabatereine, N.B.; Halage, A.A.; Schneeberger, P.H.H.; Utzinger, J.; et al. Microbial and chemical contamination of water, sediment and soil in the Nakivubo wetland area in Kampala, Uganda. Environ. Monit. Assess. 2015, 18, 475. [Google Scholar] [CrossRef]
  20. Mbabazi, J.; Kwetegyeka, J.; Ntale, M.; Wasswa, J. Ineffectiveness of Nakivubo wetland in filtering out heavy metals from untreated Kampala urban effluent prior to discharge into Lake Victoria, Uganda. Afr. J. Agric. Res. 2010, 5, 3431–3439. [Google Scholar]
  21. John, P.H.; Johnson, F.A.; Sutcliffe, P. Integrating Float Method of Discharge Measurement. Proc. Inst. Civ. Eng. 1978, 65, 569–588. [Google Scholar] [CrossRef]
  22. Collicutt, B.; Juanes, F.; Dudas, S.E. Microplastics in juvenile Chinook salmon and their nearshore environments on the east coast of Vancouver Island. Environ. Pollut. 2019, 244, 135–142. [Google Scholar] [CrossRef]
  23. Masura, J.; Baker, J.; Foster, G.; Arthur, C.; Herring, C. Laboratory Methods for the Analysis of Microplastics in the Marine Environment: Recommendations for Quantifying Synthetic Particles in Waters and Sediments; NOAA Technical Memorandum NOSOR&R-48; NOAA Marine Debris Division: Silver Spring, MD, USA, 2015. [Google Scholar]
  24. Nuelle, M.; Dekiff, J.H.; Remy, D.; Fries, E. A new analytical approach for monitoring microplastics in marine sediments. Environ. Pollut. 2014, 184, 161–169. [Google Scholar] [CrossRef]
  25. Viršek, M.; Palatinus, A.; Koren, Š.; Peterlin, M.; Horvat, P.; Kržan, A. Protocol for microplastics sampling on the sea surface and sample analysis. J. Vis. Exp. 2016, 118, e55161. [Google Scholar]
  26. Hendrickson, E.; Minor, E.C.; Schreiner, K. Microplastic Abundance and Composition in Western Lake Superior As Determined via Microscopy, Pyr-GC/MS, and FTIR. Environ. Sci. Technol. 2018, 52, 1787–1796. [Google Scholar] [CrossRef] [PubMed]
  27. Akhbarizadeh, R.; Moore, F.; Keshavarzi, B. Investigating a probable relationship between microplastics and potentially toxic elements in fish muscles from northeast of Persian Gulf. Environ. Pollut. 2018, 232, 154–163. [Google Scholar] [CrossRef]
  28. Daana, L.; Kanhai, K.; Officer, R.; Lyashevska, O.; Thompson, R.C.; Connor, I.O. Microplastic abundance, distribution and composition along a latitudinal gradient in the Atlantic Ocean. Mar. Pollut. Bull. 2017, 115, 307–314. [Google Scholar]
  29. Akhbarizadeh, R.; Moore, F.; Keshavarzi, B. Investigating microplastics bioaccumulation and biomagnification in seafood from the Persian Gulf: A threat to human health? Food Add. Contam. 2019, 36, 1696–1708. [Google Scholar] [CrossRef]
  30. Zhang, X.; Chen, J.; Li, J. The removal of microplastics in the wastewater treatment process and their potential impact on anaerobic digestion due to pollutants association. Chemosphere 2020, 251, 126360. [Google Scholar] [CrossRef]
  31. Treilles, R.; Gasperi, J.; Gallard, A.; Saad, M.; Dris, R.; Partibane, C.; Breton, J.; Tassin, B. Microplastics and microfibers in urban runoff from a suburban catchment of Greater Paris. Environ. Pollut. 2021, 287, 117352. [Google Scholar] [CrossRef]
  32. Hitchcock, J.N. Storm events as key moments of microplastic contamination in aquatic ecosystems. Sci. Total Environ. 2020, 734, 139436. [Google Scholar] [CrossRef]
  33. Ochoa, L.; Chan, J.; Auguste, C.; Arbuckle-Keil, G.; Fahrenfeld, N.L. Stormwater runoff microplastics: Polymer types, particle size, and factors controlling loading rates. Sci. Total Environ. 2024, 929, 172485. [Google Scholar] [CrossRef]
  34. Boni, W.; Arbuckle-Keil, G.; Fahrenfeld, N.L. Inter-storm variation in microplastic concentration and polymer type at stormwater outfalls and a bioretention basin. Sci. Total Environ. 2022, 809, 151104. [Google Scholar] [CrossRef] [PubMed]
  35. Monira, S.; Roychand, R.; Bhuiyan, M.A.; Hai, F.I.; Pramanik, B.K. Identification, classification and quantification of microplastics in road dust and stormwater. Chemosphere 2022, 299, 134389. [Google Scholar] [CrossRef] [PubMed]
  36. Bbosa, N.B.; Oyoo, W.S.; Vicent, M.O.; Atieno, A.D. Physicochemical parameters and magnetic speciation of Iron in Nakivubo Channel and Lake Victoria waters. Lakes Reserv. 2009, 14, 127–137. [Google Scholar] [CrossRef]
  37. Mugume, S.N.; Gomez, D.E.; Fu, G.; Farmani, R.; Butler, D. A global analysis approach for investigating structural resilience in urban drainage systems. Water Res. 2015, 81, 15–26. [Google Scholar] [CrossRef] [PubMed]
  38. Omara, T.; Benetková, B.M.; Rosenau, T.; Nagawa, C.B.; Böhmdorfer, S. Microplastic analysis by complementary analytical techniques: μ-FTIR and pyrolysis GC-MS. In Proceedings of the ANAKON 2025, Leipzig, Germany, 10–13 March 2025; Leipzig University: Leipzig, Germany. [Google Scholar]
  39. Primus, A.; Azman, S. Quantification and Characterisation of Microplastics in Fish and Surface Water at Melayu River, Johor. IOP Conf. Ser. Mat. Sci. Eng. 2022, 1229, 012014. [Google Scholar] [CrossRef]
  40. Gago, J.; Carretero, O.; Filgueiras, A.V.; Viñas, L. Synthetic microfibers in the marine environment: A review on their occurrence in seawater and sediments. Mar. Pollut. Bull. 2018, 127, 365–376. [Google Scholar] [CrossRef]
  41. Yusuf, M.A.; Yaqin, K.; Wicaksono, E.A.; Tahir, A. Abundance and characteristics of microplastics in Lake Towuti, East Luwu, South Sulawesi. AACL Bioflux. 2022, 15, 621–631. [Google Scholar]
  42. Courtene-Jones, W.; Quinn, B.; Gary, S.F.; Mogg, A.O.M.; Narayanaswamy, B.E. Microplastic pollution identified in deep-sea water and ingested by benthic invertebrates in the Rockall Trough, North Atlantic Ocean. Environ. Pollut. 2017, 231, 271–280. [Google Scholar] [CrossRef]
  43. Koros, V.; Kitetu, J.; Kebenei, S. Influence of Polythene Bag Alternatives on Compliance to Environmental Legislation on Polythene Bag Ban in Rongai Sub-County, Nakuru County, Kenya. OALib J. 2019, 6, 1–10. [Google Scholar] [CrossRef]
  44. Behuria, P. The Comparative Political Economy of Plastic Bag Bans in East Africa: Why Implementation Has Varied in Rwanda, Kenya and Uganda; GDI Working Paper 2019-037; The University of Manchester: Manchester, UK, 2019. [Google Scholar]
  45. Albignac, M.; de Oliveira, T.; Landebrit, L.; Miquel, S.; Auguin, B.; Leroy, E.; Emmanuelle, M.; Mingotaud, A.F.; Halle, A. Tandem mass spectrometry enhances the performances of pyrolysis-gas chromatography-mass spectrometry for microplastic quantification. J. Anal. Appl. Pyrol. 2023, 172, 105993. [Google Scholar] [CrossRef]
  46. Gomiero, A.; Øysæd, K.B.; Palmas, L.; Skogerbø, G. Application of GCMS-pyrolysis to estimate the levels of microplastics in a drinking water supply system. J. Hazard. Mat. 2021, 416, 125708. [Google Scholar] [CrossRef] [PubMed]
  47. Fernández-González, V.; Andrade-Garda, J.M.; López-Mahía, P.; Muniategui-Lorenzo, S. Misidentification of PVC microplastics in marine environmental samples. TrAC 2022, 153, 116649. [Google Scholar] [CrossRef]
  48. Schütze, B.; Thomas, D.; Kraft, M.; Brunotte, J.; Kreuzig, R. Comparison of different salt solutions for density separation of conventional and biodegradable microplastic from solid sample matrices. Environ. Sci. Pollut. Res. Int. 2022, 29, 81452–81467. [Google Scholar] [CrossRef] [PubMed]
  49. Mutesi, S. Microplastic Pollution of Water and Fish from Lake Victoria and the Potential Water Decontamination Methods. Master’s Thesis, Makerere University, Kampala, Uganda, 2023. [Google Scholar]
  50. Omara, T.; Benetková, B.M.; Sumerskii, I.; Rosenau, T.; Nagawa, C.B.; Böhmdorfer, S. Spatiotemporal dynamics and trophic transfer of microplastics in some endemic fish species of Lake Victoria. In Proceedings of the MICROPLASTICdays, Ljubljana, Slovenia, 25–27 March 2025; University of Ljubljana: Ljubljana, Slovenia, 2025. [Google Scholar]
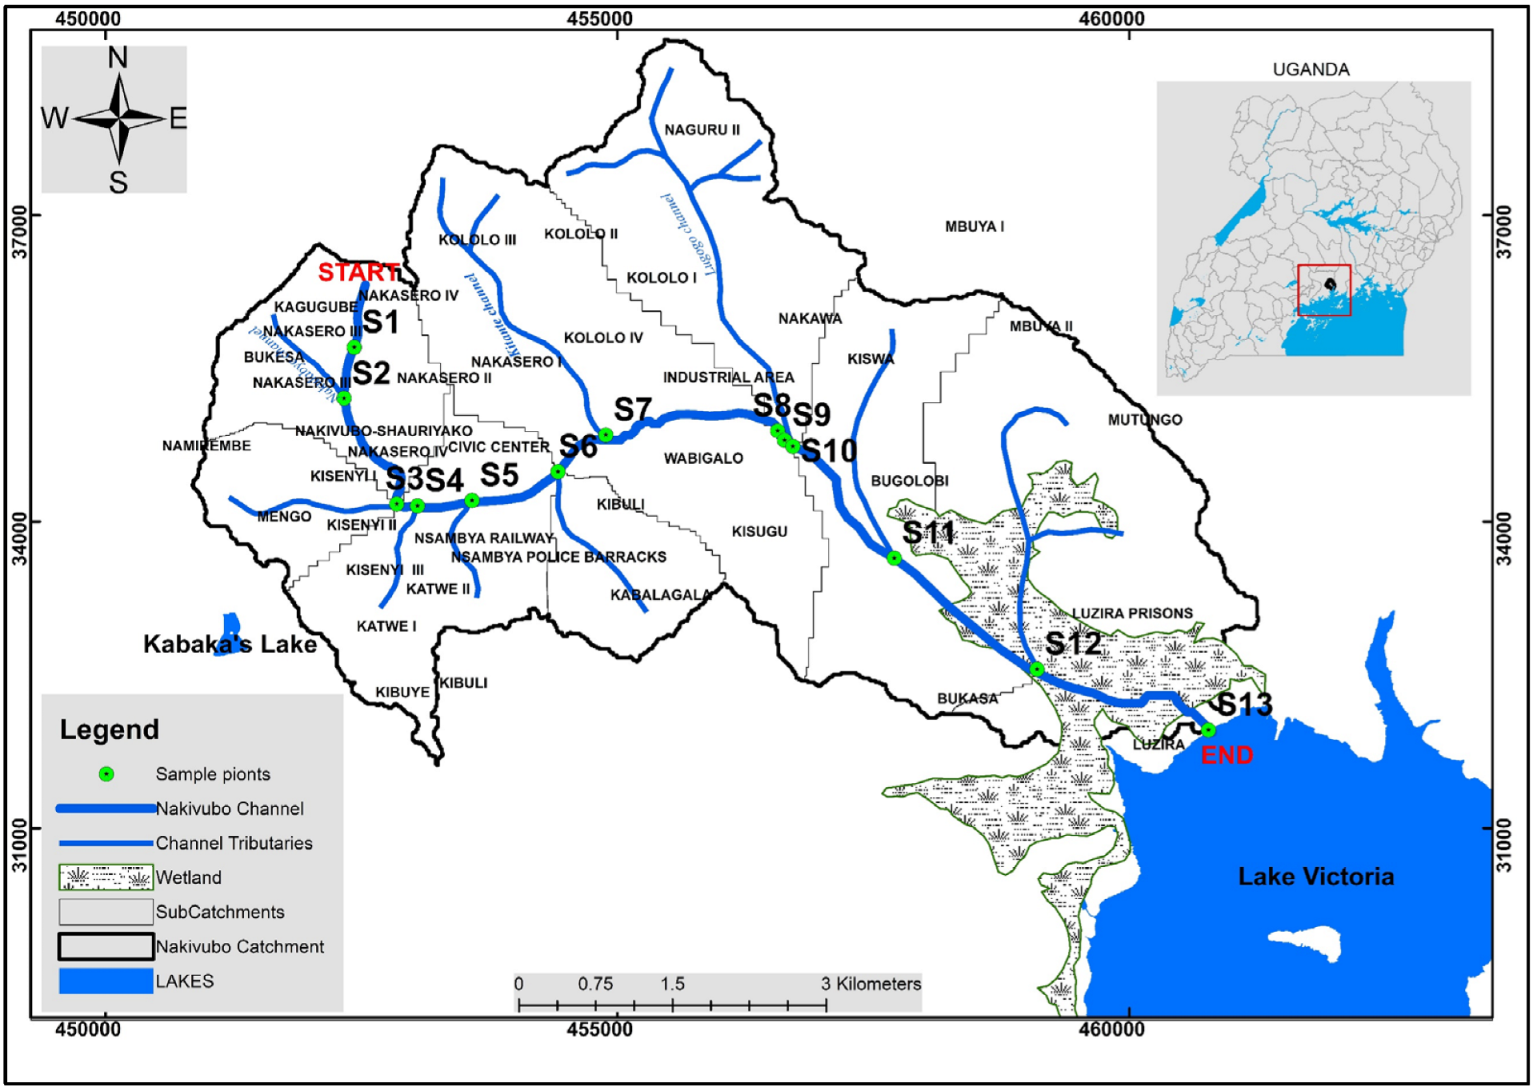
Figure 1. Map showing the location of sampling sites in the Nakivubo catchment.
Microplastics 04 00021 g001
Figure 2. Spatiotemporal distribution of microplastics in Nakivubo catchment, Uganda: (a) dry season, (b) onset of rains, and (c) wet season. Means of different sites carrying different letters in a given period are statistically significant (p < 0.05).
Microplastics 04 00021 g002
Figure 3. Evidence of improper waste management observed in some parts of Nakivubo catchment: (a) plastic collection site, (b) car washing/motorcycle repair, (c) solid waste dump site-Kasanvu slum area, (d) wastewater treatment plant discharging effluent directly into the Nakivubo channel, (e) poor waste disposal around Owino market, and (f) domestic waste discharged directly into the Nakivubo channel.
Microplastics 04 00021 g003
Figure 4. Micrographs of microplastics in surface water of Nakivubo catchment: (a) filaments and fibers, (b) filament, and (c) foam. All micrographs were captured at ×30.
Microplastics 04 00021 g004
Figure 5. Parallel index plot of the polymer composition of microplastics from the Nakivubo catchment. PE = Polyethylene, PP = Polypropylene, PVC = Polyvinyl chloride. Only particles with matches >70% or 60–70% similarity (following individual inspection for evidence of characteristic peaks of the polymers) are shown.
Microplastics 04 00021 g005
Figure 6. FTIR spectra of (a) polyethylene and (b) polypropylene in the samples matched with reference library spectra.
Microplastics 04 00021 g006
Table 1. Comparison of microplastic abundances in water from Nakivubo catchment with previous studies in urban drainage channels and catchments.
Area (Country)Abundance (Particles/m3) aAuthors
Nakivubo Catchment (Uganda)1569–2140This study
Calgary City, Canada700–2,004,000Ross et al. [11]
New Jersey (USA)410–990Ochoa et al. [33]
New Jersey (USA)300–800Boni et al. [34]
Nakivubo Channel (Uganda)688Kakooza [14]
Wetlands (Australia) 26,000–17,000Monira et al. [35]
Phu Loc Channel (Vietnam)630–3840Tran-Nguyen et al. [4]
Sucy-en-Brie Catchment (France)3000–129,000Treilles et al. [31]
a Units have been harmonized to allow for comparison among studies.
Table 2. Mean flow rates and estimated microplastic fluxes in Nakivubo catchment.
Sampling SitesMean Flow Rate (m3/s)Mean Flux (Million Particles/Day)
S10.39 ± 0.0264.443 ± 3.331
S20.23 ± 0.0828.004 ± 9.657
S30.13 ± 0.0959.990 ± 42.509
S40.31 ± 0.2539.735 ± 32.280
S50.21 ± 0.1229.570 ± 17.251
S61.11 ± 1.46135.067 ± 177.302
S70.82 ± 0.7048.999 ± 41.664
S80.56 ± 0.3128.258 ± 15.550
S100.58 ± 0.3426.053 ± 15.340
S110.49 ± 0.1022.481 ± 4.584
S120.67 ± 0.51118.306 ± 90.576
S132.27 ± 1.35293.957 ± 174.636
Table 3. Monthly rainfall data from the Mengo secondary station (TA00650) in 2022.
MonthPrecipitation (mm)
January8.65
February60.72
March144.72
April156.61
May166.66
June74.79
July21.60
August142.19
September277.44
October111.97
November233.36
December180.75
Disclaimer/Publisher’s Note: The statements, opinions and data contained in all publications are solely those of the individual author(s) and contributor(s) and not of MDPI and/or the editor(s). MDPI and/or the editor(s) disclaim responsibility for any injury to people or property resulting from any ideas, methods, instructions or products referred to in the content.