Article

GAS2 Upregulation Is a Targetable Vulnerability in Chronic Myeloid Leukemia

by
Lizbeth A. Ramirez-Guzman
1,2,†,
Wenjing Huang
1,†,
John J. Cole
3 and
Heather G. Jørgensen
1,*
1
Paul O’Gorman Leukemia Research Centre, School of Cancer Sciences, College of Medical, Veterinary and Life Sciences, University of Glasgow, 21 Shelley Road, Glasgow G12 0ZD, UK
2
Division of Inflammatory Stress in Stem Cells, Heidelberg Institute for Stem Cell Technology and Experimental Medicine, German Cancer Research Center (DKFZ), 69120 Heidelberg, Germany
3
School of Infection and Immunity, College of Medical, Veterinary and Life Sciences, University of Glasgow, Sir Graeme Davies Building, 120 University Place, Glasgow G12 8TA, UK
*
Author to whom correspondence should be addressed.
These authors contributed equally to this work.
Int. J. Transl. Med. 2024, 4(2), 354-368; https://doi.org/10.3390/ijtm4020023
Submission received: 11 March 2024 / Revised: 22 April 2024 / Accepted: 12 June 2024 / Published: 15 June 2024

Abstract

:
Tyrosine kinase inhibitors (TKIs), such as imatinib (IM), increase the survival of chronic myeloid leukemia (CML) patients but do not eradicate the disease as leukemia stem cells (LSCs) with primitive and quiescent signatures persist after TKI monotherapy, driving disease relapse. Using single-cell publicly available transcriptomic data, we investigated potentially tractable vulnerabilities in this persistent CML LSC population. GAS2 is significantly upregulated when comparing LSCs from CML patients in remission to normal hematopoietic stem cells (HSCs). A topoisomerase IIβ inhibitor, XK469, was proposed to be repurposed as a candidate small-molecule inhibitor of GAS2, and its effect was investigated in cell line models in combination with IM in vitro. Alone, XK469 could induce cell cycle arrest/differentiation in CML cells and reduce cell viability. In combination with IM, XK469 significantly increased CML cell apoptosis and reduced CML cell clonogenic capacity. These results suggest that GAS2 is a targetable vulnerability in CML LSCs and that using XK469 in combination with TKI potentiates the sensitivity of CML cells to IM.

1. Introduction

Chronic myeloid leukemia (CML) is a blood cancer characterized by an accumulation of mature white blood cells in blood and bone marrow [1]. The hallmark of CML is the presence of the BCR::ABL1 fusion oncogene, which transforms normal hematopoietic stem cells (HSCs) into leukemia stem cells (LSCs). This fusion oncogene derives from a reciprocal translocation between chromosomes 9 and 22, resulting in the derivative of chromosome 22 known as the Philadelphia (Ph) chromosome [2]. In cells that are Ph+, the tyrosine kinase activity of the BCR::ABL1 protein is always active, driving uncontrolled cell proliferation and suppression of apoptosis [3].
The current standard treatment for CML is imatinib mesylate (IM) [3], a tyrosine kinase inhibitor (TKI) that blocks the ATP-binding site of BCR::ABL1 [2]. However, despite TKIs successfully controlling the disease, 50–60% of patients attempting treatment-free remission (TFR) will relapse upon TKI discontinuation [1]. A small population of residual LSCs that remain after TKI treatment has been attributed as the major contributor to relapse [4]. These persistent LSCs have been characterized as quiescent, primitive cells with leukemia-initiating capacity [5,6,7]. The insensitivity of these cells to TKIs suggests that they do not rely on BCR::ABL1 activity to survive [1] and that there are deregulated genes and pathways that promote CML LSC survival and proliferation in a BCR::ABL1-independent manner [2].
It has been previously reported that the growth-arrest-specific 2 (GAS2) gene is upregulated in CML [8] and significantly differentially expressed in BCR::ABL1+ LSCs when comparing them with the normal HSCs or BCR::ABL1 stem cells (SCs) of CML patients [6]. GAS2 protein is a caspase-3 substrate that modulates cellular functions such as apoptosis, cell cycle and calpain2 activity [8]. It has been found that p53-dependent apoptosis is regulated by GAS2 through the inhibition of calpain2 and that GAS2-mediated calpain regulation controls the levels of β-catenin [9]. Moreover, GAS2 has been shown to contribute to BCR::ABL1+ LSC growth [10]. These findings suggest that targeting GAS2 and/or its related pathways represents a potential novel therapeutic strategy to improve CML management.
The phenoxypropionic acid derivative 2-{4-[(7-chloro-2-quinoxalinyl)oxy]phenoxy}propionic acid (XK469), a topoisomerase IIβ inhibitor, has been reported to influence GAS2 expression in colorectal cancer [11]. Moreover, XK469 has been tested in human clinical trials for solid tumors [12,13] and refractory acute leukemia [14]; therefore, its previous safe use in humans means it could be potentially repurposed to target GAS2 in CML.
In this study, we used publicly available datasets detailing single-cell transcriptomic data from CML patients at diagnosis and after TKI treatment to find disease-specific druggable targets for insensitive CML-LSCs, finding GAS2 as a potentially tractable vulnerability. From our literature search, we proposed to test a topoisomerase IIβ inhibitor as a candidate small-molecule GAS2 inhibitor in combination with IM to treat CML cells in vitro.

2. Materials and Methods

2.1. Cell Lines and Culture Medium

Authenticated K562 and KCL-22 cell lines were obtained from the Paul O’Gorman Leukemia Research Centre hematological cell research bank and maintained in RPMI 1640 medium (Thermo Fisher Scientific, Inchinnan, Renfrew, Scotland) supplemented with 1% (v/v) penicillin–streptomycin, 10% (v/v) fetal bovine serum and 2 mM L-glutamine. K562 is a human erythroleukemia line established from a 53-year-old female with CML in terminal blast crisis, according to the American Type Culture Collection (ATCC). KCL-22 was established from a 32-year-old female with CML in blast crisis, according to the German Collection of Microorganisms and Cell Cultures (DSMZ). Both cell lines harbor TP53 mutations [15].

2.2. Single-Cell Transcriptomics Dataset

Publicly available single-cell RNA sequencing data of CML patients at diagnosis and in remission after TKI treatment were used to evaluate the differentially expressed genes in persistent LSCs. The dataset analyzed is available at the Gene Expression Omnibus (GEO), with the accession code GSE76312 [6].

2.3. Differential Expression Analysis

Differential gene expression from RNAseq data was calculated using DESeq2 [16], applying the false discovery rate (Benjamini–Hochberg adjustment) to adjust the p-value for multiple comparisons. Differentially expressed genes were selected based on the absolute log2 fold change of ≥1 and adjusted p-value of <0.05. Top 10 genes with their corresponding p and p-adjusted values were obtained and plotted using the online tool Searchlight2 [17].

2.4. Cell Viability Quantification

Cell numbers were counted by hemocytometer using trypan blue dye exclusion [18] (Sigma-Aldrich Co., Ltd., Gillingham, Dorset, UK), or resazurin assay [19] using 10 μL of 0.5 μM resazurin (Sigma-Aldrich) per 100 μL of sample according to manufacturer’s instructions (Sigma-Aldrich). For experiments involving treatment, 2 × 10⁵ cells/mL K562 and 1 × 10⁵ cells/mL KCL-22 cells were plated and cultured for 72 h with concentrations ranging from 0.3 to 60 μM XK469 (racemic free acid, NSC 697887, Sigma-Aldrich) and/or 10 to 3000 nM IM (Stratec Scientific Ltd., Cambridge, Ely, UK), both diluted stocks reconstituted in DMSO. In combination experiments, both drugs were added simultaneously.

2.5. Apoptosis Assay by Flow Cytometry

Cells treated for 72 h with IM (10 to 3000 nM) and/or XK469 (0.3 to 60 μM) were stained with 2 μL Annexin V-FITC (BD Biosciences, Wokingham, Berkshire, UK) and 10 μL BD ViaProbe (BD Biosciences) plus 88 μL 1X Hank’s Balanced Salt Solution (HBSS) (BD Biosciences) and incubated in the dark for 15 min at room temperature. Cells were studied by flow cytometry on a BD FACSCanto II cell analyzer (BD Biosciences) and data were analyzed using FlowJo software (version 10) [19].

2.6. Cell Morphology Visualization

Cell smears were prepared according to manufacturer’s instructions by centrifugation in Shandon Cytospin 4 (Thermo Fisher Scientific) at 450 rpm for 5 min using 100 μL cell suspension from untreated and XK469-treated K562 and KCL-22 cells. Slides were stained with May–Grünwald (Sigma Aldrich) solution and Giemsa dye (Honeywell Analytics Ltd., Poole, Dorset, UK) diluted 1 in 20 in PBS and mounted with Mounting Medium Pertex® HistoLab (Histolab Products AB, Västra Frölunda, Sweden).

2.7. RNA Extraction

RNA was extracted from 1 × 10⁵ K562 cells after 24 h treatment with vehicle (DMSO), XK469 (50 μM) or 10, 100 or 1000 nM IM, or the combination of IM + XK469. RNeasyTM mini Kit (Qiagen, Manchester, UK) was used according to manufacturer’s instructions and mRNA eluted with RNase free water (Qiagen). RNA quantification was performed by NanoDrop™ Spectrophotometer (Thermo Fisher Scientific) using OD at 260/280 nm.

2.8. cDNA Preparation and qPCR

High-capacity cDNA reverse transcription kit (Thermo Fisher Scientific) was used in combination with RNaseOUT™ ribonuclease inhibitor (Invitrogen Ltd., Paisley, Scotland, UK) for cDNA preparation according to manufacturer’s specifications as previously described [11]. qPCR was performed using PowerTrack™ SYBR™ Green Master Mix (Thermo Fisher Scientific) and QuantStudio™ 7 Real-Time PCR system (Thermo Fisher Scientific) according to manufacturer’s protocol. Gene-specific primers were used for the analysis of GAS2 expression (Supplementary Table S1). Online software Primer-BLAST 2.13.0 (https://www.ncbi.nlm.nih.gov/tools/primer-blast/, accessed on 8 July 2022) and Primer3-web 2.6.1 (https://primer3.ut.ee/, accessed on 8 July 2022) were used for primer design.

2.9. Colony-Forming Cell (CFC) Assay

K562 cells were cultured with vehicle (DMSO), XK469 (50 μM) or 10, 100 or 1000 nM IM, or the combination of IM + XK469 for 96 h and 1000 cells plated in 3 mL of MethoCult™ H4034 Optimum Methylcellulose medium (Stemcell Technologies, Cambridge, UK) with the number of colonies determined after 10 days as previously described [20].

2.10. Synergy Calculation

Combination index (CI) was calculated using Bliss Independence approach [19] using Equation (1).
E I M + E X K 469 ( E I M   ×   E X K 469 ) E c o m b o
where
E I M = effect of IM alone;
E X K 469 = effect of XK469 alone;
E c o m b o = effect of drug combination.
Data were normalized to vehicle (DMSO) control. In the case of flow cytometry results, percentage of total apoptosis, or fold change in apoptosis relative to DMSO control, was used to calculate CI.

2.11. Statistical Analysis

Statistical analyses were performed using GraphPad Prism 9. Dixon’s Q-test was performed on resazurin results to discard outliers. One-way ANOVA was used to quantify the significance of the differences observed. Significant values were considered as p < 0.05. For IC50 calculation, logarithmic regression of drug (inhibitor) concentration versus normalized response (against DMSO control) was used.

3. Results

3.1. GAS2 Is Significantly Upregulated in Persistent BCR::ABL1+ LSCs after TKI Treatment

To study potential vulnerabilities in the persistent LSC population, we used the publicly available dataset GSE76312 [6], which comprises single-cell RNA seq data from 27 CML patients at diagnosis and after being treated with TKIs for 3 months up to 5 years, and 6 healthy control samples. A differential expression analysis was performed using DESeq2, comparing the cell populations defined in Table 1. Sixty-two genes were found to have a significant variation in expression between normal HSCs and BCR::ABL1+ LSCs at diagnosis and forty-three genes changed significantly in the BCR::ABL1+ LSC population after treatment compared to normal HSCs. Only nine genes were significantly differentially expressed between BCR::ABL1+ LSCs before and after treatment (Table 1).
For the analysis of potential druggable targets, the top five up- and downregulated genes from each comparison were selected based on the lowest p adj. value and the highest fold change (FC), except for the comparison between BCR::ABL1+ at diagnosis versus BCR::ABL1+ after TKI treatment, where only one upregulated gene was found. GAS2 was significantly upregulated (log2FC = 8.65, p adj. = 4.8144 × 10⁻²⁴) in BCR::ABL1+ LSCs at diagnosis compared to normal HSCs (Figure 1a). Similarly, when comparing persistent BCR::ABL1+ LSCs after TKI treatment to normal HSCs, GAS2 expression was significantly increased (log2FC = 8.34, p adj. = 2.6137 × 10⁻¹⁰) (Figure 1b). No significant change was found in GAS2 expression in BCR::ABL1+ LSCs after treatment compared to diagnosis (log2FC = −0.47, p adj. = 0.9998) (Figure 1c). None of the other genes showed consistency in their differential expression before and after treatment. Therefore, GAS2 protein was explored as the candidate druggable target in the present study.

3.2. XK469 Potentially Targets GAS2 and Increases Cell Size

The phenoxypropionic acid derivative 2-{4-[(7-chloro-2-quinoxalinyl)oxy] phenoxy}propionic acid (XK469), a topoisomerase IIβ inhibitor, has been reported to influence GAS2 expression in colorectal cancer [11]. Moreover, it was approved for Phase I clinical trials for solid tumors [12,13] and refractory acute leukemia [14]. Therefore, this compound was selected as a potential repurposed drug to target GAS2.
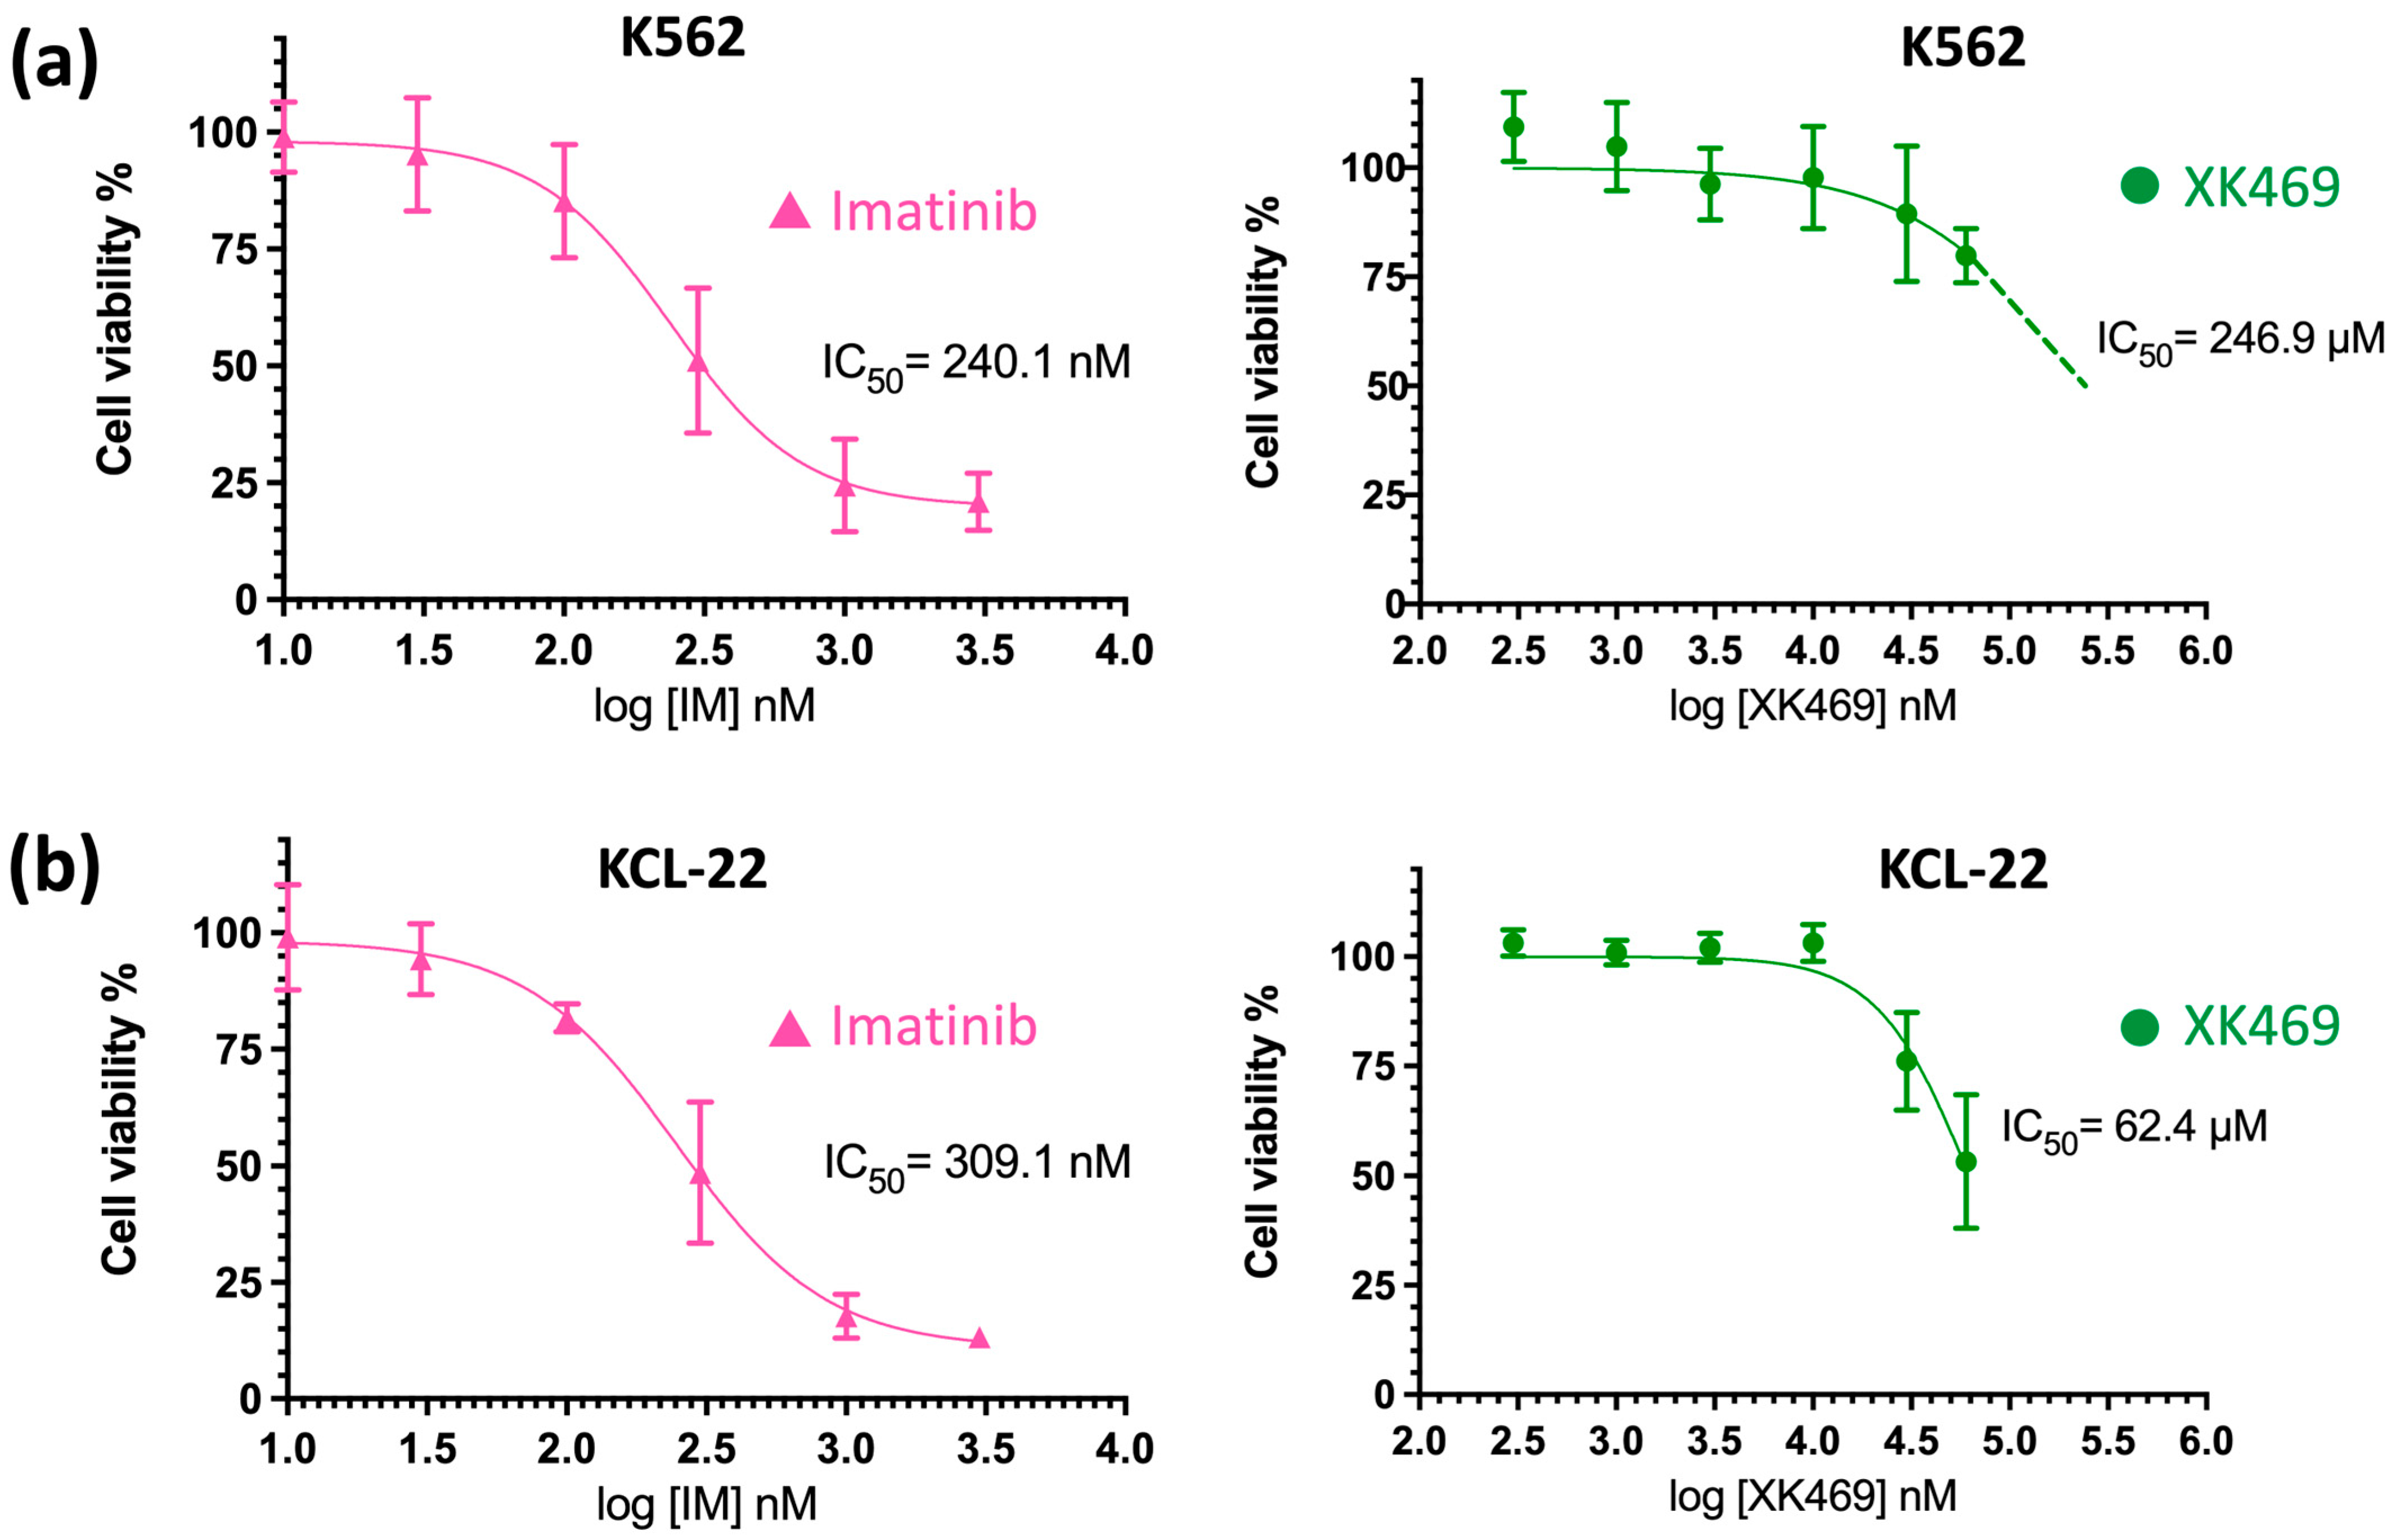
In order to perform our studies, we selected K562 and KCL-22 as models of human CML, which is a standard approach in preclinical CML research. It is acknowledged that they do not represent the chronic phase of the disease but rather blast crisis and do not have the same potency as an early progenitor cell but as BCR::ABL1 is wild type, the cell lines are responsive to TKI. Cell lines were treated for 72 h with concentrations ranging from 0.3 to 60 μM for XK469 and 10 to 3000 nM IM. A logarithmic regression of the drug versus normalized response (with respect to DMSO control) was used to establish the IC50 of each individual agent per cell line (Figure 2). In the case of IM, a 50% reduction in viability was found at 240.1 nM and 309.1 nM for K562 and KCL-22 cells, respectively. For XK469, the maximum cell inhibition was 20.1% in K562 cells and 46.7% in KCL-22 cells; therefore, a non-linear regression was used to extrapolate the response, resulting in an IC50 estimate of 246.9 μM for K562 and 62.4 μM for KCL-22.
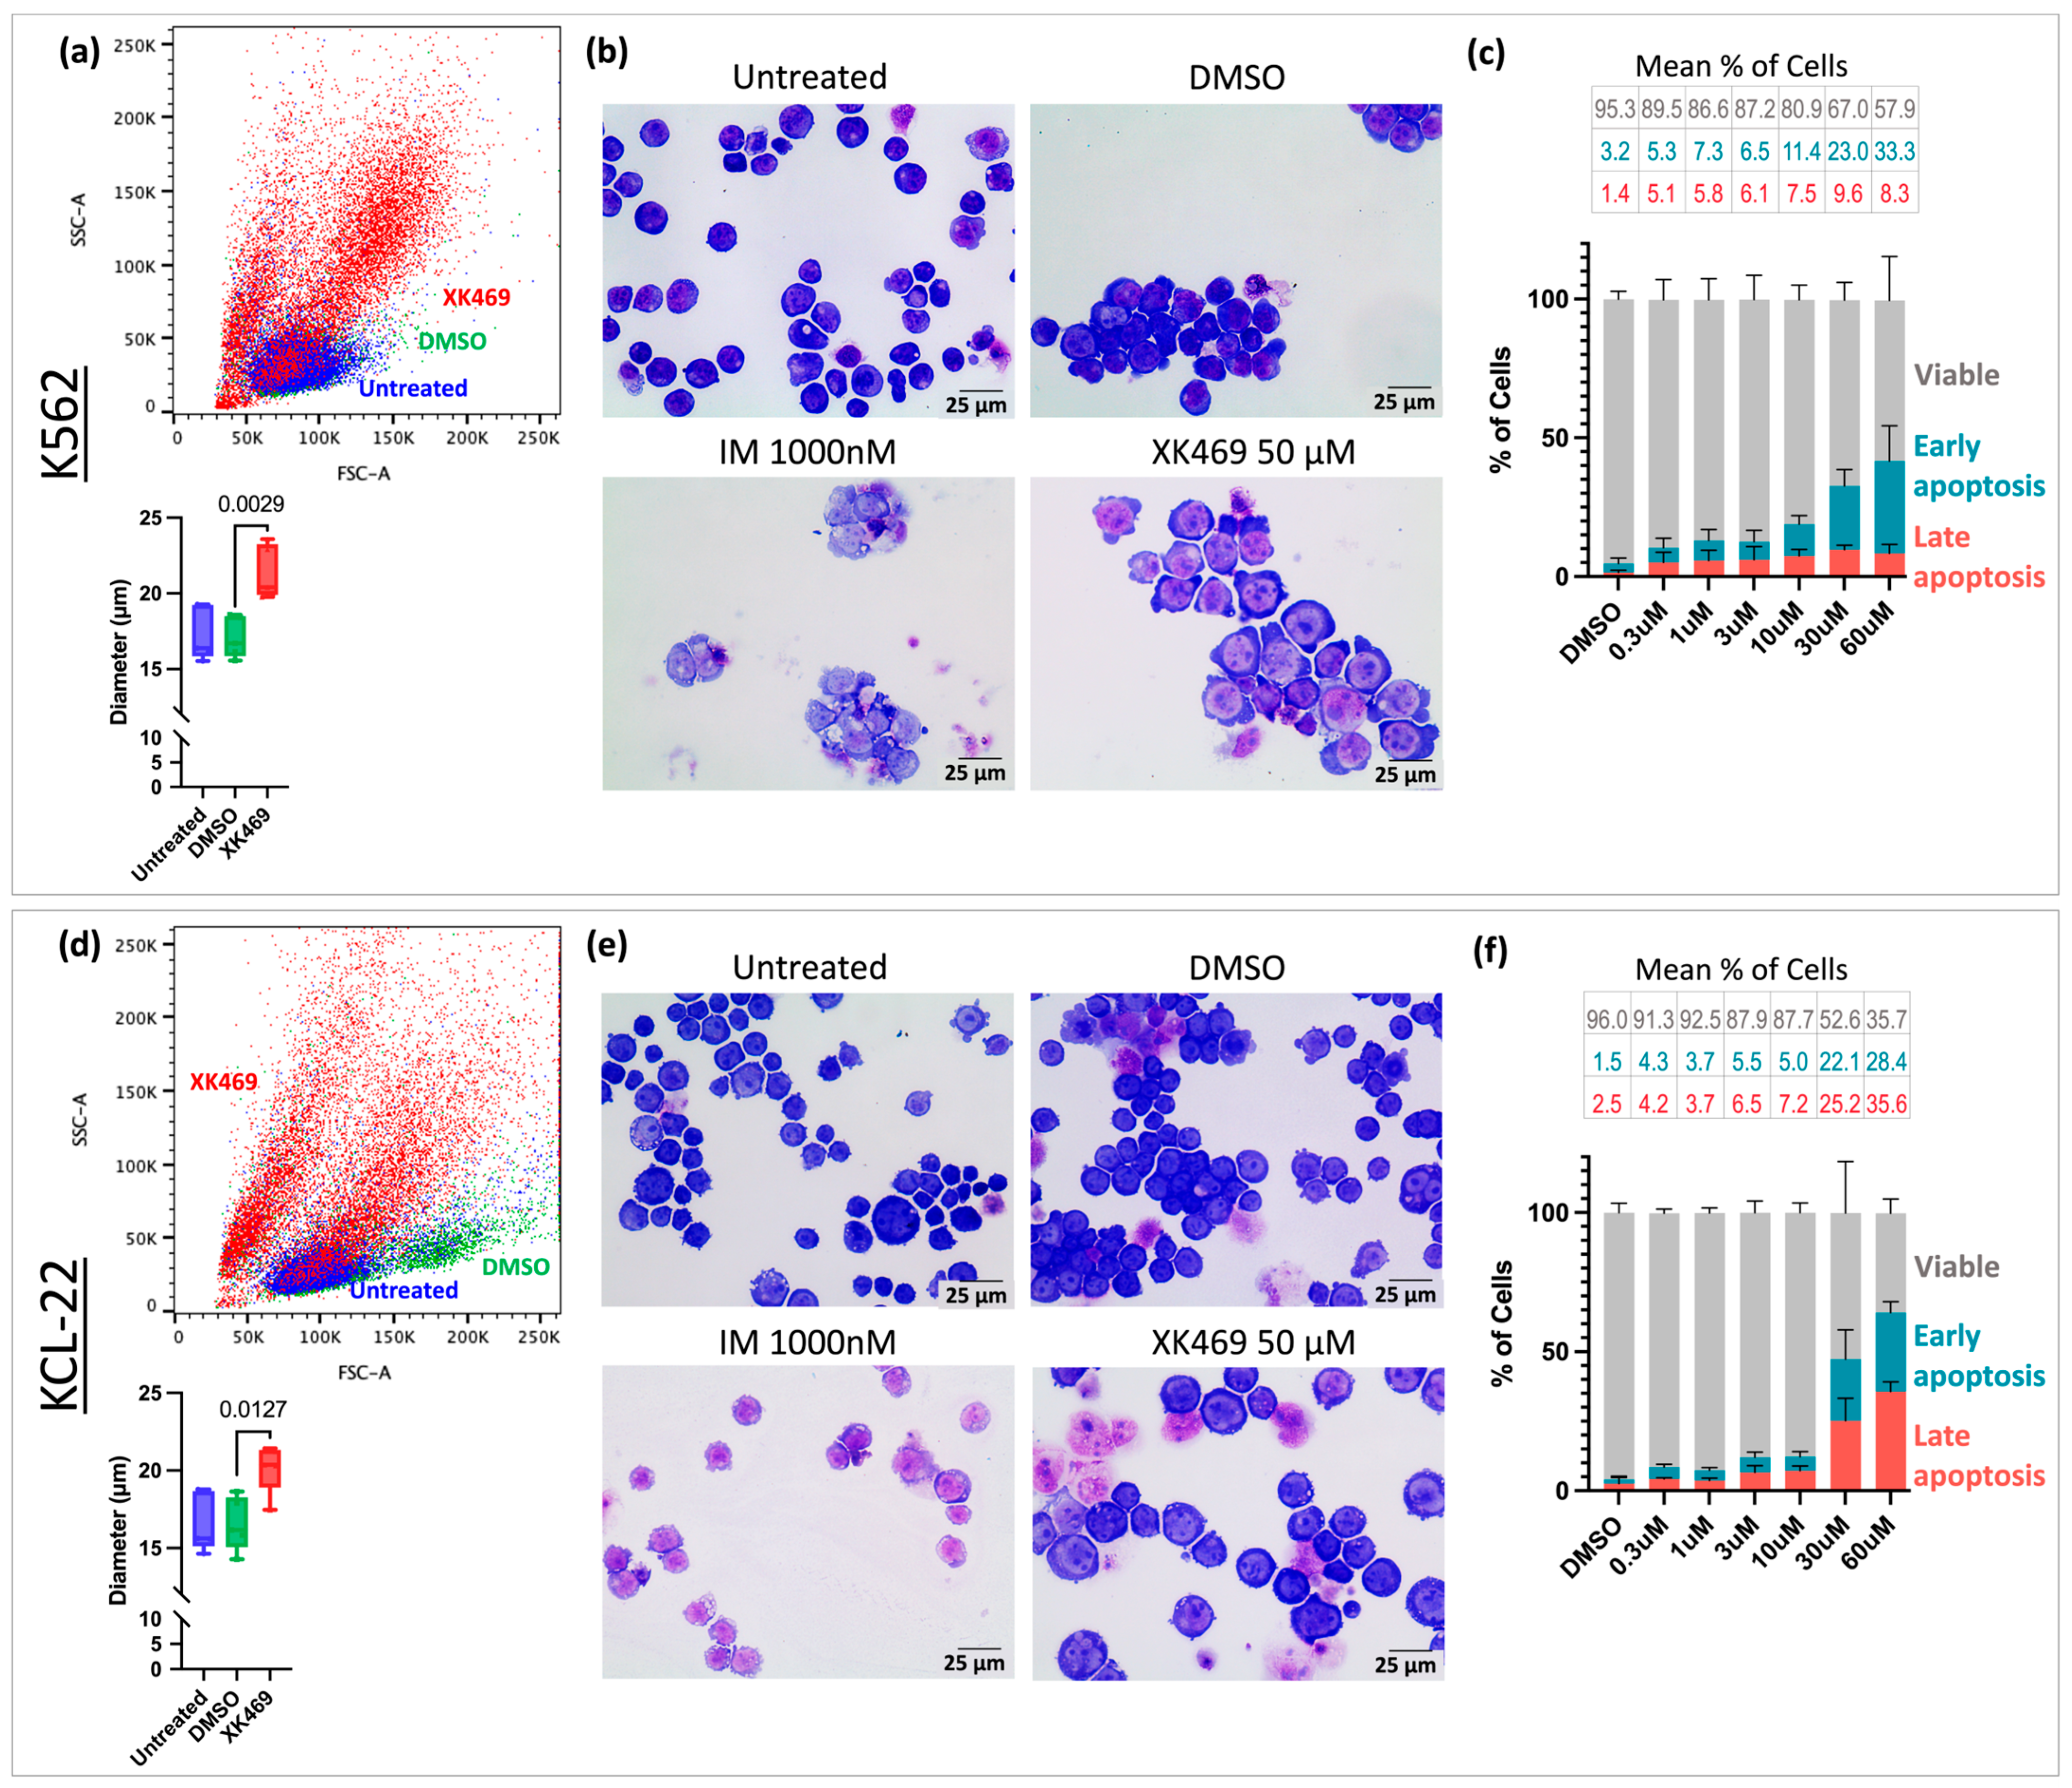
Although XK469 as a single agent was not as potent at decreasing cell viability as IM alone, interesting morphological effects of the compound were observed on both cell lines. For example, the average cell size was increased by 25% for K562 (Figure 3a; p = 0.0029) and by 22% for KCL-22 (Figure 3d; p = 0.0127) when treated with XK469. This change was also observed when cells were stained with May–Grünwald and Giemsa dyes (Figure 3b,e). Moreover, it was found by flow cytometry that after 72 h of drug exposure, 41.7% total apoptosis in K562 (Figure 3c) and 64.1% in KCL-22 (Figure 3e) was achieved, both at 60 μM XK469.

3.3. XK469 Sensitises CML Cells to IM In Vitro

To further assess the potential use of XK469 in CML, we tested it in combination with IM. As shown in Figure 2, a 50% decrease in the cell viability of KCL-22 cells was achieved with 62.4 μM XK469, whereas K562 cells were less sensitive to this drug. Synergy experiments are aimed at proving that lower concentrations of single agents in combination achieve an equal or greater response than the individual drugs at higher concentrations. We opted to use 50 μM XK469, the concentration on its IC50 curve that corresponded to approximately a 40% decrease in cell viability for the most sensitive cell line (KCL-22), to evaluate whether an effect of the drug in combination was observed, even with K562. Hence, combination experiments were set up using XK469 in a fixed concentration of 50 μM and range of concentrations of IM (10, 30, 100, 300, 1000 and 3000 nM), exposing the cells to the drugs for 72 h and analyzing the effect of the treatment through cell viability and apoptosis assays. The CI was calculated by Bliss Independence to evaluate the synergistic effect between the two drugs. This measurement allows the determination of drug interactions in a statistically relevant manner, whereby a CI value < 1 indicates synergism, CI = 1 suggests an additive effect and CI > 1 denotes antagonism.
In the case of K562, cell viability was significantly reduced with the combination compared to IM alone (Figure 4a; p = 0.0153). Although the magnitude of differences between monotherapy and combination treatment in K562 were significant, most CI values from the viability assays did not suggest a synergy effect (Figure 4a). Contrastingly, when the apoptotic effect was analyzed through flow cytometry, higher levels of early and late apoptosis were observed in K562 cells with the combination than with IM or XK469 alone (Figure 4b). To verify the observed effect, the total apoptosis values were determined (Figure 4c) and a statistical analysis was performed. The percentage of total apoptosis in cells treated with IM alone at concentrations up to 300 nM was not significantly different from those of the DMSO control. However, XK469 alone (50 μM) and IM in monotherapy at 1000 and 3000 nM induced a significant increase in total apoptosis compared to DMSO (42.7%, p = 0.0441; 69.4%, p < 0.0001; and 69.7%, p < 0.0001, respectively). Moreover, XK469 (50 μM) in monotherapy showed comparable apoptotic effects to the combinations with 10, 30 and 100 nM IM. Noticeably, a significant difference was found between XK469 monotherapy and its combination with IM at 1000 nM (p = 0.0092) and 3000 nM (p = 0.0052) (Figure 4e).
Calculation of the CI based on the fold change in apoptosis normalized to the DMSO control revealed a moderate synergistic effect of the combination of XK469 with IM at 300 and 3000 nM (CI = 0.95 and CI = 0.92, respectively) (Figure 4d). For 1000 nM IM, the combination was closer to additivity (CI = 0.97). The CI values of the three lower IM concentrations suggested antagonism (Figure 4d). Notably, when calculating the CI for each of the apoptosis experiments individually, two out of three of them showed a greater synergistic effect for IM at 300, 1000 and 3000 nM (CI ≤ 0.91).
To assess the functional clonogenic potential of remaining CML cells after treatment with XK469, K562 cells were exposed to 10, 100 and 1000 nM IM or their combination with XK469 (50 μM) for 96 h and then cultured in methylcellulose for 10 days. The colony-forming cell (CFC) rate was drastically reduced by the combination of XK469 with 10 and 1000 nM IM compared to IM alone (Figure 4f). The combination with 100 nM IM showed a spurious high rate likely due to a technical error and was therefore omitted. Despite that, a clear decreasing trend in CFC was observed in a dose-dependent manner.
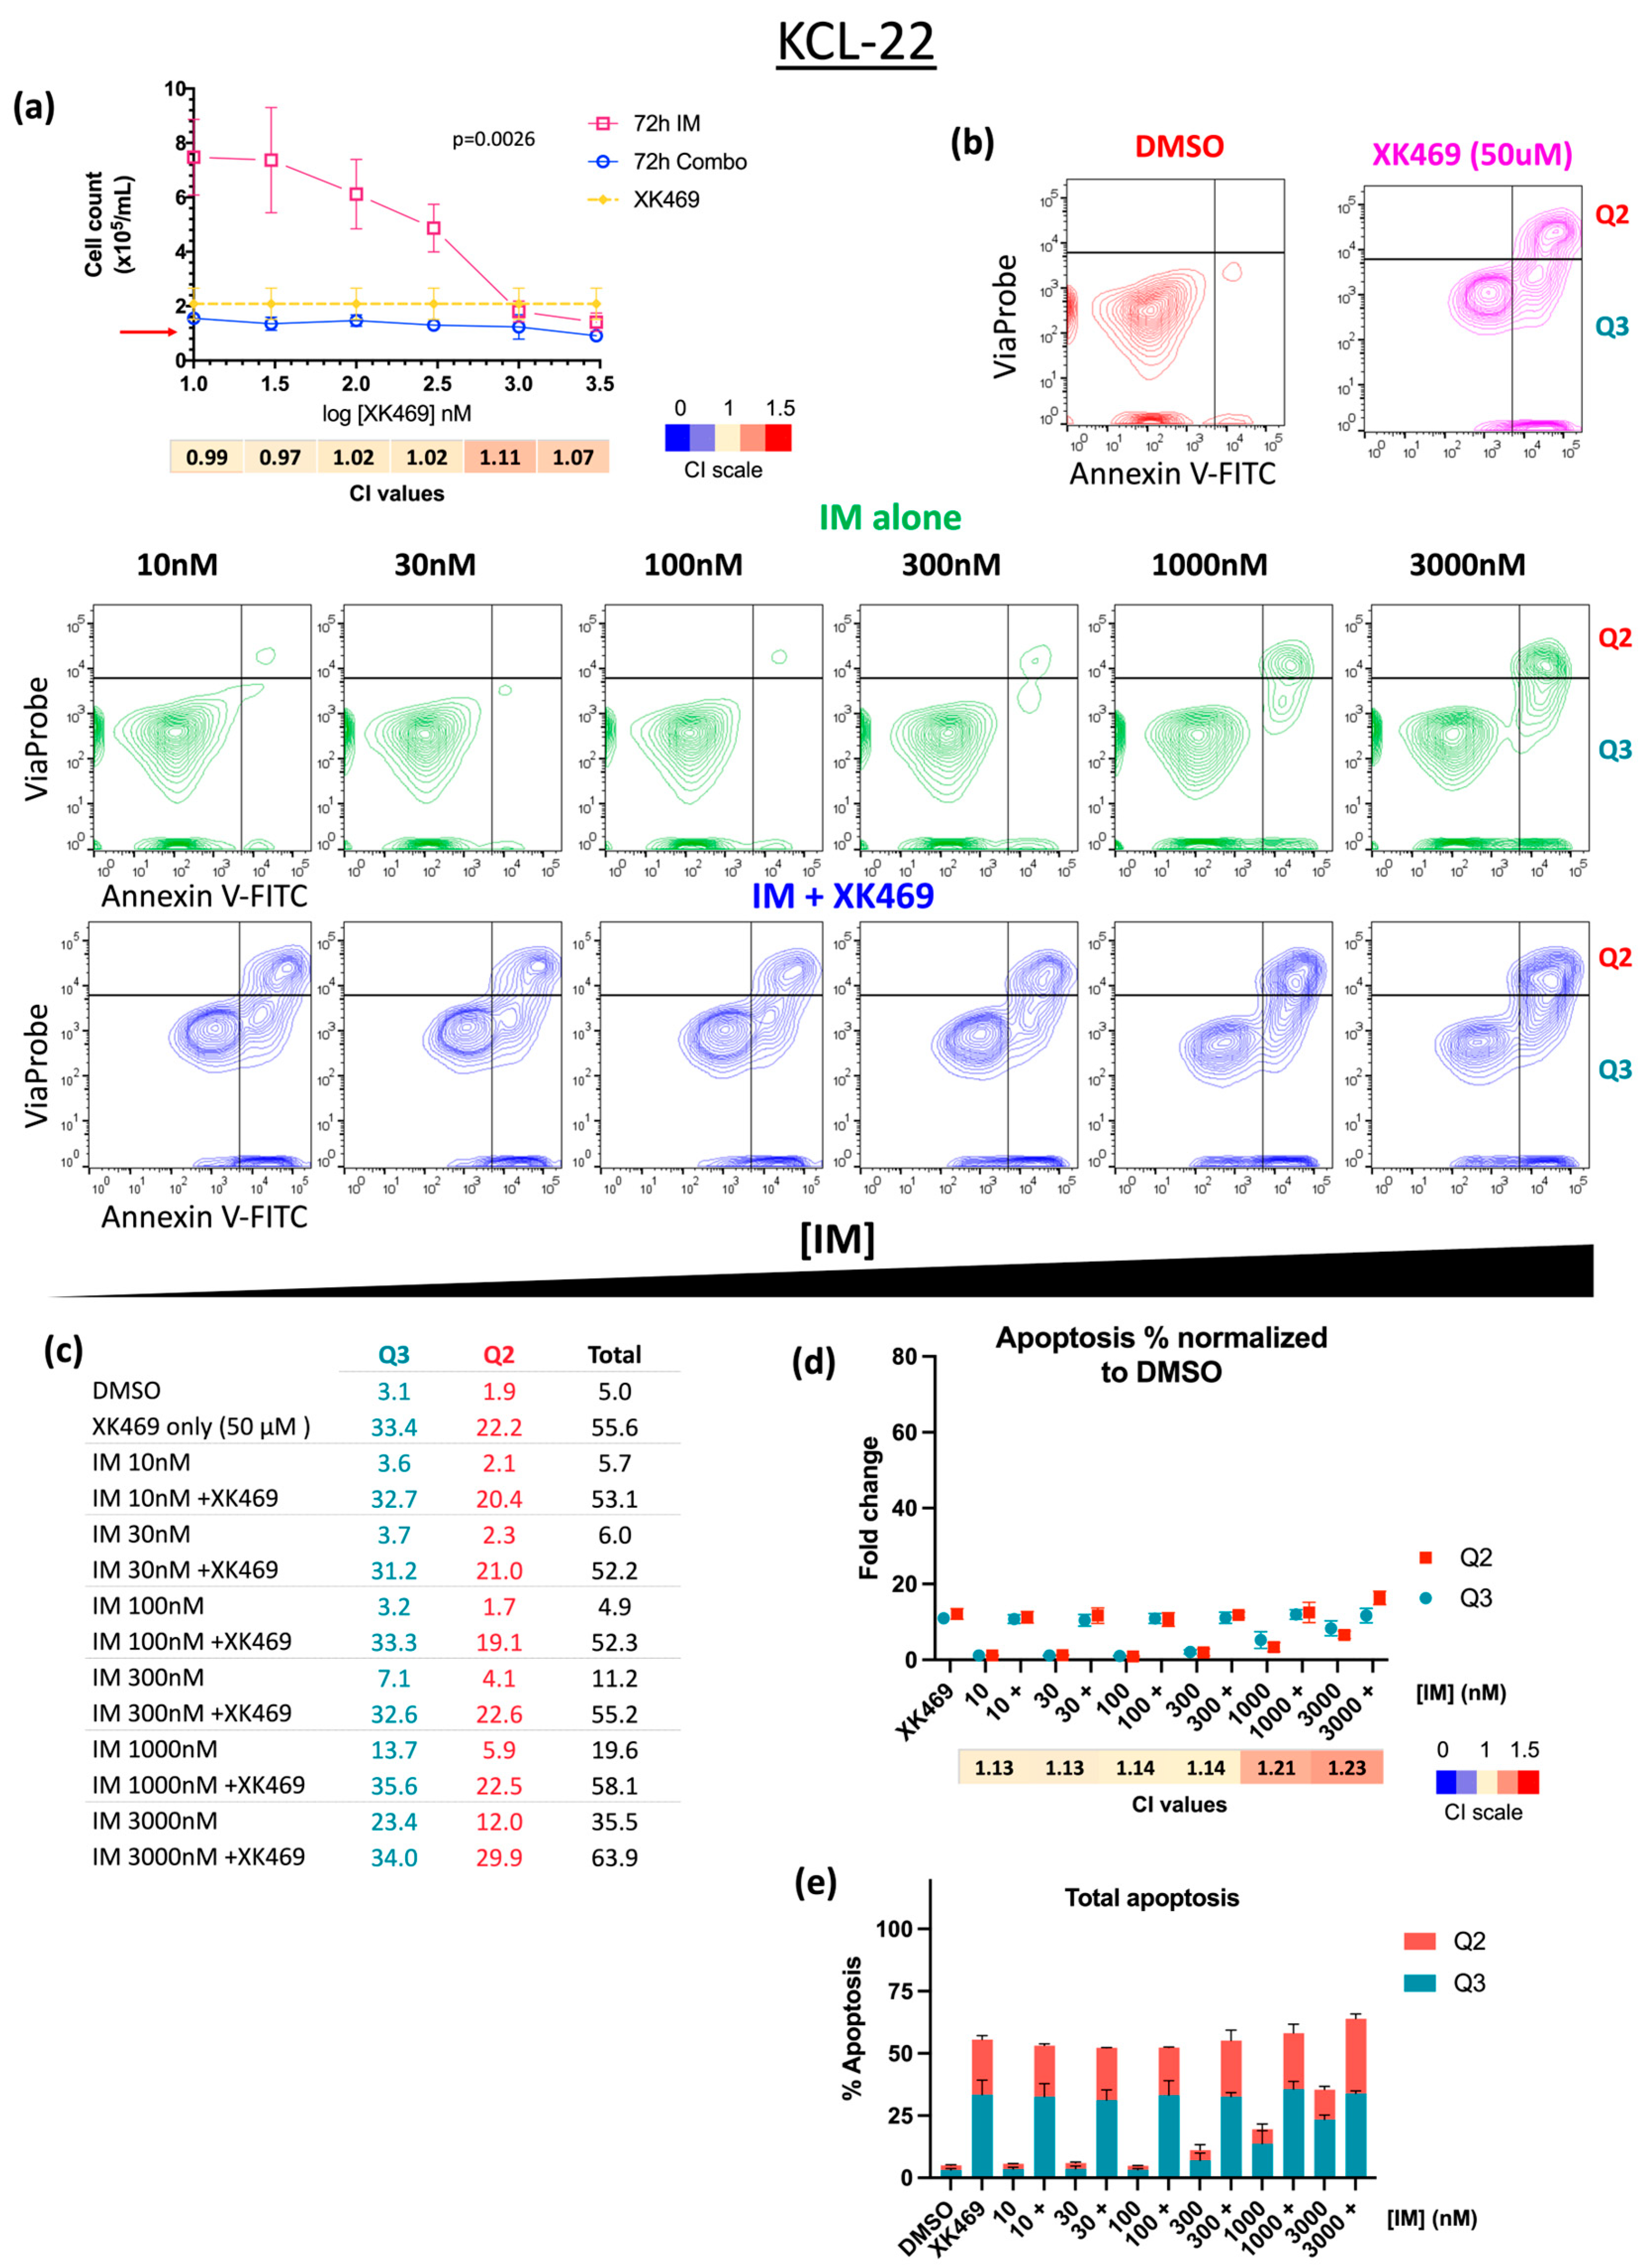
Like the results observed with K562, the cell viability of KCL-22 cells was significantly decreased (p = 0.0026) with the combination treatment compared to IM alone, but no clear synergy was detected (Figure 5a). Nevertheless, the CI was close to additivity for the combinations with 10, 30, 100 and 300 nM IM, with values between 0.97 and 1.02 (Figure 5a). Regarding the flow cytometric analysis of KCL-22 cells, IM in monotherapy at concentrations lower than 3000 nM resulted in similar and not significantly different levels of apoptosis to DMSO-treated cells. However, XK469 alone (50 μM) induced a significant increase in apoptosis compared to DMSO (55.6%, p < 0.0001) and to IM in monotherapy. Moreover, KCL-22 cells consistently showed a significantly enhanced apoptotic effect (p ≤ 0.0005 for all comparisons) when treated with both drugs compared to IM alone (Figure 5b,e). The total apoptosis values were obtained (Figure 5c) and a statistical analysis was performed. No synergistic effect was observed when calculating the CI based on the fold change in apoptosis normalized to DMSO; for IM concentrations of 1000 and 3000 nM, the values suggested antagonism (Figure 5d).

3.4. IM at High Concentration in Combination with XK469 Diminishes GAS2 mRNA Expression in CML Cells

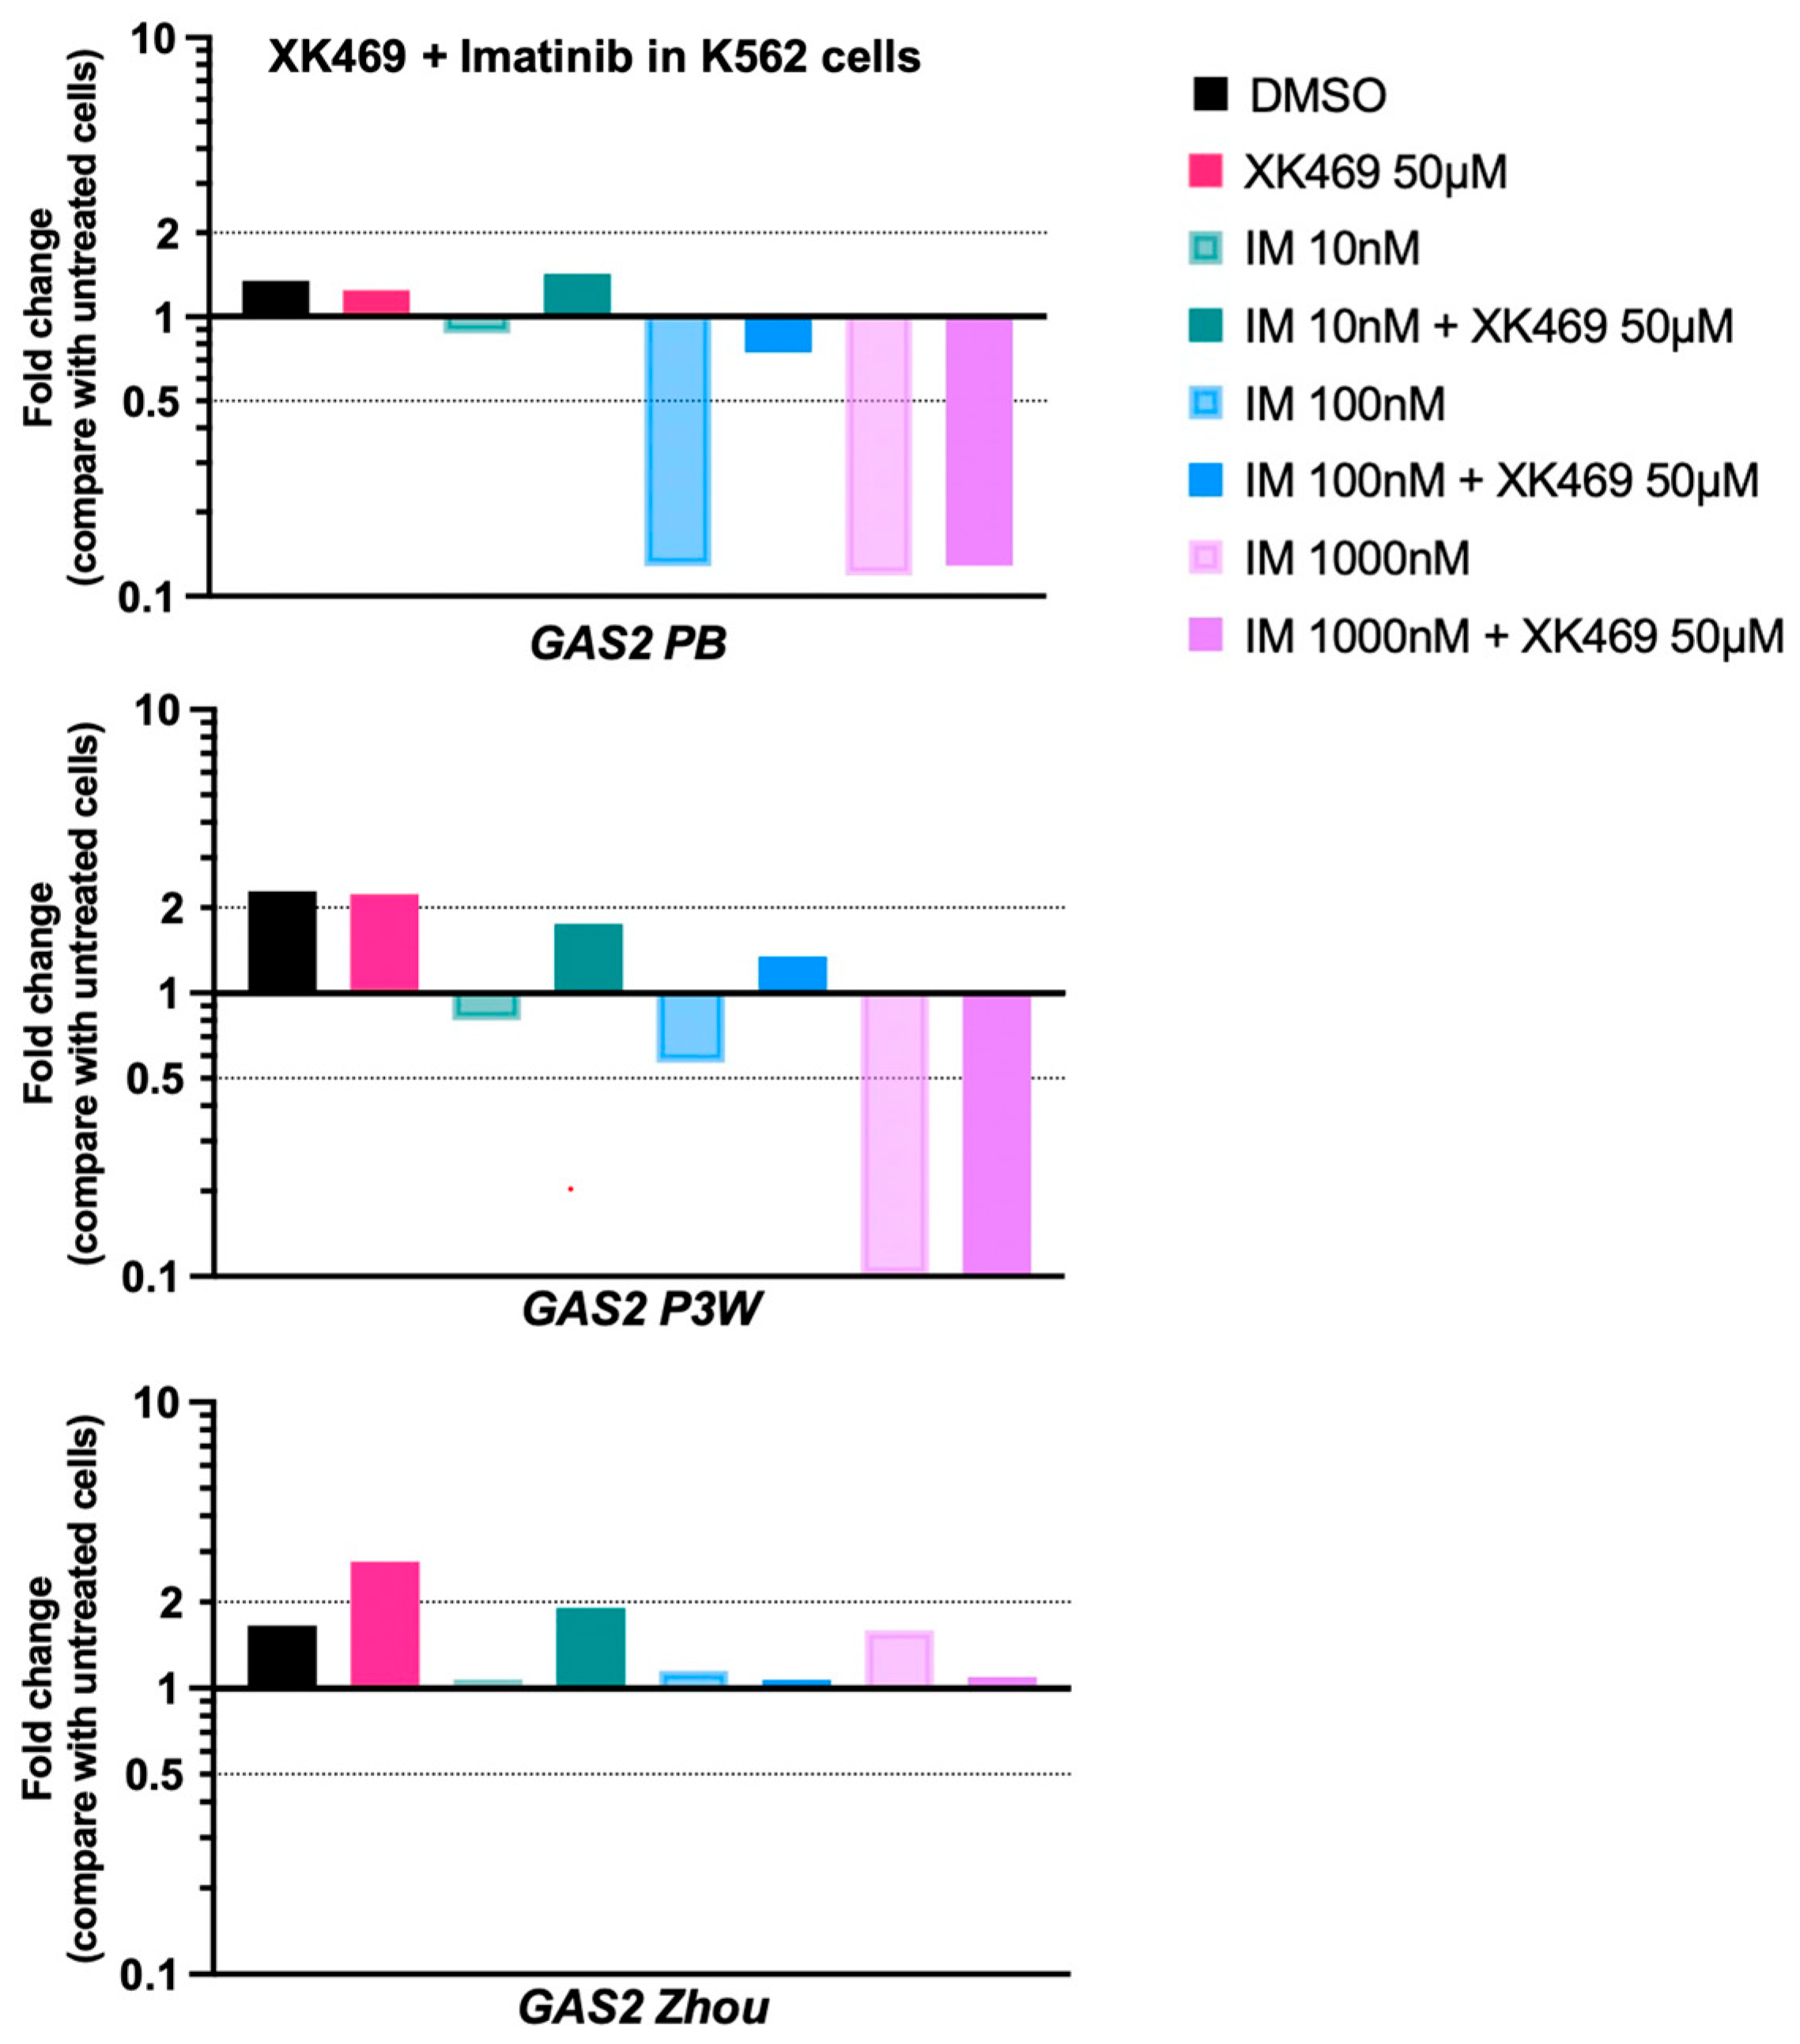
To further investigate the effect of XK469 alone and in combination with IM, RT-qPCR was performed to quantify GAS2 expression in K562 cells after 24 h treatment. Two primers (GAS2 PB and GAS2 P3W) designed by the authors and one (GAS2 Zhou) from the study of Zhou et al. [8] were used. cDNA amplification and PCR were performed with the three sets of primers. On its own, IM decreased gene expression compared to the control, which is more noticeable in the two highest concentrations tested (100 and 1000 nM), according to the result from the GAS2 PB and GAS2 P3W primer sets (Figure 6). In cells treated with XK469 alone, GAS2 expression was similar to the DMSO control. In cells treated with the combination of IM (1000 nM) with XK469, GAS2 expression remained close to that of IM alone at that same concentration (Figure 6). The GAS2 Zhou primer set did not show a reduction in GAS2 expression under any condition.

4. Discussion

Single-cell transcriptomic analysis is a useful tool for detecting gene changes in the rare BCR::ABL1+ cells that persist in CML patients after TKI treatment. This method supported the discovery of GAS2 upregulation in persistent CML-LSCs [6]. GAS2 is involved in modulating calpain activity and the GAS2–calpain2 axis has been shown to be essential for CML cell growth [10]. This supports GAS2 as a strong candidate gene to be targeted in persistent CML-LSC. The synthetic quinoxaline phenoxypropionic acid derivative XK469 is a selective topoisomerase IIβ inhibitor that has been studied preclinically as an anti-tumor agent for different types of cancer, including lymphocytic leukemia and solid tumors presenting multidrug resistance [21]. Huang et al. suggested that XK469 blocked the division of colorectal cancer cells due to the reduction in GAS2 expression [11]. Additionally, the efficacy of XK469 has been validated in vivo [13] and progressed to Phase I clinical trials [12]. Although limiting toxicity was observed in clinical trials, we proposed that a synergistic combination with IM would mitigate adverse effects through reducing the required individual drug dose while maintaining the same desirable anti-leukemic effect.
From the profiling of cell response to XK469, changes in cell size (Figure 3) potentially suggested cell cycle arrest, which in turn would impair cell division and proliferation. Huang et al. previously reported that XK469 caused cycle arrest at the G2/M phase in 86% of GAS2-overexpressing colorectal cancer cells and impeded chromosome separation at mitosis [11]. This arresting effect of XK469 has been observed in histiocytic lymphoma, neuroblastoma, colon and lung cancer cell models, being mainly assigned to the topoisomerase IIβ inhibitory action of the compound [14,22]. It has also been reported that XK469 exerts an antiproliferative effect in histiocytic lymphoma cells by targeting MEK/MAPK signaling pathways [23]. Moreover, silencing of GAS2 expression has been reported to inhibit CML cell growth in K562 and MEG-01 cell lines and in xenograft mouse models, with an elevated calpain activity observed in response to GAS2 knock down [8]. Here, we hypothesized that XK469 could have a cell inhibitory effect by targeting the GAS2 protein in CML cells. According to data from the National Library of Medicine of the National Center for Biotechnology Information (NCBI), there are three isoforms of the GAS2 protein derived from nine different transcripts. Isoform ‘a’ is generated by seven out of the nine transcripts, while isoforms ‘b’ and ‘c’ derive from just one transcript each. Our primers used for qPCR (GAS2 P3W and GAS2 PB) detect only one transcript, which is translated into isoform ‘a’. Contrastingly, the GAS2 Zhou primers detect all nine transcripts and, therefore, the three protein isoforms. This, together with our qPCR results, may suggest that XK469 has potentially more specificity for GAS2 isoform ‘a’; however, it requires further investigation to address the mechanism behind the observed effect.
To assess the synergistic effect of IM and XK469, Bliss Independence model calculation was used for the CI, which relies on the principle of independent drug action [24]. This method allows for the analysis of fixed concentrations (which was the case for XK469), as it assumes that for each curve representing a combination, the agents are in fixed proportion [25]. In general, cell viability assays suggested a greater inhibitory effect of the combination compared to either monotherapy in vitro. For KCL-22, interestingly, our results suggest that XK469 may have driven the response as there is virtually no difference among the combinations. Moreover, the cell counts of the combination remained similar to the initial seeding density. This might be indicative of a similar rate of cell death and cell division inhibition. In fact, cell cycle arrest was the main effect observed with XK469 treatment alone in the present study and in colorectal cancer studies [11]. In the case of K562, an increased effect of the combination was observed at higher concentrations of IM (1000 and 3000 nM). Although the number of remaining cells with the combination were significantly below the seeding density with XK469 alone, the effects were closer to additivity rather than synergy.
Considering the apoptosis assay results, despite the increased inhibitory effect of the combination in KCL-22, the Bliss Independence analysis suggested an additive or even antagonistic effect. This indicates that there was no greater benefit derived from the combination over individual drug effects [26]. Given that a fixed concentration of XK469 was added to increasing concentrations of IM and that no significant difference within the combination group was observed in the apoptosis assay, the hypothesis of XK469 being the driver of KCL-22 response to the drug combination was supported. Further evaluation of XK469 alone or at different concentrations in combination with IM should be explored, bearing in mind that KCL-22 cells appear to be more sensitive to XK469 than K562.
With regard to the clonogenic function, IM reduced the ability of K562 to form colonies in a dose-dependent manner. This is consistent with the results reported by Belle et al., who found a reduction of 25 ± 14% of CD34+ CFCs cells after 48 h treatment with IM (1000 nM) [27]. In our experiment, the drug combination showed a substantial decrease in CFCs compared to either drug alone. However, the significance of the difference observed was weakened by the result of the combination with 100 nM IM, which was 85 times higher than the value for the next lower concentration of IM (10 nM) in combination. By excluding this single presumed aberrant result, a clear trend towards the abolition of clonogenic capacity can be observed in K562 upon combination treatment.
The observed effects of the treatment with XK469 and the combination suggest that XK469 could be arresting the cell cycle by reducing GAS2 activity [11] or by inhibiting its selective target (topoisomerase IIβ) [28]. The inhibitory effect of the drug combination on K562 was validated with the apoptosis assay, for which the combination of 300 nM or 3000 nM IM and XK469 (50 μM) indicated moderate synergy (CI of 0.95 and 0.92, respectively). Additionally, it has been reported that XK469 induces apoptosis through caspase 3 activation [29]. Therefore, the increased apoptosis observed by flow cytometry and, consequently, the synergistic effect could possibly be a result of the activation of caspase 3 through the p53 pathway, in which GAS2 may also play a role in being the substrate for caspase 3 cleavage [30]. It has been previously revealed that increased levels of cell metabolites such as nitric oxide (NO) are involved in cell apoptosis and differentiation in CML in vitro models [31]. Sadaf et al. have shown that overexpressing neuronal nitric oxygen synthase in K562 cells and, therefore, producing higher levels of (NO), resulted in cell differentiation, as well as enhanced caspase 3 activity and increased apoptosis [31]. Therefore, exploring the biological metabolites produced in response to XK469 activity might be an avenue to discover the potential mechanism of action in CML cells.
Aside from asciminib, there has been a paucity of new clinical agents to treat the disease in the last decade. However, recently, it has been reported that in persistent and quiescent CML LSCs, the recovery of p53 activity by MDM2 inhibition leads to the loss of stem cell function and exhaustion of LSCs [20]. This suggests that the enhanced activation of the p53 pathway is a promising target in CML cells. Another interesting therapeutic approach to eliminate LSCs has been to target genes the mRNA expression of which is not affected by TKI treatment. For example, Gómez-Castañeda et al. showed that CD33 and PPIF upregulation was a signature of TKI-treated LSCs and could be targeted in vitro by gemtuzumab–ozogamicin (an anti-CD33 conjugated monoclonal antibody) and cyclosporin A, respectively [18]. In general, further investigation and novel approaches are still needed to address the persistence of LSCs in CML that have potential to translate to the clinic.

5. Conclusions

Here, we present a potential novel drug combination of the TKI, IM and the repurposed topoisomerase IIβ inhibitor, XK469, with the potential to inhibit CML cells. A synergistic effect was observed using IM (300 and 3000 nM) and XK469 (50 μM). Although K562 and KCL-22 cell lines have been extensively used, they are models of blast-phase CML [32] yet they both responded to IM + XK469. The mechanisms of action of XK469 in CML cells and in the synergistic combination is yet to be established; nonetheless, GAS2 has been shown as a relevant vulnerability in model CML cells to target with XK469 in combination with IM.

Supplementary Materials

The following supporting information can be downloaded at: https://www.mdpi.com/article/10.3390/ijtm4020023/s1, Table S1: Primers used for GAS2 expression analysis.

Author Contributions

Conceptualization, L.A.R.-G. and H.G.J.; methodology, L.A.R.-G., W.H. and H.G.J.; software, J.J.C.; validation, L.A.R.-G., W.H. and H.G.J.; formal analysis, L.A.R.-G. and W.H.; investigation, L.A.R.-G., W.H. and H.G.J.; resources, H.G.J.; writing—original draft preparation, L.A.R.-G.; writing—review and editing, L.A.R.-G., W.H. and H.G.J.; supervision, H.G.J.; project administration, H.G.J. All authors have read and agreed to the published version of the manuscript.

Funding

This research received no external funding.

Institutional Review Board Statement

Not applicable.

Informed Consent Statement

Not applicable.

Data Availability Statement

Data are contained within the article and Supplementary Materials.

Acknowledgments

We thank Shaun Patterson for providing reagents, cells and for his support during the experiments.

Conflicts of Interest

The authors declare no conflicts of interest.

References

  1. Vetrie, D.; Helgason, G.V.; Copland, M. The leukaemia stem cell: Similarities, differences and clinical prospects in CML and AML. Nat. Rev. Cancer 2020, 20, 158–173. [Google Scholar] [CrossRef] [PubMed]
  2. Redner, R.L. Why doesn’t imatinib cure chronic myeloid leukemia? Oncologist 2010, 15, 182–186. [Google Scholar] [CrossRef] [PubMed]
  3. Mu, H.; Zhu, X.; Jia, H.; Zhou, L.; Liu, H. Combination Therapies in Chronic Myeloid Leukemia for Potential Treatment-Free Remission: Focus on Leukemia Stem Cells and Immune Modulation. Front. Oncol. 2021, 11, 643382. [Google Scholar] [CrossRef] [PubMed]
  4. Chu, S.; Xu, H.; Shah, N.P.; Snyder, D.S.; Forman, S.J.; Sawyers, C.L.; Bhatia, R. Detection of BCR::ABL kinase mutations in CD34+ cells from chronic myelogenous leukemia patients in complete cytogenetic remission on imatinib mesylate treatment. Blood 2005, 105, 2093–2098. [Google Scholar] [CrossRef] [PubMed]
  5. Jørgensen, H.G.; Allan, E.K.; Jordanides, N.E.; Mountford, J.C.; Holyoake, T.L. Nilotinib exerts equipotent antiproliferative effects to imatinib and does not induce apoptosis in CD34+ CML cells. Blood 2007, 109, 4016–4019. [Google Scholar] [CrossRef] [PubMed]
  6. Giustacchini, A.; Thongjuea, S.; Barkas, N.; Woll, P.S.; Povinelli, B.J.; Booth, C.A.G.; Sopp, P.; Norfo, R.; Rodriguez-Meira, A.; Ashley, N.; et al. Single-cell transcriptomics uncovers distinct molecular signatures of stem cells in chronic myeloid leukemia. Nat. Med. 2017, 23, 692–702. [Google Scholar] [CrossRef] [PubMed]
  7. Warfvinge, R.; Geironson, L.; Sommarin, M.N.E.; Lang, S.; Karlsson, C.; Roschupkina, T.; Stenke, L.; Stentoft, J.; Olsson-Strömberg, U.; Hjorth-Hansen, H.; et al. Single-cell molecular analysis defines therapy response and immunophenotype of stem cell subpopulations in CML. Blood 2017, 129, 2384–2394. [Google Scholar] [CrossRef] [PubMed]
  8. Zhou, H.; Ge, Y.; Sun, L.; Ma, W.; Wu, J.; Zhang, X.; Hu, X.; Eaves, C.J.; Wu, D.; Zhao, Y. Growth arrest specific 2 is up-regulated in chronic myeloid leukemia cells and required for their growth. PLoS ONE 2014, 9, e86195. [Google Scholar] [CrossRef] [PubMed]
  9. Benetti, R.; Copetti, T.; Dell’Orso, S.; Melloni, E.; Brancolini, C.; Monte, M.; Schneider, C. The Calpain System Is Involved in the Constitutive Regulation of -Catenin Signaling Functions. J. Biol. Chem. 2005, 280, 22070–22080. [Google Scholar] [CrossRef]
  10. Sun, L.; Zhou, H.; Liu, H.; Ge, Y.; Zhang, X.; Ma, W.; Wu, D.; Zhao, Y. GAS2–Calpain2 axis contributes to the growth of leukemic cells. Acta Biochim. Biophys. Sin. 2015, 47, 795–804. [Google Scholar] [CrossRef] [PubMed]
  11. Huang, C.J.; Lee, C.L.; Yang, S.H.; Chien, C.C.; Huang, C.C.; Yang, R.N.; Chang, C.-C. Upregulation of the growth arrest-specific-2 in recurrent colorectal cancers, and its susceptibility to chemotherapy in a model cell system. Biochim. Biophys. Acta 2016, 1862, 1345–1353. [Google Scholar] [CrossRef] [PubMed]
  12. Alousi, A.; Parchment, R.; Boinpally, R.; Gadgeel, S.; Weigand, R.; McCormick, J.; Lorusso, P. Phase I clinical trial of XK469 in patients with chemo-refractory solid tumors. J. Clin. Oncol. 2004, 22, 2020. [Google Scholar] [CrossRef]
  13. Undevia, S.D.; Innocenti, F.; Ramirez, J.; House, L.; Desai, A.A.; Skoog, L.A.; Singh, D.A.; Karrison, T.; Kindler, H.L.; Ratain, M.J. A phase I and pharmacokinetic study of the quinoxaline antitumour Agent R(+)XK469 in patients with advanced solid tumours. Eur. J. Cancer 2008, 44, 1684–1692. [Google Scholar] [CrossRef] [PubMed]
  14. Stock, W.; Undevia, S.D.; Bivins, C.; Ravandi, F.; Odenike, O.; Faderl, S.; Rich, E.; Borthakur, G.; Godley, L.; Verstovsek, S.; et al. A phase I and pharmacokinetic study of XK469R (NSC 698215), a quinoxaline phenoxypropionic acid derivative, in patients with refractory acute leukemia. Investig. New Drugs 2008, 26, 331–338. [Google Scholar] [CrossRef] [PubMed]
  15. Barretina, J.; Caponigro, G.; Stransky, N.; Venkatesan, K.; Margolin, A.A.; Kim, S.; Wilson, C.J.; Lehár, J.; Kryukov, G.V.; Sonkin, D.; et al. The Cancer Cell Line Encyclopedia enables predictive modelling of anticancer drug sensitivity. Nature 2012, 483, 603–607. [Google Scholar] [CrossRef] [PubMed]
  16. Love, M.I.; Huber, W.; Anders, S. Moderated estimation of fold change and dispersion for RNA-seq data with DESeq2. Genome Biol. 2014, 15, 550. [Google Scholar] [CrossRef] [PubMed]
  17. Cole, J.J.; Faydaci, B.A.; McGuinness, D.; Shaw, R.; Maciewicz, R.A.; Robertson, N.A.; Goodyear, C.S. Searchlight: Automated bulk RNA-seq exploration and visualisation using dynamically generated R scripts. BMC Bioinform. 2021, 22, 411. [Google Scholar] [CrossRef] [PubMed]
  18. Gómez-Castañeda, E.; Hopcroft, L.E.M.; Rogers, S.; Munje, C.; Bittencourt-Silvestre, J.; Copland, M.; Vetrie, D.; Holyoake, T.; Jørgensen, H.G. Tyrosine Kinase Inhibitor Independent Gene Expression Signature in CML Offers New Targets for LSPC Eradication Therapy. Cancers 2022, 14, 5253. [Google Scholar] [CrossRef] [PubMed]
  19. Darici, S.; Zavatti, M.; Braglia, L.; Accordi, B.; Serafin, V.; Horne, G.A.; Manzoli, L.; Palumbo, C.; Huang, X.; Jørgensen, H.G.; et al. Synergistic cytotoxicity of dual PI3K/mTOR and FLT3 inhibition in FLT3-ITD AML cells. Adv. Biol. Regul. 2021, 82, 100830. [Google Scholar] [CrossRef]
  20. Scott, M.T.; Liu, W.; Mitchell, R.; Clarke, C.J.; Kinstrie, R.; Warren, F.; Almasoudi, H.; Stevens, T.; Dunn, K.; Pritchard, J.; et al. Activating p53 abolishes self-renewal of quiescent leukaemic stem cells in residual CML disease. Nat. Commun. 2024, 15, 651. [Google Scholar] [CrossRef] [PubMed]
  21. Kessel, D.; Reiners, J.J.; Hazeldine, S.T.; Polin, L.; Horwitz, J.P. The role of autophagy in the death of L1210 leukemia cells initiated by the new antitumor agents, XK469 and SH80. Mol. Cancer Ther. 2007, 6, 370–379. [Google Scholar] [CrossRef] [PubMed]
  22. Ding, Z.; Parchment, R.E.; LoRusso, P.M.; Zhou, J.Y.; Li, J.; Lawrence, T.S.; Sun, Y.; Wu, G.S. The investigational new drug XK469 induces G(2)-M cell cycle arrest by p53-dependent and -independent pathways. Clin. Cancer Res. 2001, 7, 3336–3342. [Google Scholar] [PubMed]
  23. Lin, H.; Subramanian, B.; Nakeff, A.; Chen, B.D. XK469, a novel antitumor agent, inhibits signaling by the MEK/MAPK signaling pathway. Cancer Chemother. Pharmacol. 2002, 49, 281–286. [Google Scholar] [CrossRef] [PubMed]
  24. Foucquier, J.; Guedj, M. Analysis of drug combinations: Current methodological landscape. Pharmacol. Res. Perspect. 2015, 3, e00149. [Google Scholar] [CrossRef] [PubMed]
  25. Bliss, C.I. The toxicity of poisons applied jointly. Ann. Appl. Biol. 1939, 26, 585–615. [Google Scholar] [CrossRef]
  26. Roell, K.R.; Reif, D.M.; Motsinger-Reif, A.A. An Introduction to Terminology and Methodology of Chemical Synergy-Perspectives from Across Disciplines. Front. Pharmacol. 2017, 8, 158. [Google Scholar] [CrossRef] [PubMed]
  27. Belle, L.; Bruck, F.; Foguenne, J.; Gothot, A.; Beguin, Y.; Baron, F.; Briquet, A. Imatinib and nilotinib inhibit hematopoietic progenitor cell growth, but do not prevent adhesion, migration and engraftment of human cord blood CD34+ cells. PLoS ONE 2012, 7, e52564. [Google Scholar] [CrossRef] [PubMed]
  28. Gao, H.; Huang, K.C.; Yamasaki, E.F.; Chan, K.K.; Chohan, L.; Snapka, R.M. XK469, a selective topoisomerase IIbeta poison. Proc. Natl. Acad. Sci. USA 1999, 96, 12168–12173. [Google Scholar] [CrossRef] [PubMed]
  29. Kakodkar, N.C.; Peddinti, R.; Kletzel, M.; Tian, Y.; Guerrero, L.J.; Undevia, S.D.; Geary, D.; Chlenski, A.; Yang, Q.; Salwen, H.R.; et al. The quinoxaline anti-tumor agent (R+)XK469 inhibits neuroblastoma tumor growth. Pediatr. Blood Cancer 2011, 56, 164–167. [Google Scholar] [CrossRef]
  30. Sgorbissa, A.; Benetti, R.; Marzinotto, S.; Schneider, C.; Brancolini, C. Caspase-3 and caspase-7 but not caspase-6 cleave Gas2 in vitro: Implications for microfilament reorganization during apoptosis. J. Cell Sci. 1999, 112, 4475–4482. [Google Scholar] [CrossRef] [PubMed]
  31. Sadaf, S.; Awasthi, D.; Singh, A.K.; Nagarkoti, S.; Kumar, S.; Barthwal, M.K.; Dikshit, M. Pyroptotic and apoptotic cell death in iNOS and nNOS overexpressing K562 cells: A mechanistic insight. Biochem. Pharmacol. 2020, 176, 113779. [Google Scholar] [CrossRef] [PubMed]
  32. Clarke, C.J.; Holyoake, T.L. Preclinical approaches in chronic myeloid leukemia: From cells to systems. Exp. Hematol. 2017, 47, 13–23. [Google Scholar] [CrossRef] [PubMed]
Figure 1. GAS2 is consistently upregulated in BCR::ABL1+ LSCs compared to normal HSCs. Hierarchically clustered heatmap of the top significant (p adj. < 0.05, absolute log2 FC > 1.0) genes from the differential expression comparison of single-cell RNA seq data between (a) normal hematopoietic stem cells (HSCs) vs. BCR::ABL1+ LSCs of CML patients at diagnosis, (b) normal HSCs vs. BCR::ABL1+ LSCs of CML patients in therapy-free remission after 3, 6, 12, 18 months or 5 years of tyrosine kinase (TKI) treatment, (c) BCR::ABL1+ LSCs of CML patients at diagnosis vs. after TKI treatment.
Ijtm 04 00023 g001
Figure 2. XK469 in monotherapy is less potent with respect to cell viability than IM alone. IC50 of IM and XK469 after 72 h treatment measured by resazurin assay (n = 4 for each cell line) in (a) K562 and (b) KCL-22. For K562 cells treated with XK469, 50% inhibition of cell viability was not reached; therefore, the green dashed line in the graph indicates the extrapolation from the regression used to find the IC50. In the case of KCL-22, the highest XK469 concentration (60 μM) caused almost 50% inhibition of cell viability. Viability % normalized to DMSO control.
Ijtm 04 00023 g002
Figure 3. XK469 increases cell size and apoptosis in vitro. Representative flow cytometry dot plots of (a) K562 and (d) KCL-22 showing cell size variation between untreated control (blue), DMSO control (green) and XK469-treated cells (red), and the corresponding average cell diameter (by CellDrop) of untreated, DMSO control and XK469-treated cells with p-values (n = 5). Representative images of (b) K562 and (e) KCL-22 cell cytospin stained with May–Grünwald and Giemsa dyes. Viable cells (annexin V− PI−) and cells in early (annexin V+ PI−) and late (annexin V+; PI+) apoptotic stages induced by XK469 treatment at different concentrations in (c) K562 (n = 5) and (f) KCL-22 (n = 3).
Ijtm 04 00023 g003
Figure 4. XK469 plus IM further decreases cell viability with respect to IM alone and potentiates apoptotic effects in K562 cells. (a) Live cell counts by CellDrop after 72 h treatment of K562 with XK469 (50 μM) and IM 10, 30, 100, 300, 1000 or 3000 nM (n = 3). p-value from comparison of combination vs. IM alone (p = 0.0153). Arrow indicates initial cell seeding density. (b) Representative flow cytometry contour plots of K562 cells treated for 72 h with XK469, IM or their combination. (Q2 quadrant is late apoptosis, Q3 quadrant is early apoptosis.) (c) Values of early (Q3), late (Q2) and total apoptosis (Q2 + Q3) per condition. (d) Fold change in apoptotic effect normalized to DMSO, representing Q2 and Q3 values per condition, with SEM (n = 3). Calculated CI value shown below the graph. (e) Stack bar plot of total apoptosis (Q2 + Q3) after 72 h treatment with XK469, IM alone and combo (indicated with ‘+’) for each IM concentration. (f) Colony-forming cell (CFC) rates of K562 cells treated with IM, XK469 alone and combination for 96 h and cultured in methylcellulose for 10 days (n = 1). CI: Combination index. CI color scale: synergy in blue (CI < 1), additivity in yellow (CI = 1), antagonism in red (CI > 1).
Ijtm 04 00023 g004
Figure 5. XK469 plus IM further decreases cell viability with respect to IM alone and potentiates apoptotic effect in KCL-22 cells. (a) Live cell counts by trypan blue after 72 h treatment of KCL-22 with XK469 (50 μM) and IM 10, 30, 100, 300, 1000 or 3000 nM. p-value from comparison of combination vs. IM alone (p = 0.0026). Arrow indicates initial cell seeding density. (b) Representative flow cytometry contour plots of KCL-22 cells treated for 72 h with XK469, IM or their combination. Q2 quadrant is late apoptosis, Q3 quadrant is early apoptosis. (c) Values of early (Q3), late (Q2) and total apoptosis (Q2 + Q3) per condition. (d) Fold change in apoptotic effect normalized to DMSO, representing Q2 and Q3 values per condition, with SEM (n = 3). Calculated CI value shown below the graph. (e) Stack bar plot of total apoptosis (Q2 + Q3) after 72 h treatment with XK469, IM alone and combo (indicated with ‘+’) for each IM concentration. CI: Combination index. CI color scale: synergy in blue (CI < 1), additivity in yellow (CI = 1), antagonism in red (CI > 1).
Ijtm 04 00023 g005
Figure 6. GAS2 expression in K562 cells is reduced by IM and its combination in high concentrations with XK469. Fold change in GAS2 expression, normalized to GAPDH by ΔΔCt method (n = 1; average of technical triplicates). Each graph corresponds to a different set of primers for GAS2. Combination-treated samples consist of IM at 10, 100 or 1000 nM plus XK469 (50 μM). Fold change of 1 indicates no change in expression; fold change > 1 indicates overexpression and fold change < 1 indicates reduced expression. GAS2 PB and GAS2 P3W primer sets designed by the authors. GAS2 Zhou primer set from [8].
Ijtm 04 00023 g006
Table 1. Number of significantly differentially expressed genes from single-cell sequencing data of CML patient cells 1.
ComparisonSignificant Genesp Adjusted
UpregulatedDownregulatedTotal
1.
BCR::ABL1+ at diagnosis versus normal HSCs
441862<0.05
2.
BCR::ABL1+ after TKI versus normal HSCs
133043<0.05
3.
BCR::ABL1+ at diagnosis versus BCR::ABL1+ after TKI
189<0.05
1 Raw data source [6].
Disclaimer/Publisher’s Note: The statements, opinions and data contained in all publications are solely those of the individual author(s) and contributor(s) and not of MDPI and/or the editor(s). MDPI and/or the editor(s) disclaim responsibility for any injury to people or property resulting from any ideas, methods, instructions or products referred to in the content.