Abstract
Two experiments were conducted to assess the effects of water medication technology on beef cattle behaviour and performance in tropical conditions. Experiment 1 involved 30 Droughtmaster yearling steers monitored over seven days in a controlled environment. Feed and water consumptions were monitored with Smart Feed Pro® systems, with three water treatments administered via uDOSE® technology. The results indicated an average water intake of 13.6 L/head/d. Experiment 2 had 120 yearling steers from four genetic groups grazing on an extensive pasture system. Throughout four 24-day periods, forage availability and chemical composition were measured once monthly. Experiment 2 revealed a variation in water intake, ranging from 16.2 L/head/d down to 4.75 L/head/d. Notably, the lower intake coincided with a rainfall event documented during the fourth experimental period. Overall, results from both experiments indicated that water medication did not alter cattle water preference. There was no preference for treated water sources in Experiment 1, while differences in Experiment 2 appeared to be influenced by external factors like weather and prior habits. These experiments demonstrate the feasibility of water medication for beef cattle without disruption of their natural behaviour.
1. Introduction
Managers of livestock production systems often overlook the importance of a constant supply of quality water and focus their efforts on diet adjustments for improved performance [1]. However, water plays a vital role in the animal body, contributing to various essential functions such as nutrient and hormone transport, waste product elimination, regulation of blood osmotic pressure, and control of secretions like saliva, milk, and body temperature [2]. Assuring that ruminant animals have a constant supply of adequate water in livestock production is as important as having feed available [3]. Water can be obtained via any of the three pathways: drinking water, feed water, and metabolic water (generated during nutrient catabolism), although usually the latter two are not quantified in most livestock production systems.
The NRC [4] suggested that water use, or ingestion, can be associated with different factors such as body weight, dry matter intake, energy intake, effects of seasons (temperature, radiation, and humidity), restriction effect (drinking trough availability and spacing), water quality, species, breed and different physiological stages, such as growing, pregnancy, and lactation. Utley et al. [3] suggested that, for each kilogram of dry matter (DM) consumed, cattle will require between two and four litres of water. However, it has been suggested that this relation is the 4.5 L/kg DM intake (DMI) for Bos indicus animals kept in a 25 °C environment temperature and up to 8 L/kg DMI at 35 °C [5]. The latter authors indicated that Bos taurus cattle can require up to 25% more water than tropical breeds. In addition to water, cattle require nutrients, such as protein or minerals, e.g., P (Phosphorus) [4,5]. Water medication can be used as a tool to supply Nitrogen and P via the livestock water supply. Ensuring proper levels of these minerals in their diet is crucial for maintaining optimal health, growth, reproduction, and overall live weight gains.
There is a consensus among several researchers that the current data available (e.g., data from flow metres disregarding evaporation, disregarding water from feed, or not performed at individual level) may pose a challenge for the development of validated and practical guidelines for ruminants in this domain. Beed [6] has highlighted that accurate assessments of water consumption should be linked to its quality, and they serve as the basis for evaluation of potential issues related to water in the nutrition of production animals.
The current work attempted to investigate potential differences in animal behaviour, particularly when nutrients were added via water to cattle fed low-quality grasses under tropical conditions.
2. Materials and Methods
The study was carried out in two separate locations. Experiment 1 was conducted at the Central Queensland Innovation and Research Precinct (CQIRP) in Rockhampton, Queensland, Australia, coordinates 150°30′ E, 23°19′ S, elevation 40 m. Experiment 2 was conducted at Wilburra Downs, a commercial station in Richmond, Queensland, Australia, coordinates 143°14’ E, 20°47’ S, elevation 220 m. Animal care for Experiment 1 followed the approved research protocol of the CQUniversity Animal Ethics Committee (approval number 24410). In Experiment 2, all procedures adhered to the Australian code for the care and use of animals for scientific purposes [7].
2.1. Experiment 1
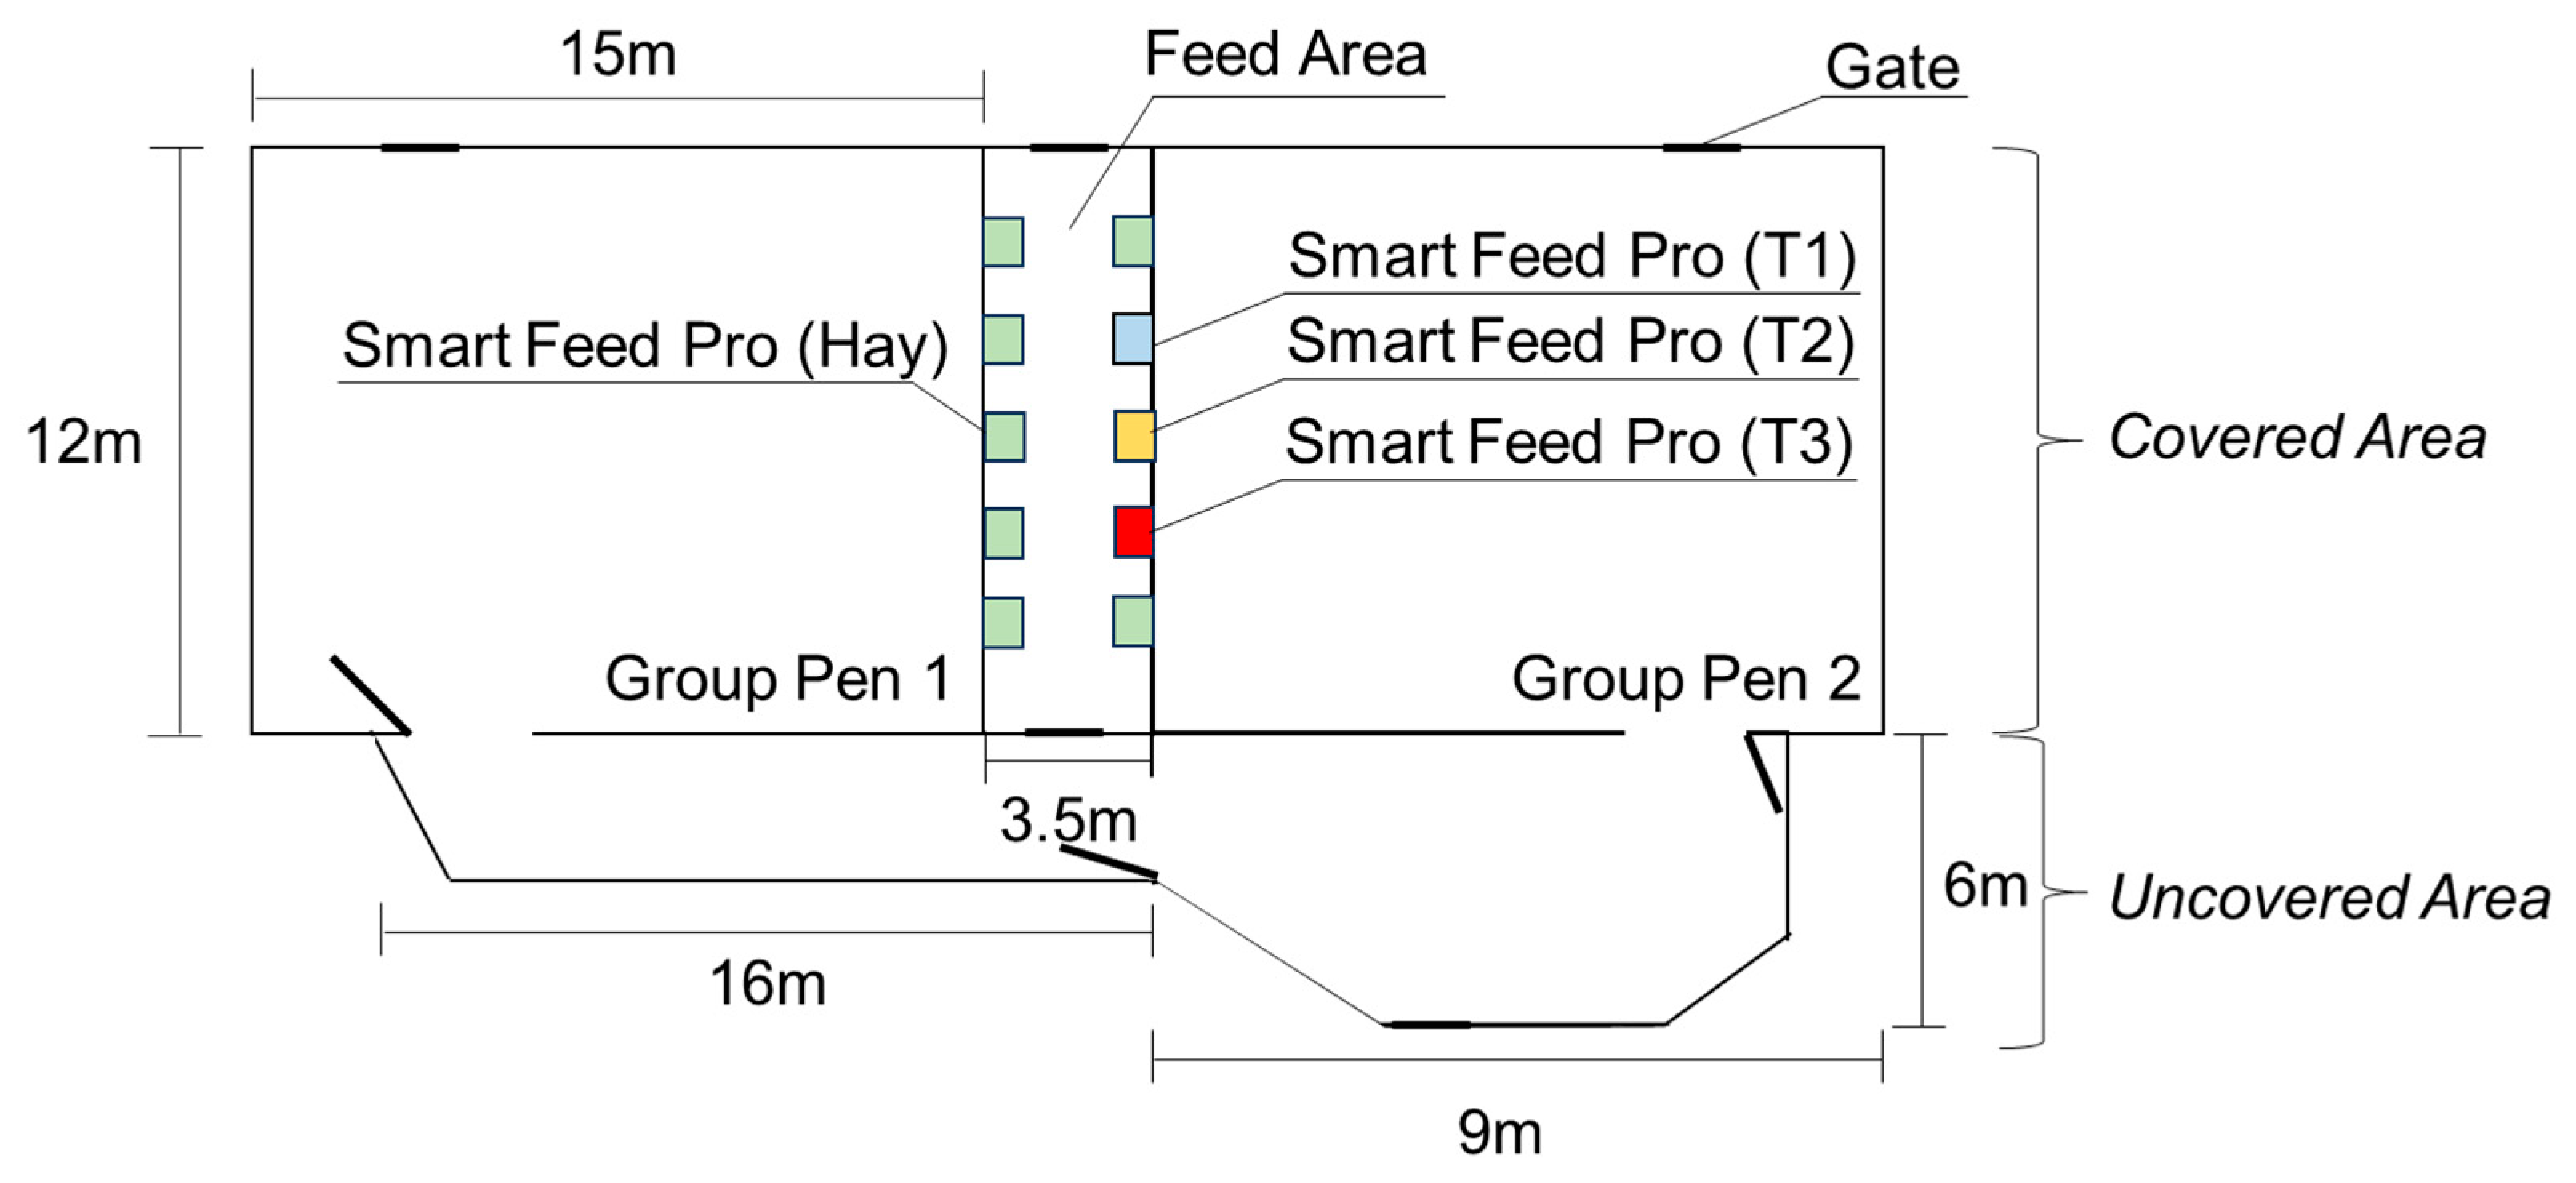
The study had 30 Droughtmaster yearling steers with an initial liveweight (LW) of 291 ± 5.3 kg. The animals had unrestricted access to two group pens (GPs) interconnected by an outside area (Figure 1). Each GP had 180 m2 of covered area where feed and water were available via ten Smart Feed Pro® (Smart Feed Pro, C-Lock Inc., Rapid City, SD, USA). The additional uncovered area had approximately 62 m2. Cleaning was undertaken three times per week using a high-pressure hose inside, and only faeces were removed with shovels in the uncovered area.
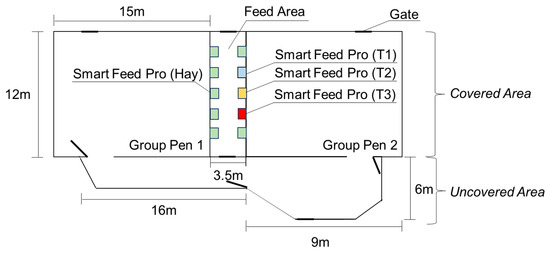
Figure 1.
Schematic diagram of group pens, feed area (covered area), uncovered area, and Smart Feed Pro with solution of water + uPRO ORANGE® + Agolin Ruminant L® (T1, blue square), with water + uPRO ORANGE® (T2, orange square) and with water (T3, red square) used in Experiment 1.
The animals were monitored over the seven days in which the evaluations were performed. After two days, it was identified that two animals were not accessing the Smart Feed Pro® to consume hay and drink water, and they were removed from the trial. Throughout the 7-day period, the animals were fed ad libitum a low-quality Rhodes grass (Chloris gayana) hay (92% DM, 5.1% CP, 71% NDF, 45% ADF) offered in seven Smart Feed Pro® feeders. The water treatments used in this experiment consisted of one of three treatments: Treatment 1 (T1) − solution of water + uPRO ORANGE® + Agolin Ruminant L®; Treatment 2 (T2) − water + uPRO ORANGE®; and Treatment 3 (T3) − water. The water supplied came from the same line for all three treatments. The proportions and chemical composition of each treatment is presented in Table 1.

Table 1.
Treatment mixes and chemical composition of each water medication supplement in Experiment 1.
Treatments were administered via the uDOSE® automatic system from DIT AgTech, delivered into water troughs within each Smart Feed Pro®. The water troughs consisted of 100 L PVC boxes placed inside the smart feeders and were refilled three times a day (8:00 h, 13:00 h, and 16:00 h). Three uDOSE® devices controlled a dose rate of 10 mL of solution/L of fresh water, consistently meeting the target dose rate and achieving at least 99% dose delivery when administering nutrients into the pipelines. Water consumption remained ad libitum.
Dry matter intake and water intake were determined by measuring the weight difference when each animal accessed the Smart Feed Pro®. RFID tags on the right ear of each animal enabled the Smart Feed Pro® to control and quantify DMI and water intake. Additionally, despite not specifically focusing on animal liveweight gain, the initial and final liveweights (LW) were measured using a fixed scale Gallagher model TWR-1® (Gallagher Group Limited, Hamilton, New Zealand) at the beginning and end of the one-week experimental period.
Throughout the experimental period, weather data (temperature [max and min], humidity [max and min] and wind speed), was recorded daily using a portable weather station (Ecowitt model WS2910CA).
2.2. Experiment 2
The experiment used 120 yearling steers, with 30 animals from one of four genetic groups (i.e., Angus, Brahman, Charolais, and Senepol). Breed identification was based on genotype information. The initial LWs for each breed were Angus 272 ± 9.3 kg, Brahman 274 ± 8.9 kg, Charolais 268 ± 6.4 kg, and Senepol 270 ± 6.3 kg. The animals grazed 886 ha of a mixture of native and introduced grasses and legumes traditionally found in the Central Queensland Region (Mitchell grass (Astrebla lappacea), Flinders grass (Iseilema spp.), Buffel grass (Cenchrus ciliaris), Pigweed (Portulaca oleracea), and Prickly Acacia (Vachellia nilotica)), in a paddock divided into two main areas—the square area (SA), with three water troughs, and the corner area (CA), with one water trough (Figure 2).

Figure 2.
Map of the paddock area at Wilburra Downs Station—Richmond, Queensland. Australia.
In the square area (SA), three rectangular concrete water troughs (60 cm × 300 cm × 60 cm, 1000 L capacity) were used to administer treatments in the water. Treatments included uPRO ORANGE HP® at a regular dose (RD) of 50 mL/30 L of fresh water, uPRO ORANGE HP® at a high dose (HD) (starting from 50 mL/30 L and increased by 10 mL weekly until reaching 80 mL/30 L), and just water as a negative control (NC). In the corner area, a water trough, with just water, served as a positive control (PC). Water, flushed weekly or fortnightly, was sourced from a bore to all four troughs. The uDOSE® automatic system from DIT AgTech ensured precise dosages, with one device per treatment, achieving the target dose rate of at least 78% of the time when dispensing nutrients into the pipelines. The composition and chemical details of the supplemental treatments are provided in Table 2.
Table 2.
Treatment mixes and chemical composition of each water medication supplement dosed provided into water troughs during Experiment 2, developed at a commercial station located at Richmond—QLD.
The animals were kept in the area over four experimental periods of 24 days each. They had ad libitum access to legumes and herbs, which were patchily distributed across the Mitchell grass pastures. The chemical composition of hand plucked samples was performed via the NIR method, and forage availability was calculated as total standing dry matter (TSDM, kg DM/ha) based on CiboLabs (Australian Feedbase Monitor—AFM, CiboLabs [8]). The latter were undertaken monthly and resulted in the following: September 2023: 90.2% DM, 6.3% CP, 54.6% NDF, 48.4% ADF and 691 kg DM/ha as TSDM (measured 98% total paddock area). October 2023: 91.8% DM, 6.2% CP, 60.2% NDF, 49.5% ADF and 549 kg DM/ha as TSDM (measured 91% total paddock area). November 2023: 92.0% DM, 6.6% CP, 47.8% NDF, 49.4% ADF and 828 kg DM/ha as TSDM (measured 61% total paddock area). December 2023: 91.7% DM, 8.9% CP, 21.0% NDF, 42.2% ADF and 809 kg DM/ha as TSDM (measured 74% total paddock area).
Adjustments where water was provided were made during the experimental periods, aiming to eliminate any pre-existing influence on animal behaviour. The protocol aimed to identify the animals’ most preferred water trough under different conditions, with consistent free and permanent access granted throughout the experimental periods. During the first experimental period (11 September−5 October 2023), water was provided into water troughs dosed with treatments NC, PC, and just water, with or without weekly flushing. In the next experimental period (6−30 October 2023), all four water troughs provided water for the animals (RD, HD, NC, and PC). The following period (31 October−24 November 2023) the water was provided only in two water troughs in the SA (RD and HD). In the final experimental period (25 November−19 December 2023), water alone was delivered into all four water troughs again (RD, HD, NC, and PC). The approach was developed to simulate the transitional period between the wet season and dry season in a beef cattle extensive grazing system. At all times, water was provided ad libitum.
Dry matter intake was not evaluated in Experiment 2; however, water intake was measured using the uDOSE® automatic system, factoring in the environmental changes in each trough through Equation (1) by Coimbra et al. [9] and accounting for evaporation and rainfall effects:
where Wd is water disappearing (L), Wflow is water flowing into the water trough (L), E is evaporation (mm), R is rainfall (mm), and A is water trough surface area (m2).
Liveweight changes were measured throughout the experiment using a Walker overweight, WoW (Tru-Test Remote WoW; Tru-Test® by Datamars Australia Pty Ltd., Banyo, Queensland, Australia), installed in the SA, where three water troughs were placed (NC, RD, HD). When the animals accessed SA to drink water, it was achieved by traversing the WoW system.
During all experimental periods, the weather data (temperature [max and min], humidity [max and min], rainfall, wind [direction and speed] and pressure) was recorded using raw data measured by the Bureau of Meteorology [10] at the closest site, located 18 km from the experiment site, on a daily basis (Supplementary Materials Table S1).
2.3. Chemical Analyses
The hay [Experiment 1] and forage [Experiment 2]) were sampled to represent the feed available. In Experiment 1, approximately one hand full of hay offered was collected daily, with a 300–500 g bulk sample being collected to represent the entire seven days. In Experiment 2, hand plucked samples were frozen (−18 °C) until further lab analysis. Samples from both trials were dried in an air forced oven 60 °C during 72 h and ground using a 2 mm sieve. The water samples were sampled in the field, in both experiments, using sterile plastic containers and stored frozen at −18 °C.
All forage chemical analyses were conducted using a Near Infra-Red (NIR) Instrument model Perkin Elmer—DA 7250® (Waltham, MS, USA). The output included dry matter (DM), nitrogen as crude protein (CP), neutral detergent fibre (NDF), acid detergent fibre (ADF). For the water analysis, a Multiparameter Photometer with COD for Water and Wastewater model Hanna Instruments HI83399® was used to determine either Nitrogen or phosphorus, pH, electrical conductivity, total dissolved solids, and salinity.
2.4. Weather Variables Calculations
The main raw data (temperature [max and min], humidity [max and min], rainfall, and wind [direction and speed] and pressure) were obtained using the mobile weather station (Experiment 1) or raw data recorded by BOM (Experiment 2). However, some different variables were required to describe the weather conditions and to calculate other variables. The evaporation (Supplementary Materials Table S2) was used to calculate water disappearance (Equation (1)) and was calculated using Equation (2), as proposed by Linacre [11]:
where E is evaporation (mm/day), T is average air temperature (°C), h is altitude at location (m), φ is local latitude (degrees), and Td is dew point temperature (°C).
E = ((700 × (T + 0.006 h))/(100 − φ) + 15 × (T − Td))/(80 − T)
In addition to evaporation, the temperature humidity index (THI, Supplementary Materials Table S2) was calculated according to Equation (3), as described in Copley et al. [12]:
where THI is temperature humidity index, T is average air temperature (°C), and RH is relative humidity (%).
THI = 0.8 × T + ((RH × 0.01) × (T – 14.4)) + 46.4
2.5. Statistical Analysis
All data were submitted to previous normality (Kolmogorov–Smirnov) and homoscedasticity tests. When necessary, the raw data transformation was applied to achieve the normality and/or homoscedasticity. The significance was considered by a Tukey Test at 5%.
In Experiment 1, the results (total water intake [L/head], total time drinking [min/head] and water intake ratio [L water consumed/min]) were analysed in a completely randomized design. The model can be expressed as:
where, Yij is the observation for the j-th unit in the i-th treatment group, μ is the overall population mean, τi is the effect of the i-th treatment group (deviation from the overall mean due to treatment), and εij is the random error term representing individual variability and experimental error.
Yij = μ + τi + εij
The individual water intake (L/day) was evaluated by considering a completely randomized design with repeated measures to verify the effects across the experimental days. For this variable, the model applied was:
where, Yij is the observation for the i-th individual at the j-th time point, μ is the overall mean. τi is the effect of the i-th treatment, βj is the effect of the j-th time point, and εij is the random error associated with the observation for the i-th individual at the j-th time point.
Yij = μ + τi + βj + εij
In addition to the previous analysis, a multivariable analysis was performed, known as a principal component analysis (PCA), in both experiments. This was conducted using individual water intake, dry matter intake (DMI), weather data (air temperature [max and min] and humidity [max and min], water temperature [max and min]), and average liveweight. The data were standardized before the analysis.
The statistical analysis developed for Experiment 2 to evaluate water intake (L/day) on a mob level for each experimental period, evaluating treatments and between periods, was developed as a completely randomized design. Some tests were evaluated using THI and rainfall as covariates in the model; however, both variables were not significant in this model. The model applied for the analysis was the same from Experiment 1. A similar multivariable analysis was performed using water intake in a herd level, the TDS of water (WaterTDS), pH of water (WaterpH), the temperature humidity index (THI) and weather data (rainfall [Rain], relative humidity [RH], air temperature [TMin, TMax], and wind speed [WindMax]) from Experiment 2. The data were standardized before the analysis.
All statistical analyses were performed using software R (version 4.3.2) [13].
3. Results
Understanding water preferences in cattle, particularly when water medication is in place, is crucial for optimizing their welfare, liveweight gain, and reproduction. Proper hydration is essential for overall health, digestion, and nutrient absorption in cattle, directly affecting production.
3.1. Experiment 1
Throughout the 7-day experiment, the pH and water temperature were consistently monitored in each trough. The water temperatures ranged from 24.2 °C to 30.3 °C during various refilling intervals (morning and afternoon). As for pH levels, T1 showed an average of 3.16 throughout the entire experiment, while T2 registered 3.36, and T3 recorded 6.26. Weather conditions in the animal shed were monitored throughout the experiment and included a maximum temperature of 32.5 °C, a minimum temperature of 20.5 °C, maximum humidity of 99%, and minimum humidity of 41%. Total Dissolved Solids (TDS) in water refer to the combined concentrations of all inorganic and organic substances present in a liquid in a dissolved form. These solubles can include minerals, salts, metals, and other compounds. As expected, the TDS of treated water were 3-fold higher due to the addition of urea and other ingredients in the water-based supplements. Both magnesium and calcium hardness were not different across treatments.
Results from water tests are shown according to treatment in Table 3.
Table 3.
Chemical characteristics of the water medicated or not (treatments: T1, T2 and T3) offered ad libitum to cattle throughout a 7-day period in Experiment 1.
No differences were observed in total water intake (p-Value = 0.67), total time spent drinking (p-Value = 0.57), and water intake ratio (L water consumed/min, p-Value = 0.90) (Table 4). On average, animals consumed a total of 31.8 L of water from each treatment, and the individual water intake was 13.6 L/head/day. These animals spent 5 min 32 s on average per day drinking water.
Table 4.
Total water intake (L/head), total time spent drinking (min/head), water intake ratio (L water consumed/min) of animals with free access to three different treatments (T1, T2, T3) 1 during the 7 days.
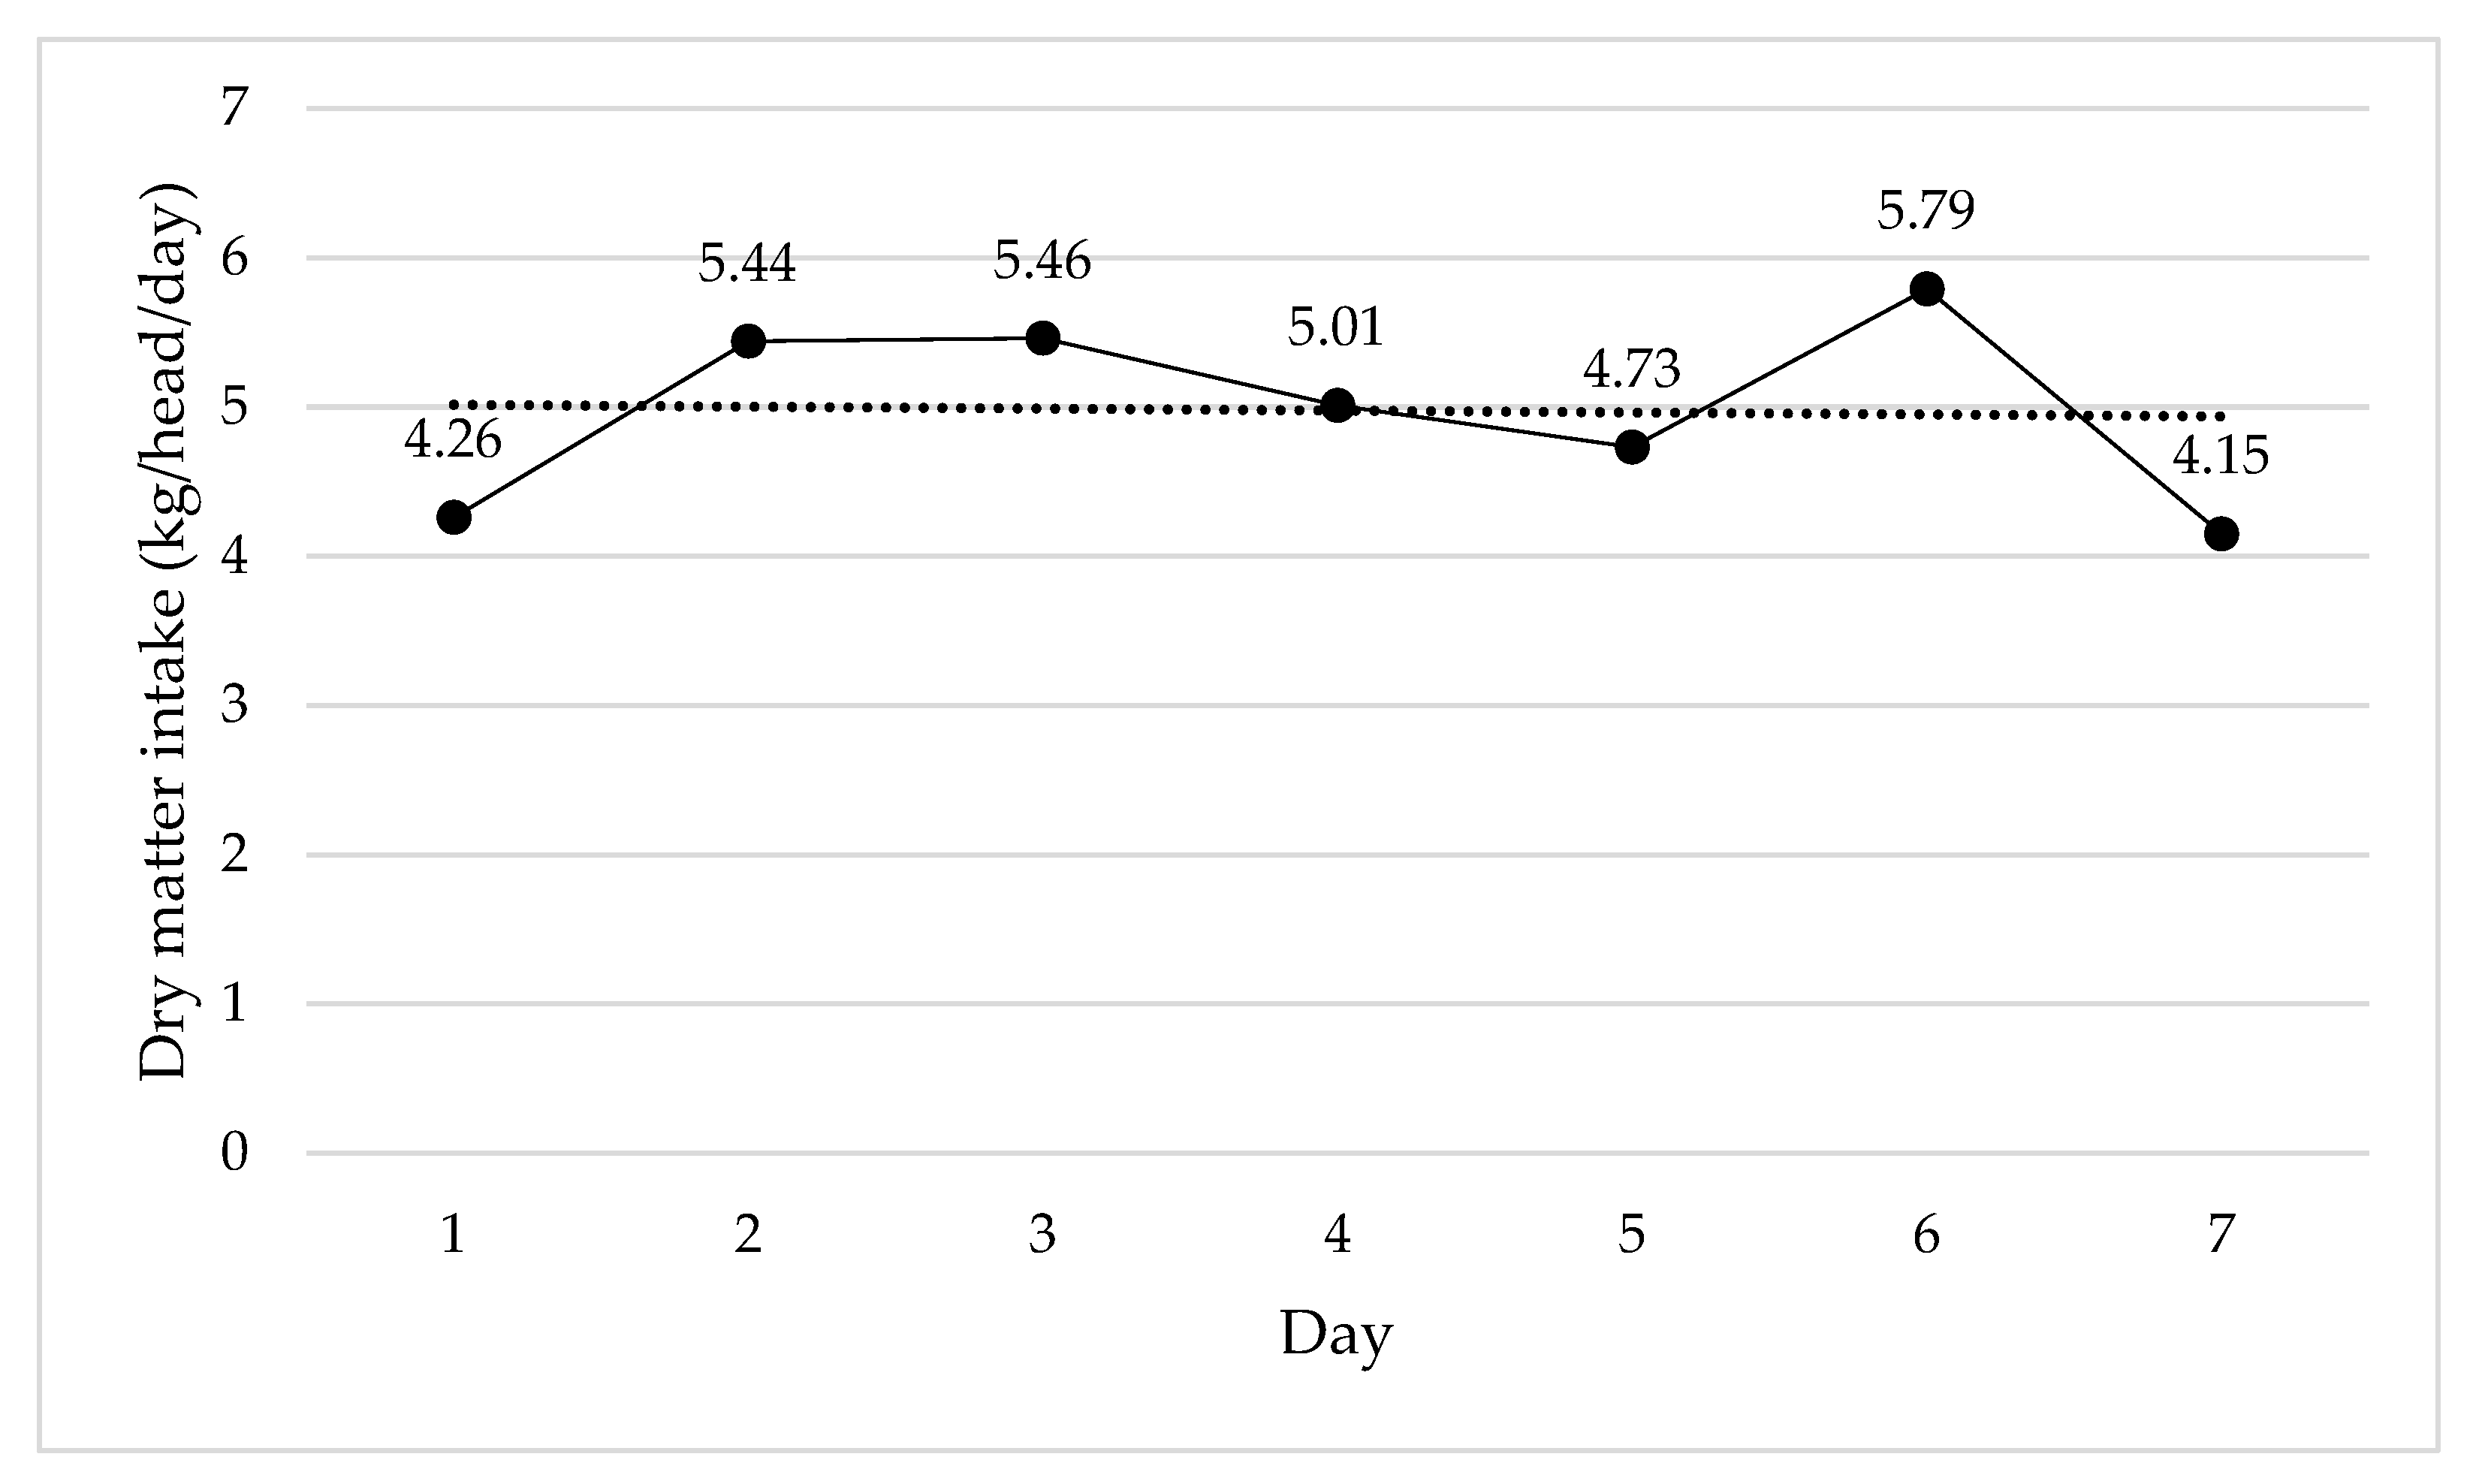
The DMI was evaluated to check any effects (linear, quadratic) during the experimental period; however, no effects were observed. The average DMI was 4.97 kg DM/head/day over the 7 day period in which average values changed slightly from day to day (Figure 3).
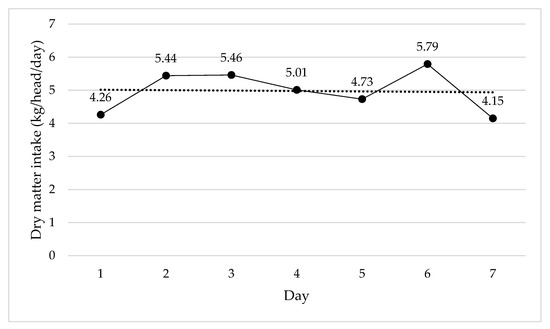
Figure 3.
Daily average dry matter intake of steers consuming Rhodes grass hay and with unrestricted access to different water sources in Experiment 1.
The water intake was evaluated similarly. However, considering a measure repeated on time, there were no differences between treatments (p-Value = 0.65) and time (p-Value = 0.52) and no interactions (p-Value = 0.79). The average water consumed from each treatment was T1 4.48 L/day: T2 5.00 L/day, and T3 4.16 L/day. This average, considered by day between all treatments, was 4.64 L in the first experimental day, 5.34 L on Day 2, 4.88 L on Day 3, 4.58 L on Day 4, 4.47 L on Day 5, 4.17 L on Day 6, and 3.75 L on the final day. The average liveweight recorded was 291 ± 6.1 kg (mean ± S.E.).
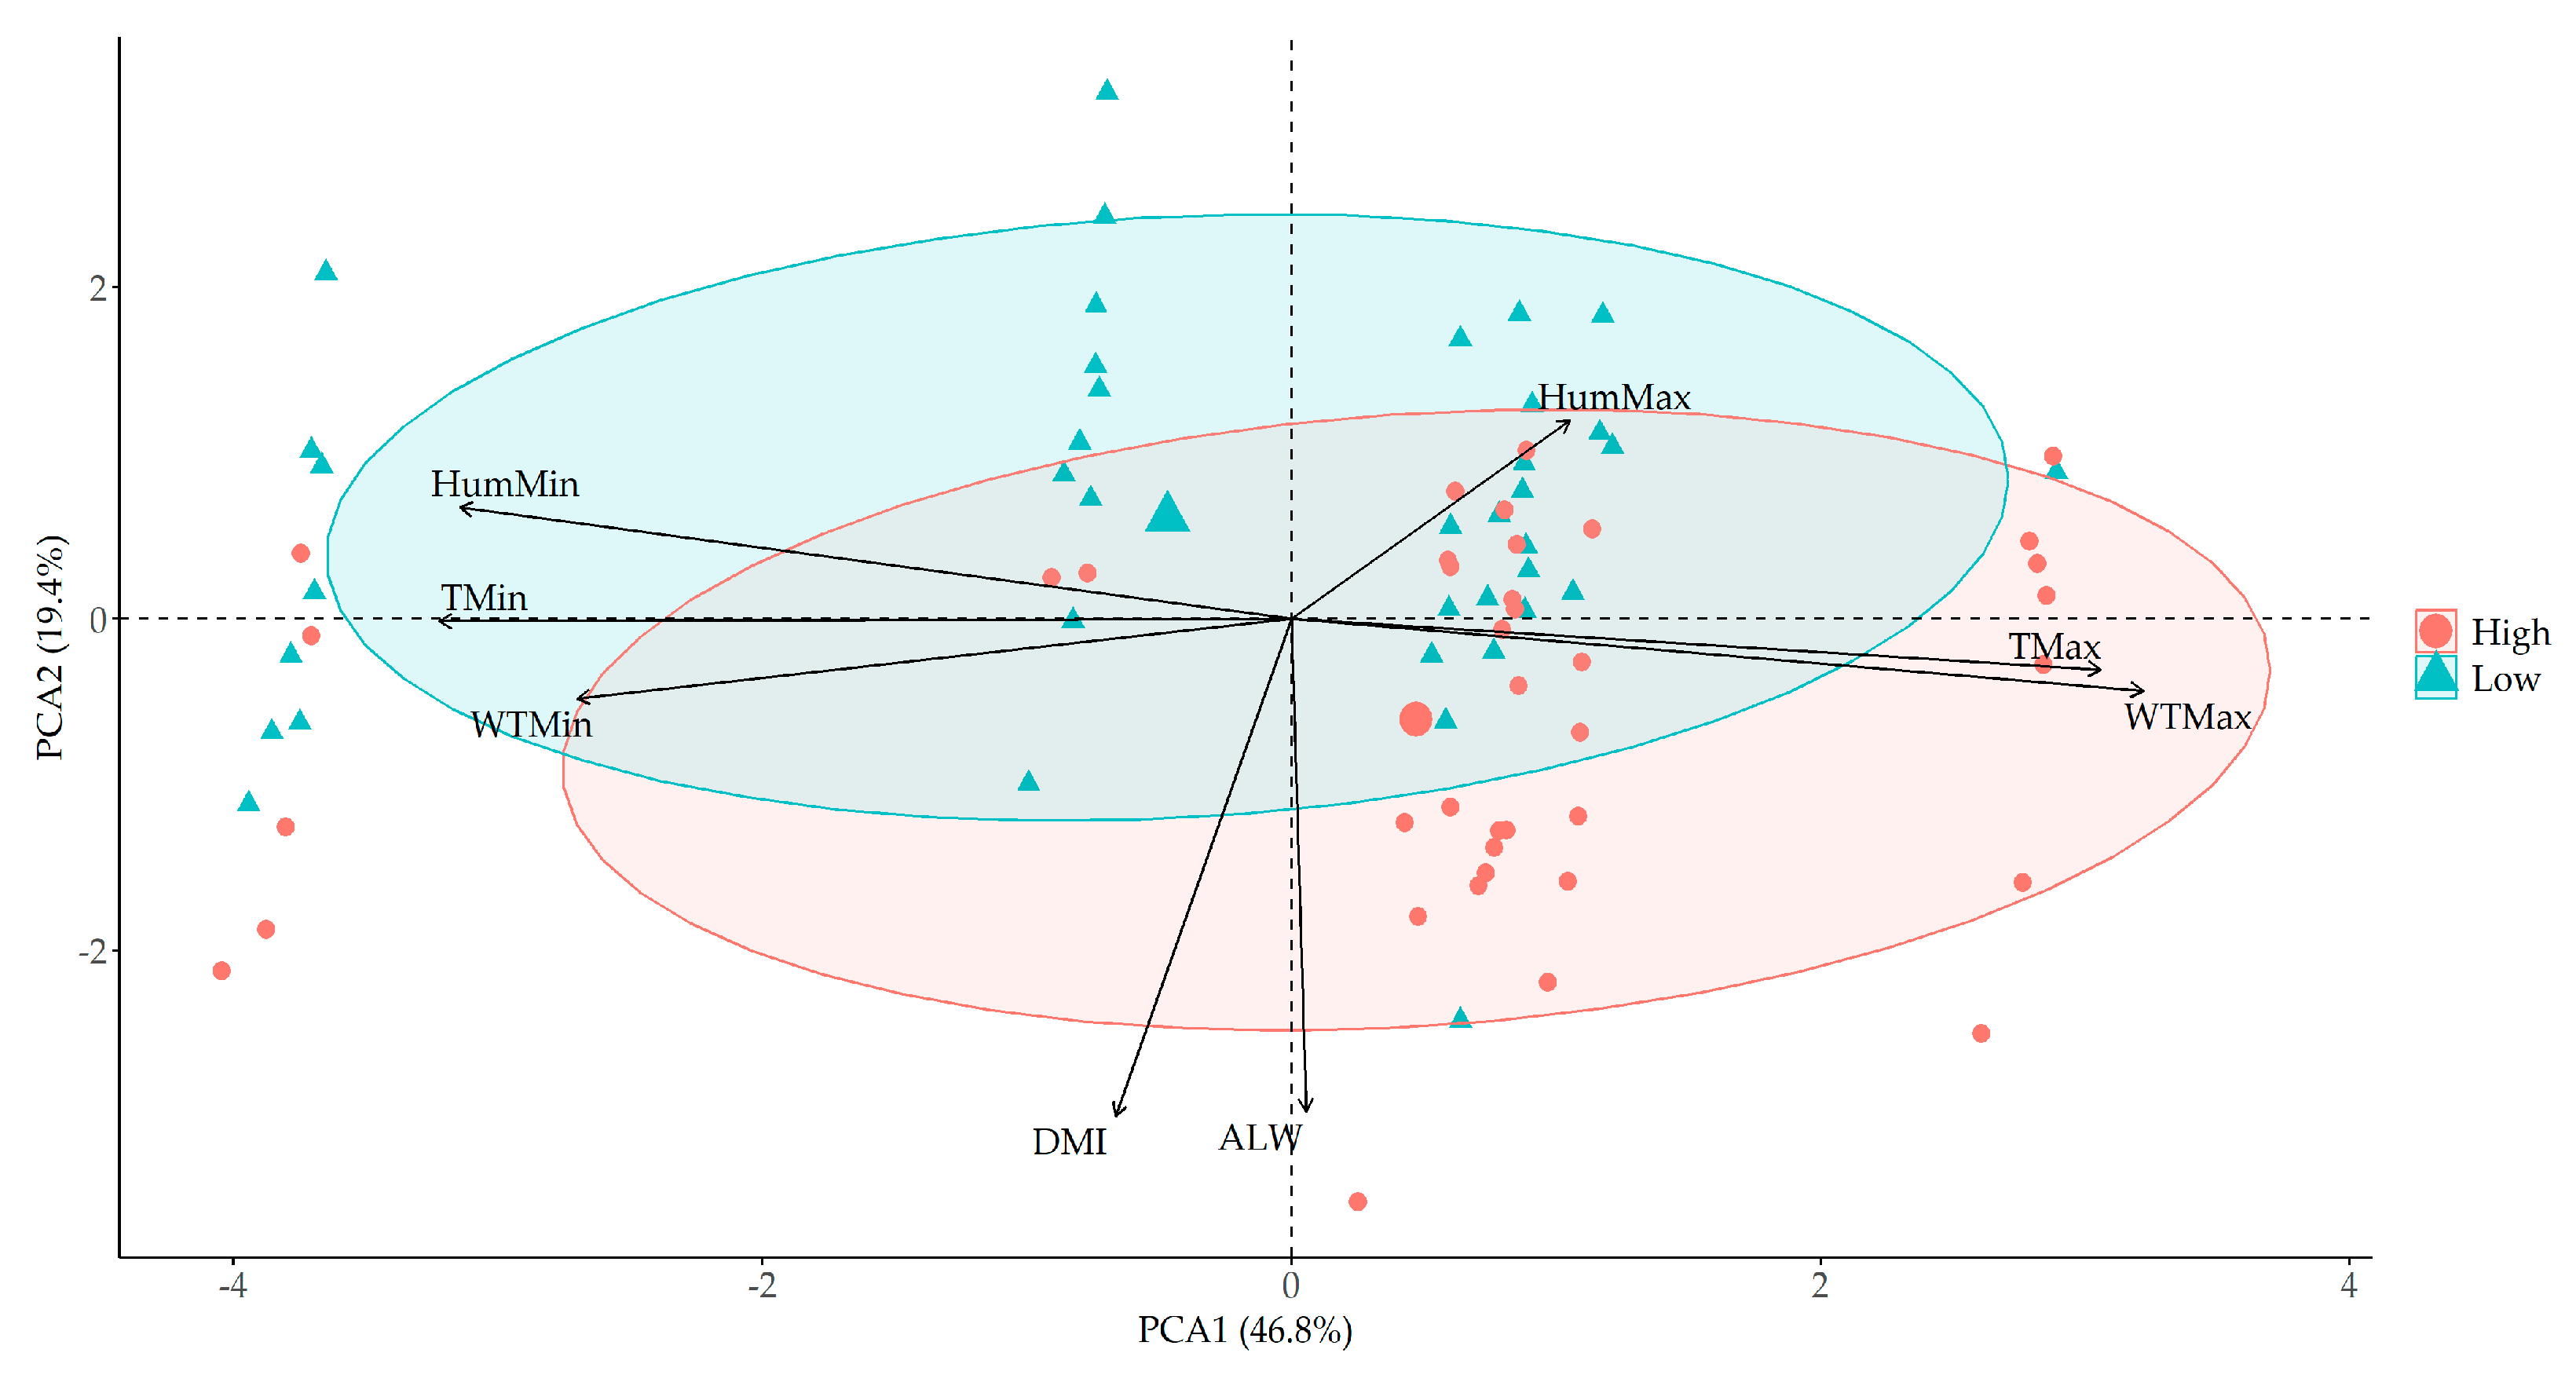
The PCA analysis (Figure 4) successfully accounted for 66.2% of the total variance, with PCA 1 explaining 46.8% and PCA 2 explaining 19.4%. Individual daily water intakes (L/day) for each animal were categorized into high and low groups based on the top and bottom 20% measurements, facilitating a nuanced understanding of water intake patterns.
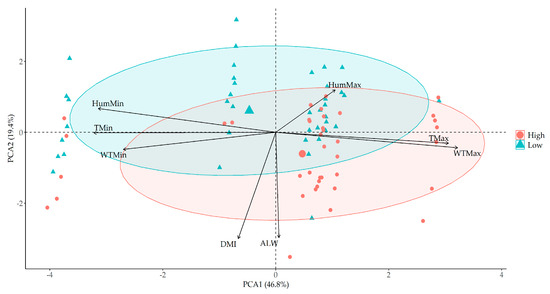
Figure 4.
Principal component analysis (PCA) with two water intake classes (high vs. low) to understand the main effects on individual water intake in Experiment 1.
Although high and low water intakes do not exhibit clear clustering, Figure 4 reveals some very interesting patterns. There is a tendency for increased water intake influenced by factors such as air temperature max (TMax), water max temperature (WTMax), DMI, and LW. Conversely, a tendency to decrease water intake is observed, primarily influenced by air temperature min (TMin) and air humidity min (HumMin).
3.2. Experiment 2
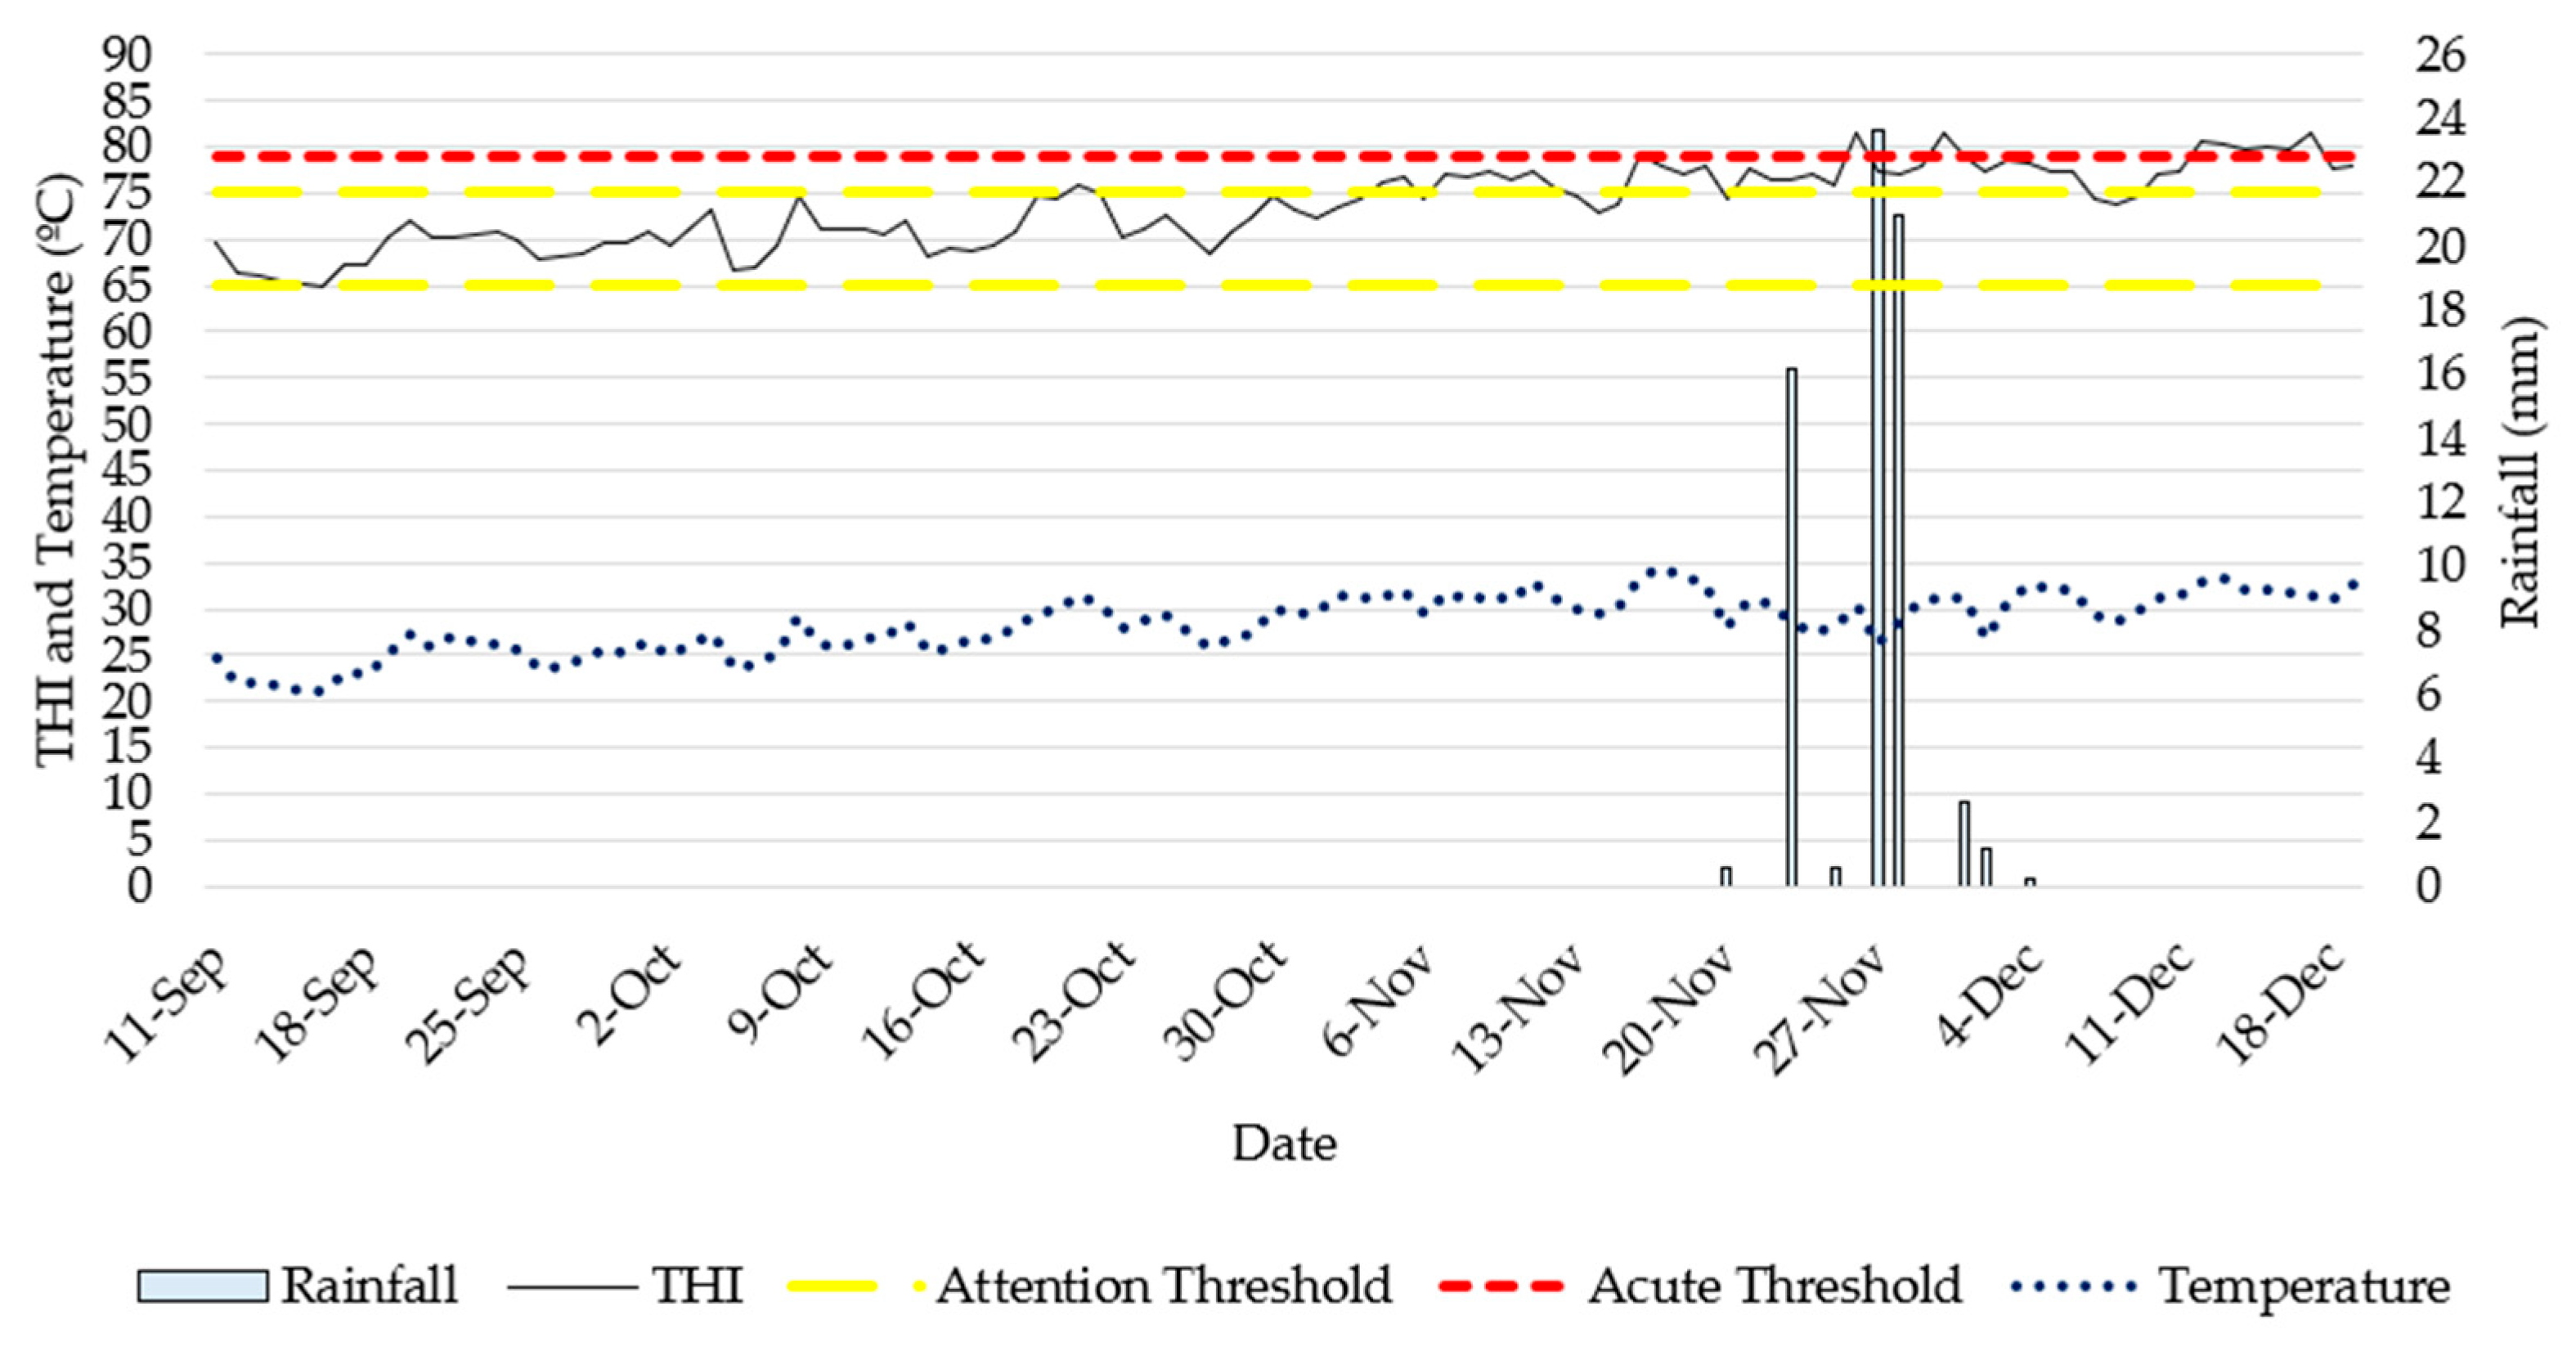
Throughout the experimental period from September to December 2023 (Figure 5), comprehensive weather data, including temperature, rainfall, and Temperature−Humidity Index (THI), were consistently recorded. The THI calculations generally remained within the 65–75 threshold, but there were instances where it exceeded this range. The first breach occurred on 16 November 2023, with subsequent breaches on 26 November, 30 November, and a prolonged period between 12 December and 18 December 2023. Rainfall, totalling 66 mm, was observed from 20 November to 4 December 2023, leading to the accumulation of surface water in the paddock. The average air temperature ranged from 34.4 °C to 21.1 °C, with an average of 28.5 °C. Notably, maximum and minimum threshold temperatures were 42.6 °C (on 18 November 2023) and 9.3 °C (on 16 September 2023), respectively (Table S1, Supplementary Materials). The rainfall previously described occurred during the last week of Experimental Period 3 and the first week of Experimental Period 4.
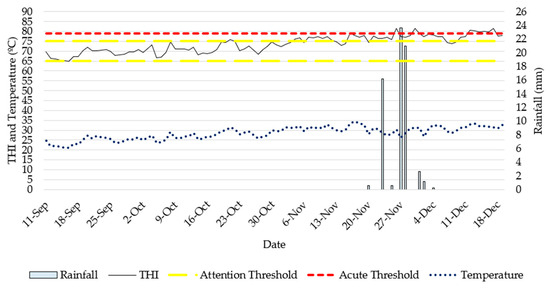
Figure 5.
Temperature Humidity Index (THI) and weather information (average temperature [°C] and rainfall [mm]) calculated or recorded during the experimental period (September 2023 until December 2023) from Wilburra Downs Station (Richmond, Queensland—Australia).
Results from water tests during the experimental period were split according to treatment and water trough (Table 5).
Table 5.
Chemical characteristics of the water, medicated or not (treatments: RD, HD, NC, PC), offered to cattle during the experimental periods in Experiment 2.
The chemical characteristics of the waters, medicated or not, provided for the animals during the experiment were consistent for all treatments, with a pH close to neutrality and the TDS readings constantly below 1000 ppm, irrespective of treatment. During the last week of the 3rd experimental period and the first week of 4th experimental period, the rainfall caused some accumulation of surface water, which was sampled and evaluated. The results from this water indicated a high pH 7.65, TDS of 271 ppm, a hardness calcium at 1.59 ppm, and hardness magnesium at 0.1 ppm.
The water intake (L/day) in a mob level (120 steers) was different (p-Value < 0.0001) between the treatments according to period, except on the fourth experimental period (Table 6). The water intake was different (p-Value < 0.0001) with higher water consumption during the first experimental period (1944 L/day), no different to Experimental Period 2 (1502 L/day). The second experimental period did not differ from the third (1021 L/day), and the lowest water intake was measured during Experimental Period 4 (570 L/day), likely due to the presence of surface water.
Table 6.
Water intake (L/day) in a herd level according to experimental periods for steers kept in an extensive grazing system in Experiment 2.
At the end of the four experimental periods, the LW of animals were the following: Angus 267 ± 7.6 kg; Brahman 275 ± 7.8 kg; Charolais 269 ± 5.8 kg and Senepol 258 ± 4.7 kg (mean ± S.E.).
To delve into animal drinking water behaviour, a multivariable analysis, a Principal Component Analysis (PCA) in particular, was conducted using raw data from Wilburra Downs Station (Figure 6). The PCA explained 68.1% of the total variance (48% PCA 1 and 19.1% PCA 2). Clear clustering between days with high and low water intake at the herd level was evident. Each cluster, representing 20% of total readings, was categorized based on the range of water intake. The high cluster comprised the top 20% of readings with the highest records, while the low cluster consisted of the bottom 20% with the lowest records for water intake at the herd level.
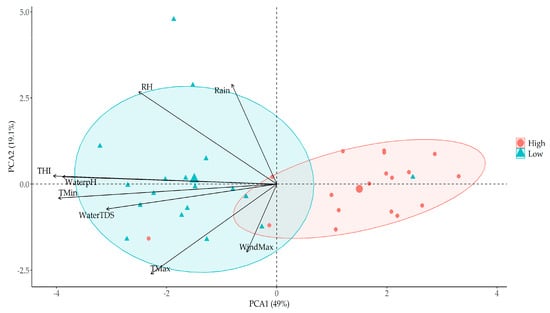
Figure 6.
Principal component analysis (PCA) related to water intake in a herd level to understand the main factors effecting the animal behaviour during Experiment 2, developed at Wilburra Downs Station (Richmond, Queensland—Australia).
In a general approach, except to wind speed (WindMax), all variables (Rain, RH, THI, WaterpH, TMin, WaterTDS, TMax) added into PCA analysis had an inverse relationship with water consumption on a herd level. When the values of these variables increase, there is a tendency to reduce water intake on a herd level.
4. Discussion
In our study, we explored water preferences in cattle and their potential impact on liveweight gain, building upon established protocols and findings from previous research. Coimbra et al. [9] proposed the need for an initial adaptation period of four days, while Lardner et al. [14] introduced an alternative procedure in beef cattle behaviour assessment, randomly moving water types among troughs to ensure preference was based on water type rather than location. In our experiments, treatments were consistently maintained in the same water troughs throughout the study. However, Experiment 1 was conducted in a confined area with no prior use of the troughs, and results revealed no significant differences in any of the variables analysed. The average water intake fell within the range suggested by Utley et al. [3], aligning with McLennan et al. [15] for the dry season in an extensive grazing system. In contrast, in our grazing trial in Experiment 2, under extensive conditions, differences were observed in water intake between treatments and experimental periods. However, the infrequent water consumption during this experiment was likely influenced by prior animal behaviour, forage availability (Figure 7), weather conditions, and the fact that we had surface water accumulation. Even with adjustments being performed where water was provided in other troughs in an attempt to modify pre-existing animal behaviour effects, the water preference analysis indicated that animals returned to the water troughs they originally drank from. Sheffield et al. [16] suggested that cows with previous experience drinking water in a specific location, such as a stream, developed a higher preference for drinking water from that location compared to others. A decrease in access was observed, and, consequently, in water consumption, during periods of reduced forage and increased distances walked. The reduced water consumption observed in livestock herds in extensive grazing systems in northern Australia is primarily attributed to the animals’ increased search for grazing areas. Yeates and Schmidt [17] highlighted in a report that water consumption is traditionally infrequent in such herds, possibly due to conditions like those observed in Experiment 2.

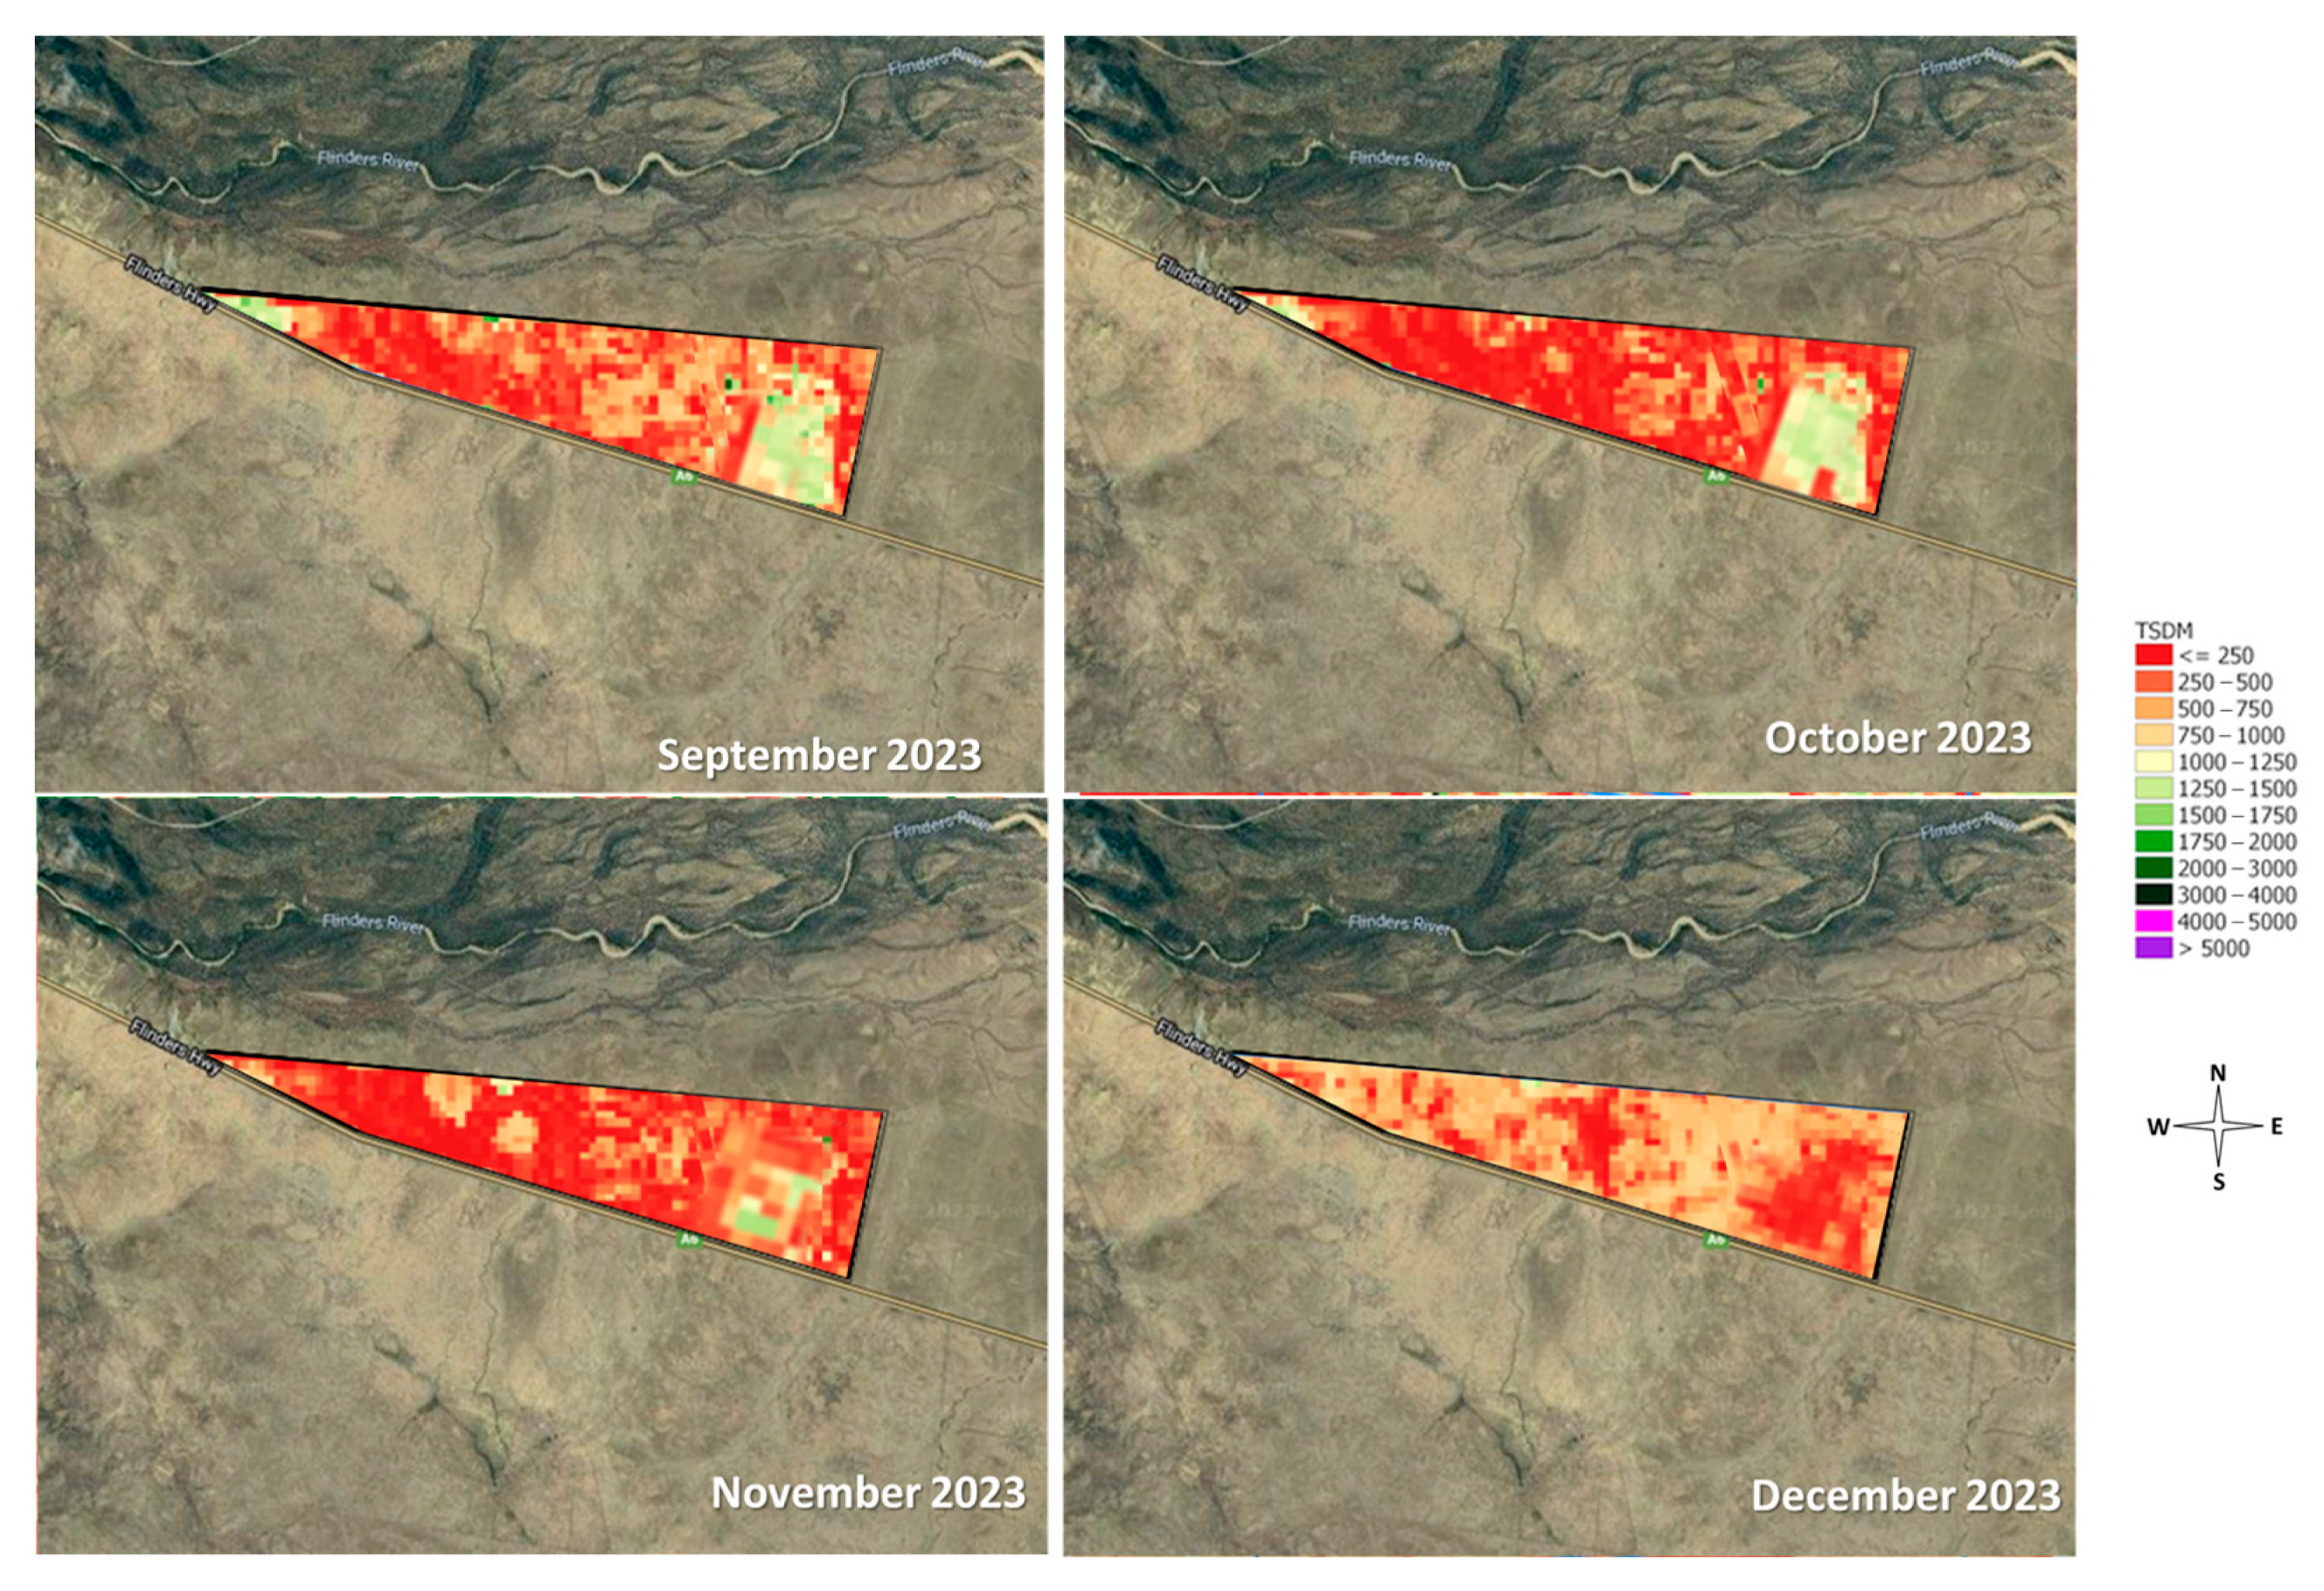
Figure 7.
Total standing dry matter (kg DM/ha, TSDM) evolution during experimental period—Experiment 2, developed at Wilburra Downs Station (Richmond, Queensland—Australia). Source: Adapted from CiboLabs [8].
The higher forage availability near the creek depression (West of the paddock), coupled with surface water availability, is likely responsible for the decreased water intake during the Experimental Period 4, particularly in the days following the rainfall event. The suggestion to reduce water intake from troughs only during the initial days after rainfall stems from the fact that animals tend to decrease their consumption from water sources contaminated with manure [2], as would likely occur in the creek depression area.
During Experiment 2, surface water accumulation at the end of Experimental Period 3 and the beginning of Experimental Period 4 potentially reduced water intake from troughs, particularly in the latter period. Lardner et al. [14] suggested that water-drinking behaviour in cattle is allelomimetic, with animals in the same group collectively copying other animals in the cohort exhibiting similar behaviours. Large herds in extensive grazing systems tend to walk together towards water sources, with dominant animals leading others to drink from the surface. Weather conditions (air temperature, humidity, rainfall) also impact water intake, as widely reported [18,19,20]. Similar impacts were observed in both experiments through principal component analysis, aligning with the Meyer et al. [21] findings that water intake of young calves increased by 0.5 L per degree rise in air temperature. In Experiment 1, when the maximum air temperature was reached, water intake reached a peak. Conversely, in Experiment 2, adverse weather variables led to reduced water intake, which were likely due to changes in surface water availability in the creek depression, causing the herd to prefer that source over troughs, potentially due to a higher forage availability in that area, as indicated by TSDM [8].
5. Conclusions
The findings from both experiments suggest that water medication can be employed for beef cattle grazing in tropical conditions with no disruption to their natural behaviour. The findings indicate that supplements via water did not change water preference. Experiment 1, conducted in a controlled environment, showed no animal preference irrespective of water sources. In Experiment 2, conducted in an extensive grazing system, notable differences were linked to external factors, such as weather conditions and pre-conditioning to specific areas, rather than a distinct preference for a treatment. Further research, which could include the use of GPS devices to monitor animal activity across different seasons, pastures, and property management scenarios, would lead to a more thorough understanding of behavioural responses to changes in water availability, such as those linked to surface water during rainfall events.
Supplementary Materials
The following supporting information can be downloaded at: https://www.mdpi.com/article/10.3390/ruminants4020015/s1, Table S1. Weather data (temperatures, humidity, rainfall, wind information, pressures) from Wilburra Downs (Richmond, QLD—Australia) during all experimental period (September 2023 until 19 December 2023) obtained from Bureau of Meteorology [10]; Table S2. Weather variables (evaporation and temperature humidity index [THI]) during the experimental period—Trial 2 at Wilburra Downs (Richmond, QLD—Australia).
Author Contributions
Conceptualization, E.P.R., V.M. and D.F.A.C.; methodology, E.P.R. and D.F.A.C.; formal analysis, E.P.R. and P.A.B.; investigation, E.P.R., S.M., K.D.d.S., W.L.d.S. and D.F.A.C.; resources, V.M., D.F.A.C., E.P.R. and P.A.B.; writing—original draft preparation, E.P.R.; writing—review and editing, E.P.R., V.M., S.M., K.D.d.S., W.L.d.S., P.A.B. and D.F.A.C.; supervision, E.P.R. and D.F.A.C.; project administration, V.M. and D.F.A.C.; funding acquisition, V.M. and D.F.A.C. All authors have read and agreed to the published version of the manuscript.
Funding
This research was partially funded by DIT AgTech.
Institutional Review Board Statement
The animal study protocol in Experiment 1 was approved by the CQUniversity Animal Ethics Committee (approval number 24410). Data used in Experiment 2 came from a commercial operation in which all procedures adhered to the Australian code for the care and use of animals for scientific purposes.
Data Availability Statement
All data supporting reported results can be shared upon request directly to our corresponding author. Complete contact details at http://lattes.cnpq.br/4790029508324139, accessed on 5 March 2024.
Acknowledgments
We acknowledge the support in Experiment 2 from the staff at Wilburra Dows Station in Richmond, QLD, Australia.
Conflicts of Interest
The authors have read the journal’s guideline and have the following competing interests: the first author (E.P.R.), and co-authors (S.M.) and (V.M) are employees of DIT AgTech, which partially financed the project and provided the dosing technology and minerals used in the supplements. The other authors have no competing interests.
References
- Beede, D.K. What will our ruminants drink? Anim. Front. 2012, 2, 36–43. [Google Scholar] [CrossRef]
- Yoshihara, Y.; Tada, C.; Takada, M.; Purevdorj, N.-O.; Chimedtseren, K.; Nakai, Y. Effects of water source on health and performance of Mongolian free-grazing lambs. Small Rumin. Res. 2016, 137, 81–84. [Google Scholar] [CrossRef]
- Utley, P.R.; Bradley, N.W.; Boling, J.A. Effect of restricted water intake on feed intake, nutrient digestibility and nitrogen metabolism in steers. J. Anim. Sci. 1970, 31, 130–135. [Google Scholar] [CrossRef] [PubMed]
- National Research Council. Nutrient Requirements of Small Ruminants: Sheep, Goats, Cervids, and New World Camelids; NRC: Washington, DC, USA, 2007; 384p. [Google Scholar]
- SCA. Feeding Standards for Australian Livestock: Ruminants; CSIRO Publishing: Clayton, Australia, 1994; 266p. [Google Scholar]
- Beed, D.K. Solving bad water problems for thirsty cows. In Proceedings of the Western Dairy Management Conference, Reno, NV, USA, 19 January 2009; Available online: http://wdmc.org/2009/Solving%20Bad%20Water%20Problems%20for%20Thirsty%20Cows (accessed on 9 January 2024).
- National Health and Medical Research Council. Any Use of Animals for Scientific Purposes Must Be Ethical, Humane and Responsible; Butterworths Pty Limited: Sydney, NSW, Australia, 2021. Available online: https://www.nhmrc.gov.au/about-us/publications/australian-code-care-and-use-animals-scientific-purposes (accessed on 1 September 2023).
- CiboLabs. Building Solutions for Agriculture. Available online: https://www.cibolabs.com.au/ (accessed on 27 December 2023).
- Coimbra, P.A.D.; Machado Filho, L.C.P.; Nunes, P.A.; Hötzel, M.J.; de Oliveira, A.G.L.; Cecato, U. Effect of water trough type on the drinking behaviour of pasture-based beef heifers. Animal 2010, 4, 116–121. [Google Scholar] [CrossRef] [PubMed]
- BOM. Average Annual, Seasonal and Monthly Rainfall. Available online: http://www.bom.gov.au/climate/dwo/IDCJDW4100.latest.shtml (accessed on 28 December 2023).
- Linacre, E.T. A simple formula for estimating evaporation rates in various climates using temperature data alone. Agric. Meteorol. 1977, 8, 409–424. [Google Scholar] [CrossRef]
- Copley, J.P.; Engle, B.N.; Ross, E.M.; Speight, S.; Fordyce, G.; Wood, B.J.; Voss-Fels, K.P.; Hayes, B.J. Environmental variation effects fertility in tropical beef cattle. Transl. Anim. Sci. 2022, 6, txac035. [Google Scholar] [CrossRef] [PubMed]
- RStudio. Team RStudio: Integrated Development Environment for R. 2023. Available online: https://www.rstudio.com/categories/integrated-development-environment/ (accessed on 28 December 2023).
- Lardner, H.A.; Braul, L.; Schwartzkopf-Genswein, K.; Schwean-Lardner, K.; Damiran, D.; Darambazar, E. Consumption and drinking behavior of beef cattle offered a choice of several water types. Livest. Sci. 2013, 157, 577–585. [Google Scholar] [CrossRef]
- McLennan, S.R.; Hirst, D.J.; Shepherd, R.K.; McGuigan, K.R. A comparison of various methods of feeding supplements of urea, sulfur and molasses to weaner heifers during the dry season in northern Queensland. Aust. J. Exp. Agric. 1991, 31, 153–158. [Google Scholar] [CrossRef]
- Sheffield, R.E.; Mostaghimi, S.; Vaughan, D.H.; Collins, E.R., Jr.; Allen, V.G. Off-stream water sources for grazing cattle as a stream bank stabilization and water quality BMP. Trans. ASAE 1997, 40, 595–604. [Google Scholar] [CrossRef]
- Yeates, N.T.M.; Schmidt, P.J. Beef Cattle Production; Butterworths Pty Limited: Sydney, NSW, Australia, 1974; 323p. [Google Scholar]
- Rouda, R.R.; Andersson, D.M.; Wallace, J.D.; Murray, L.W. Free-ranging cattle water-consumption in south-central New-Mexico. Appl. Anim. Behav. Sci. 1994, 39, 29–38. [Google Scholar] [CrossRef]
- Meyer, U.; Everinghoff, M.; Gadeken, D.; Flachowsky, G. Investigations on the water intake of lactating dairy cows. Livest. Prod. Sci. 2004, 90, 117–121. [Google Scholar] [CrossRef]
- Loneragan, G.H.; Wagner, J.J.; Gould, D.H.; Garry, F.B.; Thoren, M.A. Effects of water sulfate concentration on performance, water intake and carcass characteristics of feedlot steers. J. Anim. Sci. 2001, 79, 2941–2948. [Google Scholar] [CrossRef] [PubMed]
- Meyer, U.; Stahl, W.; Flachowsky, G. Investigations on the water intake of growing bulls. Livest. Sci. 2006, 103, 186–191. [Google Scholar] [CrossRef]


Disclaimer/Publisher’s Note: The statements, opinions and data contained in all publications are solely those of the individual author(s) and contributor(s) and not of MDPI and/or the editor(s). MDPI and/or the editor(s) disclaim responsibility for any injury to people or property resulting from any ideas, methods, instructions or products referred to in the content. |
© 2024 by the authors. Licensee MDPI, Basel, Switzerland. This article is an open access article distributed under the terms and conditions of the Creative Commons Attribution (CC BY) license (https://creativecommons.org/licenses/by/4.0/).