Article

Evaluating the Bias of Two Point-of-Care Glucometers for Calves and Ewes: Awareness for Ruminant Practitioners

by
Ryan Flynn
1,
Haley Cremerius
1,
Lisa Ebner
2,
Pierre-Yves Mulon
1,
Jessica Garcia
1,
Kailee Bennett
1,
Jessica Gerbert
2,
Lainey Harvill
1,
Olivia Escher
1,
Channing Cantrell
1,
Windy Soto-Gonzalez
1,
Rebecca R. Rahn
1,
Jeff D. Olivarez
3,
Lingnan Yuan
3,
Jonathan P. Mochel
4,
Amanda J. Kreuder
5 and
Joe Smith
1,3,*
1
Large Animal Clinical Sciences, University of Tennessee College of Veterinary Medicine, Knoxville, TN 37996, USA
2
Richard A. Gillespie College of Veterinary Medicine, Lincoln Memorial University, Harrogate, TN 37752, USA
3
Biomedical Sciences, Iowa State University College of Veterinary Medicine, Ames, IA 50011, USA
4
Department of Pathology, University of Georgia College of Veterinary Medicine, Athens, GA 30602, USA
5
Veterinary Microbiology and Preventive Medicine, Iowa State University College of Veterinary Medicine, Ames, IA 50011, USA
*
Author to whom correspondence should be addressed.
Ruminants 2024, 4(3), 304-315; https://doi.org/10.3390/ruminants4030022
Submission received: 11 May 2024 / Revised: 16 June 2024 / Accepted: 20 June 2024 / Published: 2 July 2024

Abstract

:

Simple Summary

Currently in medicine there are multiple point-of-care (POC) devices that can quickly give test results in a manner that will allow for testing to be performed outside of a hospital. One example of this is POC devices that measure blood glucose, which were originally developed for the human diabetic community. These devices have uses that extend into veterinary medicine. However, not all of these devices are used in species that they have been validated for, and device-to-device variation can exist. In this study, blood from healthy calves and ewes had blood glucose levels recorded from both a validated POC device and a device that is commonly used but is not validated. The results were compared statistically and differences were noted between the two devices. Ambulatory veterinarians should be aware of the differences in POC glucometers and be careful comparing results from one device to another, as the devices may have their own specific reference ranges. POC devices that have not yet been validated may still be useful for measuring trends in individual patients until they can be validated.

Abstract

(1) Background: Multiple point-of-care (POC) glucometers are in use in veterinary medicine, but few are compared to each other. This leaves the potential for clinicians to be unaware of the effect of bias when comparing results from different POC glucometers. (2) Methods: Samples from healthy calves and ewes were simultaneously compared with two POC veterinary glucometers, the Precision Xtra and the AlphaTrak2, under both the “canine” and “feline” settings. The results of each sample were statistically analyzed with linear regression and Bland–Altman analysis. (3) Results: 170 samples from healthy calves and 108 samples from healthy ewes were available for comparison. Calves: The AT2 consistently overestimated blood glucose concentrations when compared to the PX device with the calves. Correlationt with the PX was r = 0.8496 (canine setting) and r = 0.8861 (feline setting). Both the canine and feline settings demonstrated a consistent bias (41.11 and 33.64 mg/dL, respectively). Ewes: The AT2 consistently overestimated blood glucose concentrations when compared to the PX device with the ewes. Correlation with the PX was R = 0.4710 (canine setting) and R = 0.7269 (feline setting). Both the canine and feline settings demonstrated a consistent bias (21.23 and 14.54 mg/dL, respectively). (4) Clinicians should be aware of the potential for consistent bias when evaluating calf and sheep blood glucose concentrations as the AT2 device, at both settings, overestimated blood glucose compared to the previously validated PX. This reliability appears to change when the values are farther from the normal ranges, which should be considered when making clinical decisions based on data from these devices.

1. Introduction

Point-of-care (POC) diagnostic devices are becoming increasingly popular for veterinary use. The benefits of these instruments include portability for in-field use, rapid test results, and lower cost than conventional benchtop laboratory analyzers. Potential challenges for the use of these instruments in veterinary field settings include a lack of evaluation or validation for the species of interest, as well as limited information for the interpretation of test results from a POC analyzer. In human medicine, POC blood glucose assessment is considered standard of care [1]. The ability to assess blood glucose in neonatal bovine and adult ovine patients is important for the diagnosis and therapeutic planning of many disease conditions [2]. For neonatal cases where hypoglycemia may be a concern, the speed of results obtained by a POC analyzer may have a profound effect on case outcome when compared to the speed of results obtained from laboratory analyzers. This is the same for adult sheep cases with hypoglycemia secondary to sepsis.
There were two objectives of this study: (1) The first objective was to compare the analytical performance of a commercial glucometer previously validated for bovine use, the Precision XTRA (PX; Abbott Diabetes Care, Alameda, CA, USA) [3], to a commercial glucometer evaluated for dog and cat use, the AlphaTRAK 2 (AT2; Zoetis Inc., Parsippany, NJ, USA). The PX device is a human glucometer that is also validated for the analysis of blood ketone bodies in cattle [4,5]. (2) The second objective of this study was to compare the analytical performance of a commercial glucometer previously validated for ovine use in pre- and postpartum ewes, the Precision XTRA (PX; Abbott Diabetes Care, Alameda, CA, USA) [3,6], to a commercial glucometer evaluated for dog and cat use, the AlphaTRAK 2 (AT2; Zoetis Inc., Parsippany, NJ, USA). While the AT2 device is not marketed for large animals, it is being used with increased frequency in large animal field settings, with applications described in goats, horses, and pigs [7,8,9]. Additional reports for use of the AT2 exist for mice, rabbits, and avian species [10,11,12]. An additional goal of this study was to compare the canine and feline settings to determine which setting had the most agreement for bovine and ovine use. We hypothesized that there would be a clinically relevant difference in measured blood glucose concentrations between the two POC analyzers for healthy calves and healthy ewes.

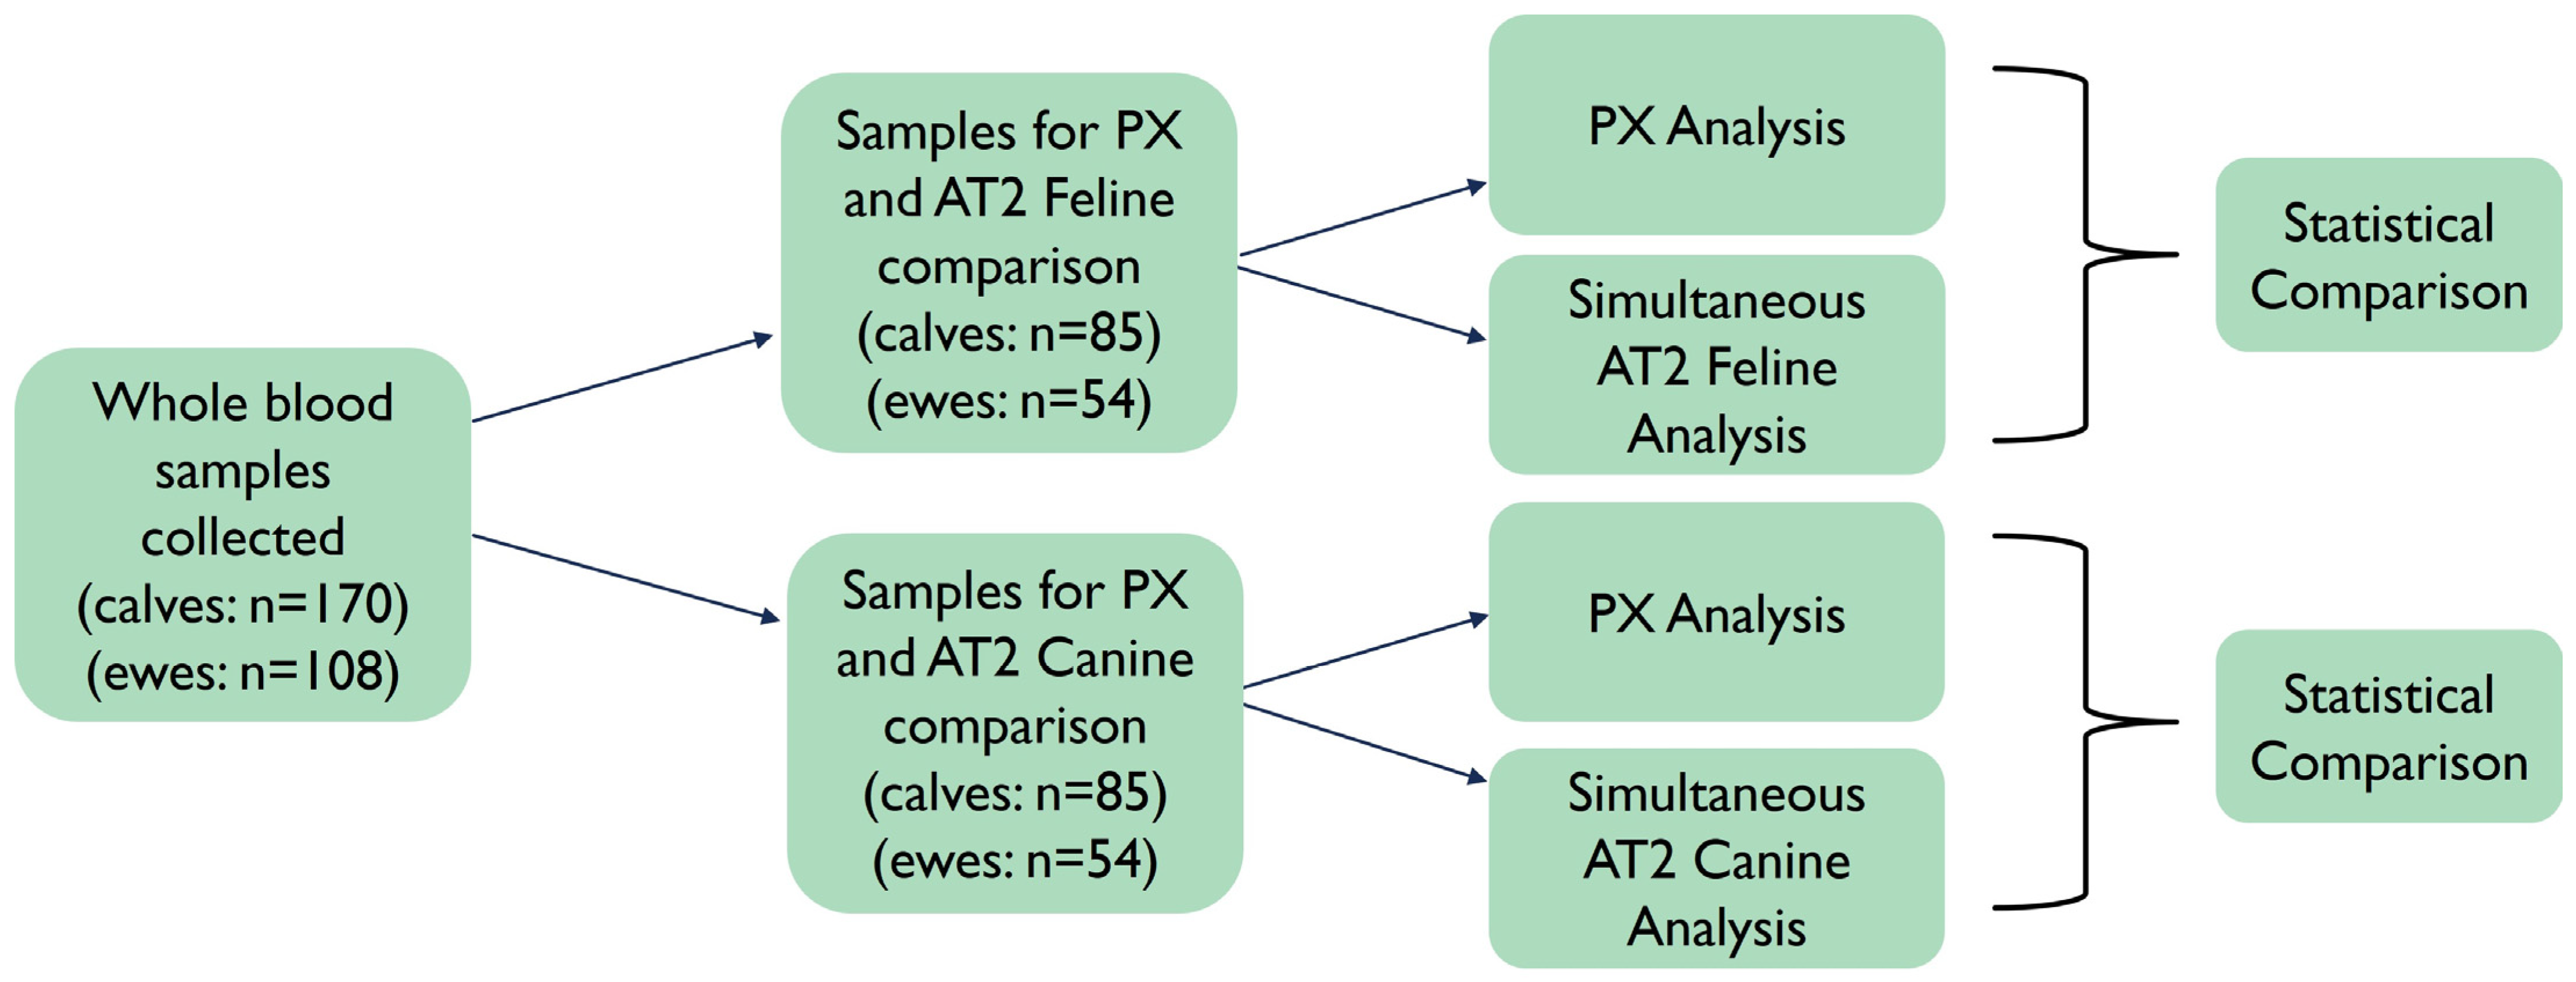
2. Materials and Methods

2.1. Calf Study Group

Six healthy Holstein–Angus crossbred bull calves were used for this study. At the initiation of the study, calf weights were (mean ± SD) 53.53 ± 2.27 kg. Calves were either 21 (n = 3) or 22 (n = 3) days old at the initiation of the study. Prior to enrollment, calves were assessed for health by a veterinarian. Calves were housed in individual hutches with ad libitum access to water and were offered a commercial milk-replacer diet that met or exceeded the nutritional recommendations set by the National Research Council. Calves were offered a commercial 20% protein/20% fat milk replacer (two liters) twice daily via bottle at 6 a.m. and 5 p.m. local time throughout the study. Calves were not fed any grain product until after the conclusion of the study. The blood collection protocol was approved by the Institutional Animal Care and Use Committee of the University of Tennessee (protocol #: 2825-05221) [13].
Residual blood collected for another study was used for glucometer evaluation. For blood collection, a 14 G, 9 cm intravenous catheter (MILACath®-Extended Use; MILA International, Inc., Florence, KY, USA) was aseptically placed in the jugular vein. Blood was collected by a previously described three-evacuation technique [14], with the catheter flushed before and afterwards with heparinized saline (heparin sodium 2 USP units/mL, Hospira Inc., Lake Forest, IL, USA). Blood was collected at multiple timepoints over a 15-day period. The sampling timepoints were 3:00 a.m., 9:00 a.m., 9:30 a.m., 10:00 a.m., 11:00 a.m., 12:00 p.m., 1:00 p.m., 5:00 p.m., and 9:00 p.m. local time. Once collected in a 10 mL lithium heparin blood tube (BD Medical Supply, Franklin Lakes, NJ, USA), blood was immediately analyzed by the glucometer, with individual aliquots (0.6 μL for the PX, 0.3 μL for the AT2) being simultaneously sampled by each device, with no more than 60 s elapsing between blood collection and sample analysis. A single-use glucometer strip was used for each sample. Devices were calibrated according to manufacturer’s recommendations throughout the study. The first group of samples (n = 85) was analyzed under the canine setting of the AT2 device, and the second group (n = 85) under the feline setting. Figure 1 displays a flow diagram of sample collection.
Several samples were also collected for microvalidation. For microvalidation purposes, the same sample was analyzed 10 times for PX blood glucose readings, as well as each AlphaTrak 2 setting (canine and feline) for evaluation of CV and bias. Microvalidation was performed for both whole blood collected into the lithium heparin blood tubes and whole blood collected into standard red-top tubes.
Results were analyzed for association and agreement between the different glucometers and glucometer settings. Association was evaluated via linear regression analysis. Agreement between methods including bias and limits of agreement was determined by use of the Bland–Altman method with repeated measures [15]. Samples were analyzed for correlation (Pearson r) between the PX device and the AT2 (for both canine and feline settings). After analysis, if the Pearson r value was <0.975, a Deming regression analysis was performed as previously described [16]. Performance goals were evaluated with the 95% confidence intervals of the slope and intercept including 1 and 0 (respectively) being considered acceptable, as previously described [17]. Commercially available statistical software (Prism 8.3.0, GraphPad Software LLC; MedCalc, 32, MedCalc Software Ltd., Ostend, Belgium; R version 4.0.5) was used for analysis as well as figure construction.

2.2. Ewe Study Group

Four healthy adult Southdown-cross ewes were used for this study. At the initiation of the study, the ewe weights were 67.9 ± 7.6 kg, and they were approximately aged to be 3.2 ± 0.7 years. Prior to enrollment, the ewes were assessed for health by a veterinarian. The sheep were housed in individual hutches with ad libitum access to water and were offered a commercial grass hay. The sheep were also fed a Co-Op sheep grain diet; however, the sheep were withheld grain a week before blood sample collection and up until the last blood sample was collected on the specified days. The offered diet met or exceeded the nutritional recommendations set by the National Research Council. The blood collection protocol was approved by the Institutional Animal Care and Use Committee of the University of Tennessee (protocol #: 2835–0521) [18].
Residual blood collected for another study was used for glucometer evaluation. For blood collection, a 14 G, 9 cm intravenous catheter (MILACath®-Extended Use; MILA International, Inc., USA) was aseptically placed in the jugular vein. Blood was collected by a previously described three-evacuation technique [19], with the catheter flushed before and afterwards with heparinized saline (heparin sodium 2 USP units/mL, Hospira Inc., USA). Blood was collected at multiple timepoints over a 31-day period. Every sampling day did not have the same timepoints, as they were dictated by the sampling timepoint of the other study. The sampling timepoints used for this field trial were 2:30 a.m., 8:00 am, 8:05 a.m., 8:10 a.m., 8:20 a.m., 8:30 a.m., 8:45 a.m., 9:00 a.m., 9:30 a.m., 10:00 a.m., 11:00 a.m., 12:00 p.m., 4:00 p.m., 4:30 p.m., and 8:30 p.m. Directly from the syringe, each blood sample was immediately analyzed by the glucometers, with individual aliquots (0.6 μL for the PX, 0.3 μL for the AT2) being simultaneously sampled by each device, with no more than 60 s elapsing between blood collection and sample analysis. A single-use glucometer strip was used for each sample. Devices were calibrated according to manufacturer’s recommendations throughout the study. The first group of samples (n = 54) was analyzed under the canine setting of the AT2 device, and the second group (n = 54) under the feline setting.
Two samples were also collected for microvalidation. For microvalidation purposes, the same sample was analyzed 10 times for PX blood glucose readings, as well as each AlphaTrak 2 setting (canine and feline) for evaluation of CV and bias. Microvalidation was performed using whole-blood samples from the syringe before placing the rest of the blood into lithium heparin tubes.
Results were analyzed for association and agreement between the different glucometers and glucometer settings. Association was evaluated via linear regression analysis. Agreement between methods, including bias and limits of agreement, was determined by use of the Bland–Altman method with repeated measures [15]. Samples were analyzed for correlation (Pearson r) between the PX device and the AT2 (for both canine and feline settings in each study population). After analysis, if the Pearson r value was <0.975, a Deming regression analysis was performed as previously described [16]. Performance goals were evaluated with the 95% confidence intervals of the slope and intercept including 1 and 0 (respectively) being considered acceptable, as previously described [17]. Additionally, the PX and AT2 device readings, both feline and canine (both settings for each study population) were compared with Lin’s Concordance. Commercially available statistical software (Prism 8.3.0, GraphPad Software LLC; MedCalc, 32, MedCalc Software Ltd.; R version 4.0.5) was used for analysis as well as figure construction.

3. Results

3.1. Samples and Microvalidation

3.1.1. Calf Study Group

The total number of samples compared was 170, with 85 samples used for each AT2 setting.
For microvalidation, repeatability of the PX was good for both heparinized and whole-blood samples (CV = 1.97 and 3.63%) as was the repeatability from the AT2 under the feline setting for heparinized (CV = 0.88%) and whole blood (0.20%). Samples evaluated for repeatability under the canine (AT2) setting had a similar CV % for heparinized (0.92%) and slightly higher for whole blood (3.02%).

3.1.2. Ewe Study Group

The total number of samples compared was 108, with 54 samples used for each AT2 setting.
For microvalidation, repeatability of the PX was good for the two whole-blood samples used (CV = 3.25% and 3.55%). The microvalidation repeatability of the AT2 feline setting was better than the PX (CV = 2.55%), while the AT2 canine setting had the lowest repeatability (CV = 1.71%).

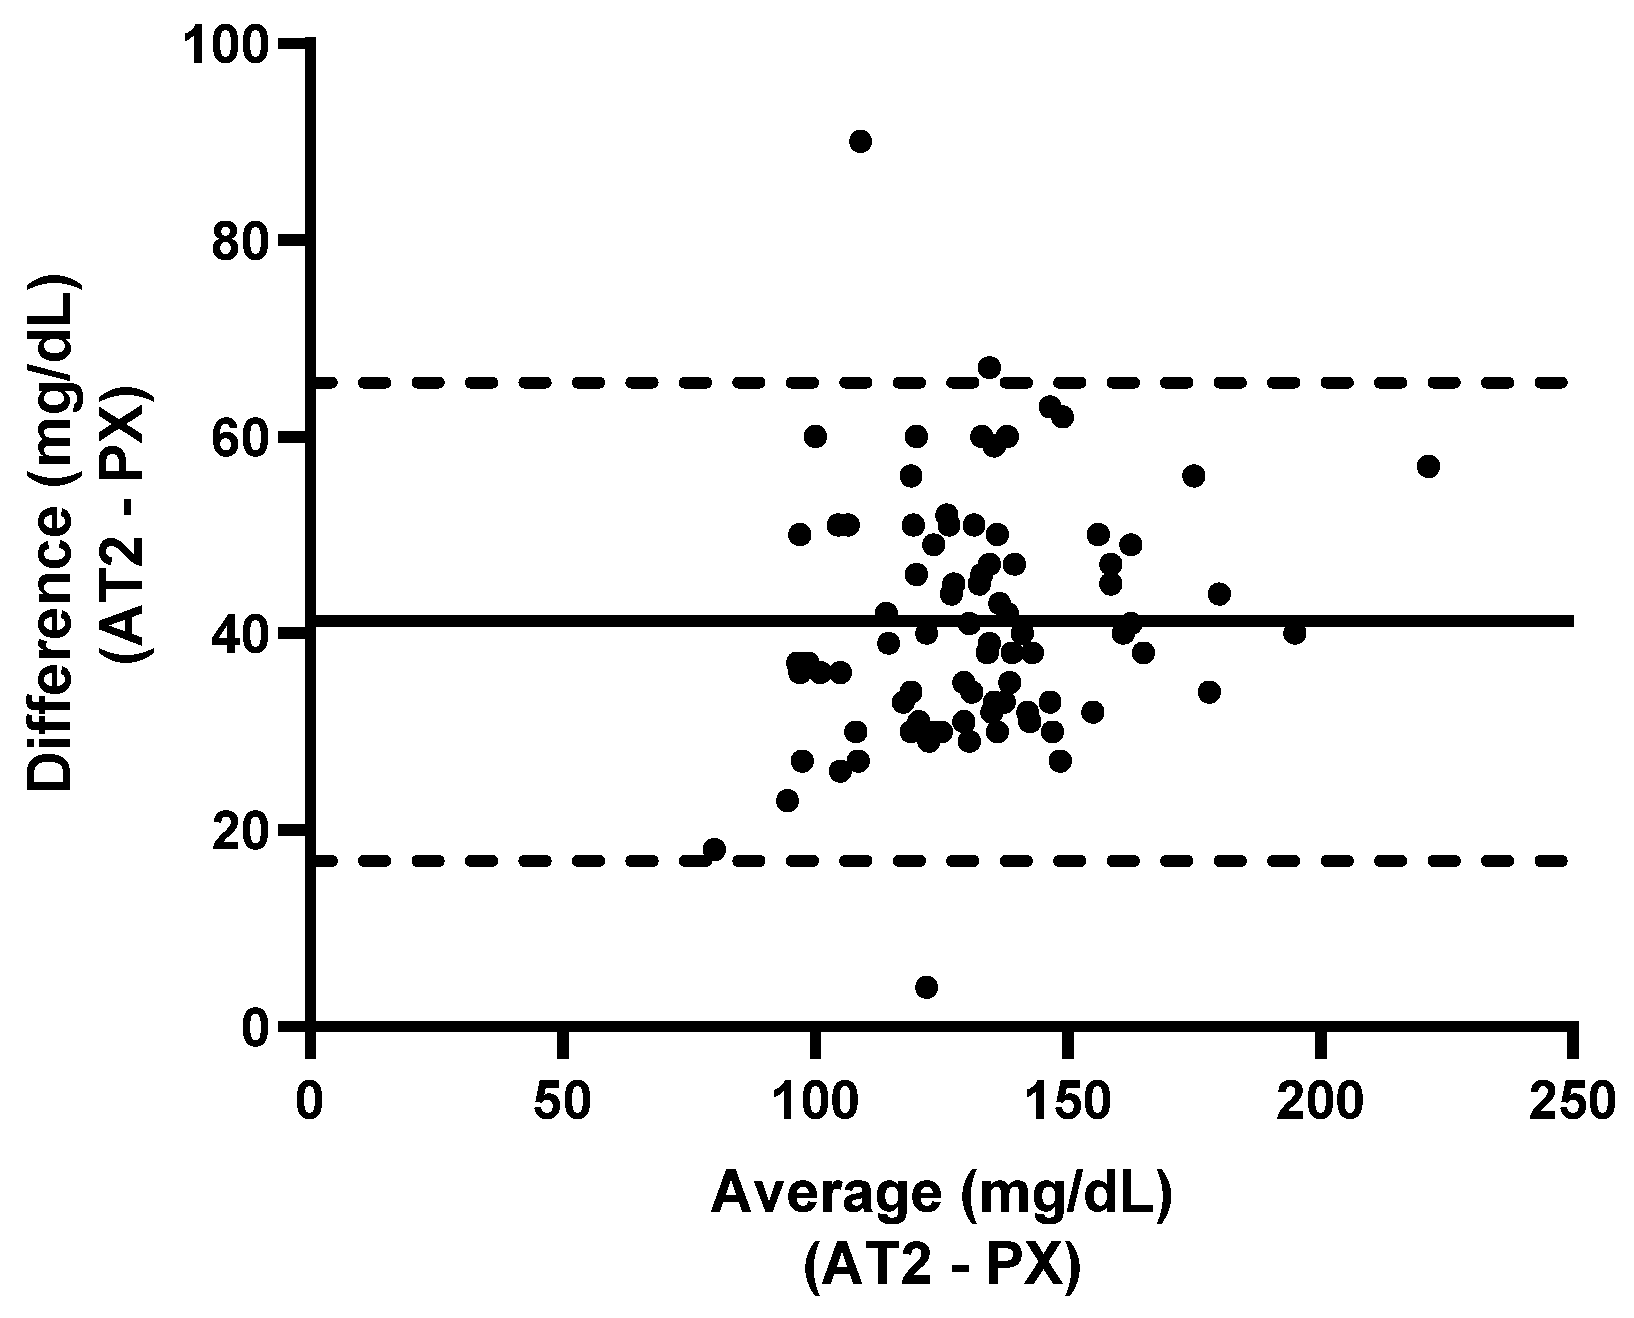
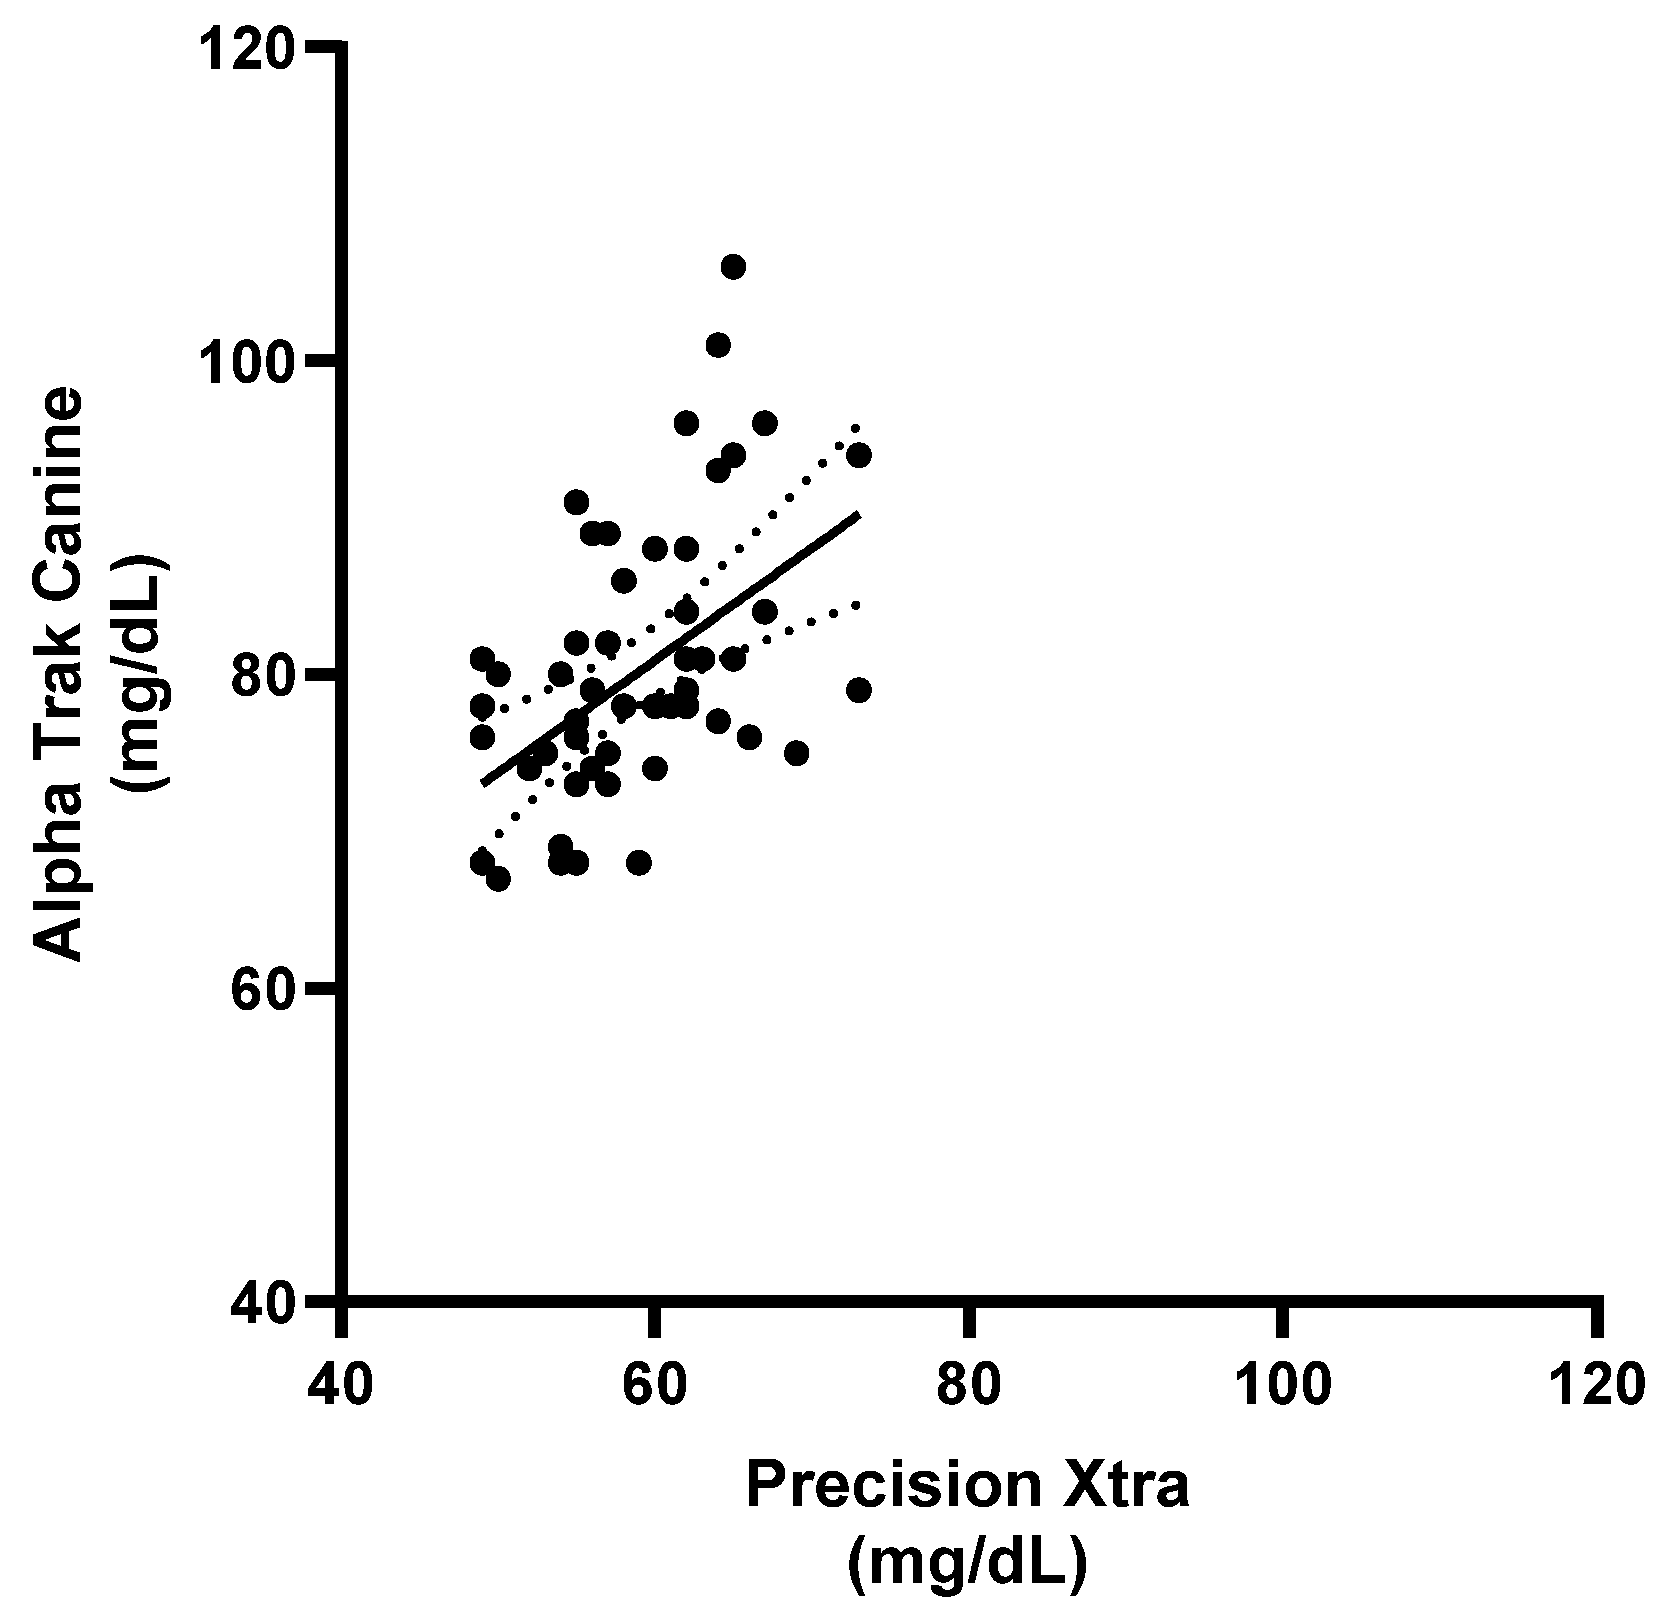
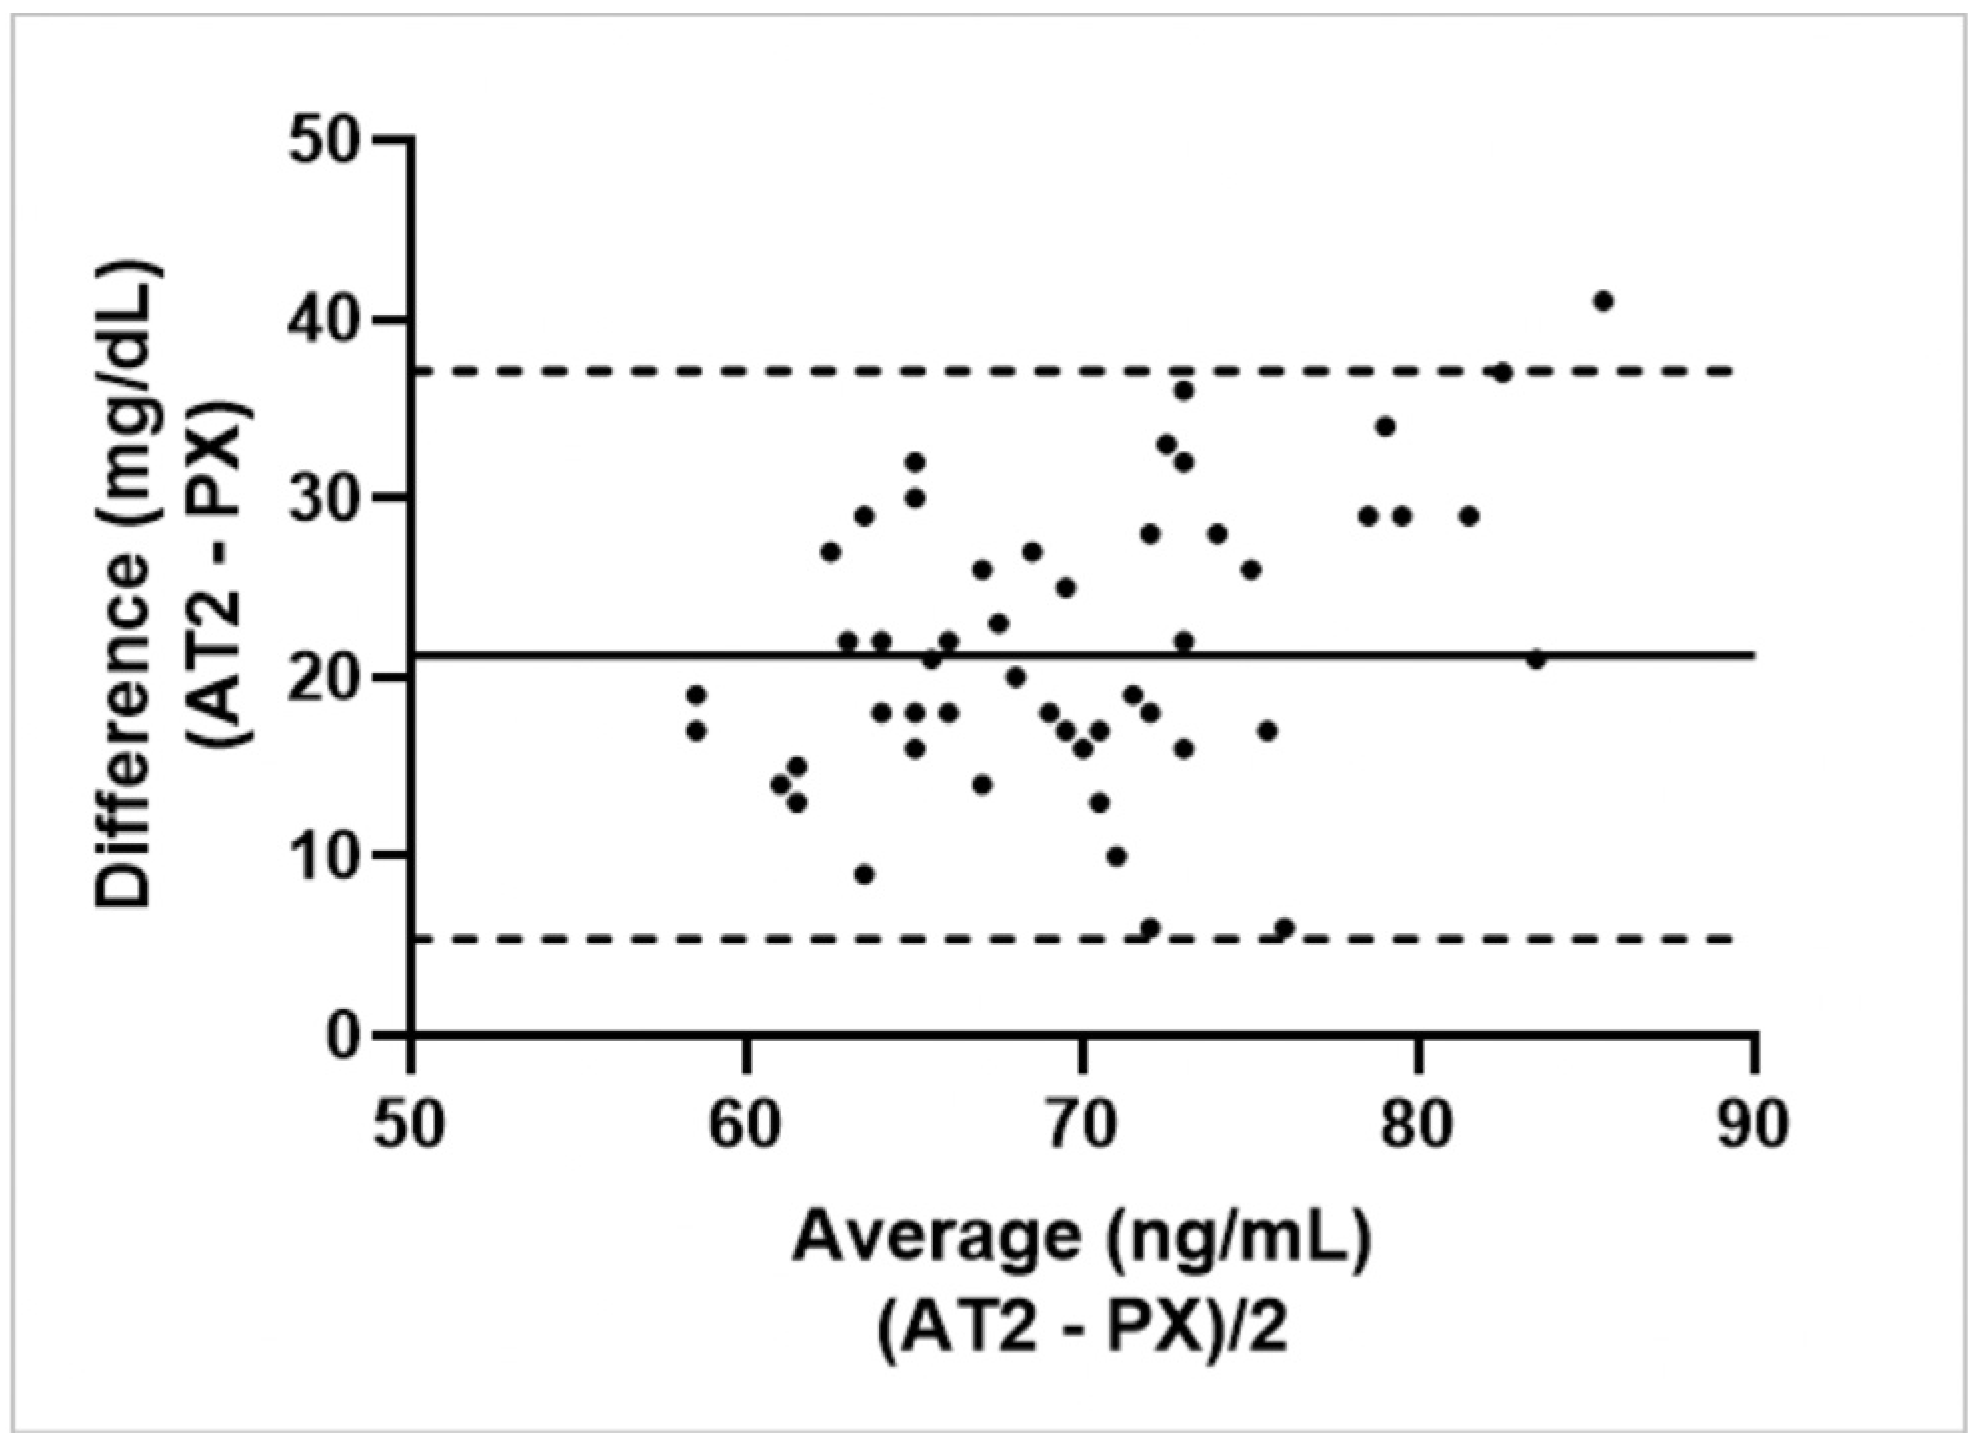
3.2. PX vs. AT2 Canine Setting

3.2.1. Calf Study Group

Eighty-five samples were collected from calves, and all had a measurable blood glucose concentration from simultaneous measurement by both devices. Blood glucose concentrations ranged from 64 to 175 (mean ± standard deviation: 111.2 ± 22.1) and 89 to 215 (mean ± standard deviation: 152.2 ± 23.6) mg/dL for the PX and AT2 (canine setting) devices, respectively. Simple linear regression of these 85 samples had a Pearson r of 0.8496. Figure 2A displays the simple linear regression plot for these samples.
Deming regression of these 85 samples revealed an equation represented as AT2 (mg/dL) = 1.077PX + 32.49, the 95% confidence interval of the slope being 0.9295 to 1.224, and the 95% confidence interval of the Y intercept being 14.73 to 50.25. Figure 2B demonstrates the Bland–Altman plot for these 85 samples.
Mean bias for these samples was 41.11, indicating a constant bias, with 95% limits of agreement of 25.3 to 60.1.

3.2.2. Ewe Study Group

Fifty-four samples were collected from ewes and all had a measurable blood glucose concentration from simultaneous measurement by both devices. Blood glucose concentrations ranged from 67 to 106 (mean ± standard deviation: 80.65 ± 8.96) mg/dL and 49 to 73 (mean ± standard deviation: 58.81 ± 5.89) mg/dL for AT2 canine setting and PX, respectively. Simple linear regression of these 54 samples had a Pearson r of 0.4710. Figure 2C displays the simple linear regression plot for these samples.
Deming regression of these 54 samples revealed an equation represented as AT2 (mg/dL) = 1.837X − 34.18, the 95% confidence interval of the slope being 1.197 to 3.347, and the 95% confidence interval of the Y intercept being −116.2 to −9.090. Figure 2D demonstrates the Bland–Altman plot for these 54 samples.
Mean bias for these samples was 21.24, indicating a constant bias, with 95% limits of agreement of 5.931 to 37.09.

3.3. PX vs. AT2 Feline Setting

3.3.1. Calf Study Group

Eighty-five samples were collected from calves and all had a measurable blood glucose concentration from simultaneous measurement by both devices. Blood glucose concentrations ranged from 66 to 176 (mean ± standard deviation: 106.6 ± 23.1) and 89 to 223 (mean ± standard deviation: 140.7 ± 27.6) mg/dL for the PX and AT2 (feline setting) devices, respectively. Simple linear regression of these 85 samples had a Pearson r of 0.8861. Figure 3A displays the simple linear regression plot for these samples.
Deming regression of these 85 samples revealed an equation represented as AT2 (mg/dL) = 1.22PX + 10.54, the 95% confidence interval of the slope being 1.091 to 1.349, and the 95% confidence interval of the Y intercept being −3.694 to 24.78. Figure 3B demonstrates the Bland–Altman plot for these 85 samples.
Mean bias for these samples was 33.64, indicating a constant bias, with 95% limits of agreement of 17.38 to 49.89. There does appear to be a proportional bias as well, as the higher the concentration, the more increased the difference.

3.3.2. Ewe Study Group

Fifty-four samples were collected from ewes and all had a measurable blood glucose concentration from simultaneous measurement by both devices. Blood glucose concentrations ranged 57–98 (mean ± standard deviation: 72.72 ± 8.48) mg/dL and 48–71 (mean ± standard deviation: 58.18 ± 5.38) mg/dL for AT2 feline setting and PX, respectively. Simple linear regression of these 54 samples had a Pearson r of 0.7269. Figure 3C displays the simple linear regression plot for these samples.
Deming regression of these 54 samples revealed an equation represented as AT2 (mg/dL) = 1.22X + 10.54, the 95% confidence interval of the slope being 1.145 to 2.260, and the 95% confidence interval of the Y intercept being −58.85 to −9.515. Figure 3D demonstrates the Bland–Altman plot for these 54 samples.
Bias for these samples was 14.54 ± 5.878, indicating a constant bias, with 95% limits of agreement of 17.38 to 49.89. There does appear to be a proportional bias as well, as the higher the concentration, the more increased the difference.

4. Discussion

This study compared blood glucose concentrations from healthy calves and healthy ewes as determined by two different analyzers, a human POC previously validated in calves as well as pre- and postpartum sheep (PX) [4,5] and a veterinary POC validated for canine and feline patients (AT2). For the calves, the previous validation of the PX device yielded results in which 96% of measured blood glucose concentrations fell within the 95% confidence limits of the standard laboratory analyzer [3]. As such, the PX device may serve as a standard against which to compare other analyzers for blood glucose testing in cattle and sheep. The results of our study indicate that the concentrations of blood glucose as determined by each POC analyzer were not equal, as the AT2 POC consistently yielded concentrations higher than the PX POC for both study populations. This discrepancy has the potential to lead to overestimation of blood glucose concentrations in calves and sheep when using the AT2 device. For both groups, better agreement between methods was noted when samples were analyzed under the feline setting as opposed to the canine setting; however, blood glucose concentrations analyzed by both settings indicated a constant bias. Because of this bias, clinicians should consider method-specific reference intervals for evaluating blood glucose via POC analyzers in calves and adult sheep.
The bias observed in our study could have clinical implications when evaluating blood glucose concentrations in both calves and sheep. The normal blood glucose range in calves is approximately 80–120 mg/dL [20], although higher concentrations may be expected shortly after feeding. The bias observed for the AT2 device was 41.11 (canine setting) and 33.64 (feline setting) mg/dL. The normal blood glucose range in sheep is approximately 42–80 mg/dL. The bias observed for the AT2 device was 21.24 ± 8.087 (canine setting) and 14.54 ± 5.878 (feline setting) mg/dL. Both of these are significant enough that it could easily lead to false diagnosis of normoglycemia or hyperglycemia, even in the face of clinically significant hypoglycemia. As such, clinicians should be mindful of the difference between blood glucose readings from an AT2 device when compared to a validated device such as a PX. For clinical decision-making, it may be more appropriate to use AT2 results sequentially to evaluate trends rather than making decisions based on individual readings. When considering the repeatability of each analyzer, our study revealed low CV values for all devices and settings in both study populations.
The AT2 device has previously demonstrated similar results in goats when compared to the calves in our study, with the overestimation of blood glucose concentrations when compared to a validated assay [7]. That study found that for caprine blood, while the feline setting resulted in higher blood glucose concentrations than the canine setting, the differences were not significant [7]. This difference could be due to the amount of blood glucose stored within the erythrocyte of dogs and cats, at 12.5% and 7%, respectively, when compared to ruminant species such as cattle and sheep which have intracellular concentrations of 20% and 18% within the erythrocytes [21]. At this time, it is unknown whether the erythrocyte intracellular glucose concentration is similar between neonatal calves and adult cattle. Future studies performed on a wider range of blood glucose concentrations and animal ages could develop a model to correct for the species-specific differences in intracellular erythrocyte glucose concentration, as well as packed cell volume, as has been previously done in dogs [22].
POC glucometers function by indirect enzymatic detection to detect glucose oxidase, hexokinase, glucose-1-dehydrogenase, or a combination [23]. When using POC glucometers in species for which they are not validated, clinicians should consider the need for instrument-specific reference ranges, instead of relying on species-specific reference ranges. If validated reference ranges for each device exist, then disagreement between devices could be of less clinical concern. It is possible that the algorithms used for each device could be utilized to develop a formula for correction, as has been done for dairy cows. Clinicians should also consider that while the data from this study support a linear difference, data from lower concentrations are lacking, and the lower end of the curve may not necessarily have the same relationship as the values from the calves and ewes in our study. This could have clinical consequences when making treatment decisions for hypoglycemic calves or hypoglycemic sheep with an unvalidated device.
Practitioners should also take into consideration the effect regarding the delay between blood sample collection and the time it takes to run that sample with a POC glucometer. The literature on human treatment gives evidence that prolonged time between blood collection and glucose measurement can reduce the overall clinical accuracy of the value [24]. This can be translated over to veterinary medicine. It is important to measure the samples as quickly as possible so as not to negatively affect a POC glucometer’s bias, regardless of whether it has been validated or not for a specific species. Further research needs to be done to understand the time delay’s effect in bovine and ovine patients. Other literature on human medical treatment brings up the term “time constant” pertaining to POC glucometers and times when blood glucose measurement is essential for the critically ill patient. The time constant can be prolonged due to many physiological factors within a patient, leading to further biases and inaccuracies when measuring peripheral blood glucose with POC glucometers compared to central or benchtop laboratory machines [25]. This is useful knowledge for practitioners to know in animal patients, but further studies need to be completed to assess the time constant’s effect on bovine and ovine blood glucose measurements via POC glucometers.
Limitations of this study include the sample population being healthy pre-ruminant bull calves and four healthy ewes. Future studies should evaluate the agreement between samples from calves and adult sheep with low and high blood glucose concentrations. Increased sample temperature has been shown to increase PX blood glucose concentrations [26]. This was unlikely to have affected the results of our study due to the immediate and simultaneous measurement of blood glucose. While sample size may be a limitation of our study, other studies have evaluated the AT2 with sample sizes of 56 total samples [7]. Additional future directions for this work include the evaluation of POC glucometers in adult cattle, adult rams, and neonatal lambs. Typically, as cattle and sheep mature and begin ruminating, the normal baseline blood glucose levels decrease. This age-related change may affect how results from a POC glucometer are interpreted when compared to validated devices. An additional future direction would be to develop an algorithm for correction of the AT2 results, although that was out of the scope of this project, with our calves not displaying clinically significant hyper- or hypoglycemia. More agreement has been noted in testing serum or plasma instead of whole blood in dogs and cats [27], and as such, future investigations could evaluate agreement between analyzers for bovine serum or plasma. The use of anticoagulated heparinized blood for this study could be considered a limitation; however, the AT2 device is validated for such samples in dogs and cats.

5. Conclusions

In conclusion, clinicians should be aware of the AT2’s tendency to report blood glucose concentrations higher than the PX. The feline setting appears to have less constant bias than the canine setting, although the feline setting showed more variance in our microvalidation. Future studies will be necessary to develop an algorithm for the use of the AT2 in all life stages of both cattle and sheep. Additionally, the data from this study appear to indicate decreased reliability the further the value is from the normal ranges. Clinical decision-making with unvalidated POC glucometers should interpret results with bias in mind, and consider interpretations based on analysis of trends rather than individual readings.

Author Contributions

R.F., H.C., L.E., P.-Y.M., J.D.O., J.P.M., A.J.K. and J.S. conceptualized the investigation. R.F., H.C., L.E., P.-Y.M., J.G. (Jessica Garcia), K.B., J.G. (Jessica Gerbert), L.H., O.E., C.C., W.S.-G., R.R.R., J.D.O. and J.S. conducted sample collection. R.F., L.E., P.-Y.M., J.P.M., L.Y. and J.S. conducted the statistical analysis. All authors contributed to manuscript construction. All authors have read and agreed to the published version of the manuscript.

Funding

This research received no external funding and was internally supported by start-up funds from Large Animal Clinical Sciences.

Institutional Review Board Statement

The study was approved by the Institutional Review Board of the University of Tennessee (#2825-05221).

Informed Consent Statement

Not Applicable.

Data Availability Statement

Data from this manuscript is available upon request.

Acknowledgments

The authors wish to acknowledge the staff of the Veterinary Research and Education Center, University of Tennessee.

Conflicts of Interest

The authors declare no conflicts of interest.

References

  1. Digman, C.; Borto, D.; Nasraway, S.A., Jr. Hyperglycemia in the critically ill. Nutr. Clin. Care 2005, 8, 93–101. [Google Scholar] [PubMed]
  2. Radcliffe, R.M.; Buchanan, B.R.; Cook, V.L.; Divers, T.J. The clinical value of whole blood point-of-care biomarkers in large animal emergency and critical care medicine. J. Vet. Emerg. Crit. Care 2015, 25, 138–151. [Google Scholar] [CrossRef] [PubMed]
  3. Wittrock, J.; Duffield, T.; LeBlanc, S. Validation of a point-of-care glucometer for use in dairy cows. J. Dairy Sci. 2013, 96, 4514–4518. [Google Scholar] [CrossRef] [PubMed]
  4. Iwersen, M.; Falkenberg, U.; Voigtsberger, R.; Forderung, D.; Heuwieser, W. Evaluation of an electronic cowside test to detect subclinical ketosis in dairy cows. J. Dairy Sci. 2009, 92, 2618–2624. [Google Scholar] [CrossRef] [PubMed]
  5. Burke, C.; Rapheal, W.; Leslie, K.; Neuder, L. Test Comparison of Precision Xtra® and Ketostix® for Ketosis in Dairy Cows. In Proceedings of the American Association of Bovine Practitioners Proceedings of the Annual Conference, Charlotte, NC, USA, 25–27 September 2008; p. 187. [Google Scholar]
  6. Hornig, K.J.; Byers, S.R.; Callan, R.J.; Holt, T.; Field, M.; Han, H. Evaluation of a point-of-care glucose and β-hydroxybutyrate meter operated in various environmental conditions in prepartum and postpartum sheep. Am. J. Vet. Res. 2013, 74, 1059–1065. [Google Scholar] [CrossRef] [PubMed]
  7. Quandt, J.E.; Barletta, M.; Cornell, K.K.; Giguère, S.; Hofmeister, E.H. Evaluation of a point-of-care blood glucose monitor in healthy goats. J. Vet. Emerg. Crit. Care 2018, 28, 45–53. [Google Scholar] [CrossRef] [PubMed]
  8. Cook, V.L.; Hassel, D.M. Evaluation of the colic in horses: Decision for referral. Vet. Clin. Equine Pract. 2014, 30, 383–398. [Google Scholar] [CrossRef] [PubMed]
  9. Ober, R.A.; Geist, G.E. Assessment of a Noninvasive Chronic Glucose Monitoring System in Euglycemic and Diabetic Swine (Sus scrofa). J. Am. Assoc. Lab. Anim. Sci. 2020, 59, 430–437. [Google Scholar] [CrossRef]
  10. Selleri, P.; Di Girolamo, N.; Novari, G. Performance of two portable meters and a benchtop analyzer for blood glucose concentration measurement in rabbits. J. Am. Vet. Med. Assoc. 2014, 245, 87–98. [Google Scholar] [CrossRef]
  11. Harrison, L.M.; Gaines, D.W.; Babu, U.S.; Balan, K.V.; Reimschuessel, R.; Do, A.B.; Pereira, M.R.; Bigley, E.C., III; Ferguson, M.; Mehta, A. Diet-induced obesity precipitates kidney dysfunction and alters inflammatory mediators in mice treated with Shiga toxin 2. Microb. Pathog. 2018, 123, 250–258. [Google Scholar] [CrossRef]
  12. McCabe, K.A.; Rendle, M.; Harsch, S.; Lumbis, R. Prognostic Indicators of Avian Survival. J. Avian Med. Surg. 2020, 34, 243–249. [Google Scholar] [CrossRef] [PubMed]
  13. Olivarez, J.D.; Mulon, P.-Y.; Ebner, L.S.; Cremerius, H.; Cantrell, C.; Rahn, R.; Soto-Gonzalez, W.; Bergman, J.; Cox, S.; Mochel, J.P.; et al. Pharmacokinetic and pharmacodynamic properties of pantoprazole in calves. Front. Vet. Sci. 2023, 9, 1101461. [Google Scholar] [CrossRef] [PubMed]
  14. Barr, C.A.; Gianotti, G.; Graffeo, C.E.; Drobatz, K.J.; Silverstein, D.C. Effect of blood collection by the push-pull technique from an indwelling catheter versus direct venipuncture on venous blood gas values before and after administration of alfaxalone or propofol in dogs. J. Am. Vet. Med. Assoc. 2017, 251, 1166–1174. [Google Scholar] [CrossRef] [PubMed]
  15. Zou, G.Y. Confidence interval estimation for the Bland-Altman limits of agreement with multiple observations per individual. Stat. Methods Med. Res. 2013, 22, 630–642. [Google Scholar] [CrossRef]
  16. Jensen, A.L.; Kjelgaard-Hansen, M. Method comparison in the clinical laboratory. Vet. Clin. Pathol. 2006, 35, 276–286. [Google Scholar] [CrossRef] [PubMed]
  17. Flatland, B.; Friedrichs, K.R.; Klenner, S. Differentiating between analytical and diagnostic performance evaluation with a focus on the method comparison study and identification of bias. Vet. Clin. Pathol. 2014, 43, 475–486. [Google Scholar] [CrossRef] [PubMed]
  18. Smith, J.S.; Bennett, K.; Flynn, R.; Gebert, J.; Mulon, P.-Y.; Garcia, J.D.; Harvill, L.; Escher, O.; Ebner, L.S.; Bergman, J.; et al. Pharmacokinetics and pharmacodynamics of intravenously and subcutaneously administered pantoprazole in sheep (Ovis aries). PLoS ONE 2024, 19, e0304533. [Google Scholar] [CrossRef] [PubMed]
  19. Smith, J.S.; Coetzee, J.F.; Fisher, I.W.G.; Borts, D.J.; Mochel, J.P. Pharmacokinetics of fentanyl citrate and norfentanyl in Holstein calves and effect of analytical performances on fentanyl parameter estimation. J. Vet. Pharmacol. Ther. 2018, 41, 555–561. [Google Scholar] [CrossRef] [PubMed]
  20. Trefz, F.M.; Feist, M.; Lorenz, I. Hypoglycaemia in hospitalised neonatal calves: Prevalence, associated conditions and impact on prognosis. Vet. J. 2016, 217, 103–108. [Google Scholar] [CrossRef]
  21. Coldman, M.; Good, W. The distribu-tion of sodium, potassium and glucose in the blood of some mammals. Comp. Biochem. Physiol. 1967, 21, 201–206. [Google Scholar] [CrossRef]
  22. Lane, S.L.; Koenig, A.; Brainard, B.M. Formulation and validation of a predictive model to correct blood glucose concentrations obtained with a veterinary point-of-care glucometer in hemodiluted and hemoconcentrated canine blood samples. J. Am. Vet. Med. Assoc. 2015, 246, 307–312. [Google Scholar] [CrossRef] [PubMed]
  23. Rajendran, R.; Rayman, G. Point-of-care blood glucose testing for diabetes care in hospitalized patients: An evidence-based review. J. Diabetes Sci. Technol. 2014, 8, 1081–1090. [Google Scholar] [CrossRef] [PubMed]
  24. Jangam, S.R.; Hayter, G.; Dunn, T.C. Impact of glucose measurement processing delays on clinical accuracy and relevance. J. Diabetes Sci. Technol. 2013, 7, 660–668. [Google Scholar] [CrossRef] [PubMed]
  25. Rebel, A.; Rice, M.A.; Fahy, B.G. Accuracy of point-of-care glucose measurements. J. Diabetes Sci. Technol. 2012, 6, 396–411. [Google Scholar] [CrossRef] [PubMed]
  26. Megahed, A.; Hiew, M.; Constable, P. The effects of sample temperature on the concentrations of glucose and β-OH butyrate measured by the Precision Xtra meter in plasma from periparturient dairy cattle. In Proceedings of the American Association of Bovine Practitioners Proceedings of the Annual Conference, New Orleans, LA, USA, 17–19 September 2015; p. 214. [Google Scholar]
  27. Tauk, B.S.; Drobatz, K.J.; Wallace, K.A.; Hess, R.S. Correlation between glucose concentrations in serum, plasma, and whole blood measured by a point-of-care glucometer and serum glucose concentration measured by an automated biochemical analyzer for canine and feline blood samples. J. Am. Vet. Med. Assoc. 2015, 246, 1327–1333. [Google Scholar] [CrossRef]
Figure 1. Collection and analysis stream for the blood samples from this study. PX: Precision Xtra glucometer; AT2: AlphaTrak 2 glucometer.
Ruminants 04 00022 g001
Figure 2. A. Simple linear regression analysis for the calf samples analyzed under the “canine” setting.
Ruminants 04 00022 g002
Figure 2. B. Bland-Altman analysis for the calf samples analyzed under the “canine” setting. The solid line represented the mean difference line, and the dashed lines represent the 95% confidence intervals.
Ruminants 04 00022 g003
Figure 2. C. Simple linear regression analysis for the ewe samples analyzed under the “canine” setting.
Ruminants 04 00022 g004
Figure 2. D. Bland-Altman analysis for the sheep samples analyzed under the “canine” setting. The solid line represented the mean difference line, and the dashed lines represent the 95% confidence intervals.
Ruminants 04 00022 g005
Figure 3. A. Simple linear regression analysis for the calf samples analyzed under the “feline” setting.
Ruminants 04 00022 g006
Figure 3. B. Bland–Altman analysis for the calf samples analyzed under the “feline” setting. The solid line represented the mean difference line, and the dashed lines represent the 95% confidence intervals.
Ruminants 04 00022 g007
Figure 3. C. Simple linear regression analysis for the ewe samples analyzed under the “feline” setting.
Ruminants 04 00022 g008
Figure 3. D. Bland–Altman analysis for the sheep samples analyzed under the “feline” setting. The solid line represented the mean difference line, and the dashed lines represent the 95% confidence intervals.
Ruminants 04 00022 g009
Disclaimer/Publisher’s Note: The statements, opinions and data contained in all publications are solely those of the individual author(s) and contributor(s) and not of MDPI and/or the editor(s). MDPI and/or the editor(s) disclaim responsibility for any injury to people or property resulting from any ideas, methods, instructions or products referred to in the content.

