Abstract
Recommendations for endurance exercise prescription are often based on percentages of heart rate (HR) or the volume of oxygen consumption (O2) maximum or reserve that is extrapolated to a power output (P) or velocity. Previous work has demonstrated dissociations of the expected responses to exercise anchored to the critical heart rate (CHR) compared with the P associated with CHR. However, it is unclear if similar dissociations due to reductions in P to maintain the designated intensity would be present during exercise anchored to the O2 associated with CHR (O2CHR). The purpose of this study was to examine the patterns in physiological (O2, HR, P, respiration rate [RR], muscle oxygen saturation [%SmO2]), neuromuscular (electromyographic and mechanomyographic amplitude [EMG AMP, MMG AMP], mean power frequency [EMG MPF, MMG MPF]), and perceptual (rating of perceived exertion [RPE]) responses during exercise at O2CHR (O2-clamp). On separate days, ten participants (age: 25 ± 4 yr) performed a graded exercise test and four constant P trials at 85–100% of peak P (PP) to derive CHR and O2CHR. Responses were recorded during a trial to exhaustion at O2CHR (32.86 ± 7.12 mL·kg−1·min−1; TLim = 31.31 ± 21.37 min) and normalized in 10% intervals of TLim to their respective values at PP. The one-way repeated-measures ANOVA with post hoc, Bonferroni-corrected, pairwise comparisons indicated differences (p < 0.001) from baseline for HR (mean ± SD %change = 8 ± 3%), RR (43 ± 38%), P (−15 ± 5%), EMG MPF (10 ± 8%), and RPE (65 ± 38%), but no differences (p = 0.077–0.955) for %SmO2 (−17 ± 53%), EMG AMP (−3 ± 16%), MMG AMP (40 ± 61%), and MMG MPF (1 ± 7%). The loss in performance observed during O2-Clamp exercise may provide a quantification of the inefficiency associated with the O2 slow component phenomenon. The neuromuscular responses suggested constant muscle excitation despite the reductions in P, but the metabolic and perceptual responses suggested a combination of feedforward and feedback mechanisms regulating TLim. Future studies should further examine responses to the O2-Clamp exercise at a uniform threshold.
1. Introduction
The current recommendations for exercise prescription to improve cardiorespiratory endurance often rely on percentages of oxygen uptake (O2) and heart rate (HR) maximum or reserve (O2R and HRR) that are low enough to be maintained for 20 to 60 min but high enough to elicit the desired metabolic and cardiorespiratory responses [1]. The threshold (%O2 or HRmax) for improving cardiorespiratory fitness is dependent upon an individual’s training status, where intensities of 65–80% O2max in moderately trained individuals and 95–100% O2max in highly trained individuals may be required to elicit adaptations [2]. However, the current understanding of physiological and perceptual responses to continuous, dynamic exercise is centered primarily on measures taken when exercise intensity is anchored by power output and not O2 or HR [3]. During exercise maintained at a constant power output above the ventilatory threshold (VT), there are predictable, intensity-dependent increases in HR, O2, respiration rate (RR), muscle excitation, measured via electromyographic amplitude (EMG AMP), and ratings of perceived exertion (RPE) [3,4,5,6,7,8,9,10,11,12]. Additionally, fatiguing, constant power exercise is characterized by decreases in action potential conduction velocity along the sarcolemma, measured via EMG mean power frequency (EMG MPF), as a result of the accumulation of metabolic byproducts [9,10,11,12]. The motor unit excitation strategies are further characterized by changes in motor unit recruitment, measured via mechanomyographic amplitude (MMG AMP), and the global motor unit firing rate, measured via mechanomyographic mean power frequency (MMG MPF) [9,10,12]. The specific MMG AMP and MMG MPF responses have been shown to vary depending on the power output [9,10,12], but in conjunction with EMG measures, these further delineate the EMG AMP (muscle excitation) into factors related to the recruitment and firing rate of motor units due to muscular fatigue [9,10,11,12]. Thus, exercise anchored by power output is described by specific responses that reflect increases in the metabolic and cardiovascular intensity throughout the work bout and, at higher power outputs (>VT), may result in evidence of neuromuscular fatigue. Depending on the power output at which the exercise is performed, it is possible for O2 and HR to increase during the exercise bout to values that are greater than the prescribed ranges for the training session.
Previously, researchers have explored the physiological and perceptual responses when exercise was anchored to a perceptual (RPE-Clamp) or physiological parameter (O2-Clamp, HR-Clamp), that is, an exercise where the perceptual (RPE) or physiological (O2 or HR) parameter is held constant by altering the external load (i.e., speed or power output) [13,14,15,16,17]. Under these conditions, the physiological responses no longer followed the predictable patterns described for constant power output exercise. For example, during the HR-Clamp exercise, RPE and RR increased, but power output, O2, and minute ventilation (E) decreased [15,16,17]. Similarly, during the RPE-Clamp exercise, O2, respiratory exchange ratio (RER), and power output decreased [13]. In addition, muscle excitation during exercise anchored by a perceptual or physiological parameter did not follow the expected pattern of fatigue during constant power output exercise but instead tracked the decreases in power output [13,15,16,17]. Thus, the current evidence indicates there are divergent patterns of responses for physiological and perceptual parameters when exercise is anchored to a physiological (HR) or perceptual (RPE) parameter compared with exercise anchored to a power output.
The application of HR to the critical power (CP) model to derive the critical heart rate (CHR) [18] has been suggested to provide an individualized, physiologically based threshold that meets the intensity (83–94% HR of VO2peak) and duration (>24 min) recommendations for cardiorespiratory endurance training [16,17,19]. The CHR is derived from the linear regression of the total heartbeats (HBLim) versus TLim from multiple exhaustive work bouts at various power outputs. Previous work [16,17,19] has shown that the decreases in work rate required to maintain HR at CHR results in more sustainable intensities (i.e., longer times to exhaustion (TLim)) than those anchored by power output yet elicit a metabolic stimulus within the recommended range [16,17,18]. Specifically, exercise at or just below (minus 5 b·min−1) CHR was sustained from ~12 to 60 min with metabolic responses maintained (64–88% O2peak) within the desired ranges for improving cardiorespiratory fitness [17,19]. Succi et al. [19] directly compared exercise at CHR to exercise at the power output associated with CHR and demonstrated that CHR was more sustainable (longer TLim) than constant power output exercise. These differences in sustainability may potentially result in disparate physiological stimuli depending on the anchoring scheme. Specifically, during exercise anchored to both a constant HR and a constant power output, subjects demonstrated O2, HR, and RPE values that were within the American College of Sports Medicine (ACSM) exercise prescription guidelines [1,19]. However, during constant power output exercise, participants demonstrated progressive increases in O2, HR, and RPE that reached near maximal values, leading to the premature termination of exercise prior to or shortly after achieving the recommended duration of the exercise of at least 20 min [19]. Conversely, during the HR-Clamp exercise, participants were able to sustain exercise for longer, thus incurring a potentially greater time stimulus. In addition, it was demonstrated that exercise at CHR resulted in lower O2, RPE, muscle excitation, and higher muscle oxygen saturation (%SmO2) responses compared with constant power output exercise [19]. Therefore, the changes in power output to maintain the designated HR at CHR result in the differing sustainability, metabolic, neuromuscular, and perceptual responses versus exercise anchored to the power output associated with CHR [19]. Notably, these alterations in power output resulted in a mirror image of the O2 slow component phenomenon is typically seen during constant power exercise [19,20]. That is, during sufficiently intense constant power output exercise (>VT), there is a progressive increase (>200 mL·min−1) in O2 greater than what would be expected due to the recruitment of less efficient, higher threshold motor units [20,21]. However, the change of power output during HR-Clamp exercise has been suggested to reflect the performance loss (i.e., power output or velocity decrease) as a result of this muscular inefficiency [20]. Thus, examining the responses to O2-Clamp exercise at the O2 associated with the CHR may provide additional insights into the dissociations of responses between exercise at a constant physiological parameter and constant power output exercise.
The moderate, heavy, and severe intensity domains are well-defined by specific physiological and perceptual responses [3,4,5,6,7,8,9,10,11,12] for constant power output exercise. Typically, within the moderate intensity domain (<VT), there are increases in O2, HR, and RPE, which plateau, and exercise is able to be tolerated for an extended period of time (>60 min) [3]. Within the heavy intensity domain (>VT, <CP), there are increases in blood lactate and further increases in O2, HR, and RPE with the presence of the O2 slow component phenomenon due to the recruitment of less efficient, higher threshold motor units [3,20]. As a result of this inefficiency, these values take longer to reach a plateau [3,20]. Finally, within the severe intensity domain, the O2 slow component phenomenon is further exacerbated, resulting in further increases in O2, HR, blood lactate, and RPE, which may [3] or may not [22] reach their respective maximums as exhaustion is reached. Conversely, the typical responses within these intensity domains are less clear when exercise is anchored by the physiological parameters (HR and O2) used to derive the current intensity recommendations for improving CE. Furthermore, the specific physiological and perceptual responses to O2-Clamp exercises are not well-defined. Previous work from Ribeiro [14] demonstrated that there were general decreases in power output over time to maintain a constant O2, with a plateau in HR after an initial increase [14]. However, the authors did not examine the specific time course of responses, nor any neuromuscular or perceptual responses. In addition, it is unclear how the physiological, neuromuscular, and perceptual responses to O2-Clamp exercise compares to that of previous work examining the responses to exercise anchored to another physiological parameter such as HR [19]. Thus, the examination of O2-Clamp exercise, specifically the O2 associated with the CHR (O2CHR) is warranted to further elucidate the typical patterns of responses for exercise at constant physiological parameters and potential mechanisms underpinning the divergent responses between exercise anchored to a physiological parameter versus constant power output. Therefore, the purpose of this study was to examine the time course of changes in cardiovascular, metabolic, neuromuscular, and perceptual responses during O2-Clamp exercise at O2CHR. It was hypothesized that, based on previous work examining responses to exercise anchored to a constant physiological parameter [17,19], O2-Clamp trials would result in an increase of HR, RR, and RPE, decreases in power output, EMG AMP, and MMG MPF, and no change in EMG MPF or MMG AMP.
2. Methods
Ten physically active subjects (men: n = 6; women: n = 4; mean ± SD age: 25.10 ± 3.73 years; height: 173.09 ± 11.90 cm; body mass: 74.66 ± 8.51 kg) completed this study. Physically active was defined as completing 30 min of physical activity per day for 5 days per week on most weeks for the past 6 months [1]. Physical activity included walking (n = 4), running (n = 7), cycling (n = 2), swimming (n = 3), high-intensity interval training (n = 3), resistance training (n = 7), and yoga (n = 2). The subjects were screened for cardiovascular, pulmonary, metabolic, muscular, and/or coronary heart disease via a health history questionnaire. The subjects were instructed to abstain from caffeine consumption 4 h prior to testing and refrain from exercise 24 h prior to testing. This study was approved by the university’s Institutional Review Board for Human Subjects (IRB# 51399), meeting the ethical standards of the Declaration of Helsinki, and all subjects provided a written informed consent document prior to testing.
2.1. Experimental Design
This study was based on previous work examining CHR [19]. This study was a repeated measures design that included six visits, with each visit separated by at least 24 h. On visit one, the subjects completed a graded exercise test (GXT) to exhaustion on a cycle ergometer to determine peak oxygen consumption (O2peak), HR (HRmax), respiration rate (RRmax), peak power output (PPO), and the power at O2max (pO2max). During visits two through five, HR and O2 were measured during four randomly ordered, continuous rides to exhaustion at 85%, 90%, 95%, and 100% of pO2peak. The total work versus time to exhaustion (TLim) mathematical model used to determine the critical power (CP) was applied to derive the critical heart rate (CHR), explained in greater detail below [18]. Linear regression of HR versus O2 was used to determine the O2 associated with CHR (O2CHR). Visit six consisted of a trial to exhaustion at O2CHR with O2, HR, RR, RPE, power output, %SmO2, RPE, EMG AMP, MMG AMP, EMG MPF and MMG MPF responses were recorded.
2.2. Electromyographic and Mechanomyographic Measurements
The EMG signals were measured from the vastus lateralis (VL) on the dominant leg, as determined via which leg the subject would kick a ball with, during the GXT and the tests at O2CHR. For all subjects, the dominant leg was the right leg. Prior to electrode placement, the skin was shaved with a disposable razor, abraded with sandpaper, and then cleaned with isopropyl alcohol. A bipolar electrode (circular 24 mm, Kendall disposable EMG electrodes, Covidien Ltd., Gosport Hampshire, UK) arrangement (30 mm interelectrode distance) was placed according to the SENIAM Project for EMG electrode placement recommendations [23]. A reference line was drawn one third the distance between the lateral superior border of the patella and the anterior superior iliac spine. The electrode site was located 5 cm lateral to the reference line to ensure the electrodes were over the VL muscle [24]. Lastly, a goniometer (Smith and Nephew Rolyan, Inc., Menomonee Falls, WI, USA) was used to position the EMG electrode at a 20° angle to the reference line to approximate the pennation angle of the VL muscle fibers [25]. The EMG signal was collected using a wired signal (MP150, Biopac Systems, Inc., Santa Barbara, CA, USA) and amplified (gain: 1000×) using differential amplifiers (EMG 150, Biopac Systems, Inc., Santa Barbara, CA, USA, bandwidth = 10–500 Hz). The MMG signals were recorded using an accelerometer (Model: EGAS-S704-10 Rev C, Measurement Specialties, Les Clayes Sous Bois, France, gain 200×, bandwidth 0–200 Hz, dimensions: 1.0 × 1.0 × 0.5 cm, mass 1.0 g, sensitivity 10 mV·g−1) placed on the VL between the EMG electrodes using double-sided adhesive tape. The signal was analyzed from the sensitive axis of the accelerometer positioned perpendicular to the skin surface. The alternative sensitive axis was positioned along the longitudinal axis of the muscle.
2.3. Signal Processing
The raw EMG and MMG signals were digitized at 2000 Hz and stored in a personal computer for analysis and processed with a custom program written in LabVIEW programming software (version 7.1, National Instruments, Austin, TX, USA). The EMG and MMG signals were zero-phase bandpass-filtered (fourth-order Butterworth) at 10–500 Hz and 5–100 Hz, respectively. The EMG (root-mean-squared, μVrms) and MMG (m·s−2) AMP and EMG and MMG MPF (Hz) values were calculated. For the MPF analysis, each data segment was processed with a Hamming window and a discrete Fourier transform (DFT) algorithm. The MPF was selected to represent the power spectrum based on the recommendations of Diemont et al. [26] and Hermens [23] and was calculated as described by Kwatny and colleagues [27].
2.4. Muscle Oxygenation Measurements
A NIRs (MOXY, Fortiori Design LLC, Hutchinson, MN, USA) device was placed on the VL of the left thigh using SENIAM guidelines, approximately one-third the distance between the lateral superior border of the patella and the anterior superior iliac spine. Prior to placement, the skin was shaved with a disposable razor, abraded with sandpaper, and then cleaned with isopropyl alcohol. The MOXY uses four wavelengths of NIRs light at 680, 720, 760, and 800 nm, and the sensor contains a single LED and two detectors placed 12.5 and 25.0 mm from the source. The %SmO2 was continuously measured during all trials to exhaustion. During each session, the system was connected to a personal computer using the manufacturer’s software program (Peripedal©, Version 1.5.5) to provide a graphic display of the data. Data were acquired at 2 Hz and obtained from the sensor’s internal memory. Data were extracted from the Moxy device using the Moxy PC application.
2.5. Determination of O2peak and Ventilatory Threshold
The subjects performed a GXT to exhaustion on a calibrated cycle ergometer (Lode, Corival, Groningen, The Netherlands) to determine the O2peak, HRpeak, RRpeak, pO2peak, %SmO2peak, EMG AMPpeak, EMG MPFpeak, MMG AMPpeak, and MMG MPFpeak. The subject was fitted with a nose clip, mouthpiece mounted to a headset (2700; Hans Rudolph, Kansas City, MO, USA), and heart rate monitor (Polar Heart Watch system, Polar Electro Inc., Lake Success, New York, NY, USA). The ergometer seat height was adjusted so the subject’s leg was near full extension at the bottom of the pedal revolution. Expired gas samples were collected and analyzed using a calibrated TrueMax 2400 metabolic cart (Parvo Medics, Sandy, UT, USA). Prior to testing, the gas analyzers were calibrated to room air and gases of known concentration, and the NIRs device, EMG electrodes, and MMG accelerometer were placed as previously described. The NIRs, EMG, and MMG signals were recorded throughout the test. The oxygen (O2) and carbon dioxide (CO2) parameters were expressed as 20 s averages [28]. The HR was recorded continuously and expressed as 5 s averages. Each subject was asked to give an RPE during the last 10 s of each min using the Borg 6–20 RPE scale [29]. The test began at 50 W at a pedal cadence of 70 rev·min−1, and the power output was increased by 30 W every two min until the subject could no longer maintain the 70 rev·min−1 cadence. The O2peak, HRpeak, and RRpeak were defined as the highest 20 s average O2, HR, and RR values, respectively, were recorded during the test. Following completion of the test, the subject performed a cool down on the cycle ergometer for a self-determined period of time. The VT was determined using the V-slope method [30], where the VT was defined as the power output associated with O2 corresponding to the point of intersection of two separately derived regression lines of the E versus O2 plot.
2.6. Determination of CP and O2CHR
The CHR was determined from four randomly ordered constant power output rides to exhaustion at 85%, 90%, 95%, and 100% pO2peak. The cycle ergometer was set up for each subject as previously described, and the subject was fitted with a Polar Heart Rate monitor, respiration rate/ECG monitor, EMG electrodes, and MMG accelerometer. The RPE, HR, O2, RR, and %SmO2 were measured as previously described. The rides were performed to exhaustion at 70 rev·min−1, and the power outputs were selected so that the time to exhaustion (TLim) ranged from 3 to 15 min. The HR values were taken every 5 s (HRavg). The total number of heartbeats (HBLim) during each of the rides to exhaustion was calculated as the product of TLim (min) and HRavg (b·min−1) [18]. The HBLim for each trial was plotted against TLim. The slope coefficient of the regression of the HBLim versus TLim relationship was defined as the CHR. Similarly, the CP was defined as the slope coefficient of the regression of the total work done during each constant power trial versus the TLim relationship. The O2CHR was determined using the linear regression equation of the HR versus O2 relationship to find the O2 associated with CHR.
2.7. Continuous Rides to Exhaustion at O2CHR
The O2, HR, RR, RPE, power output, %SmO2, EMG and MMG AMP and MPF, and time to exhaustion (TLim) were examined during continuous rides at O2CHR. Prior to testing, the NIRs device, EMG electrodes, and MMG accelerometer were placed as previously described. The subjects completed a five min warm-up at 50 W on the cycle ergometer. After one min of passive rest, the power was increased to elicit the O2 values at the O2CHR. If the O2CHR was not achieved within 5 min, then the power output was gradually increased to elicit the designated O2. The cadence was maintained at 70 rev·min−1, and the test was terminated when the subject was unable to maintain the designated cadence for 10 s despite strong verbal encouragement or when they completed 60 min of exercise. The O2, HR, RR, and power output were recorded as 20 s averages. The %SmO2 was recorded every 2 s and expressed as 20 s averages. The RPE values were taken every min. The EMG and MMG signals were recorded continuously throughout the rides. The time spent in each exercise intensity domain was calculated as the sum of the time that the power output corresponded to severe (>CP), heavy (<CP, >VT), and moderate (<VT), including the time to reach the designated threshold. However, the time to reach the designated threshold was not included in the total time to exhaustion. To synchronize the data from the various instruments, the NIRs device was turned on 1 min prior to the start of the test to match with the starting timestamp within the metabolic cart and the first pedal revolution shown via the neuromuscular signals.
2.8. Statistical Analyses
The composite responses for each variable (TLim, O2, HR, RR, power output, RPE, EMG AMP, EMG MPF, MMG AMP, and MMG MPF) were recorded during the trial to exhaustion at O2CHR and normalized as a percentage of the maximal value from the GXT. The %SmO2 was expressed as the absolute measure during the trial [31,32]. Because each subject had a different time to exhaustion, time was normalized as a percentage of TLim and 11 data points (0, 10, 20, 30, 40, 50, 60, 70, 80, 90, 100%) were used for all metabolic data and 10 data points (0–10, 10–20, 20–30, 30–40, 40–50, 50–60, 60–70, 70–80, 80–90, 90–100%) were used for the neuromuscular data. The time to achieve O2CHR was omitted from the analyses to account for the neuromuscular and metabolic kinetic response at the beginning of the exercise. Sphericity was assessed using Mauchly’s test of sphericity, and normality was assessed via the Shapiro–Wilk test, visual inspection of histograms, and Q-Q plots. Separate one-way repeated measures ANOVA and post hoc pairwise comparisons with a Bonferroni-corrected alpha level were used to examine the metabolic (O2, HR, RR, power output, %SmO2), perceptual (RPE), and neuromuscular (EMG and MMG AMP and MPF) responses across time relative to the initial value. An alpha level of p ≤ 0.05 was used to determine statistical significance for all ANOVAs. The Bonferroni-corrected alpha for the metabolic and neuromuscular comparisons were set at p ≤ 0.005 and p ≤ 0.0056, respectively. All statistical analyses were performed using the Statistical Package for the Social Sciences software (v.25.0 IBM SPSS Inc., Chicago, IL, USA).
3. Results
The results of the GXT demonstrate a mean ± SD O2max 41.50 ± 8.81 mL·kg−1·min−1, HRmax of 188 ± 11 b·min−1, a RRmax of 52.11 ± 9.76 breaths·min−1, and pO2max of 269 ± 63 W. Furthermore, VT and CP occur at 145.89 ± 31.02 W and 194.15 ± 48.07 W, respectively. The TLim and power outputs for the determination of CHR range from 2.68–11.75 min and 170–380 W, respectively. The mean ± SD CHR is 169.65 ± 14.26 b·min−1 and the O2CHR occur at 32.86 ± 7.12 mL·kg−1·min−1 which represents 79.4 ± 0.08% O2max from the GXT.
During the trial at O2CHR, the subjects achieved the designated O2 within 2.63–7.62 min (4.55 ± 1.65 min) and were able to sustain exercise for 8.66–60 min (31.31 ± 21.37 min). The mean O2 maintained throughout the trial at O2CHR was 32.17 ± 6.81 mL·kg−1·min−1 (77.8% ± 0.08% of O2peak). The range of percent changes (%∆) from the time O2CHR was reached at the end of the trial for HR, RR, power output, RPE, and %SmO2 were 5–14% (8 ± 3%), 8–125% (43 ± 38%), −7–−23% (−15 ± 5%), 33–150% (65 ± 38%), and −24–156% (−17 ± 53%), respectively. The results of the one-way repeated measures ANOVAs and post hoc Bonferroni-corrected pairwise comparisons indicate there were significant differences among the time points for HR, RR, power output, and RPE (F(10, 90) = 4.339–26.14, p < 0.001, pη2 = 0.325–0.744) (Figure 1; Table 1). There was no difference among the time points for %SmO2 (F(10, 90) = 43.026, p = 0.474, pη2 = 0.097). While there was a difference among the time points for O2 (F(10, 90) = 2.836, p = 0.004, pη2 = 0.240), the Bonferroni-corrected pairwise comparisons indicate there is no difference in O2 from start to finish (Figure 1). However, there is a significant difference where 50% TLim is lower than the initial time point. This result is most likely the result of a time lag in O2 response to power output adjustments, which caused an undershoot in the O2 below the designated O2 (Figure 1A).
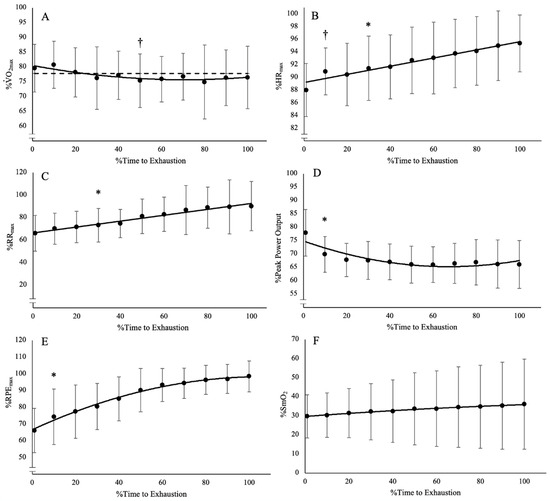
Figure 1.
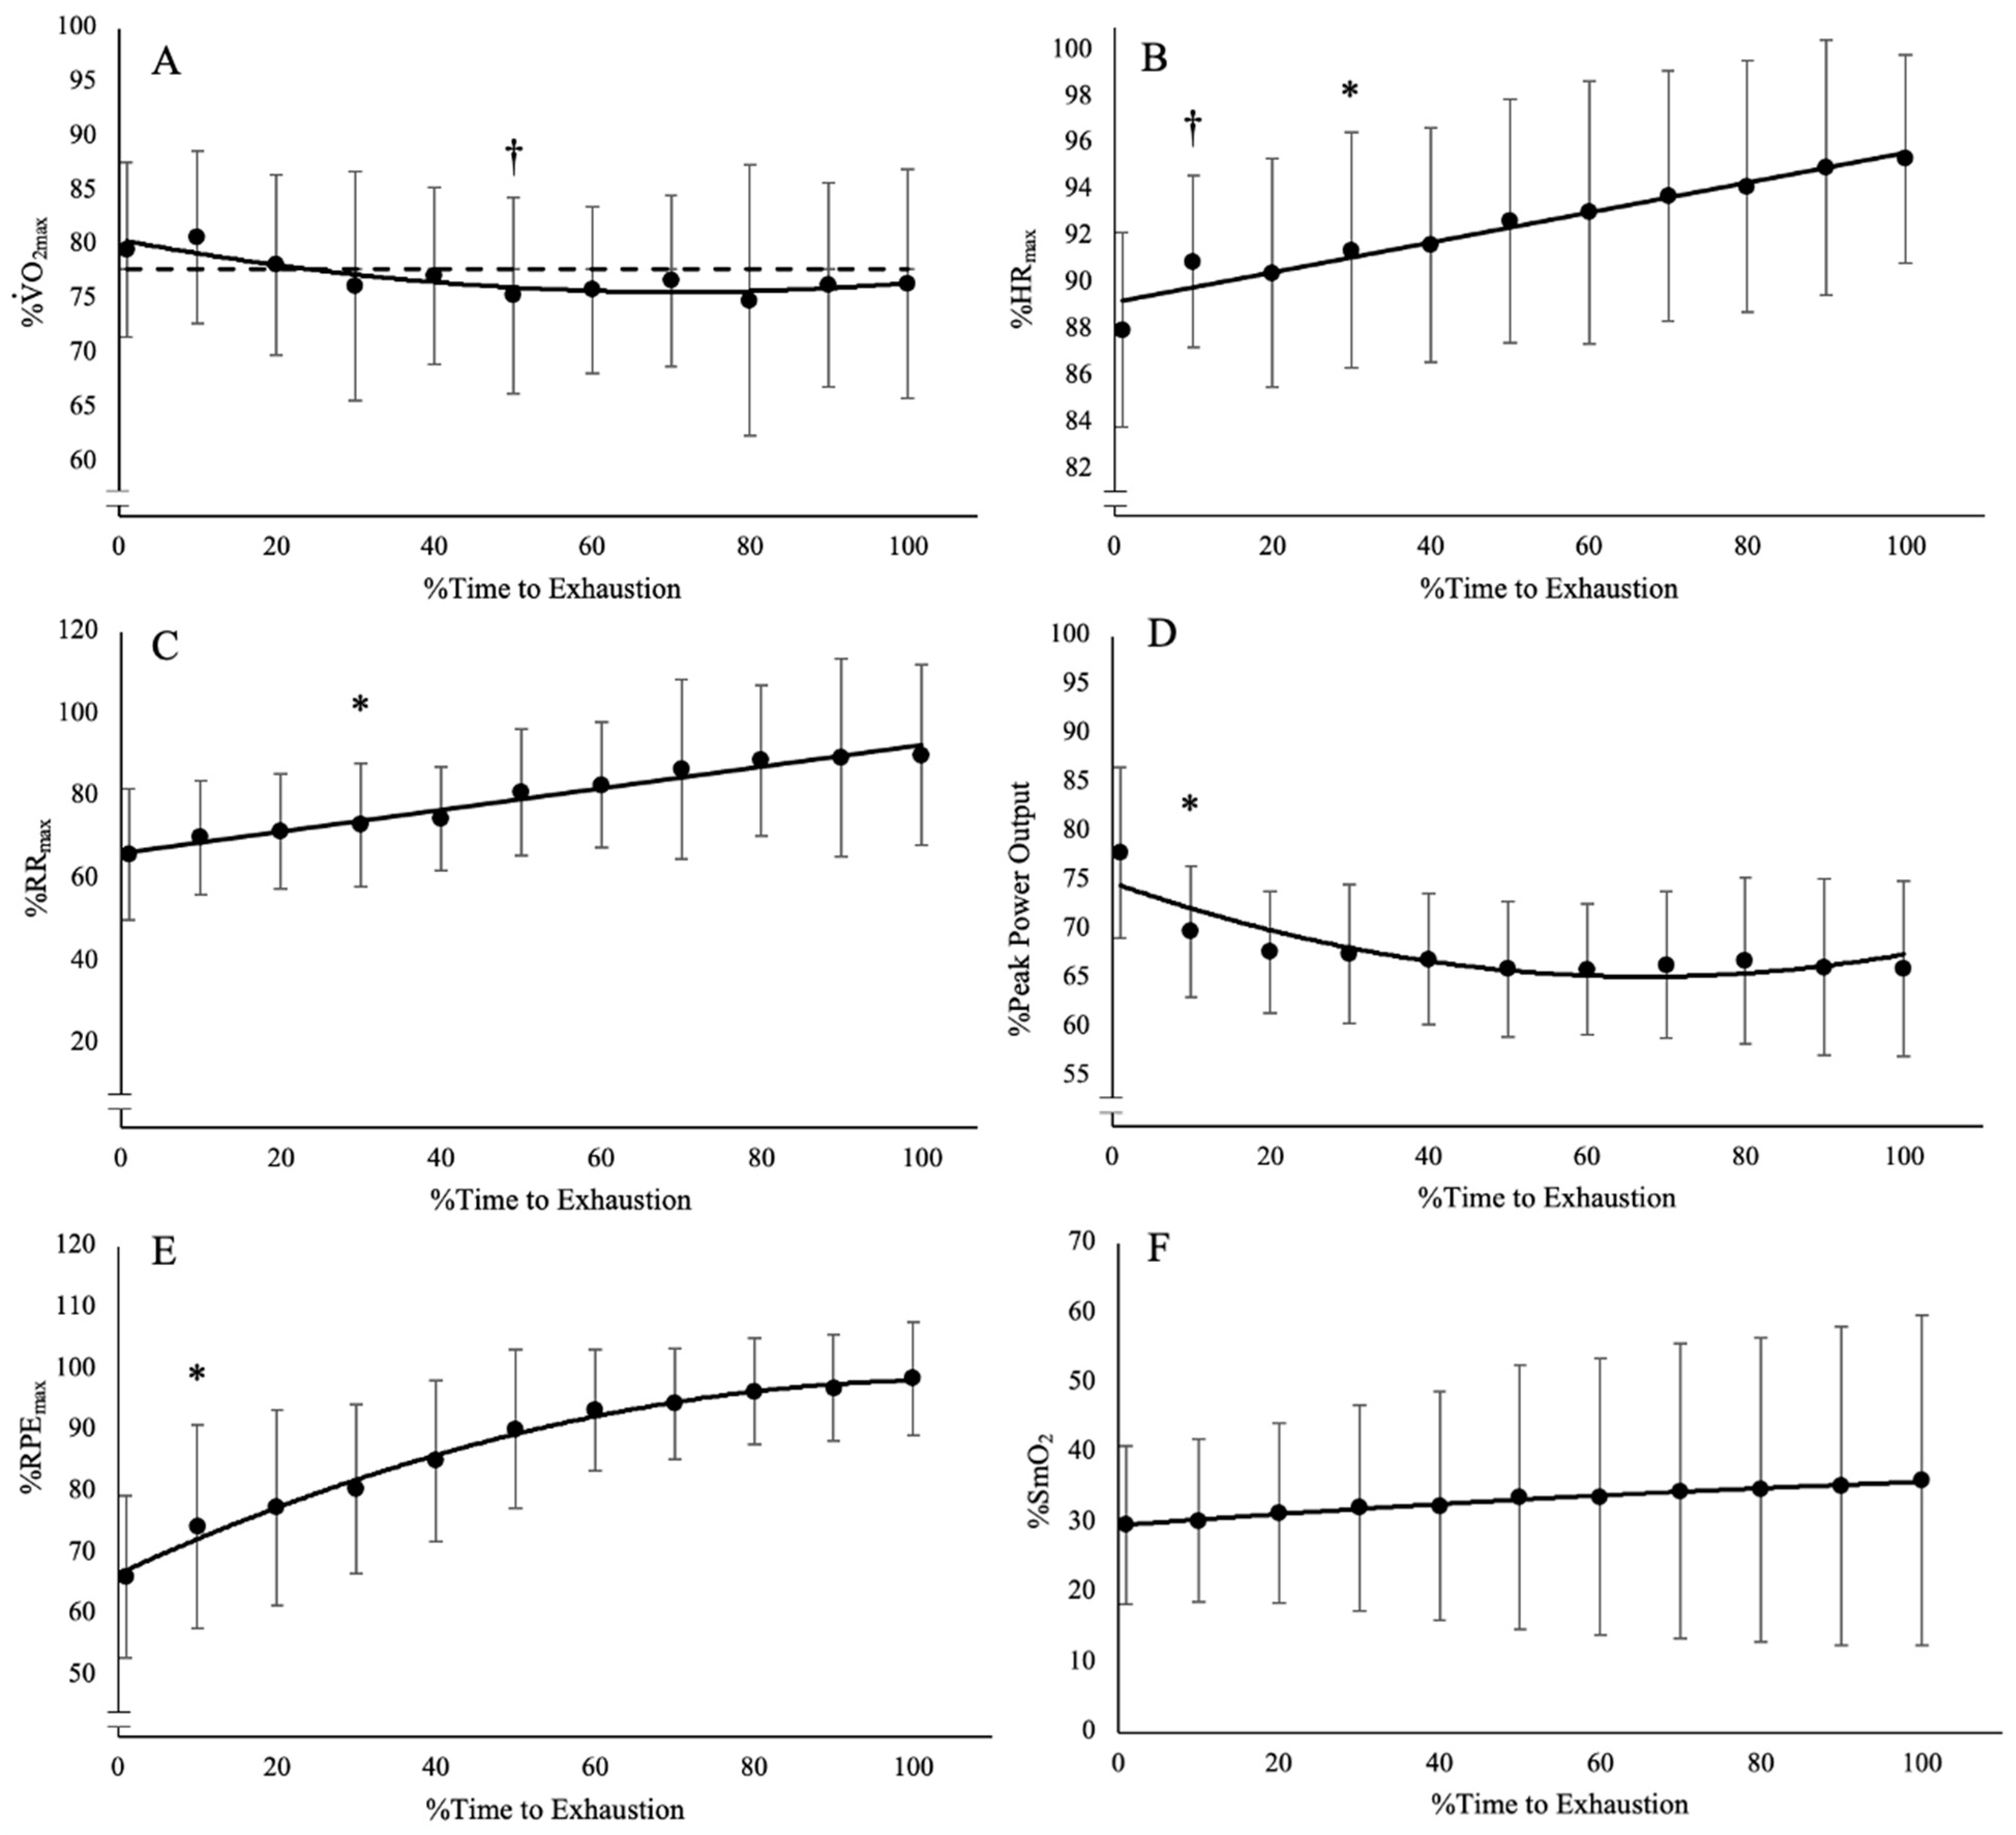
Time course of changes from the post hoc Bonferroni-corrected pairwise comparisons (p < 0.005) for (A) O2, which was lower than baseline at 50% TLim but was not different at any other time point; (B) heart rate (HR), which demonstrated an increase from baseline after 10% TLim; (C) respiration rate (RR), which demonstrated an increase from baseline after 30% TLim; (D) power output, which demonstrated a decrease from baseline after 10% TLim; (E) rating of perceived exertion, which demonstrated an increase from baseline after 10% TLim; and (F) muscle oxygen saturation (%SmO2), which was not different from among any of the time points. † Indicates differences from baseline at a single point. * Indicates differences from baseline from that point onward for the rest of the trial. Dashed line indicates mean O2 at CHR.

Table 1.
Relative mean and 95% confidence interval (CI) for oxygen uptake (O2), heart rate (HR), respiration rate (RR), power output, muscle oxygen saturation (%SmO2), rating of perceived exertion (RPE) at each time point, and the mean difference and 95% CI of the follow-up pairwise comparisons of each time point with the baseline value (0%TLim).
During the trial at O2CHR, the %∆ in EMG AMP, EMG MPF, MMG AMP, and MMG MPF were −23–33% (−3 ± 16%), 2–27% (10 ± 8%), −3–130% (40 ± 61%), and −6–14% (1 ± 7%). The one-way repeated-measures ANOVA and Bonferroni-corrected pairwise comparisons indicate there is a difference among the time points only for EMG MPF (F(10, 90) = 10.768, p < 0.001, pη2 = 0.545), and no differences for EMG AMP (F(10, 90) = 1.822, p = 0.077, pη2 = 0.168) and MMG AMP (F(10, 90) = 0.349, p = 0.955, pη2 = 0.037), or MMG MPF (F(10, 90) = 0.560, p = 0.826, pη2 = 0.059) (Figure 2; Table 2).
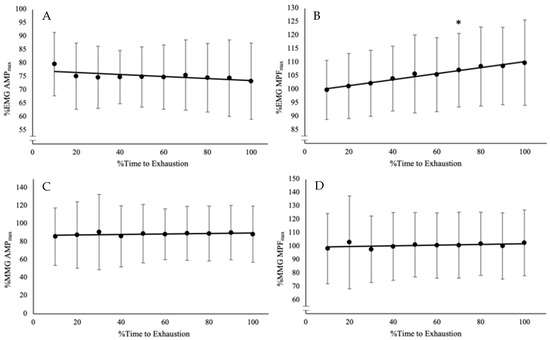
Figure 2.
Time course of changes from the post hoc Bonferroni-corrected pairwise comparisons (p < 0.0056) for (A) electromyographic amplitude (EMG AMP), which did not have any significant differences among the time points; (B) EMG mean power frequency (EMG MPF), which increased from baseline after 70% TLim; (C) mechanomyographic amplitude (MMG AMP), which did not have any differences among the time points; and (D) MMG mean power frequency (MMG MPF), which did not have any differences among the time points. * Indicates significant differences from baseline from that point onward for the rest of the trial.
Table 2.
Relative mean and 95% confidence interval (CI) for electromyographic amplitude (EMG AMP), mean power frequency (EMG MPF), mechanomyographic amplitude (MMG AMP), mean power frequency (MMG MPF) at each time point, and the mean difference and 95% CI of the follow-up pairwise comparisons of each time point with the baseline value (0–10%TLim).
4. Discussion
Traditional examinations of the physiological responses that define the exercise intensity domains have often used constant power output models in which the intensity domains are defined by the changes in physiological variables, such as O2, HR, and blood lactate concentration, but the power output is clamped [3]. However, in the current study, the O2-Clamp model was used to better understand the interactions among physiological and performance variables. Allowing the power output to fluctuate while clamping another parameter, such as RPE [13], HR [15,17,19], or O2 [14], has provided a different viewpoint from which to infer mechanisms of fatigue during exercise. The O2-Clamp model allows for the examination of the responses to exercise at O2CHR, which theoretically represents a physiologically based threshold that reflects individual performance characteristics [15,17,19]. In this study, the average initial power output used to elicit O2CHR (76 ± 9% PPO) represented an intensity within the severe intensity domain (>CP) at approximately 16% of the difference between CP (194 ± 48 W) and PPO (269 ± 63 W). However, three of the ten subjects had initial power outputs that were in the heavy intensity domain (>VT, <CP), while the remaining seven were in the severe intensity domain. On average, during the O2-Clamp trials, the power output decreased to 66 ± 9% PPO (179 ± 57 W), which was greater than the power output associated with the VT (146 ± 31 W) and was, therefore, within the heavy intensity domain. While the average TLim (31.31 ± 21.37 min) indicated that exercise at O2CHR represented a sustainable intensity, the examination of the individual differences makes that conclusion less clear. Three of the ten subjects were able to sustain exercise at O2CHR for the entire 60 min, with two of those three being subjects who were initially in the heavy intensity domain. Two subjects were able to sustain exercise for just over 30 min (32.27 ± 1.80 min), and the remaining five subjects were unable to sustain exercise for at least 30 min (13.71 ± 4.62 min). Therefore, the initial power output, relative to the exercise intensity domains, required to maintain the O2CHR most likely determines the sustainability of exercise anchored to O2.
Similar to the responses that have been demonstrated during constant HR exercise at CHR [19], exercise at O2CHR appears to be predicated on time spent in each exercise intensity domain. Specifically, two of the three subjects who were able to maintain exercise for the full 60 min were, based on power output, within the moderate intensity domain (<VT) for the majority of the trial (87.45–91.3% TLim), with almost no time spent in the severe intensity domain (>CP) (Table 3). The one other subject that maintained exercise for the full 60 min remained in the heavy intensity domain for the entire trial (>VT, but <CP). The seven subjects who were unable to maintain exercise for the entire 60 min began an exercise in the severe or heavy intensity domains and were unable to transverse into the moderate intensity domain. While five of these seven subjects were able to transverse from the severe into the heavy intensity domain, the results of this study support previous work [33,34] that suggests that the amount of work performed in the severe intensity domain (>CP) does not change regardless of pacing strategy or partial recovery of metabolic disturbances. This may indicate that O2 was not sensitive enough to elicit a sufficient decrease in power output to get into the moderate intensity domain before a significant accumulation of metabolic disturbances [35]. Thus, based on the individual responses, exercise at O2CHR is dependent on the exercise intensity domain in which the initial power output is located. Individuals who were able to do minimal work in the severe intensity domain, such as those who start or transverse into the moderate intensity domain, were able to sustain exercise for 60 min. Conversely, those subjects that spent more time in the severe intensity domain most likely accumulated a significant amount of metabolic disturbances that ultimately led to fatigue within 30 min. However, future studies should examine the O2-Clamp exercise at a O2-based threshold, such as the critical O2 [36], to further evaluate O2-Clamp exercise as a tool to examine various mechanisms of fatigue.
Table 3.
Individual, mean, and SD time to exhaustion (TLim), and the time spent in each exercise intensity domain at the O2 associated with critical heart rate (O2CHR).
Our current understanding of the response to exercise is based on constant power output/velocity trials where the response depends on the relative intensity with respect to the exercise intensity domains. While Ribeiro et al. [14] reported general decreases in power output during exercise at a constant O2, the magnitude and time course of these decreases remain unclear. In the current study, there were significant decreases, ranging from 7–23% (mean = 15%), in power output after 10% of TLim. This sharp decline at the beginning of the trial was most likely due to a delayed O2 response when ramping to O2CHR, which may have caused an initial overshoot in O2. Following the sharp initial decline in power output, there was a stabilization after 20%TLim that demonstrated a plateau for the rest of the duration of the trial (Figure 1D). This pattern of response in the power output demonstrates a similar response to that seen in self-paced exercise with a “fast-start” phase followed by an “even-pace” phase [34]. However, despite these decreases in power output, there was no significant difference in the EMG AMP, MMG AMP, MMG MPF, and %SmO2 from the time the subjects achieved the designated O2 to the end of the trial. This suggests there may have been a consistent level of muscle excitation (motor unit recruitment, firing rate, and synchronization) and muscle oxygen saturation throughout the trial. This lack of difference throughout the trial was irrespective of whether the individual subject was able to sustain exercise for >30 min or not. This finding is in contrast with the response demonstrated during self-paced trials, where it was reported there was a decrease in muscle excitation after the “fast-start” [37]. This lack of change in muscle excitation may have impaired muscle oxygen saturation due to intramuscular pressure from the active musculature hampering the perfusion response [38,39]. The lack of change in muscle excitation may have also caused metabo-sensory feedback from group III/IV muscle afferents from the working skeletal and respiratory muscles [40,41,42]. Despite this afferent feedback, which has been shown to trigger the metaboreflex to cause increased perfusion to the exercising muscle [43,44,45], there was no change in the muscle oxygen saturation from the time the designated O2 was achieved at the end of the trial. This lack of change may be the result of the sustained level of muscle excitation and intramuscular pressure [46,47] but may also be a result of differences in muscle architecture, muscle stiffness, fiber type composition, intramuscular fluid pressure, or other morphological or methodological differences that were not examined in the current investigation [48,49,50,51].
It has also been hypothesized that during constant HR running [17], group III/IV’s muscle afferent feedback from an increase in RR was the main mediator of the increase in RPE. In the current study, there were significant increases in RR after 30% of TLim. Notably, four of the five subjects who were unable to sustain exercise for at least 30 min demonstrated increases in RR to maximal or supramaximal levels during trials at O2CHR (98–134% RRpeak), while those that could maintain exercise for at least 30 min demonstrated, on average, more moderate increases (56–96% RRpeak). This increase in RR also coincided with similar increases in RPE (100–105% RPEpeak). However, the increases in RPE occurred earlier (10% TLim) than the increases in RR and were more consistent with the increases in HR (10% TLim). The individual responses indicated that the subjects who were unable to sustain 30 min of exercise had higher starting (90–93% versus 80–88% HRpeak) and ending (96–103% versus 87–97% HRpeak) HR responses. Based on the original development of the RPE scale [29], it is not surprising that HR and RPE demonstrated similar responses, as it has been suggested that HR afferent feedback is also mediated through group III/IV afferent fibers [40,52]. While there is conflicting evidence that suggests HR is not a mediator of RPE [53], the evidence in the current study, along with previous work examining exercise anchored by different physiological parameters [13,17,19], points to multiple mechanisms that regulate the perception of effort and are likely a combination of feedforward [53] and feedback [40] mechanisms. Specifically, the mechanism of fatigue may be intensity- and anchoring-dependent. Future studies are required to examine the responses to exercise using physiologically based anchoring schemes at different intensities. For exercise anchored at O2CHR, the decreases in power output were not sufficient to cause a decruitment of the active musculature and still resulted in significant increases in RR, HR, and RPE, which together may help to explain the variability in sustainability.
5. Conclusions
While most studies use a constant power output to examine thresholds, the O2-Clamp method was used in the current study to allow for the examination of the responses to O2CHR, an individually derived, performance-based threshold. During exercise at O2CHR, the reductions in power output constituted a loss in performance of 7–23% (mean = 15%). Calculating the area under the curve of the power output versus time relationship for the actual versus starting power output during the O2-Clamp trial (Figure 3) potentially provides a quantifiable estimate of the loss of power output. These losses in performance may help to further quantify the inefficiency associated with the sustained recruitment of type II muscle fibers, which has been suggested to evoke the O2 slow component response [20]. The EMG, MMG, and %SmO2 responses suggested continued muscle excitation throughout the trial and pointed to afferent feedback as a potential driver of performance. Meanwhile, the HR, RR, and RPE responses suggested a combination of feedforward and feedback mechanisms regulating the sustainability of exercise at O2CHR. Thus, the O2-Clamp exercise demonstrates a novel method for examining mechanisms of fatigue and the O2 slow components. Future studies should examine these responses with a uniform threshold, such as the respiratory compensation point or critical O2, to further examine the utility of the O2-Clamp exercise as a powerful tool in the examination of fatigue.
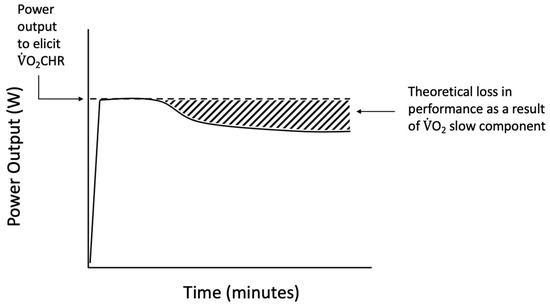
Figure 3.
Theoretical representation of the performance loss during O2-Clamp exercise as a result of inefficiencies such as the O2 slow component phenomenon.
Author Contributions
Conceptualization, P.J.S., M.G.A., J.L.C. and H.C.B.; methodology, P.J.S., M.G.A., J.L.C. and H.C.B.; software, P.J.S.; validation, P.J.S.; formal analysis, P.J.S., B.B., T.K.D.-M., M.K., C.J.M. and H.C.B.; resources, H.C.B.; data curation, P.J.S.; writing–original draft preparation, P.J.S.; writing–review and editing, T.K.D.-M., C.C.V., B.B., M.K., C.J.M., M.G.A., J.L.C. and H.C.B.; visualization, P.J.S.; supervision, H.C.B.; project administration, P.J.S. and H.C.B. All authors have read and agreed to the published version of the manuscript.
Funding
This research received no external funding.
Institutional Review Board Statement
This study was conducted in accordance with the Declaration of Helsinki, and approved by the Institutional Review Board of the University of Kentucky (Protocol # 51399; date of approval 28 May 2019).
Informed Consent Statement
Informed consent was obtained from all subjects involved in the study.
Data Availability Statement
Data can be made available upon request.
Conflicts of Interest
The authors declare no conflict of interest.
References
- Liguori, G.; Feito, Y.; Fountaine, C.; Roy, B. ACSM’s Guidelines for Exercise Testing and Prescription, 11th ed.; Wolters Kluwer: Philadelphia, PA, USA, 2021. [Google Scholar]
- Midgley, A.W.; McNaughton, L.R.; Wilkinson, M. Is There an Optimal Training Intensity for Enhancing the Maximal Oxygen Uptake of Distance Runners?: Empirical Research Findings, Current Opinions, Physiological Rationale and Practical Recommendations. Sports Med. 2006, 36, 117–132. [Google Scholar] [CrossRef] [PubMed]
- Gaesser, G.A.; Poole, D.C. The Slow Component of Oxygen Uptake Kinetics in Humans. Exerc. Sport Sci. Rev. 1996, 24, 35–71. [Google Scholar] [CrossRef] [PubMed]
- Dekerle, J.; Baron, B.; Dupont, L.; Vanvelcenaher, J.; Pelayo, P. Maximal Lactate Steady State, Respiratory Compensation Threshold and Critical Power. Eur. J. Appl. Physiol. 2003, 89, 281–288. [Google Scholar] [CrossRef] [PubMed]
- Hill, D.W.; Ferguson, C.S. A Physiological Description of Critical Velocity. Eur. J. Appl. Physiol. Occup. Physiol. 1999, 79, 290–293. [Google Scholar] [CrossRef] [PubMed]
- Darabi, S.; Dehghan, M.H.; Refahi, S.; Kiani, E. Ventilation, Potassium and Lactate during Incremental Exercise in Men Athletes. Res. J. Biol. Sci. 2009, 4, 427–429. [Google Scholar]
- Brickley, G.; Doust, J.; Williams, C.A. Physiological Responses during Exercise to Exhaustion at Critical Power. Eur. J. Appl. Physiol. 2002, 88, 146–151. [Google Scholar] [CrossRef] [PubMed]
- Poole, D.C.; Ward, S.A.; Gardner, G.W.; Whipp, B.J. Metabolic and Respiratory Profile of the Upper Limit for Prolonged Exercise in Man. Ergonomics 1988, 31, 1265–1279. [Google Scholar] [CrossRef] [PubMed]
- Bull, A.J.; Housh, T.J.; Johnson, G.O.; Perry, S.R. Electromyographic and Mechanomyographic Responses at Critical Power. Can. J. Appl. Physiol. 2000, 25, 262–270. [Google Scholar] [CrossRef] [PubMed]
- Bergstrom, H.C.; Housh, T.J.; Zuniga, J.M.; Traylor, D.A.; Lewis, R.W.; Camic, C.L.; Schmidt, R.J.; Johnson, G.O. Mechanomyographic and Metabolic Responses during Continuous Cycle Ergometry at Critical Power from the 3-Min All-out Test. J. Electromyogr. Kinesiol. 2013, 23, 349–355. [Google Scholar] [CrossRef] [PubMed]
- Bergstrom, H.C.; Housh, T.J.; Dinyer, T.K.; Byrd, T.M.; Jenkins, N.D.M.; Cochrane-Snyman, K.C.; Succi, P.J.; Schmidt, R.J.; Johnson, G.O.; Zuniga, J.M. Neuromuscular Responses of the Superficial Quadriceps Femoris Muscles: Muscle Specific Fatigue and Inter-Individual Variability during Severe Intensity Treadmill Running. J. Musculoskelet. Neuronal Interact. 2020, 20, 77–87. [Google Scholar] [PubMed]
- Dinyer, T.K.; Byrd, M.T.; Cochrane-Snyman, K.C.; Jenkins, N.D.; Housh, T.J.; Schmidt, R.J.; Johnson, G.O.; Bergstrom, H.C. Time Course of Changes in Neuromuscular Responses during Rides to Exhaustion above and below Critical Power. J. Musculoskelet. Neuronal Interact. 2019, 19, 266–275. [Google Scholar] [PubMed]
- Cochrane, K.C.; Housh, T.J.; Jenkins, N.D.M.; Bergstrom, H.C.; Smith, C.M.; Hill, E.C.; Johnson, G.O.; Schmidt, R.J.; Cramer, J.T. Electromyographic, Mechanomyographic, and Metabolic Responses during Cycle Ergometry at a Constant Rating of Perceived Exertion. Appl. Physiol. Nutr. Metab. 2015, 40, 1178–1185. [Google Scholar] [CrossRef] [PubMed]
- Ribeiro, J.P.; Hughes, V.; Fielding, R.A.; Holden, W.; Evans, W.; Knuttgen, H.G. Metabolic and Ventilatory Responses to Steady State Exercise Relative to Lactate Thresholds. Eur. J. Appl. Physiol. Occup. Physiol. 1986, 55, 215–221. [Google Scholar] [CrossRef] [PubMed]
- Mielke, M. An Examination of the Physiological Responses at the Critical Heart Rate; University of Nebraska: Lincoln, NE, USA, 2009. [Google Scholar]
- Bergstrom, H.C.; Housh, T.J.; Cochrane, K.C.; Jenkins, N.D.M.; Buckner, S.L.; Goldsmith, J.A.; Zuniga, J.M.; Schmidt, R.J.; Johnson, G.O.; Cramer, J.T. Application of the Critical Heart Model to Treadmill Running. J. Strength Cond. Res. 2015, 29, 2237–2248. [Google Scholar] [CrossRef] [PubMed]
- Bergstrom, H.C.; Housh, T.J.; Cochrane, K.C.; Jenkins, N.D.M.; Zuniga, J.M.; Buckner, S.L.; Goldsmith, J.A.; Schmidt, R.J.; Johnson, G.O.; Cramer, J.T. Factors Underlying the Perception of Effort during Constant Heart Rate Running above and below the Critical Heart Rate. Eur. J. Appl. Physiol. 2015, 115, 2231–2241. [Google Scholar] [CrossRef] [PubMed]
- Mielke, M.; Housh, T.J.; Hendrix, C.R.; Zuniga, J.; Camic, C.L.; Schmidt, R.J.; Johnson, G.O. A Test for Determining Critical Heart Rate Using the Critical Power Model. J. Strength Cond. Res. 2011, 25, 504–510. [Google Scholar] [CrossRef] [PubMed]
- Succi, P.J.; Dinyer-McNeely, T.K.; Voskuil, C.C.; Abel, M.G.; Clasey, J.L.; Bergstrom, H.C. Responses to Exercise at the Critical Heart Rate vs. the Power Output Associated With the Critical Heart Rate. J. Strength Cond. Res. 2023, 37, 2362–2372. [Google Scholar] [CrossRef] [PubMed]
- Jones, A.M.; Grassi, B.; Christensen, P.M.; Krustrup, P.; Bangsbo, J.; Poole, D.C. Slow Component of O2 Kinetics: Mechanistic Bases and Practical Applications. Med. Sci. Sports Exerc. 2011, 43, 2046–2062. [Google Scholar] [CrossRef] [PubMed]
- Billat, V.L. O2 Slow Component and Performance in Endurance Sports. Br. J. Sports Med. 2000, 34, 83–85. [Google Scholar] [CrossRef] [PubMed]
- Sawyer, B.J.; Morton, R.H.; Womack, C.J.; Gaesser, G.A. O2max May Not Be Reached during Exercise to Exhaustion above Critical Power. Med. Sci. Sports Exerc. 2012, 44, 1533–1538. [Google Scholar] [CrossRef] [PubMed]
- Hermens, H.J.; Freriks, B.; Stegeman, D.; Blok, J.; Rau, G.; Disselhorst-Klug, C.; Hagg, G. European Recommendations for Surface Electromyography. Roessingh Res. Dev. 1999, 8, 13–54. [Google Scholar]
- Malek, M.H.; Coburn, J.W.; Weir, J.P.; Beck, T.W.; Housh, T.J. The Effects of Innervation Zone on Electromyographic Amplitude and Mean Power Frequency during Incremental Cycle Ergometry. J. Neurosci. Methods 2006, 155, 126–133. [Google Scholar] [CrossRef] [PubMed]
- Abe, T.; Kumagai, K.; Brechue, W.F. Fascicle Length of Leg Muscles Is Greater in Sprinters than Distance Runners. Med. Sci. Sports Exerc. 2000, 32, 1125–1129. [Google Scholar] [CrossRef]
- Diemont, B.; Figini, M.M.; Orizio, C.; Perini, R.; Veicsteinas, A. Spectral Analysis of Muscular Sound at Low and High Contraction Level. Int. J. Biomed. Comput. 1988, 23, 161–175. [Google Scholar] [CrossRef]
- Kwatny, E.; Thomas, D.H.; Kwatny, H.G. An Application of Signal Processing Techniques to the Study of Myoelectric Signals. IEEE Trans. Biomed. Eng. 1970, 17, 303–313. [Google Scholar] [CrossRef] [PubMed]
- Robergs, R.A.; Dwyer, D.; Astorino, T. Recommendations for Improved Data Processing from Expired Gas Analysis Indirect Calorimetry. Sports Med. 2010, 40, 95–111. [Google Scholar] [CrossRef]
- Borg, G. Perceived Exertion as an Indicator of Somatic Stress. Scand. J. Rehabil. Med. 1970, 2, 92–98. [Google Scholar] [CrossRef] [PubMed]
- Beaver, W.L.; Wasserman, K.; Whipp, B.J. A New Method for Detecting Anaerobic Threshold by Gas Exchange. J. Appl. Physiol. 1986, 60, 2020–2027. [Google Scholar] [CrossRef] [PubMed]
- Kirby, B.S.; Clark, D.A.; Bradley, E.M.; Wilkins, B.W. The Balance of Muscle Oxygen Supply and Demand Reveals Critical Metabolic Rate and Predicts Time to Exhaustion. J. Appl. Physiol. 2021, 130, 1915–1927. [Google Scholar] [CrossRef] [PubMed]
- Feldmann, A.; Schmitz, R.; Erlacher, D. Near-Infrared Spectroscopy-Derived Muscle Oxygen Saturation on a 0% to 100% Scale: Reliability and Validity of the Moxy Monitor. J. Biomed. Opt. 2019, 24, 115001. [Google Scholar] [CrossRef]
- Chidnok, W.; Dimenna, F.J.; Bailey, S.J.; Wilkerson, D.P.; Vanhatalo, A.; Jones, A.M. Effects of Pacing Strategy on Work Done above Critical Power during High-Intensity Exercise. Med. Sci. Sports Exerc. 2013, 45, 1377–1385. [Google Scholar] [CrossRef] [PubMed]
- Azevedo, R.d.A.; Silva-Cavalcante, M.D.; Lima-Silva, A.E.; Bertuzzi, R. Fatigue Development and Perceived Response during Self-Paced Endurance Exercise: State-of-the-Art Review. Eur. J. Appl. Physiol. 2021, 121, 687–696. [Google Scholar] [CrossRef] [PubMed]
- Chidnok, W.; Fulford, J.; Bailey, S.J.; Dimenna, F.J.; Skiba, P.F.; Vanhatalo, A.; Jones, A.M. Muscle Metabolic Determinants of Exercise Tolerance Following Exhaustion: Relationship to the “Critical Power”. J. Appl. Physiol. 2013, 115, 243–250. [Google Scholar] [CrossRef] [PubMed]
- Succi, P.J.; Dinyer, T.K.; Byrd, M.T.; Voskuil, C.C.; Bergstrom, H.C. Application of O2 to the Critical Power Model to Derive the Critical O2. J. Strength Cond. Res. 2022, 36, 3374–3380. [Google Scholar] [CrossRef] [PubMed]
- Azevedo, R.d.A.; Cruz, R.; Couto, P.; Silva-Cavalcante, M.D.; Boari, D.; Lima-Silva, A.E.; Millet, G.Y.; Bertuzzi, R. Characterization of Performance Fatigability during a Self-Paced Exercise. J. Appl. Physiol. 2019, 127, 838–846. [Google Scholar] [CrossRef] [PubMed]
- Abbiss, C.R.; Laursen, P.B. Models to Explain Fatigue during Prolonged Endurance Cycling. Sports Med. 2005, 35, 865–898. [Google Scholar] [CrossRef] [PubMed]
- Takaishi, T.; Sugiura, T.; Katayama, K.; Sato, Y.; Shima, N.; Yamamoto, T.; Moritani, T. Changes in Blood Volume and Oxygenation Level in a Working Muscle during a Crank Cycle. Med. Sci. Sports Exerc. 2002, 34, 520–528. [Google Scholar] [CrossRef] [PubMed]
- Amann, M.; Blain, G.M.; Proctor, L.T.; Sebranek, J.J.; Pegelow, D.F.; Dempsey, J.A. Group III and IV Muscle Afferents Contribute to Ventilatory and Cardiovascular Response to Rhythmic Exercise in Humans. J. Appl. Physiol. 2010, 109, 966–976. [Google Scholar] [CrossRef] [PubMed]
- Kaufman, M.P.; Hayes, S.G. The Exercise Pressor Reflex. Clin. Auton. Res. 2002, 12, 429–439. [Google Scholar] [CrossRef] [PubMed]
- Kaufman, M.P.; Longhurst, J.C.; Rybicki, K.J.; Wallach, J.H.; Mitchell, J.H. Effects of Static Muscular Contraction on Impulse Activity of Groups III and IV Afferents in Cats. J. Appl. Physiol. Respir. Environ. Exerc. Physiol. 1983, 55, 105–112. [Google Scholar] [CrossRef] [PubMed]
- Andersen, P.; Saltin, B. Maximal Perfusion of Skeletal Muscle in Man. J. Physiol. 1985, 366, 233–249. [Google Scholar] [CrossRef] [PubMed]
- Alam, M.; Smirk, F.H. Observations in Man upon a Blood Pressure Raising Reflex Arising from the Voluntary Muscles. J. Physiol. 1937, 89, 372–383. [Google Scholar] [CrossRef] [PubMed]
- Augustyniak, R.A.; Collins, H.L.; Ansorge, E.J.; Rossi, N.F.; O’Leary, D.S. Severe Exercise Alters the Strength and Mechanisms of the Muscle Metaboreflex. Am. J. Physiol. Heart Circ. Physiol. 2001, 280, H1645–H1652. [Google Scholar] [CrossRef] [PubMed]
- Keller, J.L.; Housh, T.J.; Hill, E.C.; Smith, C.M.; Schmidt, R.J.; Johnson, G.O. Self-Regulated Force and Neuromuscular Responses During Fatiguing Isometric Leg Extensions Anchored to a Rating of Perceived Exertion. Appl. Psychophysiol. Biofeedback 2019, 44, 343–350. [Google Scholar] [CrossRef] [PubMed]
- Hill, A. V The Pressure Developed in Muscle during Contraction. J. Physiol. 1948, 107, 518–526. [Google Scholar] [CrossRef] [PubMed]
- Staron, R.S.; Hagerman, F.C.; Hikida, R.S.; Murray, T.F.; Hostler, D.P.; Crill, M.T.; Ragg, K.E.; Toma, K. Fiber Type Composition of the Vastus Lateralis Muscle of Young Men and Women. J. Histochem. Cytochem. 2000, 48, 623–629. [Google Scholar] [CrossRef] [PubMed]
- Yoshitake, Y.; Ue, H.; Miyazaki, M.; Moritani, T. Assessment of Lower-Back Muscle Fatigue Using Electromyography, Mechanomyography, and near-Infrared Spectroscopy. Eur. J. Appl. Physiol. 2001, 84, 174–179. [Google Scholar] [CrossRef] [PubMed]
- Barry, D.T.; Cole, N.M. Muscle Sounds Are Emitted at the Resonant Frequencies of Skeletal Muscle. IEEE Trans. Biomed. Eng. 1990, 37, 525–531. [Google Scholar] [CrossRef] [PubMed]
- L’Estrange, P.R.; Rowell, J.; Stokes, M.J. Acoustic Myography in the Assessment of Human Masseter Muscle. J. Oral. Rehabil. 1993, 20, 353–362. [Google Scholar] [CrossRef] [PubMed]
- Gray, M.A.; Taggart, P.; Sutton, P.M.; Groves, D.; Holdright, D.R.; Bradbury, D.; Brull, D.; Critchley, H.D. A Cortical Potential Reflecting Cardiac Function. Proc. Natl. Acad. Sci. USA 2007, 104, 6818–6823. [Google Scholar] [CrossRef] [PubMed]
- Marcora, S. Perception of Effort during Exercise Is Independent of Afferent Feedback from Skeletal Muscles, Heart, and Lungs. J. Appl. Physiol. 2009, 106, 2060–2062. [Google Scholar] [CrossRef]


Disclaimer/Publisher’s Note: The statements, opinions and data contained in all publications are solely those of the individual author(s) and contributor(s) and not of MDPI and/or the editor(s). MDPI and/or the editor(s) disclaim responsibility for any injury to people or property resulting from any ideas, methods, instructions or products referred to in the content. |
© 2024 by the authors. Licensee MDPI, Basel, Switzerland. This article is an open access article distributed under the terms and conditions of the Creative Commons Attribution (CC BY) license (https://creativecommons.org/licenses/by/4.0/).