Article

Physiological Key Determinants of Elite Open-Water Swimmers

1
French Swimming Federation, 92110 Clichy, France
2
M2S Laboratory—Laboratoire Mouvement Sport Santé, Université Rennes 2, 35170 Rennes, France
3
LBEPS—Laboratoire de Biologie de l’Exercice pour la Performance et la Santé, Université de Paris Saclay, 91025 Evry, France
*
Author to whom correspondence should be addressed.
Physiologia 2024, 4(3), 305-316; https://doi.org/10.3390/physiologia4030018
Submission received: 31 May 2024 / Revised: 3 September 2024 / Accepted: 9 September 2024 / Published: 11 September 2024
(This article belongs to the Special Issue Exercise Physiology and Biochemistry: 2nd Edition)

Abstract

:
This study describes the relationships between different physiological measurements and combinations of critical velocity and performance in elite open-water swimmers. A total of 15 international male open-water swimmers performed a 5 × 200 m front crawl incremental test to estimate maximal aerobic speed (MAS), maximal oxygen consumption (VO2max), the first lactate threshold (VLT1), the second lactate threshold (VLT2), the speed corresponding to 2 mmol/L (V2mmol/L) and to 4 mmol/L (V4mmol/L), and the lactate threshold (VDmax). A 10 km pool trial was also performed to assess swimming performance. Official competition performances in 200, 400, 800, and 1500 m events were collected and were also used to calculate critical velocity (CV) with various combinations of distances. Personal best performances in 1500 m events were 941.76 ± 20.28 s. For the 10 km trial, performance was strongly correlated to VLT1 and moderately to V2mmol/L (r = 0.73 and 0.67, respectively). For the 400, 800, and 1500 m events, strong correlations were observed for V2mmol/L and V4mmol/L. Moderate correlations with these events were also observed for VLT1 and for VDmax (400 and 800 m only). For long-distance swimmers, assessment with a fixed blood lactate value seems to be a good option to estimate swimming performance in distance events. In addition, 10 km performance seems to be more related to the aerobic threshold than the anaerobic threshold.

1. Introduction

It is well known that the best endurance athletes are used to sustaining severe exertion for many hours and need to develop a high aerobic capacity to achieve maximal performance [1]. Open-water swimming is one such activity, where swimmers exhibit a high percentage of VO2max during a race [2]. At the same time, the best open-water swimmers in the world present higher speeds in pool events than others [3], with a great end spurt at the end of the race [4]. Open-water swimming is also characterized by more fluctuations in energy cost than in pool conditions [5], which is partially due to biomechanical variables [6]. Intensity zones for open-water swimmers seem to be quite different than those reported for other endurance disciplines [7]. In long-distance swimming events, some authors have already investigated the relationships between velocity corresponding to 4 mmol/L and performance [8]. The assessment of the lactate threshold (LT) is often used from young swimmers [9] to elite swimmers [10,11] to monitor training intensity and to observe physiological changes throughout cycles and seasons. The assessment of the LT is essential in long-distance swimmers because they train and compete near this swimming speed [12].
The concept of the LT has already been largely discussed in the literature, and a lot of methods allow for the estimation of this threshold [13]. Some authors use gas analysis to measure the anaerobic threshold [14], but this method seems to not be appropriate for swimmers because of the complexity of the protocol. Indeed, gas analysis during swimming places a lot of constraints on the swimmers, like the impossibility of performing turns, the modification of breathing caused by the snorkel, and the resulting difficulty in achieving maximal swimming velocity. Another method exists for measuring oxygen consumption: at the moment of the swimmer’s first breath after reaching the wall [15]. This technique is associated with a mathematical model allowing a post-exercise measurement to quantify oxygen uptake [15]. The assessment of blood lactate concentration values appears to be the best method to estimate the LT in elite swimmers [8,16]. This is why, in swimming, the LT is estimated with lactate measurements, whereas the anaerobic threshold can be estimated when the gas analysis is performed.
In swimming, two different protocols allow for the determination of the LT, where the maximal lactate steady state (MLSS) is obtained after continuous swimming exercise and the LT is estimated after an incremental test [17,18]. Currently, the incremental swimming test is preferred by sports scientists because of its ease of use, the possibility to categorize swimming intensity, the ability to collect other physiological measurements like maximal heart rate and maximal oxygen consumption, and the ability to observe stroke kinematics changes [9,10,11,17,18,19]. This test allows for the creation of a lactate–velocity curve, which gives an estimation of the LT. The LT is frequently debated with various possible measurement methods [13]. This can lead to different results depending on the method used and thus can have an impact on assessing endurance performance [13].
Another concept which appears to be linked with endurance performance is the critical velocity [20], which is defined as the velocity that can be maintained without exhaustion. It is assessed from swimming performance at various distances [21]. In swimming, Wakayoshi et al. [22] presented a method to calculate the critical velocity and demonstrated that it could be adopted as an index of swimming endurance. In that study, the authors showed that critical velocity (CV) highly correlated with the velocity at the onset of blood lactate accumulation (OBLA) and the mean velocity of the 400 m freestyle [22]. More recently, Toubekis et al. [23] also observed a strong correlation between the CV calculated from a combination of distances including 50, 100, 200, and 400 m and the LT in young swimmers. This study highlighted that only two or three distances can be applied to assess endurance performance without the need for any equipment [23].
To date, some studies have highlighted the correlations between pool performances and open-water performances, but few studies have described the main physiological variables for elite open-water swimmers. In this sense, the aim of this study was to identify which physiological capacities of such open-water swimmers are related to long-distance swimming performance. We hypothesized that the LT will strongly correlate with swimming endurance performance.

2. Materials and Methods

2.1. Experimental Approach to the Problem

All the testing procedures were performed in a 50 m indoor swimming pool located at the National Institute of Sport (Paris, France). The swimmers were advised to avoid caffeine and alcohol at least 48 h before the experimental sessions. The swimmers were equipped with a habitual competition wetsuit. They performed in-water starts and open turns using the front crawl stroke. All tests were conducted between 14:00 h and 16:00 h in the same period, corresponding to the last weekend of May in various training seasons.

2.2. Participants

This study included 15 male swimmers (20.3 ± 3.9 years, 72.3 ± 3.5 kg of body mass, 1.83 ± 0.06 m in height) who were all on the open-water French swimming team (2 of them participated in the Olympic Games, 3 of them participated in the World Championships, 2 of them participated in the World Cup, and 8 of them participated in the European Junior Championships). The swimmers had at least 9 years of experience as competitive swimmers, and they trained 24–28 h with 10 ± 2 sessions per week. The best swimming performance characteristics of swimmers are presented in Table 1. This study was conducted in accordance with the Declaration of Helsinki. After comprehensive verbal explanations, all participants signed an informed consent form to participate.

2.3. Procedures

The incremental test was conducted following the protocol proposed by Mujika et al. [24] after a standardized 1200 m warm-up, which included general, arm, and leg work, with a progressive-intensity specialty set, concluding with low-intensity aerobic swimming. The test consisted of swimming 5 × 200 m with velocity increments of 0.05 m/s and 1 min of rest between each 200 m step. The velocity was not paced, as the swimmers were accustomed to performing this test during the season. The velocity of the last step was determined by the swimmer’s best 400 m freestyle personal record. Capillary samples for blood lactate concentration ([La]b) were collected from the finger using a Lactate Pro 2 analyzer (Arkray Factory Inc., Otsu, Japan) within the first 30 s after each step. For the last step, blood lactate was measured until reaching a maximal blood lactate concentration ([La]max). Heart rate was monitored using a Garmin Swim Belt (Garmin, Olathe, KS, USA).
For each swimmer, the velocity–lactate curve was fitted using a third-degree polynomial regression curve [25] based on the shape of the blood lactate data [13]. An Excel file specifically created for these calculations was used. We aimed to select methods from the literature and those that are easily reproducible by practitioners. First, the speed at a fixed ([La]b) of 4 mmol/L (V4mmol/L) was determined by linear interpolation of the lactate concentration–velocity curve [9,11,26]. This procedure was then repeated for the speed at the blood lactate concentration of 2 mmol/L (V2mmol/L). Another variable was derived using the method adapted from Cheng et al. [25]. The two extremes of the curve were connected by a straight line. After, the point of maximal deviation (Dmax) between this straight line and the lactate curve was calculated. The velocity corresponding to the Dmax point was defined as VDmax. The first LT (LT1) was identified as the velocity at which the increase in lactate at the next step exceeds 0.3 mmol (VLT1) [15,27]. The LT1 value corresponds to the blood lactate concentration observed at this point. The second LT (VLT2) was estimated using the modified Dmax method [15,27,28], which identifies the point on the lactate curve with the greatest perpendicular distance from the previously described linear relationship (LT2). The velocity at the second lactate threshold (VLT2) corresponds to this point (LT2). The velocity of the final 200 m was considered as the maximal aerobic speed (MAS). Figure 1 illustrates the physiological variables derived from the lactate measurements.
At the end of the incremental test, a breath-by-breath gas analysis was performed immediately after the last step. As soon as the swimmer’s head emerged from the water, a mask was placed on the swimmer for 30 s. The first 20 s was used to determine V̇O2max. A K4b2 analyzer connected to a face mask (Hans Rudolph, Shawnee, KS, USA) and backward extrapolation were employed to collect and process the data [29]. The technique described by Chaverri et al. was used to estimate VO2max, using the heart rate at the end of the 20 s recovery period and the heart rate at the end of the exercise [15]. This approach provided predicted VO2 values using the following equation: pVO2(t) = VO2(t) HRend-exercise/HR(t) [15], where pVO2(t) is the predicted post-exercise VO2 at time t, VO2(t) is the 1 s interpolated post-exercise VO2 at time t, HR(t) is the 1 s interpolated post-exercise HR at time t, and HRend-exercise is the highest HR recorded during the last 10 s of exercise.
Critical velocity (CV) was calculated from the slope of the linear regression between swimming distance and time [19]. The critical velocity was also calculated using combinations of two, three, and four time distances based on the corresponding linear relationships following the same procedure: CV200/400 = CV from 200 and 400 m events, CV400/800 = CV from 400 and 800 m events, CV800/1500 = CV from 800 and 1500 m events, CV200/800 = CV from 200 and 800 m events, CV200/1500 = CV from 200 and 1500 events, CV200/400/800 = CV from 200, 400, and 800 m events, CV400/800/1500 = CV from 400, 800, and 1500 m events, and CV200/400/800/1500 = CV from 200, 400, 800, and 1500 m events.
A 10 km time trial was performed the day after the incremental test using the same warm-up procedure. It consisted of 5 steps: 500 m, 3000 m, 3500 m, 1500 m, and 1500 m, with a 1 min break in between. These stages were chosen to replicate as closely as possible the performance model of a 10 km open-water race. This model was developed by the French Swimming Federation using data from international races (https://www.omegatiming.com/, access on 1 August 2015 for the first time). The first 500 m of an international open-water race is typically characterized by a fast start, generally between 01:06 and 01:08 per 100 m. The next 3000 m are swam at a pace slightly below the first threshold (around 01:10 per 100 m), followed by 3500 m swam at a slightly faster pace (around 01:09). The subsequent 1500 m is performed at an even faster pace (around 01:07), with a final maximal effort over the last 1500 m (around 01:04). Each swimmer was instructed to complete the time trial according to their individual performance model.
Additionally, the swimming course performance results for each swimmer were collected for the 200, 400, 800, and 1500 m freestyle events. Personal best (PB) and seasonal best (SB) performances (converted into speed in m/s) were recorded for each swimmer. The SB times were taken from official competitions held during the season in which the swimmer performed the incremental test. Thus, there were 8 pool performances: SB200, SB400, SB800, SB1500, PB200, PB400, PB800, and PB1500 for the 200, 400, 800, and 1500 m events (season and personal best times). All data were collected from the French Swimming Federation website.

2.4. Statistics

Quantitative variables are presented as mean ± standard deviation. The normality of distribution was tested using the Kolmogorov–Smirnov test. Pearson’s product–moment correlations were used to examine the relationships between the physiological measurement variables observed during the incremental test (VO2peak, Lamax, HRmax, MAS, LT1, LT2, Dmax, V2mmol/L, V4mmol/L, VLT1, VLT2, and VDmax) and the combinations of critical velocity (CV200/400, CV400/800, CV800/1500, CV200/800, CV200/1500, CV200/400/800, CV400/800/1500, and CV200/400/800/1500) and performance times (SB200, SB400, SB800, SB1500, PB200, PB400, PB800, and PB1500). Correlation threshold values were set to 0.3, 0.5, 0.7, and 0.9 corresponding to small, moderate, strong, and very strong correlations, respectively. The level of significance was set at a p-value < 0.05. Only correlations with a p-value < 0.05 are reported in the Results section. All statistical analyses were performed using the Rstudio software package, version 4.2.2 (PBC, Boston, MA, USA).

3. Results

3.1. Performance

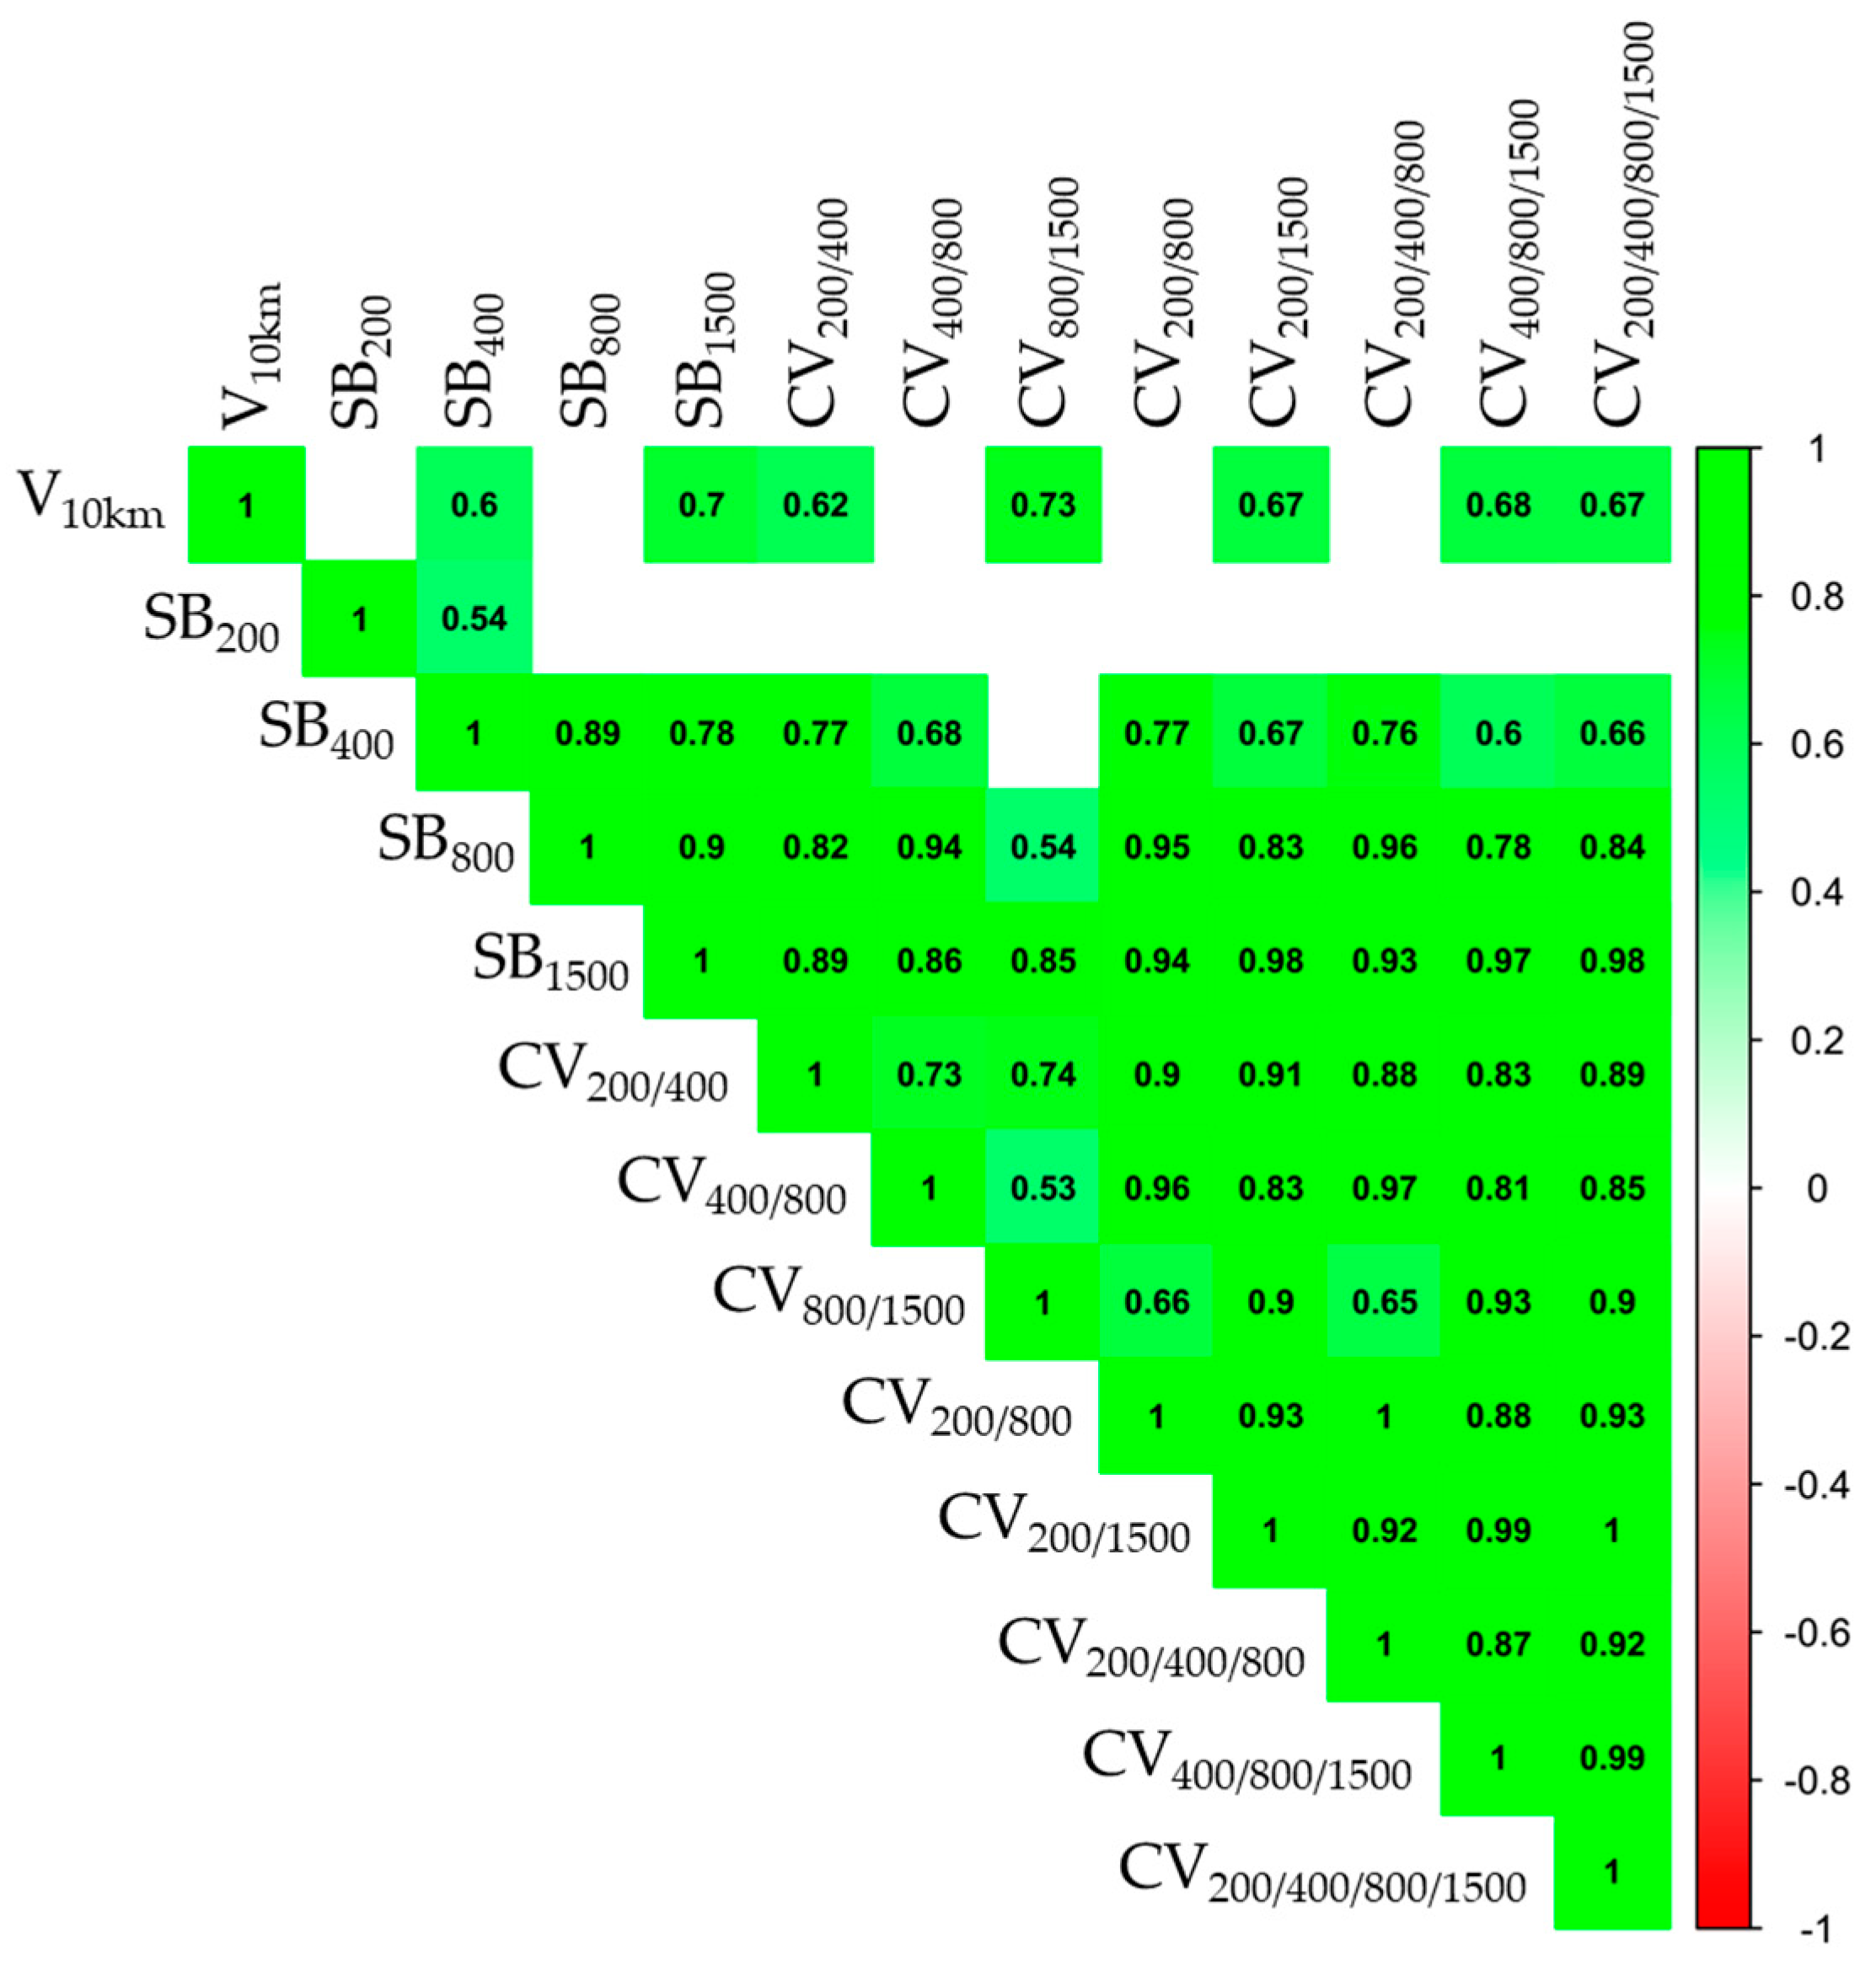
The average velocity for the 10 km pool trial was 1.46 ± 0.03 m/s, corresponding to a 100 m pace of 1:08:00. This 10 km velocity was equivalent to 86.0 ± 2.4% of the MAS. A strong correlation was also observed between SB1500 and the 10 km performance (r = 0.70). Table 1 provides data on the physiological variables collected during the incremental test, performance times (200, 400, 800, and 1500 m), and critical velocities derived from the performance times.

3.2. Relationships between Physiological Capacities and Performance

The relationships between physiological measurements and performance are presented in Figure 2, showing the r correlations. The main predictors for 10 km performance were VLT1 and V2mmol/L, with r = 0.73 and 0.67, respectively (p < 0.01). No other physiological variable was significantly associated with 10 km performance. For pool events, moderate to strong relationships were observed for the 400 m and 800 m events with V2mmol/L, V4mmol/L, VDmax, and VLT1 (p < 0.05). For the 1500 m event, moderate to strong correlations were observed with V2mmol/L, V4mmol/L, and VLT1 (p < 0.05). For the 200 m event, only the MAS showed a positive correlation (r = 0.76, p < 0.001). Across all events, no correlation was found with LT1, LT2, and VLT2.

3.3. Relationships between Critical Velocity and Performance

The relationships between critical velocity and performance are presented in Figure 3. For the 800 and 1500 m events, all CV measurements showed moderate to very strong correlations with performance (p < 0.001). For the 400 m event, moderate to strong correlations were observed (p < 0.01), except for CV800/1500 (p = 0.11). No significant correlation was observed for the 200 m event. For the 10 km time trial, correlations were moderate to strong when the 1500 m event was included in the formula (CV800/1500, CV200/1500, CV400/800/1500, and CV200/400/800/1500 with p < 0.01). A positive moderate correlation was also observed with CV200/400 (p < 0.05).

3.4. Relationships between Critical Velocity and Threshold Measurements

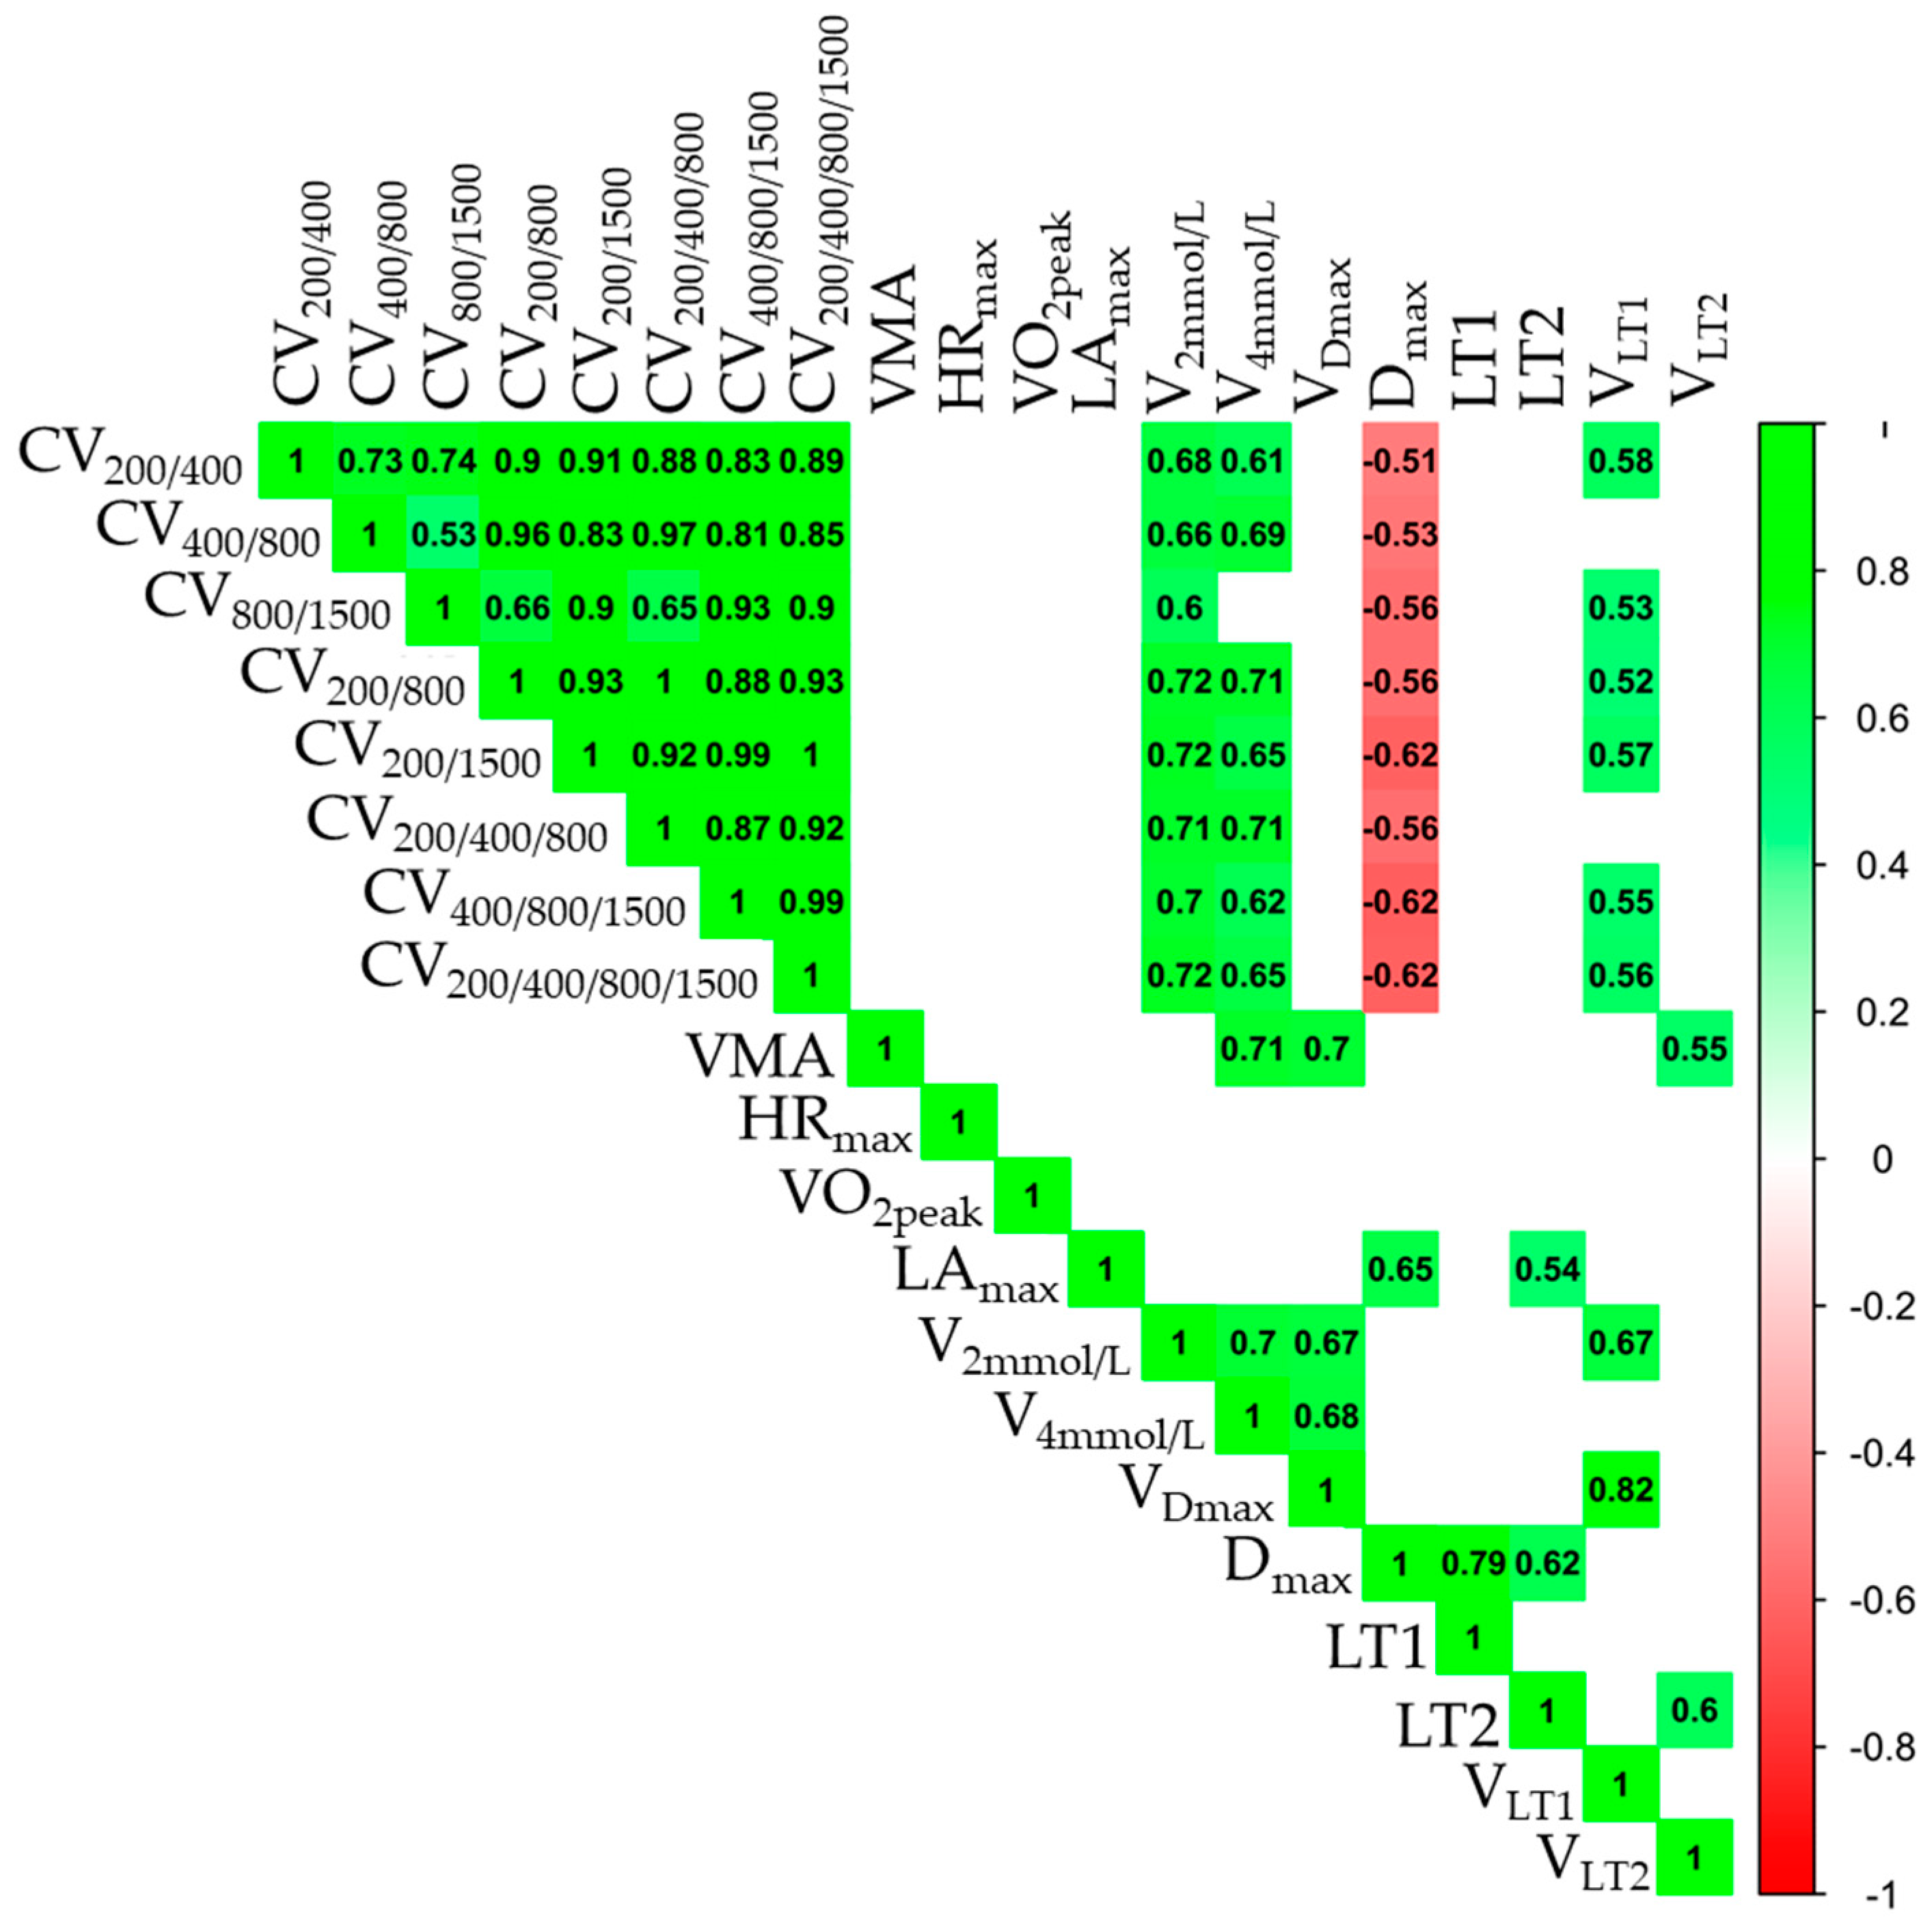
The relationships between critical velocity and lactate threshold measurements are presented in Figure 4. All CV measurements were moderately to strongly correlated with V2mmol/L (p < 0.01 for all CV measures, except for CV800/1500 with a p < 0.05). A similar trend was observed for V4mmol/L, with moderate to strong correlations across all CV measurements (p < 0.01), except for CV800/1500 (p = 0.09). For all CV measurements, a moderate negative correlation was observed with Dmax (p < 0.05). Moderate positive correlations were observed between VLT1 and CV200/400, CV800/1500, CV200/800, CV200/1500, CV400/800/1500, and CV200/400/800/1500 (p < 0.05).

4. Discussion

This study examined the relationships between various physiological measurements and long-distance swimming performance in elite open-water swimmers. Our results demonstrate the very high speed corresponding to 2 mmol/L and 4 mmol/L in these swimmers. For the 10 km pool trial, positive relationships were observed with VLT1 and V2mmol/L, highlighting the importance of aerobic capacity for this event. For pool events, other variables such as V4mmol/L and VDmax were also correlated with performance. It appears that critical velocity could be a useful tool to assess swimming endurance performance without the need for any physiological equipment, given the very high correlation between CV and LT measurements. For open-water swimmers, CV including the 1500 m event seems to be the most appropriate method.
Our results show that for the 400, 800, and 1500 m events, aerobic and anaerobic indices appear to have similar associations with performance. This study reinforces previous research that demonstrated a positive relationship between threshold speed and performance. Pyne et al. [10] have reported a positive correlation for performance in the 200 m event (r = 0.75), and Altimari et al. [30] found a positive correlation for performance for the 400 m event (r = 0.90). Similarly, Olbrecht et al. [8] demonstrated an almost perfect relationship between V4mmol/L and 30 min performance. This study shows that V2mmol/L and V4mmol/L are major determinants of performance in swimming distance events. In our study, V4mmol/L was closely associated with 800 m performance, while V2mmol/L was associated with 1500 m performance, which may explain the strong relationships between these variables. As V2mmol/L and V4mmol/L are similar, both could be used to assess swimming endurance performance. For longer distance events, such as 10 km, V2mmol/L seems more appropriate, as most of the race is likely performed at this pace. With a high V2mmol/L, open-water swimmers could conserve energy more efficiently.
However, our results show that 10 km pool trial performance in world-class swimmers is only associated with key indicators of aerobic metabolism. It is important to note that theV2mmol/L and VLT1 values observed in these swimmers are much higher than those previously reported in the literature for open-water swimmers [31]. As noted by Ieno et al., the 10 km open-water speed is slightly below V2mmol/L, which reinforces the importance of training at this intensity [7]. These results highlight the necessity of training at high volumes with low intensity to enhance fat oxidation [32] and facilitate oxygen diffusion to the mitochondria [33]. Consequently, it is likely that the best open-water swimmers can reduce energy expenditure and save energy for the end spurt at the final stage of the race [4,32]. Studies on the best endurance athletes support this hypothesis, showing that a significant portion of their training is performed below the first LT [34], although limited data are currently available for open-water swimming [2].
The correlations between the different methods of lactate measurement show that using speeds corresponding to fixed lactate values of 2 and 4 mmol/L appears to be the method most associated with performance. Indeed, our results indicate that the absolute lactate values do not seem to correlate with performance. Various methods exist for estimating the LT in incremental tests, but to the best of our knowledge, no author has compared these methods in world-class swimmers. Nikititakis et al. suggested that the Dmax method was most appropriate for young swimmers [35]. They also stated that the x-axis projection of the intersection of the lines connecting the upper and lower points of the speed vs. lactate curve (a method not tested in our study) was the best method for adolescents [35]. However, they did not test with the fixed-value blood lactate method. From a practical perspective, the use of fixed lactate values seems appropriate and highly useful for coaches and support staff. It is also important to note that Pyne et al. observed variations in blood lactate concentration at the LT in world-ranked swimmers, but these were not associated with changes in performance [10]. This highlights that swimming performance is also influenced by other factors such as psychology, technique, and pacing strategy.
Our study also revealed moderate to strong relationships between CV and performance in the 400, 800, 1500, and 10,000 m events. Wakayoshi et al. [36] found a stronger correlation between V400 and CV (r = 0.865) than what we observed. In our study, the correlation between CV200/400/800/1500 and SB400 was r = 0.66. The CVs that appear to be the best predictors of performance are those that include three or more events in their formula (200, 400, 800, and 1500 m). Dekerle et al. have also supported the idea that CV is more reliable when derived from three or four measurements. [37]. For the 10 km time trial, given the correlation between the 10,000 m and 1500 m events, the highest associations were found when the CV included 1500 m performance times. This aligns with the fact that the best open-water swimmers in the world are also among the top performers in 1500 m pool events [3].
All CV measurements were moderately correlated with V2mmol/L and V4mmol/L, with a slight tendency to be more correlated with V2mmol/L. Wakayoshi et al. [36] observed similar results, showing that V4mmol/L was strongly correlated with CV (r = 0.91). Toubekis et al. also reported r > 0.9 between LT and CV, as well as between V4mmol/L and CV [22]. However, Dekerle al. highlighted that CV is correlated with MLSS but tends to present higher values [38]. In our study, CV appears to fall between V2mmol/L and V4mmol/L. Additionally, moderate correlations were observed between CV, Dmax, and VLT1 in our study. As Dmax is located between LT1 and LT2, and CV is located between VLT1 and VLT2, we can hypothesize that Dmax may reflect the intensity of CV. Unfortunately, no studies investigated these relationships in swimmers. However, Valenzuela et al. found similar results in recreational cyclists, highlighting strong correlations between critical power and Dmax [39]. It is important to note that while CV is correlated with performance, individual variations in CV do not appear to be associated with changes in performance [23].
This study has some limitations. First, it was conducted with only 15 swimmers, who may have exhibited varying levels of physiological condition. From a methodological standpoint, the protocol may have been influenced by several factors that could affect the results, such as the timing within the season, recovery duration, measurement equipment, etc. Finally, while this study describes the characteristics of open-water swimmers, it does not assess performances in official open-water competitions. It would be worthwhile to extend this research to a larger population in natural environments under open-water conditions.

5. Conclusions

This study demonstrates that the use of an incremental test allows for the measurement of changes in aerobic indices and their link to performance in the 400, 800, 1500, and even 10 km events. Fixed blood lactate values of 2 and 4 mmol/L appear to be the method most closely associated with swimming performance. From a practical perspective, V2mmol/L and V4mmol/L are excellent options for monitoring swimming training and evaluating changes in long-distance swimming performance. For the 10 km event, V2mmol/L was the index most strongly correlated with performance. Further performance estimation is possible using the concept of critical velocity by combining the speed of the 200 m personal best and the speed(s) of the 400, 800, and 1500 m personal records.

Author Contributions

Conceptualization, R.P.; methodology and data curation, R.P. and A.A.; writing—original draft preparation, R.P.; writing—review and editing, R.P. and Y.R.; visualization, R.P. and X.B.; supervision, R.P. All authors have read and agreed to the published version of the manuscript.

Funding

This research received no external funding.

Institutional Review Board Statement

This study was conducted in accordance with the Declaration of Helsinki and approved by the local Ethics Committee of the French Swimming Federation (protocol code 22rec07, date of approval: 1 April 2017).

Informed Consent Statement

Informed consent was obtained from all subjects involved in the study.

Data Availability Statement

Data can be shared on request.

Acknowledgments

The authors want to thank the swimmers for their participation in the study and their consent to share these data. The authors also thank the support staff of the French swimming team for their help in data collection.

Conflicts of Interest

The authors declare no conflicts of interest.

References

  1. Jones, A.M.; Carter, H. The effect of endurance training on parameters of aerobic fitness. Sports Med. 2000, 29, 373–386. [Google Scholar] [CrossRef] [PubMed]
  2. Baldassarre, R.; Bonifazi, M.; Zamparo, P.; Piacentini, M.F. Characteristics and Challenges of Open-Water Swimming Performance: A Review. Int. J. Sports Physiol. Perform. 2017, 12, 1275–1284. [Google Scholar] [CrossRef]
  3. Baldassarre, R.; Pennacchi, M.; La Torre, A.; Bonifazi, M.; Piacentini, M.F. Do the Fastest Open-Water Swimmers have A Higher Speed in Middle- and Long-Distance Pool Swimming Events? J. Funct. Morphol. Kinesiol. 2019, 4, 15. [Google Scholar] [CrossRef] [PubMed]
  4. Veiga, S.; Rodriguez, L.; González-Frutos, P.; Navandar, A. Race Strategies of Open Water Swimmers in the 5-km, 10-km, and 25-km Races of the 2017 FINA World Swimming Championships. Front. Psychol. 2019, 10, 654. [Google Scholar] [CrossRef] [PubMed]
  5. Zacca, R.; Neves, V.; da Silva Oliveira, T.; Soares, S.; Rama, L.M.P.L.; de Souza Castro, F.A.; Vilas-Boas, J.P.; Pyne, D.B.; Fernandes, R.J. 5 km front crawl in pool and open water swimming: Breath-by-breath energy expenditure and kinematic analysis. Eur. J. Appl. Physiol. 2020, 120, 2005–2018. [Google Scholar] [CrossRef]
  6. López-Belmonte, Ó.; Gay, A.; Ruiz-Navarro, J.J.; Cuenca-Fernández, F.; Cejuela, R.; Arellano, R. Open Water Swimming in Elite Triathletes: Physiological and Biomechanical Determinants. Int. J. Sports Med. 2024, 45, 598–607. [Google Scholar] [CrossRef]
  7. Ieno, C.; Baldassarre, R.; Quagliarotti, C.; Bonifazi, M.; Piacentini, M.F. Session RPE Breakpoints Corresponding to Intensity Thresholds in Elite Open Water Swimmers. J. Funct. Morphol. Kinesiol. 2020, 5, 21. [Google Scholar] [CrossRef]
  8. Olbrecht, J.; Madsen, O.; Mader, A.; Liesen, H.; Hollmann, W. Relationship between swimming velocity and lactic concentration during continuous and intermittent training exercises. Int. J. Sports Med. 1985, 6, 74–77. [Google Scholar] [CrossRef]
  9. Fernandes, R.J.; Sousa, M.; Pinheiro, A.; Vilar, S.; Colaço, P.; Vilas-Boas, J.P. Assessment of individual anaerobic threshold and stroking parameters in swimmers aged 10–11 years. Eur. J. Sport. Sci. 2010, 10, 311–317. [Google Scholar] [CrossRef]
  10. Pyne, D.B.; Lee, H.; Swanwick, K.M. Monitoring the lactate threshold in world-ranked swimmers. Med. Sci. Sports Exerc. 2001, 33, 291–297. [Google Scholar] [CrossRef]
  11. Anderson, M.E.; Hopkins, W.G.; Roberts, A.D.; Pyne, D.B. Monitoring seasonal and long-term changes in test performance in elite swimmers. Eur. J. Sport. Sci. 2006, 6, 145–154. [Google Scholar] [CrossRef]
  12. Pla, R.; Aubry, A.; Resseguier, N.; Merino, M.; Toussaint, J.-F.; Hellard, P. Training Organization, Physiological Profile and Heart Rate Variability Changes in an Open-water World Champion. Int. J. Sports Med. 2019, 40, 519–527. [Google Scholar] [CrossRef]
  13. Faude, O.; Kindermann, W.; Meyer, T. Lactate Threshold Concepts. Sports Med. 2009, 39, 469–490. [Google Scholar] [CrossRef] [PubMed]
  14. Wasserman, K. The anaerobic threshold: Definition, physiological significance and identification. Adv. Cardiol. 1986, 35, 1–23. [Google Scholar]
  15. Chaverri, D.; Schuller, T.; Iglesias, X.; Hoffmann, U.; Rodríguez, F.A. A New Model for Estimating Peak Oxygen Uptake Based on Postexercise Measurements in Swimming. Int. J. Sports Physiol. Perform. 2016, 11, 419–424. [Google Scholar] [CrossRef] [PubMed]
  16. Maglischo, E.W.; Maglischo, C.W.; Bishop, R.A. Lactate testing for training pace. Swim. Tech. 1982, 19, 31–37. [Google Scholar]
  17. Espada, M.C.; Alves, F.B.; Curto, D.; Ferreira, C.C.; Santos, F.J.; Pessôa-Filho, D.M.; Reis, J.F. Can an Incremental Step Test Be Used for Maximal Lactate Steady State Determination in Swimming? Clues for Practice. Int. J. Environ. Res. Public Health 2021, 18, 477. [Google Scholar] [CrossRef]
  18. Fernandes, R.J.; Sousa, M.; Machado, L.; Vilas-Boas, J.P. Step length and individual anaerobic threshold assessment in swimming. Int. J. Sports Med. 2011, 32, 940–946. [Google Scholar] [CrossRef]
  19. Anderson, M.; Hopkins, W.; Roberts, A.; Pyne, D. Ability of test measures to predict competitive performance in elite swimmers. J. Sports Sci. 2008, 26, 123–130. [Google Scholar] [CrossRef]
  20. di Prampero, P.E.; Dekerle, J.; Capelli, C.; Zamparo, P. The critical velocity in swimming. Eur. J. Appl. Physiol. 2008, 102, 165–171. [Google Scholar] [CrossRef]
  21. Toubekis, A.G.; Tokmakidis, S.P. Metabolic responses at various intensities relative to critical swimming velocity. J. Strength. Cond. Res. 2013, 27, 1731–1741. [Google Scholar] [CrossRef] [PubMed]
  22. Wakayoshi, K.; Ikuta, K.; Yoshida, T.; Udo, M.; Moritani, T.; Mutoh, Y.; Miyashita, M. Determination and validity of critical velocity as an index of swimming performance in the competitive swimmer. Eur. J. Appl. Physiol. 1992, 64, 153–157. [Google Scholar] [CrossRef]
  23. Toubekis, A.G.; Tsami, A.P.; Tokmakidis, S.P. Critical velocity and lactate threshold in young swimmers. Int. J. Sports Med. 2006, 27, 117–123. [Google Scholar] [CrossRef] [PubMed]
  24. Mujika, I.; Chatard, J.-C.; Busso, T.; Geyssant, A.; Barale, F.; Lacoste, L. Effects of Effects of training on performance in competitive swimming. Can. J. Appl. Physiol. 1995, 20, 395–406. [Google Scholar] [CrossRef] [PubMed]
  25. Cheng, B.; Kuipers, H.; Snyder, A.C.; Keizer, H.A.; Jeukendrup, A.; Hesselink, M. A new approach for the determination of ventilatory and lactate thresholds. Int. J. Sports Med. 1992, 13, 518–522. [Google Scholar] [CrossRef]
  26. Mader, A.; Heck, H.; Hollman, W. Evaluation of lactic acid anaerobic energy contribution by determination of postex-ercise lactic acid concentration of ear capillary blood in middle-distance runners and swimmers. In The International Congress of Physical Acitivity Sciences 1976; Landry., F., Orban, W.A.R., Eds.; Exercise Physiology, Symposia Specialists Incorporated: Miami, FL, USA, 1978; pp. 187–200. [Google Scholar]
  27. Bourdon, P. Blood lactate transition thresholds: Concepts and controversies. In Physiological Tests for Elite Athletes; Gore, C.J., Ed.; Human Kinetics: Champaign, IL, USA, 2000; pp. 55–65. [Google Scholar]
  28. Bishop, D.; Jenkins, D.G.; Mackinnon, L.T. The relationship between plasma lactate parameters, Wpeak and 1-h cycling performance in women. Med. Sci. Sports Exerc. 1998, 30, 1270–1275. [Google Scholar] [CrossRef]
  29. Pla, R.; Le Meur, Y.; Aubry, A.; Toussaint, J.-F.; Hellard, P. Effects of a 6-Week Period of Polarized or Threshold Training on Performance and Fatigue in Elite Swimmers. Int. J. Sports Physiol. Perform. 2019, 14, 183–189. [Google Scholar] [CrossRef]
  30. Altimari, J.M.; Altimari, L.R.; Gulak, A.; Traina Chacon-Mikahil, M.P. Correlações entre protocolos de determinação do limiar anaeróbio e o desempenho aeróbio em nadadores adolescentes. Rev. Bras. Med. Esporte 2007, 13, 245–250. [Google Scholar] [CrossRef]
  31. VanHeest, J.L.; Mahoney, C.E.; Herr, L. Characteristics of elite open-water swimmers. J. Strength. Cond. Res. 2004, 18, 302–305. [Google Scholar] [CrossRef]
  32. Purdom, T.; Kravitz, L.; Dokladny, K.; Mermier, C. Understanding the factors that effect maximal fat oxidation. J. Int. Soc. Sports Nutr. 2018, 15, 3. [Google Scholar] [CrossRef]
  33. Stefanetti, R.J.; Lamon, S.; Wallace, M.; Vendelbo, M.H.; Russell, A.P.; Vissing, K. Regulation of ubiquitin proteasome pathway molecular markers in response to endurance and resistance exercise and training. Pflug. Arch. Eur. J. Physiol. 2015, 467, 1523–1537. [Google Scholar] [CrossRef] [PubMed]
  34. Seiler, S. What is best practice for training intensity and duration distribution in endurance athletes? Int. J. Sports Physiol. Perform. 2010, 5, 276–291. [Google Scholar] [CrossRef] [PubMed]
  35. Nikitakis, I.S.; Toubekis, A.G. Lactate Threshold Evaluation in Swimmers: The Importance of Age and Method. Int. J. Sports Med. 2021, 42, 818–824. [Google Scholar] [CrossRef] [PubMed]
  36. Wakayoshi, K.; Yoshida, T.; Udo, M.; Harada, T.; Moritani, T.; Mutoh, Y.; Miyashita, M. Does critical swimming velocity represent exercise intensity at maximal lactate steady state? Eur. J. Appl. Physiol. 1993, 66, 90–95. [Google Scholar] [CrossRef] [PubMed]
  37. Dekerle, J. The use of critical velocity in swimming: A place for critical stroke rate? Port. J. Sport. Sciences. Biomech. Med. Swim. X 2006, 6, 201–205. Available online: http://www.fcdef.up.pt/rpcd/_arquivo/artigos_soltos/vol.6_supl.2/04.evaluation.pdf (accessed on 1 July 2020).
  38. Dekerle, J.; Pelayo, P.; Clipet, B.; Depretz, S.; Lefevre, T.; Sidney, M. Critical swimming speed does not represent the speed at maximal lactate steady state. Int. J. Sports Med. 2005, 26, 524–530. [Google Scholar] [CrossRef]
  39. Valenzuela, P.L.; Alejo, L.B.; Montalvo-Pérez, A.; Gil-Cabrera, J.; Talavera, E.; Lucia, A.; Barranco-Gil, D. Relationship Between Critical Power and Different Lactate Threshold Markers in Recreational Cyclists. Front. Physiol. 2021, 12, 676484. [Google Scholar] [CrossRef]
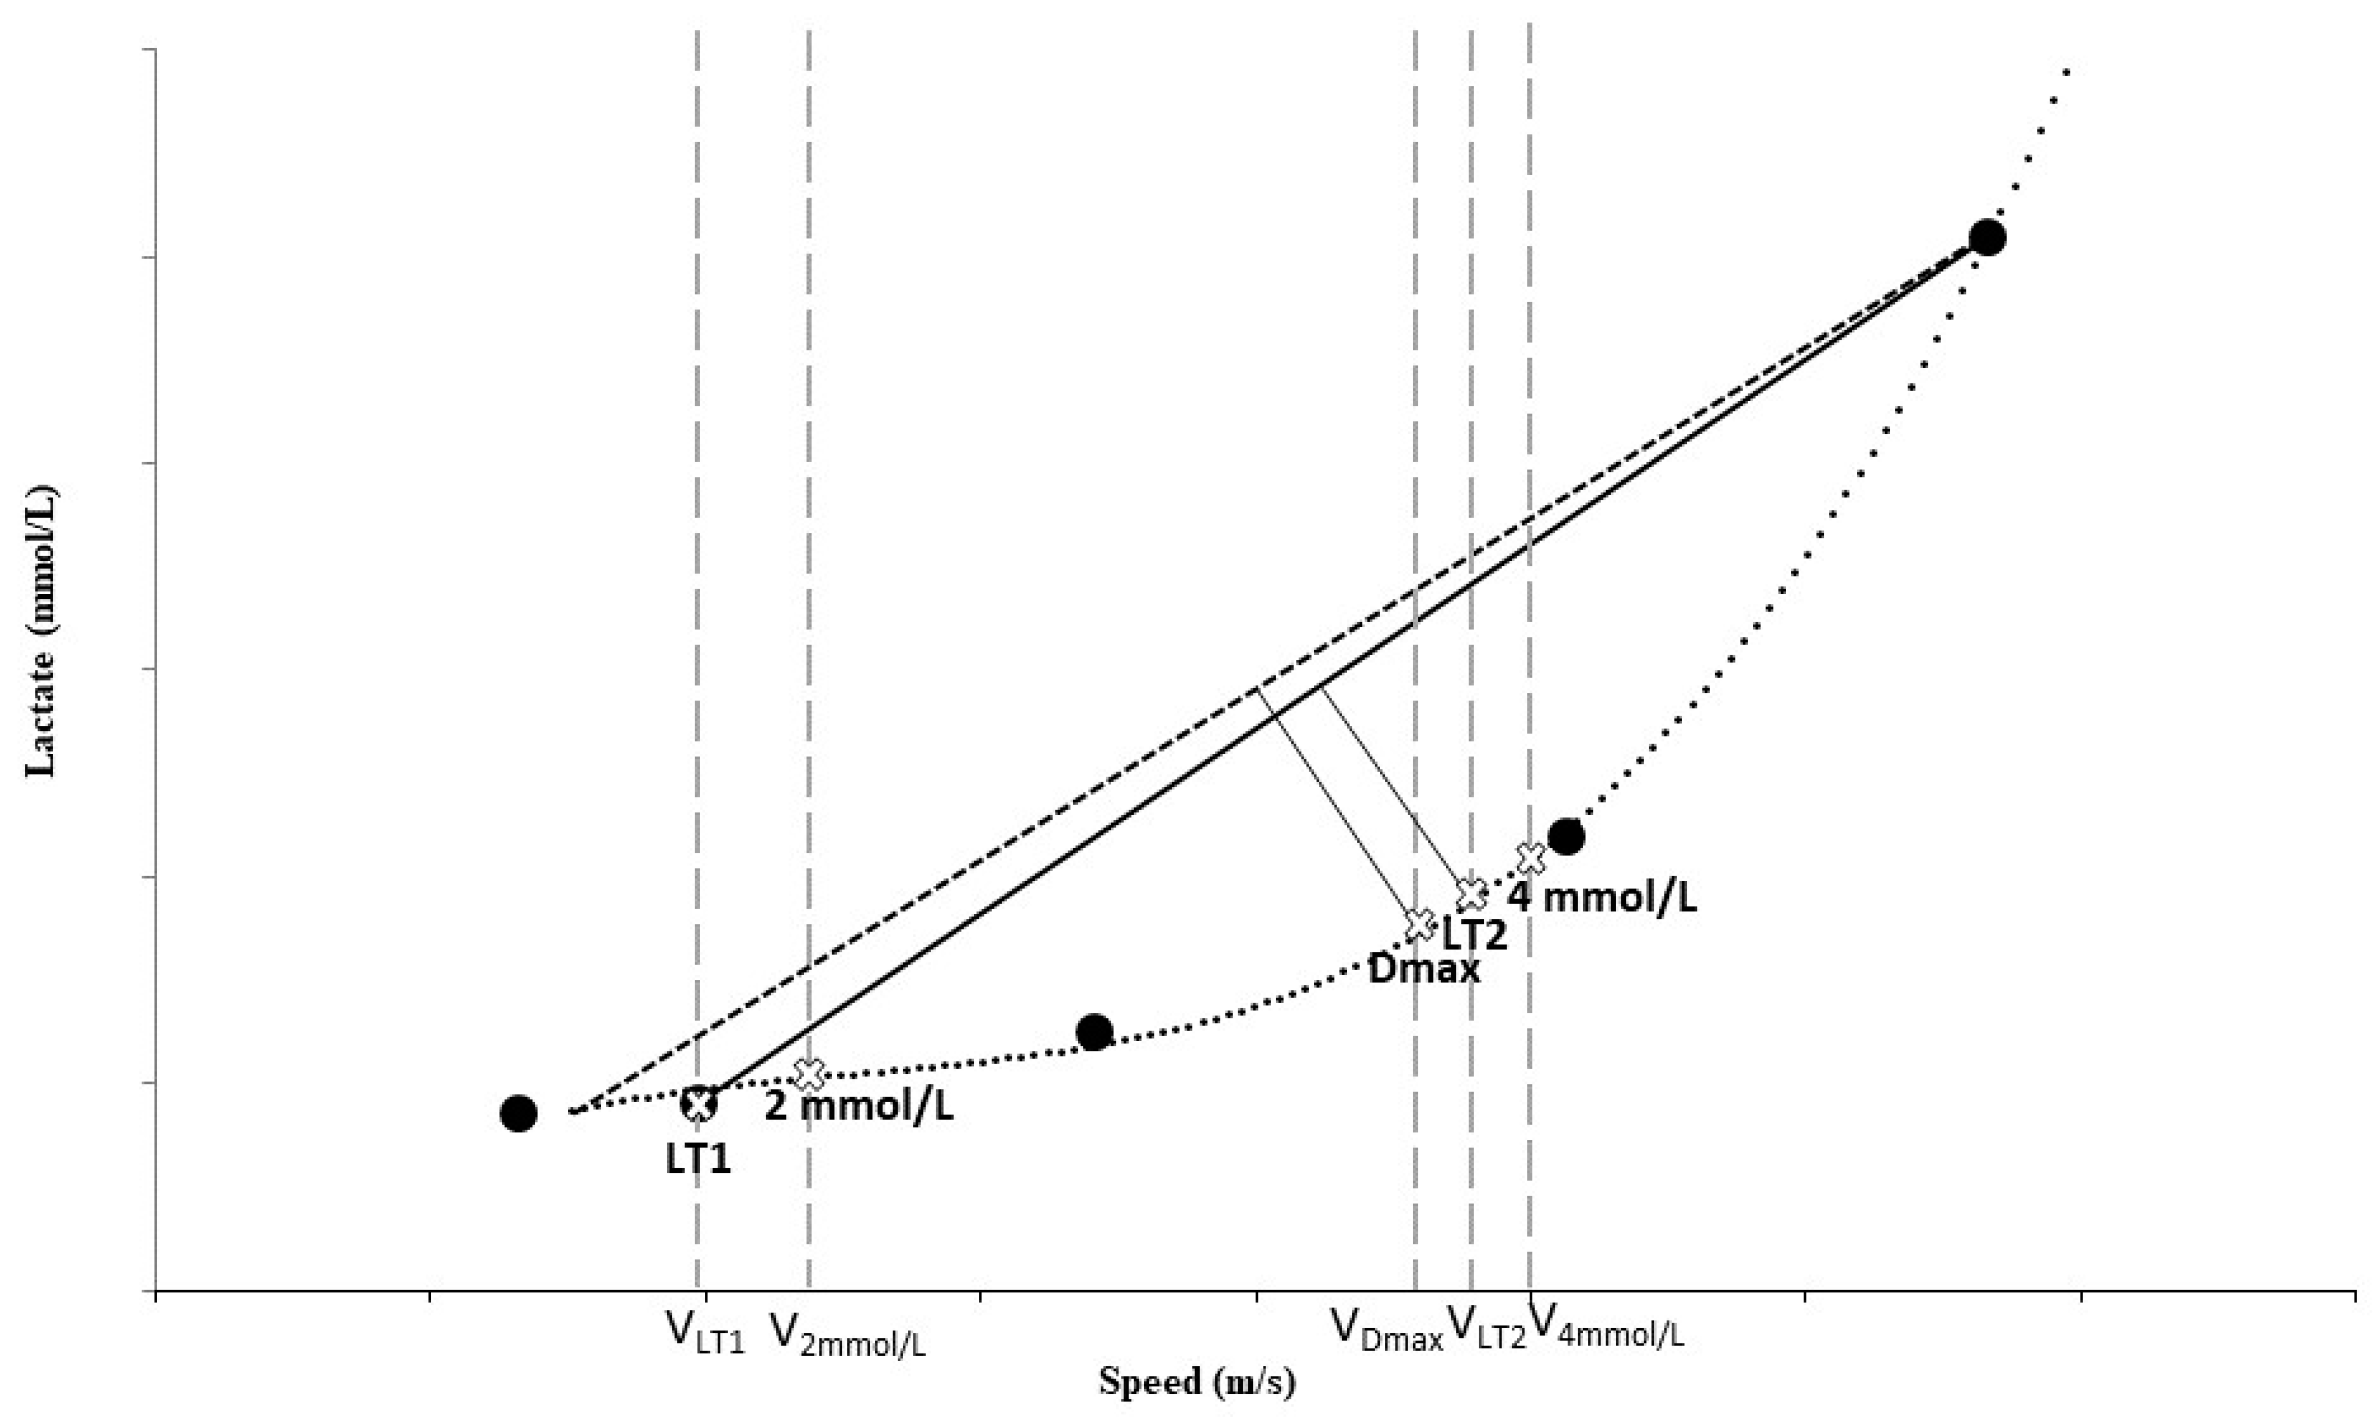
Figure 1. Physiological variables from different mathematical methods based on the literature. LT1 = blood lactate value for first lactate threshold, LT2 = blood lactate value for second lactate threshold, Dmax = blood lactate value for Dmax method, V2mmol/L = speed corresponding to 2 mmol/L, V4mmol/L = speed corresponding to 4 mmol/L, VLT1 = speed corresponding to first lactate threshold, VLT2 = speed corresponding to second lactate threshold, and VDmax = speed corresponding to Dmax point.
Physiologia 04 00018 g001
Figure 2. Correlation matrix with Pearson’s product moment correlation between physiological capacities and performances. The r values are presented only when p-values were <0.05. Green color indicates positive correlations, while red color indicates negative correlations. V10km = speed corresponding to the average velocity during the 10 km pool time trial, SB200 = season best time for 200 m freestyle, SB400 = season best time for 400 m freestyle, SB800 = season best time for 800 m freestyle, SB1500 = season best time for 1500 m freestyle, VO2max = maximal oxygen consumption, Lapeak = peak blood lactate concentration at the end of the incremental test, HRmax = maximal heart rate, MAS = maximal aerobic speed, LT1 = blood lactate value for first lactate threshold, LT2 = blood lactate value for second lactate threshold, Dmax = blood lactate value for Dmax method, V2mmol/L = speed corresponding to 2 mmol/L, V4mmol/L = speed corresponding to 4 mmol/L, VLT1 = speed corresponding to first lactate threshold, VLT2 = speed corresponding to second lactate threshold, and VDmax = speed corresponding to Dmax point.
Physiologia 04 00018 g002
Figure 3. Correlation matrix with Pearson’s product moment correlation between critical velocities and performances. The r values are presented only when p-values were <0.05. Green color indicates positive correlations, while red color indicates negative correlations. V10km = speed corresponding to the average velocity during the 10 km pool time trial, SB200 = season best time for 200 m freestyle, SB400 = season best time for 400 m freestyle, SB800 = season best time for 800 m freestyle, SB1500 = season best time for 1500 m freestyle, CV200/400 = CV from 200 and 400 m events, CV400/800 = CV from 400 and 800 m events, CV800/1500 = CV from 800 and 1500 m events, CV200/800 = CV from 200 and 800 m events, CV200/1500 = CV from 200 and 1500 events, CV200/400/800 = CV from 200, 400, and 800 m events, CV400/800/1500 = CV from 400, 800, and 1500 m events, and CV200/400/800/1500 = CV from 200, 400, 800, and 1500 m events.
Physiologia 04 00018 g003
Figure 4. Correlation matrix with Pearson’s product moment correlation between physiological capacities and critical velocities. The r values are presented only when p-values were <0.05. Green color indicates positive correlations, while red color indicates negative correlations. CV200/400 = CV from 200 and 400 m events, CV400/800 = CV from 400 and 800 m events, CV800/1500 = CV from 800 and 1500 m events, CV200/800 = CV from 200 and 800 m events, CV200/1500 = CV from 200 and 1500 events, CV200/400/800 = CV from 200, 400, and 800 m events, CV400/800/1500 = CV from 400, 800, and 1500 m events, CV200/400/800/1500 = CV from 200, 400, 800, and 1500 m events, VO2max = maximal oxygen consumption, Lapeak = peak blood lactate concentration at the end of the incremental test, HRmax = maximal heart rate, MAS = maximal aerobic speed, LT1 = blood lactate value for first lactate threshold, LT2 = blood lactate value for second lactate threshold, Dmax = blood lactate value for Dmax method, V2mmol/L = speed corresponding to 2 mmol/L, V4mmol/L = speed corresponding to 4 mmol/L, VLT1 = speed corresponding to first lactate threshold, VLT2 = speed corresponding to second lactate threshold, and VDmax = speed corresponding to Dmax point.
Physiologia 04 00018 g004
Table 1. Mean ± SD for performances during official swimming competition, physiological measures during the incremental test, and critical velocities from performance times.
Performances Times (s)
SB200SB400SB800SB1500PB200PB400PB800PB1500
n = 151:56:78 ± 00:02:8604:00:74 ± 00:04:4708:15:81 ± 00:09:3115:47:99 ± 00:14:7701:55:86 ± 00:02:9903:59:20 ± 00:05:0408:13:35 ± 00:10:3315:41:76 ± 00:20:28
Performances Times (m/s)
SB200SB400SB800SB1500PB200PB400PB800PB1500
1.71 ± 0.041.66 ± 0.031.61 ± 0.031.58 ± 0.021.73 ± 0.041.67 ± 0.031.62 ± 0.031.59 ± 0.03
Physiological Variables
VO2peak
(mL/min/kg)
Lapeak
(mmol/L)
HRmax
(bpm)
MAS
(m/s)
LT1
(mmol/L)
LT2
(mmol/L)
Dmax
(mmol/L)
n = 1570.8 ± 7.69.1 ± 2.4190 ± 91.70 ± 0.042.0 ± 0.63.5 ± 1.02.7 ± 0.8
Physiological Variables (Lactate Measurements in m/s)
V2mmol/LV4mmol/LVLT1VLT2VDmax
n = 151.54 ± 0.041.62 ± 0.041.52 ± 0.051.59 ± 0.051.57 ± 0.03
Critical Velocities (m/s)
CV200/400CV400/800CV800/1500CV200/800CV200/1500CV200/400/800CV400/800/1500CV200/400/800/1500
n = 151.61 ± 0.051.57 ± 0.031.55 ± 0.031.58 ± 0.041.56 ± 0.031.58 ± 0.041.55 ± 0.031.56 ± 0.03
Abbreviations: SB200 = season best time for 200 m freestyle, SB400 = season best time for 400 m freestyle, SB800 = season best time for 800 m freestyle, SB1500 = season best time for 1500 m freestyle, PB200 = personal best time for 200 m freestyle, PB400 = personal best time for 400 m freestyle, PB800 = personal best time for 800 m freestyle, PB1500 = personal best time for 1500 m freestyle, VO2max = maximal oxygen consumption, Lapeak = peak blood lactate concentration at the end of the incremental test, HRmax = maximal heart rate, MAS = maximal aerobic speed, LT1 = blood lactate value for first lactate threshold, LT2 = blood lactate value for second lactate threshold, Dmax = blood lactate value for Dmax method, V2mmol/L = speed corresponding to 2 mmol/L, V4mmol/L = speed corresponding to 4 mmol/L, VLT1 = speed corresponding to first lactate threshold, VLT2 = speed corresponding to second lactate threshold, VDmax = speed corresponding to Dmax point, and CV = critical velocity for combinations of 200, 400, 800, and 1500 m events.
Disclaimer/Publisher’s Note: The statements, opinions and data contained in all publications are solely those of the individual author(s) and contributor(s) and not of MDPI and/or the editor(s). MDPI and/or the editor(s) disclaim responsibility for any injury to people or property resulting from any ideas, methods, instructions or products referred to in the content.