Article

Maximal Torque, Neuromuscular, and Potentiated Twitch Responses to Sustained Forearm Flexion Tasks Using Different Anchor Schemes

by
Robert W. Smith
1,*,
Jocelyn E. Arnett
2,
Dolores G. Ortega
2,
Trevor D. Roberts
2,
Dona J. McCanlies
3,
Richard J. Schmidt
2,
Glen O. Johnson
2 and
Terry J. Housh
2
1
Department of Health, Human Performance, and Sport, Wayne State College, Wayne, NE 68787, USA
2
Department of Nutrition and Health Sciences, University of Nebraska-Lincoln, Lincoln, NE 68510, USA
3
College of Dentistry, University of Nebraska Medical Center, Lincoln, NE 68510, USA
*
Author to whom correspondence should be addressed.
Physiologia 2025, 5(2), 15; https://doi.org/10.3390/physiologia5020015
Submission received: 6 March 2025 / Revised: 12 April 2025 / Accepted: 16 April 2025 / Published: 23 April 2025
(This article belongs to the Special Issue Exercise Physiology and Biochemistry: 2nd Edition)

Abstract

:
Background/Objectives: Studies of the effects of anchor schemes (perceived intensity vs. relative intensity) on muscular performance have reported mixed findings. Therefore, the present study examined the effects of different anchor schemes on time-to-task failure (TTF), muscular performance, neuromuscular responses, and potentiated twitch torque (PTT). Methods: On separate days, 15 men (age = 21.5 ± 2.3 yrs) performed forearm flexion maximal voluntary isometric contractions (MVICs) before and after sustained tasks anchored to a rating of perceived exertion of 6 (RPEFT) and with the torque at RPE = 6 (TRQFT). Electromyographic amplitude (EMG AMP) and mean power frequency (EMG MPF) were recorded from the biceps brachii (BB). Supramaximal stimuli were delivered to the motor nerve of the BB following the MVICs to quantify the PTT. Repeated measures ANOVAs assessed the mean differences between anchor schemes for MVIC, neuromuscular, and PTT responses. Paired t-tests compared the magnitude of percent changes for the dependent variables. Results: The TTF for the RPEFT was longer (p < 0.001) than the TRQFT, but the MVIC decreased similarly (12.7 ± 9.5% vs. 20.3 ± 7.9%, p = 0.054). Electromyographic AMP did not change (p = 0.288), while EMG MPF decreased (15.7 ± 10.2%, p < 0.011) for the TRQFT only. Mean decreases in PTT were comparable for both tasks (p < 0.003), although the percent change was greater for the TRQFT (49.6 ± 16.1%, p < 0.001). Conclusions: The differences in TTF, but similar decreases in MVIC suggested that participants reached a sensory tolerance limit. Based on EMG MPF and PTT, the TRQFT caused greater peripheral perturbations to contractile function than the RPEFT.

1. Introduction

Fatigue leads to a temporary decrease in muscular performance and increased effort. It is also accompanied by a conscious sensation of weariness or tiredness [1]. The effects of fatigue can be measured by the magnitude or rate of change in mechanical output or performance over a specific period of time [2,3]. A common measure of fatigue assesses changes in maximal voluntary isometric contraction (MVIC) from before to after a task. This measure reflects contributions from both central and peripheral mechanisms [4]. Central fatigue involves changes related to muscle activation, including neural drive, excitability of cortical motoneurons, and neuromuscular propagation [2,3]. It has been suggested [5] that central fatigue is associated with muscle acidosis, which stimulates metabosensitive group III/IV muscle afferents in the interstitial space. Under fatiguing conditions, these sensory neurons project to higher brain centers, which causes a reduction in descending drive upstream from the motor cortex, resulting in decreased synaptic input to the motor neuron pool, and, ultimately, a reduction in maximal torque (or force) production [6]. In contrast, peripheral fatigue involves physiological changes distal to the neuromuscular junction that impair contractile function. These changes include metabolite accumulation, disturbances to sarcolemma excitability, and disrupted Ca2+ kinetics, which can lead to excitation–contraction coupling failure [2,3]. Therefore, decreases in muscular performance due to fatigue are linked to both muscle activation and contractile function.
Researchers often assess the amplitude (AMP) and spectral properties (mean power frequency [MPF]) of the electromyographic (EMG) signal to draw inferences about fatigue-induced changes in motor unit activation strategies related to MVIC decreases. For example, under certain conditions, fatigue-induced changes in EMG AMP have been shown to reflect alterations in motor unit recruitment, firing rate, and/or synchronization [7,8], while changes in EMG MPF are associated with changes in the conduction velocity of the action potential along sarcolemma of the muscle fiber [9] following a sustained task. Potentiated twitch torque (PTT) is used to evaluate the severity of peripheral fatigue by assessing the resting evoked twitch response through the application of supramaximal stimulation at rest following an MVIC [10]. Fatigue can be quantified by comparing pretest and posttest changes in MVIC torque (or force). Additionally, neuromuscular responses, including EMG AMP, EMG MPF, and PTT, can provide insights into central and peripheral contributions to reductions in muscular performance.
There is growing interest regarding the fatigue-induced effects of exercise using a perceived intensity (e.g., ratings of perceived exertion [RPE]) versus a relative intensity (e.g., % max, % MVIC, or torque or force) on muscular performance. However, reports on the influence of anchor schemes on muscular performance and neuromuscular responses have been inconsistent. For example, recent findings [11,12] suggested that while fatigue-induced decreases in MVIC torque may be similar across different anchor schemes, the neuromuscular responses vary. Specifically, compared to neuromuscular responses for tasks anchored to torque, responses for RPE tasks exhibited fatigue-induced changes that were either less severe [11], similar [11], or showed no changes [12]. Recently, Ortega et al. [11] reported a fatigue-induced decrease in EMG MPF following a sustained, forearm flexion task anchored to a constant torque value at RPE = 6, but no change following a task anchored to RPE = 6. Thus, there were differences in measures reflective of peripheral fatigue between anchor schemes. To date, no previous studies have used PTT to compare the effects of peripheral fatigue on muscular performance from tasks anchored to perceived intensity versus those anchored to sustained relative intensity. The application of PTT in addition to EMG MPF could provide greater insight into the factors associated with reductions in PTT, such as fatigue-induced alterations in the concentration of metabolites, Ca2+ kinetics, and/or the number of cross-bridge interactions [13,14,15]. Therefore, this study aimed to investigate whether sustained isometric tasks using different anchor schemes (anchored to RPE vs. torque) produced distinct effects on time-to-task failure (TTF), muscular performance, neuromuscular responses, and PTT. Based on the findings of previous studies [11,12,14,15,16,17] we hypothesized that: (1) decreases in MVIC torque would be similar across anchor schemes; (2) there would be decreases in EMG AMP and EMG MPF following the torque fatigue task (TRQFT), but not the RPE fatigue task (RPEFT); and (3) PTT would detect fatigue-induced changes in contractile function after both fatigue tasks, with a greater magnitude of change observed after the TRQFT compared to the RPEFT.

2. Results

2.1. Reliability

Table 1 includes the test–retest reliability parameters (p-value [systematic error], ICC, ICC95%, and clinical significance) for MVIC torque, EMG AMP, EMG MPF, and PTT values from the pretest MVIC assessments during test visit 1 and test visit 2. There were no mean differences (p > 0.05) for test versus retest for absolute torque, neuromuscular responses, or PTT values. The ICC values ranged from 0.256 (PTT) to 0.822 (MVIC torque).

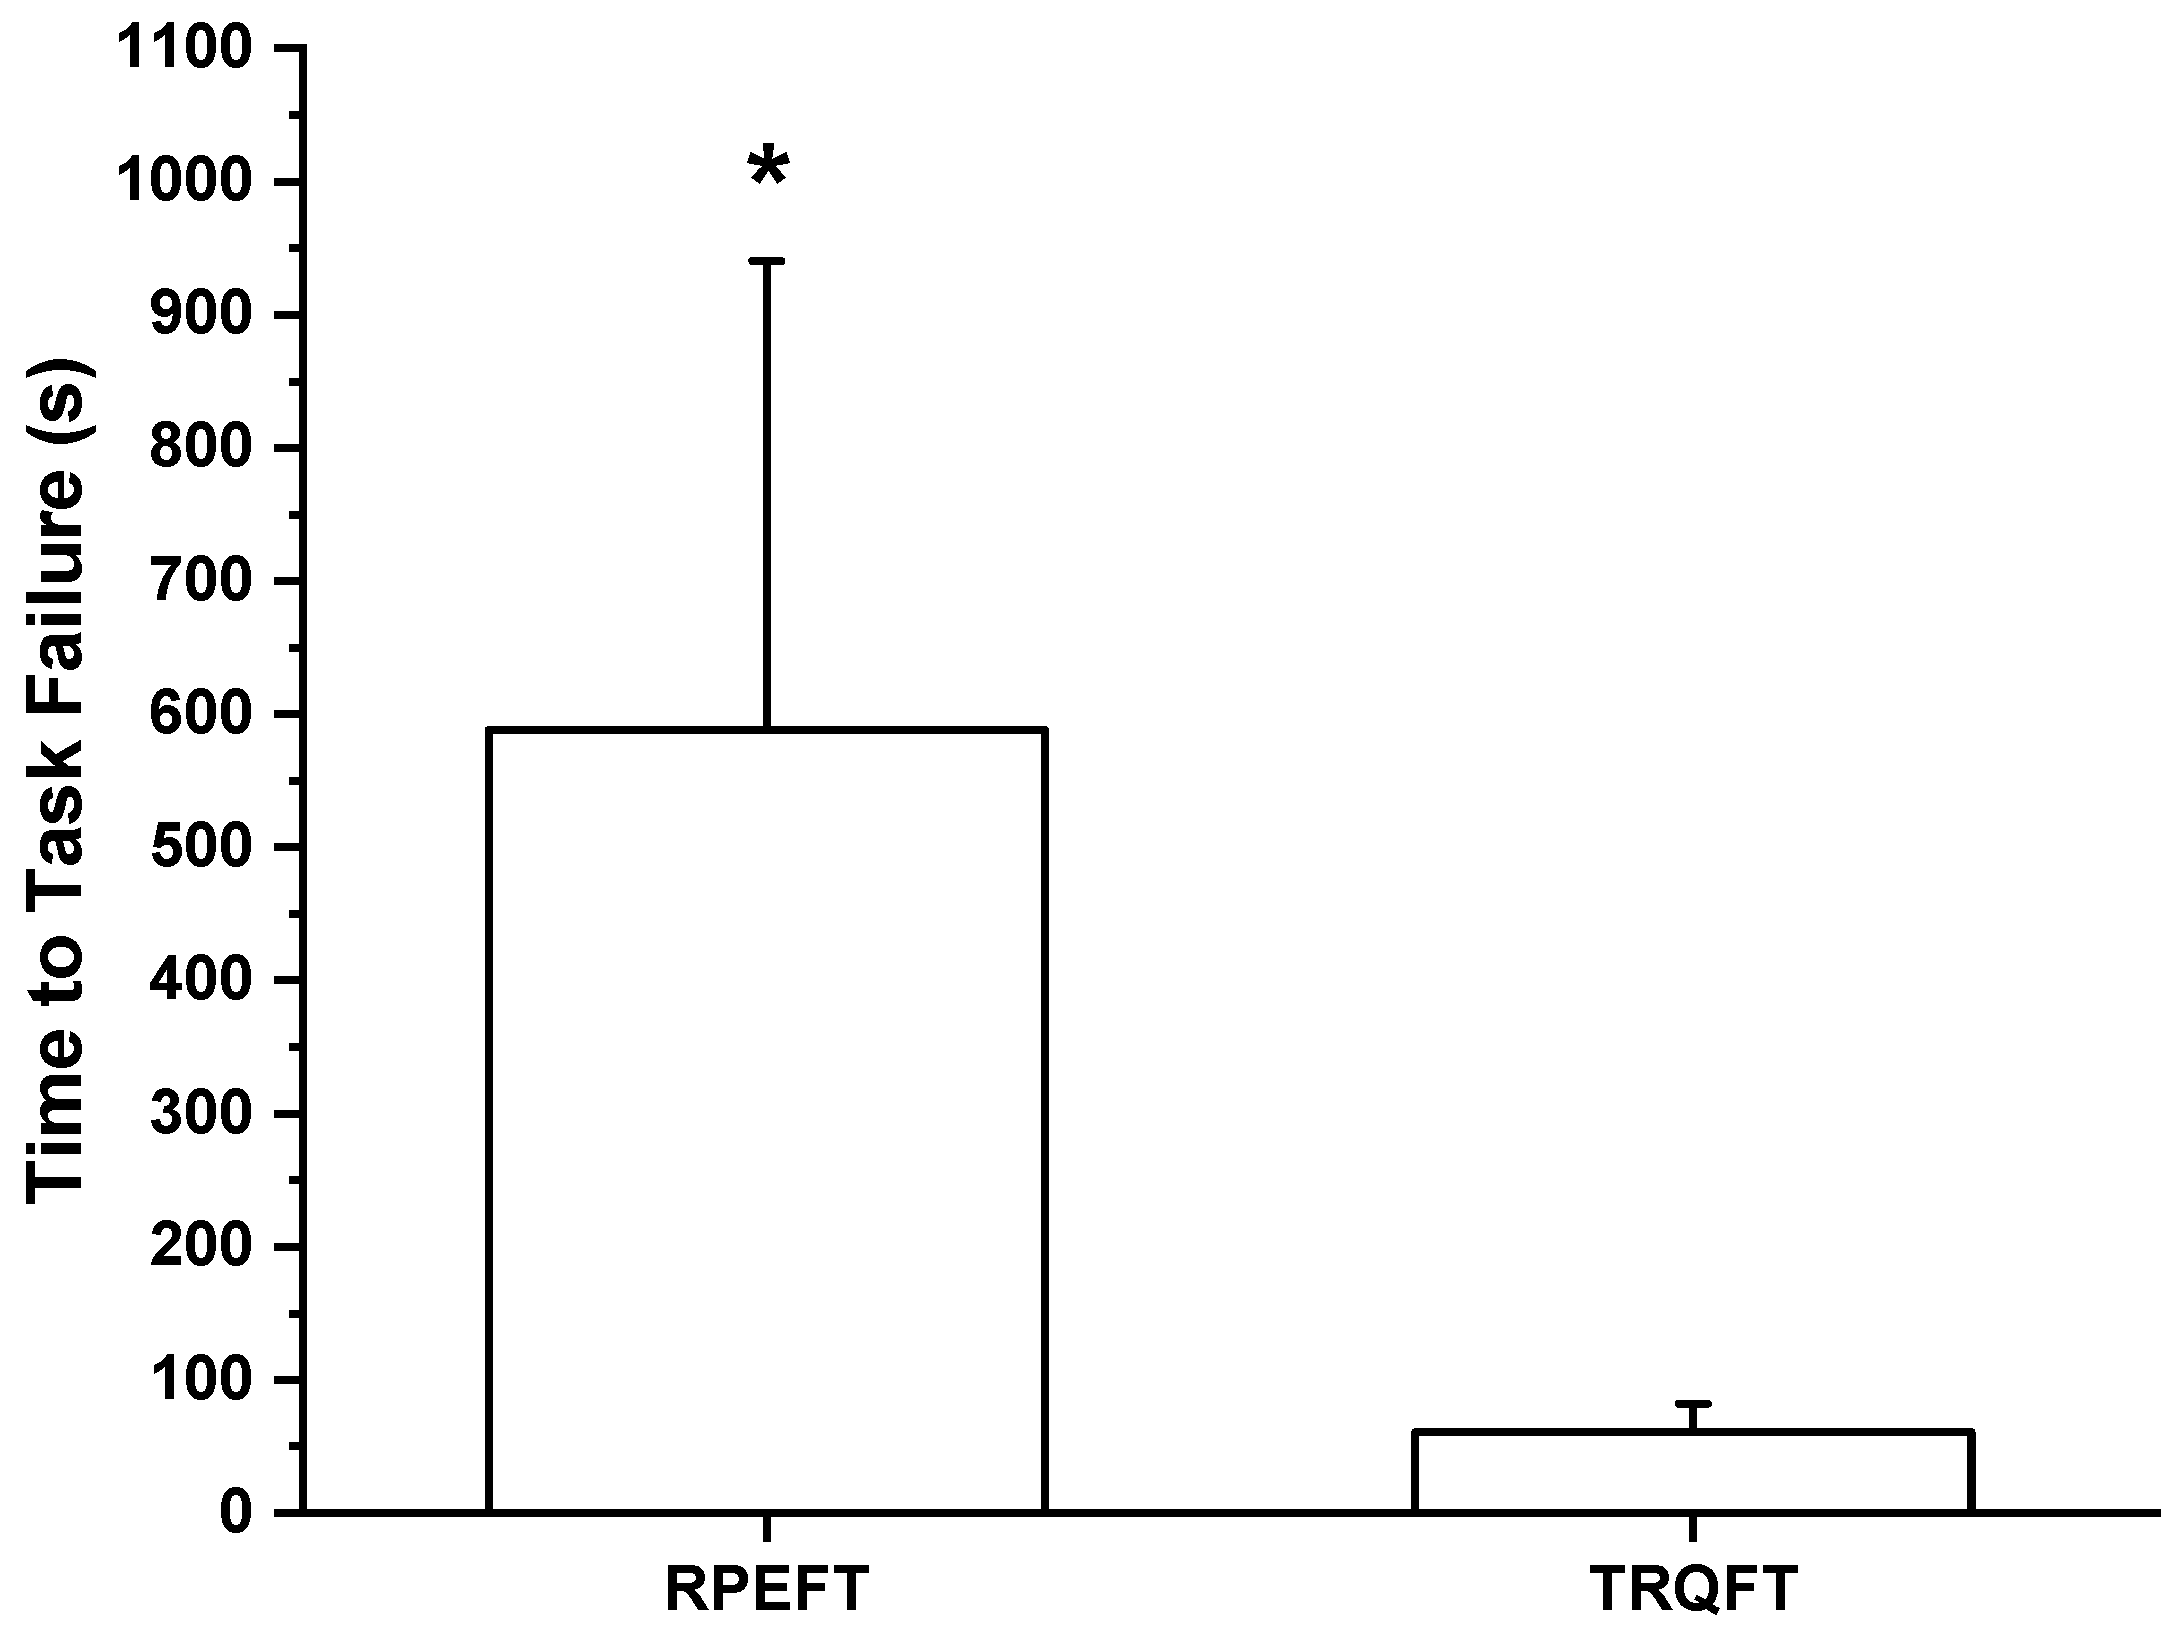
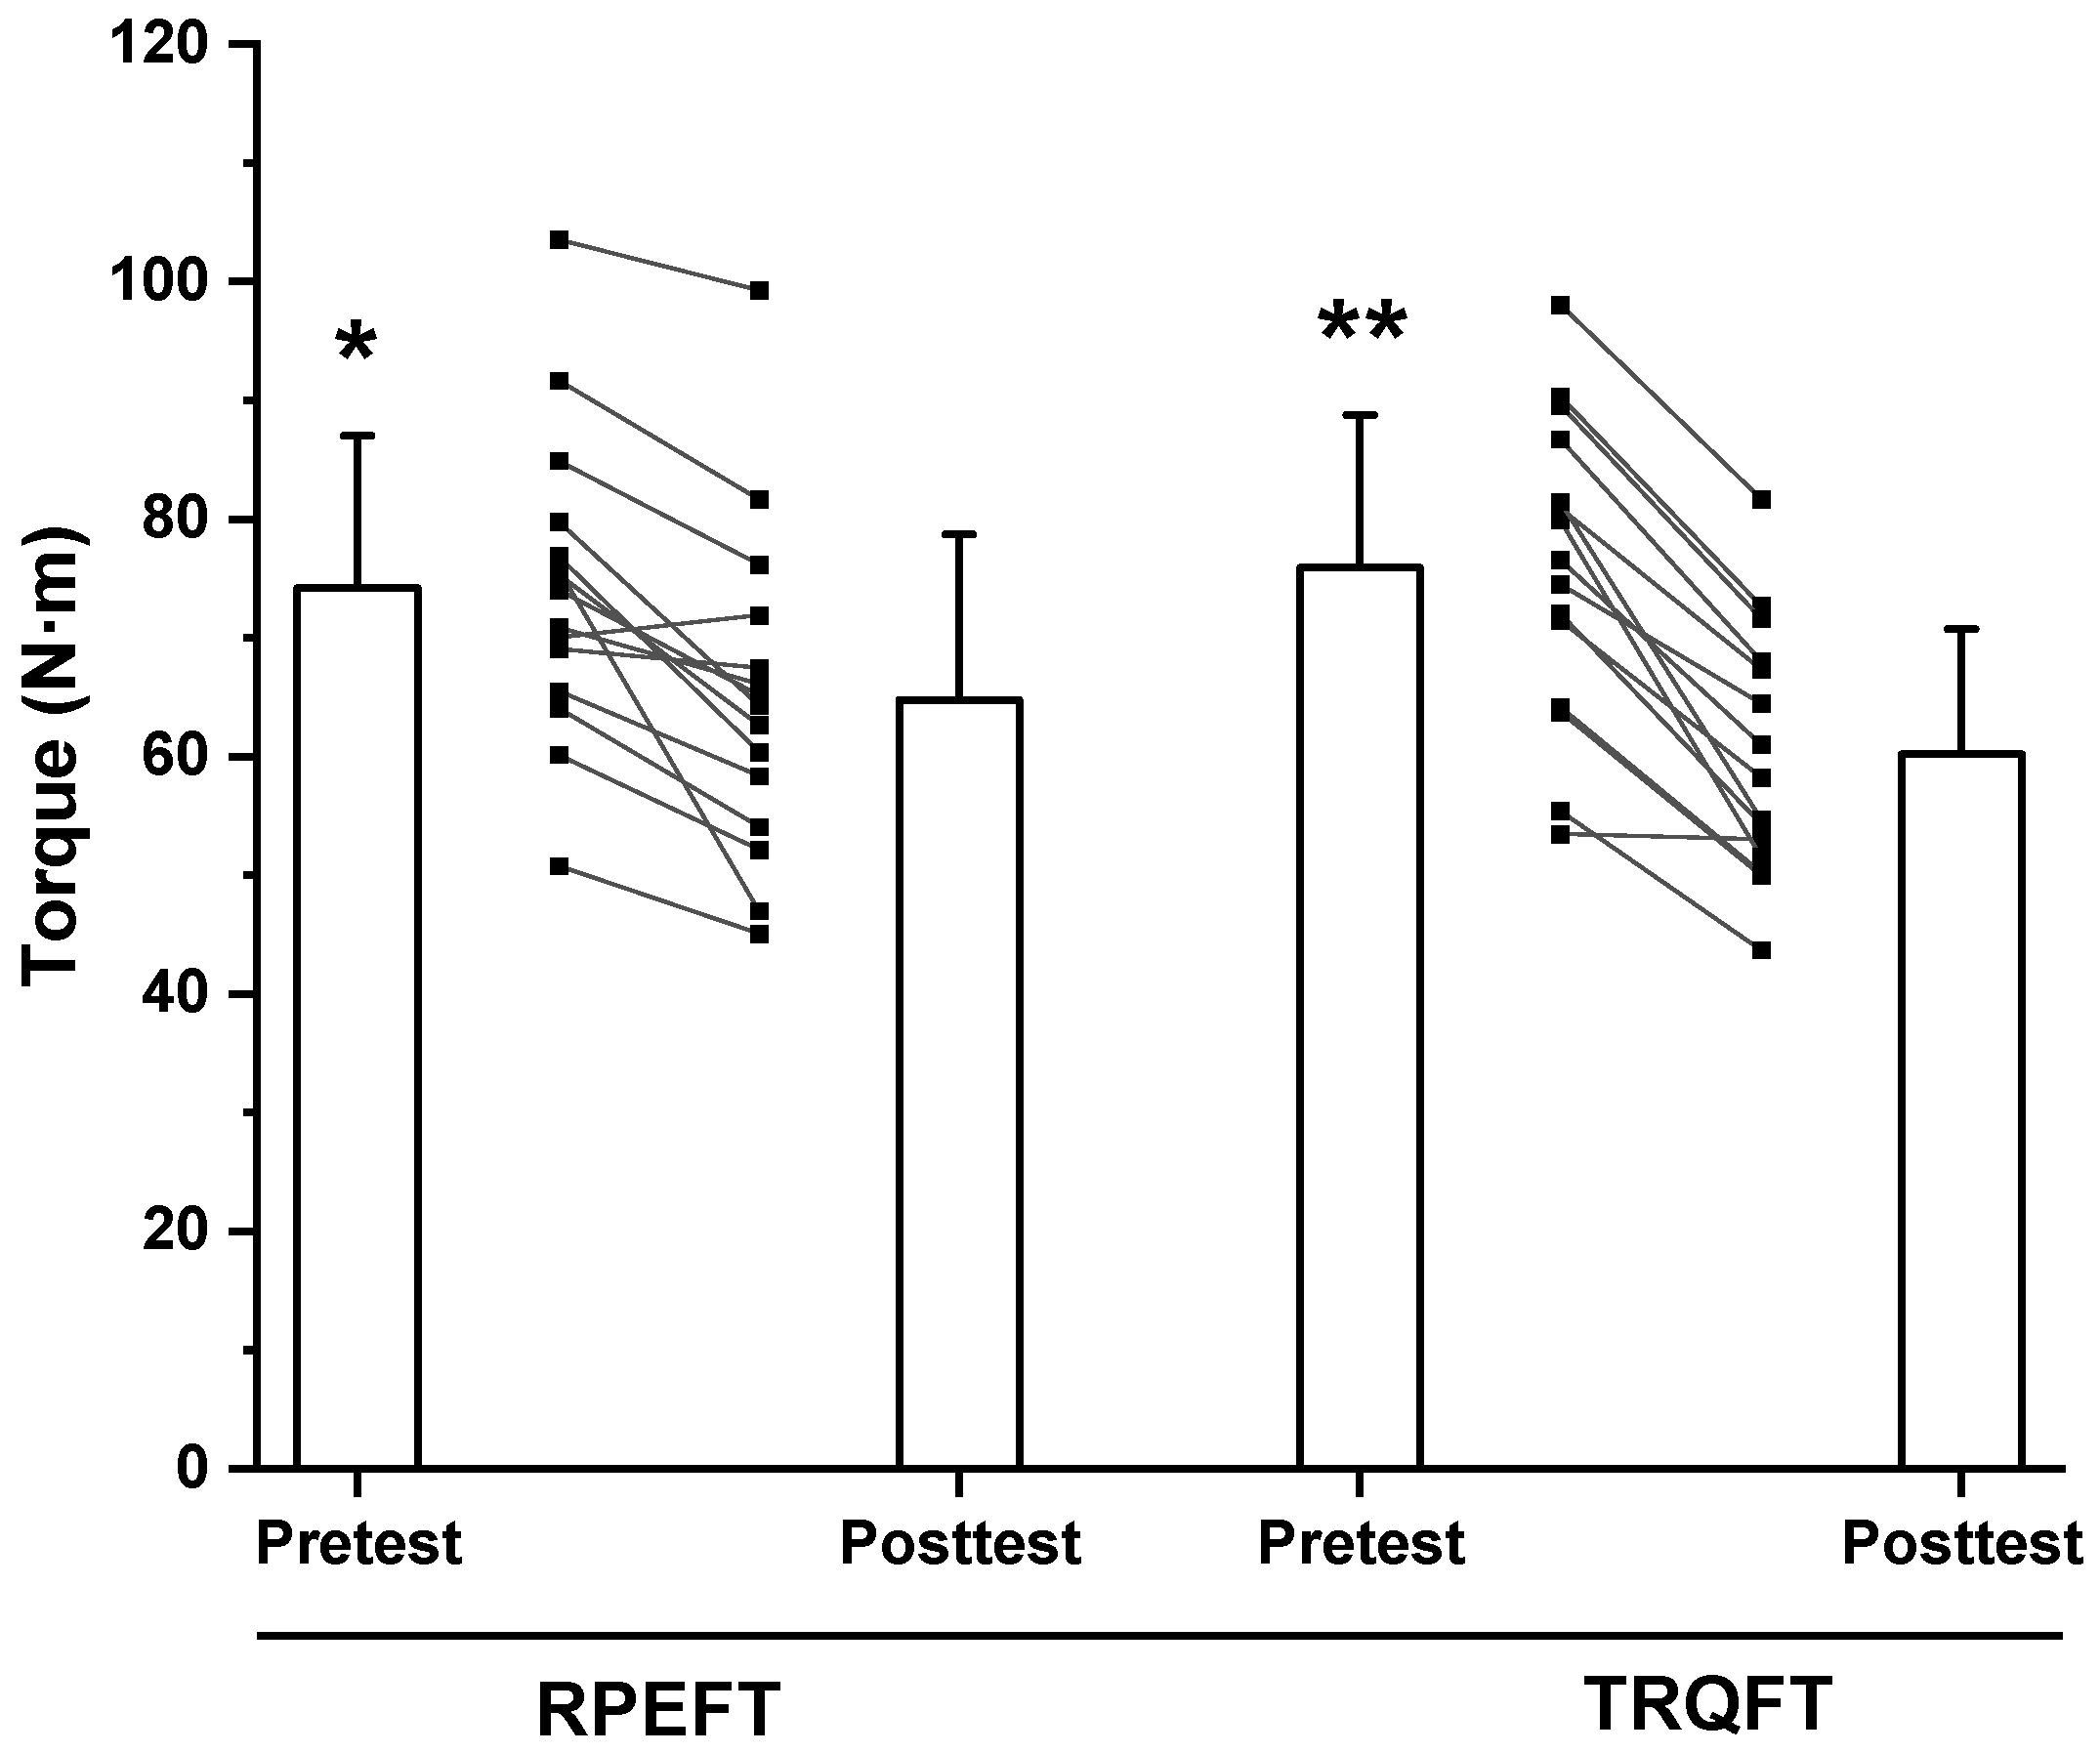
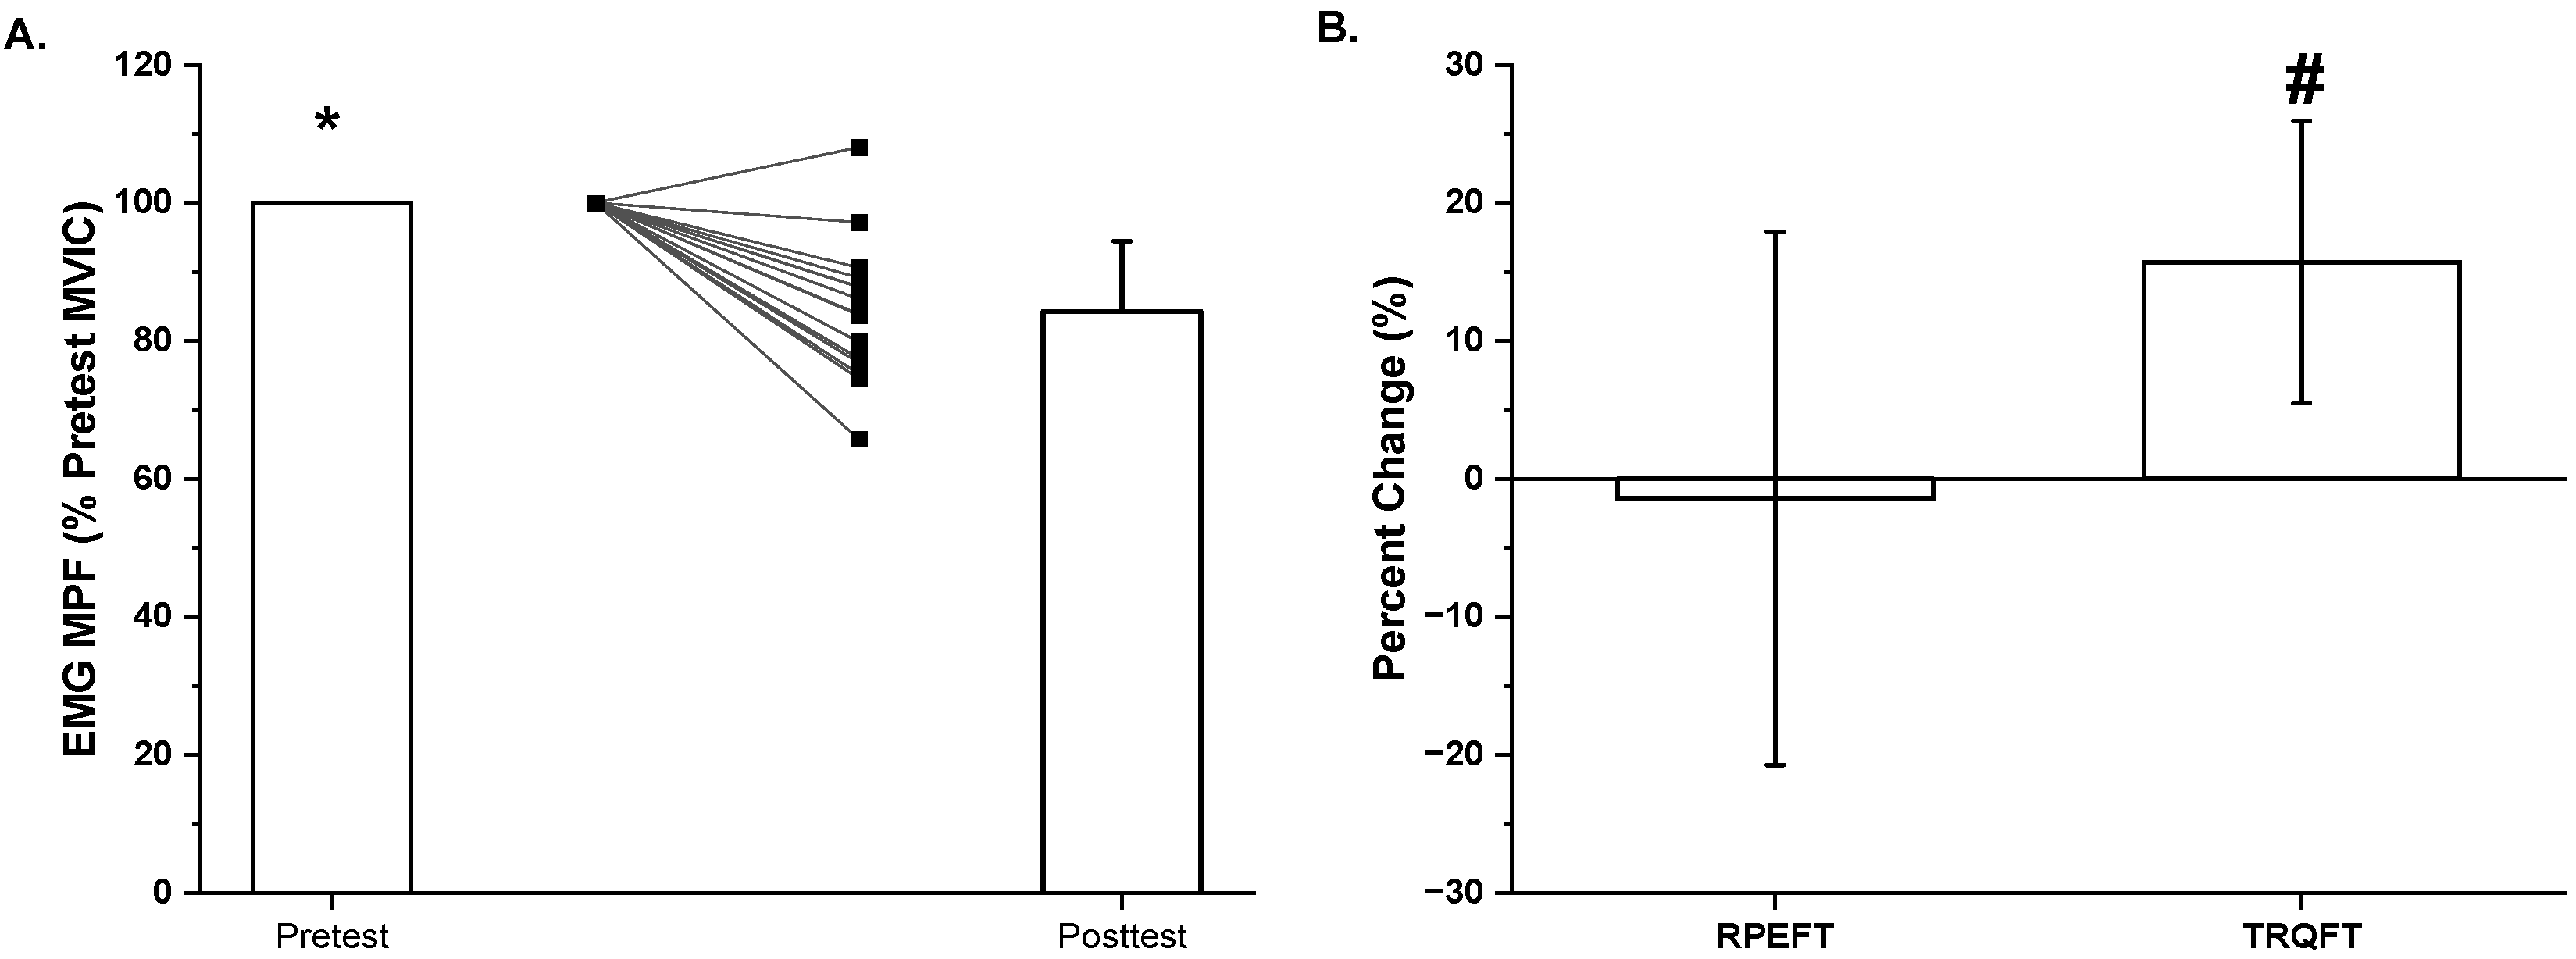
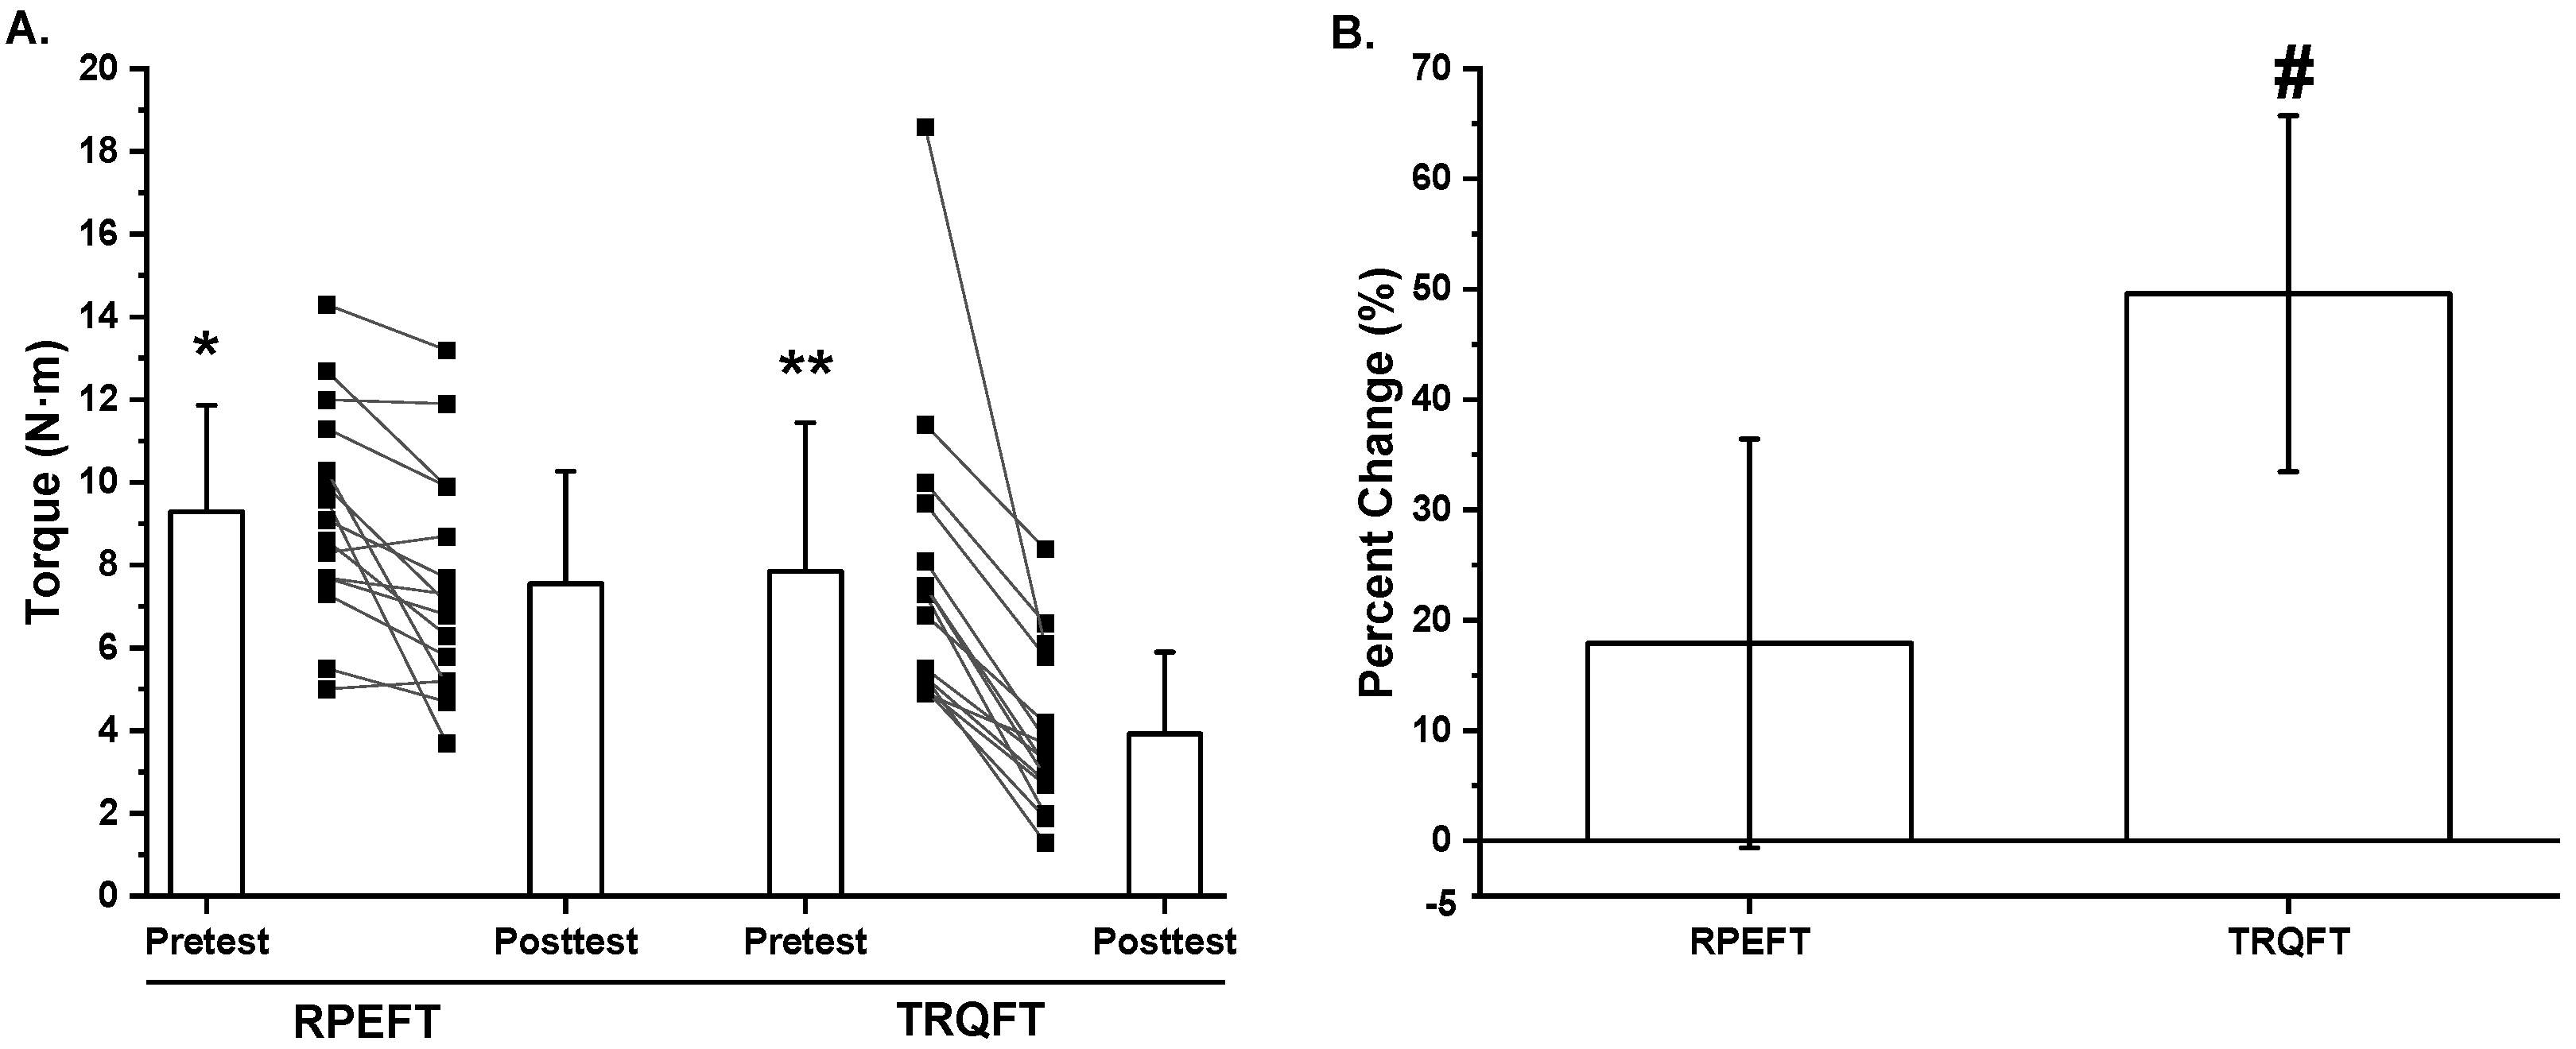
2.2. Time-to-Task Failure, MVIC Torque, Neuromuscular Responses, and Potentiated Twitch Torque

The individual subject and composite MVIC torques, neuromuscular responses, and PTT values from the pretest and posttest assessments during test visits 1 and 2 are presented in Table 2, Table 3, Table 4 and Table 5, respectively. The dependent t-tests for TTF indicated that the participants sustained the RPEFT significantly longer (p < 0.001, d = 2.114, 95% confidence interval [CI = 332.4, 722.5]) than the TRQFT (588.2 ± 90.9 s vs. 60.8 ± 21.3 s) (Figure 1).
The 2 (Anchor Scheme: RPEFT vs. TRQFT) × 2 (Time: Pretest vs. Posttest) repeated measures ANOVA for the absolute MVIC torque values indicated a significant 2-way interaction (p = 0.042; ηp2 = 0.264). The follow-up pairwise comparisons (decomposed by Anchor Scheme) indicated a significant decrease in MVIC torque from pretest to posttest following the RPEFT (74.2 ± 12.8 N∙m vs. 64.8 ± 13.9 N∙m; p < 0.001, d = 0.701, 95% CI [5.4, 13.8]) and TRQFT (75.9 ± 12.9 N∙m vs. 60.2 ± 10.5 N∙m; p < 0.001, d = 1.336, 95% CI [12.1, 19.3]) (Figure 2). There was, however, no difference (p = 0.054, d = 0.875) in the percent change between the RPEFT (12.7 ± 9.5%) and TRQFT (20.3 ± 7.9%).
The 2 (Anchor Scheme: RPEFT vs. TRQFT) × 2 (Time: Pretest vs. Posttest) repeated measures ANOVA for the normalized EMG AMP values indicated no significant 2-way interaction (p = 0.288; ηp2 = 0.080) or main effects for Anchor Scheme (p = 0.288; ηp2 = 0.080) or Time (p = 0.892; ηp2 = 0.001). In addition, there was no difference (p = 0.288, d = 0.461) in percent change for normalized EMG AMP between the RPEFT (11.5 ± 28.2%) and TRQFT (−9.6 ± 58.1%).
The 2 (Anchor Scheme: RPEFT vs. TRQFT) × 2 (Time: Pretest vs. Posttest) repeated measures ANOVA for the normalized EMG MPF values indicated a significant 2-way interaction (p = 0.011; ηp2 = 0.382). The follow-up pairwise comparisons (decomposed by Anchor Scheme) indicated no changes in normalized EMG MPF following the RPEFT (100.0 ± 0.0% MVIC vs. 101.4 ± 19.3% MVIC; p = 0.783, d = 0.103), but a significant decrease in normalized EMG MPF from pretest to posttest following the TRQFT (100.0 ± 0.0% MVIC vs. 84.3 ± 10.2% MVIC; p = 0.001, d = 2.173, 95% CI [10.1, 21.4]) (Figure 3A). The percent change for EMG MPF following the TRQFT was significantly greater (p = 0.011, d = 1.106, 95% CI [−29.6, −4.6]) than the RPEFT (15.7 ± 10.2% vs. −1.4 ± 19.3%) (Figure 3B).
The 2 (Anchor Scheme: RPEFT vs. TRQFT) × 2 (Time: Pretest vs. Posttest) repeated measures ANOVA for the absolute PTT values indicated a significant 2-way interaction (p = 0.025; ηp2 = 0.310). The follow-up pairwise comparisons (decomposed by Anchor Scheme) indicated a significant decrease in PTT from pretest to posttest following the RPEFT (9.3 ± 2.6 Nm vs. 7.6 ± 2.7 Nm; p = 0.003, d = 0.655, 95% CI [0.7, 2.7]) and TRQFT (7.8 ± 3.6 Nm vs. 3.9 ± 2.0 Nm; p < 0.001, d = 1.356, 95% CI [2.5, 5.4]) (Figure 4A). The percent change for PTT following the TRQFT was significantly greater (p < 0.001, d = 1.825, 95% CI [−45.5, −17.9]) than the RPEFT (49.6 ± 16.1% vs. 17.9 ± 18.5%) (Figure 4B).

3. Discussion

The mean (±SD) and test–retest reliability analyses for the absolute MVIC torque values, neuromuscular parameters (EMG AMP and EMG MPF), and PTT values from the pretest forearm flexion MVICs from test visits 1 and 2 are presented in Table 1. For MVIC torque, there was no significant mean difference for test versus retest and the ICC was 0.822, which reflected excellent reliability [18]. The ICC for MVIC torque in the present study is consistent with those reported previously (range = 0.624–0.982) for forearm flexion MVICs [19,20]. The reliability analyses for the neuromuscular parameters (EMG AMP and EMG MPF) indicated no mean differences for test versus retest during the pretest forearm flexion MVICs. These findings are in agreement with previous studies that reported no systematic error for test versus retest reliability during forearm flexion MVICs [11,19,21]. The ICCs for EMG AMP (0.773) and EMG MPF (0.321) in the current study reflected excellent and poor reliability, respectively [18]. The ICC for EMG AMP was within the range (0.610–0.975) of the ICCs reported previously [19,22], while the ICC for EMG MPF was lower than those (range = 0.648–0.863) reported previously [11,19,20]. It has been suggested that the degree of between-participants variability can affect the ICC [18,23] and that the absolute values of neuromuscular parameters can change from day to day because of factors such as slight changes in electrode placement as well as skin preparation and impedance, perspiration, skin temperature, subcutaneous tissue thickness, intramuscular fluid pressure, and muscle stiffness [24,25,26].
The ICC for PTT (0.256) was less than those (range = 0.860–0.970) reported previously [27,28,29,30,31] for forearm flexion, plantar flexion, and leg extension MVICs, but there was no significant mean difference for test versus retest in the present study. Previously, Allen et al. [27] assessed the reliability of PTT in one female and four males following forearm flexion MVICs across five test visits on separate days. According to Allen et al. [27], the cathode was placed over the motor point of the BB as opposed to the motor nerve of the BB in the present study. Furthermore, the forearm was supported by a stiff piece of aluminum, and force was measured using a load cell attached to the aluminum via spherical rod ends [27]. In the current study, torque was measured with an isokinetic dynamometer. It is possible that the differences in cathode location and the isokinetic dynamometer may have had less sensitivity to forearm displacement caused by the muscle twitch and could partially explain the differences in reliability. Rodriguez-Falces and Place [32] identified several factors that can affect the properties of the potentiated twitch: (1) the detection system, including electrode placement, electrode size and shape, and skin–electrode contact (impedance and noise); (2) anatomical factors such as subcutaneous tissue thickness, motor unit number and distribution within the muscle, and muscle fiber orientation; (3) contraction-induced changes in muscle architecture; (4) muscle membrane properties, including the size and shape of transmembrane action potentials and conduction velocity; (5) biophysical factors, such as crosstalk from nearby muscles and the conductivity of the tissues; and (6) environmental effects on muscle temperature. Furthermore, Dotan et al. [33] discussed several factors that can influence the PTT, including: (1) the incomplete summation of the individual motor unit twitches from the evoked stimulus; (2) force (or torque) absorbed in overcoming the muscle’s series elastic component; (3) tendon slack; and (4) suboptimal muscle length. Therefore, it is possible that in the current study, the reliability of the PTT was influenced by nonphysiological and physiological factors [32,33], or by methodological differences such as cathode placement and/or equipment choice.
The mean TTF for the RPEFT was, on average, 9.7 times greater than that of the TRQFT (Figure 1). These findings provide evidence that the ability to maintain a task anchored to RPE is less demanding and, therefore, more sustainable than a task anchored to torque. Recently, Ortega et al. [11] reported that the TTF for the RPEFT was 5.8 times greater than TRQFT TTF at RPE = 8. Previous work by Keller et al. [34] and Ortega et al. [11] proposes that the disparity in TTF between fatiguing tasks anchored to RPE versus torque (or force) can be attributed to the ability to consciously reduce torque to maintain a prescribed RPE versus the necessity of sustaining a constant torque. Specifically, during tasks anchored to RPE, the decrease in torque is based on perceptual intensity, which typically leads to reductions in muscle excitation due to derecruitment of the activated motor units [34]. In theory, the reduction in torque decreases the risk of disruption to the direct (i.e., neuromuscular) and indirect (i.e., cardiovascular and respiratory) systems [35] involved in the tasks, which reduces the stimulus to provoke symptoms of fatigue (i.e., feelings of tiredness or weakness) [3]. Conversely, when a task is anchored to a constant torque value, the task intensity remains constant, and, therefore, fatigue progresses more rapidly than during a task anchored to RPE. Thus, the longer TTF values observed following the RPEFT compared to the TRQFT in the present study were likely due to the ability to consciously decrease torque, thereby reducing the rate of development of fatigue-related symptoms.
On average, there were similar fatigue-induced decreases (p > 0.05) in MVIC torque for the RPEFT (12.7 ± 9.7%) and TRQFT (20.3 ± 7.9%) (Figure 2). Previous studies [11,34] have also reported differences in TTF values, but similar decreases in maximal torque (or force) production following sustained tasks using different anchor schemes that resulted in dissimilar TTFs. Specifically, recent studies have shown no difference in decreases in MVIC torque following sustained, isometric forearm flexion tasks anchored to RPE = 8 and the torque that corresponded to RPE = 8 in women [22], as well as in men [11]. Similar findings have also been reported following sustained, isometric bilateral, and unilateral leg extensions anchored to RPE values of 1, 5, and 8, and the force that corresponded to RPE values of 1, 5, and 8 in men [34]. It has been speculated [11,34,36,37] that the similar decreases in maximal torque (or force) production, in spite of the different task characteristics and the TTFs, may be explained by the sensory tolerance limit (STL). The STL was originally proposed by Gandevia [4] and conceptualized by Hureau et al. [36]. According to Hureau et al. [36], the STL encompasses global sensory feedback from muscles directly and/or indirectly involved with the task, as well as corollary discharges associated with central motor commands from the premotor and primary motor areas of the brain [38] that limit exercise tolerance. The STL posits that during constant intensity exercise, the sum of feedback and feedforward sources determines the intensity at which the task can be maintained at a tolerable level. When a finite level of stimulation from all sources is reached, however, and the task is interpreted as “…sufficiently unattractive…” [4], the task is either terminated or the exercise intensity is voluntarily reduced “…to ensure the continuation [of the task] is tolerable” [36]. In theory, when a submaximal task is anchored to a constant torque, fatigue responses are characterized by increases in central drive and motor unit recruitment to compensate for fatigued motor units, corollary discharges, and sensory feedback that progress until the task is voluntarily terminated at the STL [36]. In contrast, when a task is anchored to RPE, torque is consciously decreased to maintain the predetermined perceptual intensity [34]. This adjustment helps to avoid the STL and allows the task to be sustained until the STL is eventually attained and/or torque is reduced to zero. It is possible that the fatiguing tasks in the present study were discontinued once the STL was reached, which occurred later during the RPEFT than the TRQFT due to the ability to reduce torque output. Similar decreases in MVIC torque following the RPEFT and TRQFT likely reflected the discontinuation of both tasks once the STL was reached, despite the differences in TTF. It is also possible that during the TRQFT, reaching the STL led to task termination, but during the RPEFT, the torque was reduced to zero to avoid reaching the STL.
Neuromuscular parameters have been used to make inferences regarding fatigue-induced changes in physiological mechanisms responsible for modulating maximal torque output following sustained, isometric tasks [11,22]. The present findings indicated that there were no changes in normalized EMG AMP or differences in the percent change between the RPEFT and TRQFT (Table 3). Electromyographic AMP is reflective of muscle excitation [39], which is influenced by motor unit recruitment, firing rate, and/or synchronization [7,8]. Previous studies that examined the changes in absolute EMG AMP or normalized EMG AMP have reported no change [11,12] or a decrease [22] following sustained, isometric forearm flexion tasks anchored to RPE, TRQ, or both (performed during separate test visits). Arnett et al. [22] suggested that the decreases in EMG AMP, caused by central fatigue, reflected reductions in central motor command, which resulted in decreased motor unit recruitment. It has been suggested [40,41,42], however, that muscle excitation can be well preserved following fatiguing isometric tasks. Thus, the lack of changes in normalized EMG AMP in the present study were dissociated from the decreases in MVIC torque and indicated that muscle excitation was maintained following the RPEFT and TRQFT.
There was a decrease in normalized EMG MPF following the TRQFT (Figure 4A), but there was no change in normalized EMG MPF following the RPEFT. In addition, the percent change for EMG MPF following the TRQFT (15.7 ± 10.2%) was greater, on average, than the RPEFT (−1.4 ± 19.3%) (Figure 4B). Similar to the present study, Ortega et al. [11] reported a decrease in normalized EMG MPF following sustained, isometric forearm flexion tasks anchored to the TRQFT, but not the RPEFT at RPE = 6. Similarly, Arnett et al. [22] observed that, during forearm flexion MVICs, the percent change for EMG MPF was greater following the TRQFT (torque corresponding to torque at RPE = 8) than the REPFT at RPE = 8. Decreases in EMG MPF have been associated with reductions in muscle fiber action potential conduction velocity (MF APCV) [9]. Moreover, it is well established that peripheral mechanisms at or distal to the neuromuscular junction—where intramuscular metabolites, including Mg2+, Pi, H+, Na+, and K+, accumulate [5,40]—can disrupt excitation–contraction coupling [43] by impeding sarcolemma action potential conduction velocity [9], Ca2+ release and reuptake by the sarcoplasmic reticulum [40], troponin–calcium binding [40,43], and actin–myosin binding [40,43]. Taken together, in the present study, the decrease in normalized EMG MPF and the greater percent change suggests that peripheral mechanisms involved with excitation–contraction coupling failure contributed to the reductions in MVIC torque following the TRQFT to a greater extent than the RPEFT.
The current findings showed decreases, on average, in PTT following both the RPEFT and TRQFT (Figure 5A), but the percent change for PTT for the TRQFT was, on average, 2.8 times greater than the RPEFT (49.6 ± 16.1% vs. 17.9 ± 18.5%) (Figure 5B). This is the first study to report anchor scheme-related differences using PTT to reflect peripheral mechanisms of fatigue. Furthermore, these findings were consistent with previous studies that demonstrated reductions in PTT during isometric forearm flexion [16], leg extensions [17,30], and plantar flexion [41] following tasks anchored to torque or with stimulated muscle actions. It has been suggested that a fatigue-induced decrease in PTT amplitude reflects an impairment between the site of stimulation (i.e., the motor nerve) and the contractile properties of the muscle [10]. Place [10] attributed this impairment to several potential processes that disrupt excitation–contraction coupling, including failure of action potential generation and/or propagation, decreased Ca2+ release from the sarcoplasmic reticulum, and decreased myofibrillar Ca2+ sensitivity and/or force produced from cross-bridge cycling. The interpretation of the PTT responses, however, may be confounded by the nonphysiological and physiological factors underlying the PTT [32,33]. Despite the potential influence of these factors, it is possible that the decreases in PTT following the RPEFT and TRQFT in the present study reflected fatigue-induced disruptions to the contractile properties of the biceps brachii (BB) and brachialis, and resulted in lower PTT amplitudes. The greater percent change in PTT for the TRQFT versus the RPEFT indicated that while the sustained tasks led to fatigue-induced changes in the peripheral mechanisms of the forearm flexors, these manifestations were more severe for the TRQFT than the RPEFT.
The current findings revealed that the MVIC decreased to a similar extent following both tasks, despite a greater TTF for the RPEFT than the TRQFT. Electromyographic AMP, however, was dissociated from the decreases in MVIC torque for both fatiguing tasks, while EMG MPF tracked the decreases for the TRQFT only. Thus, the decrease in MVIC torque following the RPEFT was not tracked by changes in EMG AMP or EMG MPF. While the percent change for PTT and EMG MPF was greater following the TRQFT, PTT decreased for both tasks, but EMG MPF did not. Therefore, the EMG MPF responses did not match the PTT responses even though they were affected by the same mechanisms of peripheral fatigue [9,10]. Given that peripheral fatigue can affect various excitation–contraction coupling processes, it is possible that the different EMG MPF and PTT responses reflected distinct peripheral mechanisms of fatigue. Although the pretest to posttest differences were similar for MVIC torque and PTT, the percent change for PTT was greater following the TRQFT than the RPEFT. Thus, the PTT responses were dissociated from MVIC torque and matched the TTF responses more closely. Perhaps, the PTT responses in the present study reflected greater manifestations of peripheral fatigue experienced during the TRQFT, which could, in part, explain the shorter TTF compared to the RPEFT, and allowed for reductions in torque and the ability to avoid the accumulation of fatigue-related stimuli. Future research is needed to assess the interactions between TTF, PTT, and MVIC, and determine whether there is a causal link between these measures under fatiguing conditions where different anchor schemes are used.
It was hypothesized that the STL may explain the similar decreases in MVIC following the fatiguing tasks. However, in the present study, PTT was the only variable that tracked the decrease in MVIC for the RPEFT. Thus, peripheral fatigue must have influenced maximal torque output to some extent following the RPEFT. Because the STL includes the sum feedback and feedforward processes of both physiological and psychological components, it may be that fatigue-induced changes in psychological factors, such as affect (perceived feelings of good or bad), ratings of fatigue, or potential motivation, contributed to the decrease in MVIC for both anchor schemes. Alternatively, other central/peripheral factors, such as voluntary activation, excitability of spinal α-motor neurons, ion permeability, metabolite concentration, Ca2+ binding affinity, or blood pH could have also contributed to the decline in MVIC torque following the RPEFT and TRQFT. Future studies should include measures of perceived factors and/or metabolite concentration (Pi, H+, Na+, and K+), as well as blood pH or muscle oxygenation to assess the interactions between MVIC torque, neuromuscular responses, and PTT during tasks that incorporate different anchor schemes.
The findings of this study were limited to recreationally active, college-aged men. Thus, it is unknown whether the performance and neuromuscular responses to fatigue would be different in similarly fit women or a sample of differently fit men. The current findings indicated a low ICC for the PTT measurements across test visits. Therefore, the current findings should be interpreted with caution. In addition, mechanomyography (MMG) was not used in the current study. Thus, future studies should analyze MMG AMP and MMG MPF to provide inferences regarding motor unit recruitment and the global firing rate of unfused, activated motor units, respectively. Furthermore, it is unknown whether psychological factors, such as mental toughness, ratings of fatigue, and/or motivation, influenced the differences in TTF between anchor schemes, as these were not included in the present study. Moreover, future study designs should include comparisons of muscle groups such as upper versus lower body, unilateral versus bilateral muscle actions, and dynamic muscle actions (concentric vs. eccentric) to assess potential and unique performance responses under different anchor scheme conditions.

4. Materials and Methods

An a priori sample size calculation (G*Power version 3.1.9.7, Düsseldorf, Germany) determined that a minimum of 6 participants were required to demonstrate mean differences between 2 dependent groups using repeated measures ANOVAs, based on an effect size of ηp2 = 0.543 [11], a power of 0.95, and an alpha of 0.05.

4.1. Participants

A total of 15 healthy, recreationally active men volunteered for this study (mean ± SD: age = 21.5 ± 2.3 yrs; height = 183.6 ± 6.7 cm; body mass = 87.2 ± 12.5 kg; aerobic exercise = 3.0 ± 2.9; anaerobic exercise = 4.0 ± 2.3). Recreationally active was defined as participating in aerobic or anaerobic exercise 3 to 5 days per week for at least 30 min per day for the last 6 months [44]. The participants were screened for musculoskeletal, pulmonary, and/or cardiovascular diseases via a Health History Questionnaire [45]. The participants visited the laboratory for an orientation visit and two test visits. All test visits were scheduled at approximately the same time of day and each visit was separated by at least 24 h. In addition, the participants were instructed to avoid upper body exercise for at least 24 h and avoid consumption of caffeine for at least 6 h prior to their test visits. The present study was approved by the University of Nebraska-Lincoln, Institutional Review Board for Human Participants (IRB Approval #: 20240223397FB), and all participants completed a Health History Questionnaire and signed a written Informed Consent Form before any testing.

4.2. Orientation Visit

During the orientation visit, the dominant arm (based on throwing preference), age, height, and body mass of the participants were recorded. Once the demographic information was recorded, the participants were familiarized with and read the standardized instructions for the Omnibus-Resistance Exercise 10-point RPE scale (OMNI-RES) [46,47]. The participants were then oriented to their test position (Figure 5A) on the Biodex System 4 ProTM calibrated isokinetic dynamometer (Biodex Medical Systems, Inc., Shirley, NY, USA), with the lateral epicondyle of the humerus aligned with the lever arm of the dynamometer at an elbow joint angle of 100° (EJ100). All forearm flexion muscle actions were performed at EJ100 to reflect the point in the range of motion that approximated maximal isometric torque production [48]. Furthermore, the participants were familiarized with the peripheral nerve stimulation (PNS) techniques that were used during the test visits. The participants then performed the standardized warm-up consisting of 4 repetitions of 3-s submaximal (~50–75% of their maximal effort), isometric, forearm flexion muscle actions at EJ100, as well as two 3-s isometric, forearm flexion MVICs to set a perceptual anchor corresponding to RPE = 10.

4.3. OMNI-RES Scale Standardized Anchoring Instructions

The anchoring instructions that were used were originally developed by Gearhart et al. [49] as a standardized method to gauge training intensity during lower-body tasks. The instructions were adapted by Keller et al. [50] and used as anchoring instructions during isometric leg extension tasks and have been modified for use during isometric forearm flexion tasks. Therefore, to promote the proper use of the OMNI-RES scale, the following standardized instructions were read to participants during the orientation visit and prior to the sustained, isometric tasks during each test visit: “You will be asked to set an anchor point for both the lowest and highest values on the perceived exertion scale, which are 0 and 10. To set the lowest anchor, you will be asked to lay quietly without contracting your forearm flexor muscles to familiarize yourself with a zero. Following this, you will be asked to perform a maximal, voluntary, isometric contraction to familiarize yourself with a 10. When instructed to match a perceptual value corresponding to the OMNI-RES scale, perceived exertion should be relative to these defined anchors.”

4.4. Testing Visits

During each test visit, the participants were positioned in accordance with the Biodex System IV isokinetic dynamometer user manual, with the lateral epicondyle of the humerus of the dominant arm aligned with the lever arm of the dynamometer at EJ100. Once positioned, the participants performed the standardized warm-up, followed by 1 min of rest, and were again read the standardized OMNI-RES instructions relating to the anchoring procedures. The participants then performed two 3-s forearm flexion MVICs at EJ100 while PNS was applied to the musculocutaneous nerve of the BB during each MVIC (Figure 5B). Following the MVIC trials, the sustained, isometric forearm flexion task anchored to RPE = 6 (OMNI-RES scale) was performed at EJ100 (RPEFT). During the RPEFT, the participants were unaware of torque and elapsed time to avoid pacing strategies [51]. Furthermore, the participants were free to adjust the torque to maintain the prescribed RPE = 6, and task failure was defined as the time point when the torque was reduced to zero. The participants were continuously reminded that there were no incorrect contractions or perceptions and to relate levels of exertion to the previously set anchors of RPE = 0 and RPE = 10. At task failure, the RPEFT was terminated, and TTF was recorded. Immediately after task failure, two 3-s posttest MVICs, with PNS, were performed in a manner identical to the pretest MVICs. After test visit 1 was concluded, the average torque produced during the first 1-s of the RPEFT was determined.
During test visit 2, the positioning on the Biodex System IV isokinetic dynamometer and arm alignment were identical to test visit 1. Once positioned, the participants performed the standardized warm-up, followed by 1 min of rest. The participants then performed two 3-s forearm flexion MVICs at EJ100, with PNS applied to the musculocutaneous nerve. Following the warm-up and MVIC trials, the participants performed a sustained, isometric forearm flexion task anchored to the torque (TRQFT), produced during the first 1-s of the RPEFT (mean ± SD = 65.3 ± 10.2% MVIC). This was performed so that both sustained tasks began at the same torque value associated with RPE = 6. During the TRQFT, the target torque was displayed on a computer screen to allow the participants to track their torque output. The TRQFT was sustained to task failure, which was defined as the point at which the participants could no longer maintain the target torque despite strong verbal encouragement. Immediately after task failure, two 3-s posttest MVICs and PNS were performed in a manner identical to the pretest MVICs.

4.5. Evoked Twitch

Electrical stimuli were delivered to the musculocutaneous nerve of the BB via a constant-current stimulator (Digitimer DS7AH, Hertfordshire, UK). Transcutaneous electrical stimuli were delivered via a high voltage (maximal voltage = 400 V) constant-current stimulator (Digitimer DS7AH, Hertfordshire, UK). The cathode was a disposable adhesive surface electrode (1.5 × 2.5 cm; Neuro Supply, Milford, OH, USA) placed over the musculocutaneous nerve of the BB. The anode was a disposable adhesive surface ground electrode (4 × 5 cm; Neuro Supply, Milford, OH, USA) placed over the distal tendon of the BB. Optimal cathode location was determined by delivering single, low-amperage exploratory stimuli (20 mA) while visually monitoring the twitch torque and compound muscle action potential (M-wave) amplitudes displayed in real time on an external computer screen. Once the location was determined, the skin was marked, and all further stimuli were delivered to that location. Maximal twitch torque and peak-to-peak M-wave amplitude were determined by successive doublet stimuli, applied while systematically increasing the amperage in 10 mA increments until a plateau in twitch torque and peak-to-peak M-wave amplitude was observed after 3 consecutive amperage increases. To ensure a supramaximal stimulus, 130–150% of the stimulus amperage used to determine the plateau was used to evoke the BB muscles with a doublet stimulus (200 ms duration square-wave impulse at 100 Hz). The identified supramaximal stimulus for each individual (150–550 mA) was used during each test visit. During the pretest and posttest MVICs, 2 to 3 s after the muscle action, a potentiated twitch was evoked at rest with doublet stimuli and measured as the PTT (Figure 5B). The PTT with the highest twitch torque from the pretest and posttest MVICs was selected for the analyses.

4.6. Electromyographic and Torque Signal Acquisition

During the experimental visit, bipolar (30-mm center-to-center) EMG electrodes (pregelled Ag/AgCl, AccuSensor; Lynn Medical, Wixom, MI, USA) were attached to the BB at 1/3 of the distance along a line from the cubital fossa to the medial acromion of the dominant arm, based on the recommendations of the Surface Electromyography for the Non-Invasive Assessment of Muscles [52]. A reference electrode was placed on the spinous process of the vertebra prominens (7th cervical vertebrae [C7]). Prior to electrode placement, the skin was shaved, carefully abraded using fine sandpaper material, and cleaned with alcohol.
The raw EMG signal (volts; V) from the BB was sampled at 2000 Hz with a 12-bit analog-to-digital converter (Model MP150; Biopac Systems, Inc., Goleta, CA, USA) and stored on a personal computer (Acer Aspire TC-895-UA91 Acer Inc., San Jose, CA, USA) for the analyses. The EMG signal was then amplified (gain: × 1000) using differential amplifiers (EMG2-R Bionomadix, Biopac Systems, Inc., Goleta, CA, USA; bandwidth—10–500 Hz). Furthermore, the raw torque signal (N·m) was sampled at 2000 Hz from the Biodex System IV dynamometer and digitized with a 12-bit analog-to-digital converter (Model MP150; BIOPAC Systems, Inc., Goleta, CA, USA), amplified (gain: × 1000) using differential amplifiers (EMG2-R Bionomadix, Biopac Systems, Inc., Goleta, CA, USA), and stored on a personal computer (Acer Aspire TC-895-UA91 Acer Inc., San Jose, CA, USA) for the analyses. Time from the EMG, torque, and evoked twitch signals were synchronized by acquisition of the torque signal and evoked twitch signal by connecting the isokinetic dynamometer and constant-current stimulator to the BIOPAC system via the CBL 100 series analog connection cables (CBL 121; BIOPAC Systems, Inc., Goleta, CA, USA) and the BSL CBL7 cable (Biopac Systems, Inc., Goleta, CA, USA), respectively. Each signal was displayed as a separate channel on the AcqKnowledge program (AcqKnowledge 4.2; Biopac Systems, Inc., Goleta, CA, USA). The EMG signal was digitally bandpass filtered (4th order Butterworth) at 10–500 Hz. Signal processing was performed using custom programs written with LabVIEW programming software (version 20.0f1, National Instruments, Austin, TX, USA). For the pretest and posttest MVICs for each of the test visits, a 0.25-s epoch, from the center 1-s of the 3-s MVIC with the greatest torque production (excluding the stimulation), was used to represent the MVIC torque and calculate the AMP (as root mean square, in µVrms) and the MPF (in Hz) for the EMG signal. The MPF was selected to represent the power density spectrum and was calculated as described by Kwatny et al. [53]. The values for the neuromuscular parameters from the posttest MVICs were normalized to the corresponding pretest MVIC values based on the recommendations of Soderberg [26]. The potentiated twitch torque values were identified by the investigator and the epoch of time corresponding to those values was selected.

4.7. Statistical Analyses

The test–retest reliability analyses for the absolute MVIC torque, neuromuscular parameters (EMG AMP and EMG MPF), and PTT were assessed from the pretest MVIC assessments with a repeated measures ANOVA to evaluate systematic error, and a 2.1 model was used to determine the intraclass correlation coefficient (ICC) [23]. The standard error of measurement (SEM) was estimated from the square root of the mean square error from the ANOVA analyses [23]. While various methods are available to estimate the SEM, using the mean square error as opposed to methods utilizing the ICC allows for more consistency in interpreting the SEM across different studies [23]. Furthermore, the coefficient of variation (CV) was calculated as (CV = [SD/ X - ] × 100), where SD is the standard deviation of the sample and X - is the mean of the sample [54]. A dependent t-test was used to examine the mean differences between the fatiguing tasks (RPEFT vs. TRQFT) for TTF. Five separate 2 (Anchor Scheme: RPEFT vs. TRQFT) × 2 (Time: Pretest vs. Posttest) repeated measures ANOVAs were used to assess the mean differences for the absolute pretest versus posttest MVIC torque and PTT values, as well as the normalized (% of pretest MVIC) EMG AMP and EMG MPF values. Follow-up dependent t-tests were performed as necessary. Dependent t-tests were also used to assess the percent change (percent change = ((pretest − posttest)/pretest) × 100) between anchor schemes for MVIC torque, neuromuscular responses (EMG AMP and EMG MPF), and PTT. Partial eta squared (ηp2) and Cohen’s d were used to describe the effect sizes of the ANOVAs and dependent t-tests, respectively. Partial eta squared was interpreted as 0.01 (small), 0.06 (medium), and 0.14 (large) and Cohen’s d was interpreted as 0.01 (small), 0.05 (medium), and 0.8 (large) [55]. All the calculations and statistical analyses were determined using IBM SPSS v. 29 (Armonk, NY, USA). A 95% CI was used for tests of mean differences, a p-value of ≤0.05 was considered statistically significant, and the data were reported as mean ± SD.

5. Conclusions

The purpose of the present study was to investigate whether sustained, isometric tasks using different anchor schemes elicited distinct effects on TTF, muscular performance, neuromuscular responses, and peripheral measures of fatigue. The present findings revealed that despite a significantly longer TTF for the RPEFT than the TRQFT (Figure 2), there were similar decreases in MVIC torque (Figure 3) following the RPEFT and TRQFT, with no differences between anchor schemes for performance fatigability (Table 2). It was speculated that the similar decreases in pretest to posttest MVIC torque and performance fatigability could be explained by participants reaching the same STL as a result of peripheral manifestations of fatigue. There were no changes in EMG AMP or percent change for EMG AMP for either of the fatigue tasks, but there were significant decreases in EMG MPF and percent change for the TRQFT only (Figure 4A,B). Potentiated twitch torque decreased for both the RPEFT and TRQFT (Figure 5A), but the percent change for PTT following the TRQFT was greater than the RPEFT (Figure 5B). Thus, while both anchor schemes elicited similar decreases in MVIC torque, the decline in EMG MPF, as well as the greater percent change for EMG MPF and PTT following the TRQFT, suggested a greater magnitude of peripheral fatigue following a sustained, isometric forearm flexion task anchored to a constant torque rather than RPE. Based on the current findings, in theory, coaches and practitioners can utilize tasks that are autoregulated based on a perceptual intensity or relative intensity and anticipate similar effects on muscular performance. However, if the goal is to enhance metabolic adaptations, employing a relative intensity rather than a perceived intensity may be advantageous when designing programs for unilateral forearm flexion muscle actions.

Author Contributions

Conceptualization, R.W.S. and T.J.H.; methodology, R.W.S., J.E.A., T.D.R., D.G.O. and T.J.H.; software, R.W.S.; validation, R.W.S.; formal analysis, R.W.S. and T.J.H.; resources, T.J.H.; data curation, R.W.S.; writing—original draft preparation, R.W.S.; writing—review and editing, D.J.M., R.J.S., G.O.J. and T.J.H.; visualization, R.W.S.; supervision, T.J.H.; project administration, R.W.S. and T.J.H. All authors have read and agreed to the published version of the manuscript.

Funding

This research received no external funding.

Institutional Review Board Statement

The study was conducted in accordance with the Declaration of Helsinki, and approved by the Institutional Review Board of the University of Nebraska-Lincoln (IRB Approval #: 20240223397FB; date of approval 23 February 2024).

Informed Consent Statement

Informed consent was obtained from all participants involved in the study.

Data Availability Statement

Data can be made available upon request.

Conflicts of Interest

The authors declare no conflicts of interest.

References

  1. Enoka, R.M.; Stuart, D.G. Neurobiology of Muscle Fatigue. J. Appl. Physiol. 1992, 72, 1631–1648. [Google Scholar] [CrossRef]
  2. Kluger, B.M.; Krupp, L.B.; Enoka, R.M. Fatigue and Fatigability in Neurologic Illnesses: Proposal for a Unified Taxonomy. Neurology 2013, 80, 409–416. [Google Scholar] [CrossRef] [PubMed]
  3. Enoka, R.M.; Duchateau, J. Translating Fatigue to Human Performance. Med. Sci. Sports Exerc. 2016, 48, 2228–2238. [Google Scholar] [CrossRef] [PubMed]
  4. Gandevia, S.C. Spinal and Supraspinal Factors in Human Muscle Fatigue. Physiol. Rev. 2001, 81, 1725–1789. [Google Scholar] [CrossRef]
  5. Hureau, T.J.; Broxterman, R.M.; Weavil, J.C.; Lewis, M.T.; Layec, G.; Amann, M. On the Role of Skeletal Muscle Acidosis and Inorganic Phosphates as Determinants of Central and Peripheral Fatigue: A 31 P-MRS Study. J. Physiol. 2022, 600, 3069–3081. [Google Scholar] [CrossRef]
  6. Taylor, J.L.; Gandevia, S.C. A Comparison of Central Aspects of Fatigue in Submaximal and Maximal Voluntary Contractions. J. Appl. Physiol. 2008, 104, 542–550. [Google Scholar] [CrossRef]
  7. De Luca, C.J. Myoelectrical Manifestations of Localized Muscular Fatigue in Humans. Crit. Rev. Biomed. Eng. 1984, 11, 251–279. [Google Scholar]
  8. Semmler, J.G. Motor Unit Synchronization and Neuromuscular Performance. Exerc. Sport Sci. Rev. 2002, 30, 8–14. [Google Scholar] [CrossRef]
  9. Lindstrom, L.; Magnusson, R.; Petersén, I. Muscular Fatigue and Action Potential Conduction Velocity Changes Studied with Frequency Analysis of EMG Signals. Electromyography 1970, 10, 341–356. [Google Scholar]
  10. Place, N. Quantification of Central Fatigue: A Central Debate. Eur. J. Appl. Physiol. 2021, 121, 2375–2376. [Google Scholar] [CrossRef]
  11. Ortega, D.G.; Smith, R.W.; Arnett, J.E.; Neltner, T.J.; Schmidt, R.J.; Johnson, G.O.; Housh, T.J. Are Performance and Perceived Fatigability Dependent on the Anchor Scheme of Fatiguing Isometric Tasks in Men? J. Sports Med. Phys. Fitness 2024, 64, 505–515. [Google Scholar] [CrossRef] [PubMed]
  12. Ortega, D.G.; Housh, T.J.; Smith, R.W.; Arnett, J.E.; Neltner, T.J.; Anders, J.P.V.; Schmidt, R.J.; Johnson, G.O. Fatiguing Joint Angle Does Not Influence Torque and Neuromuscular Responses Following Sustained, Isometric Forearm Flexion Tasks Anchored to Perceptual Intensity in Men. J. Funct. Morphol. Kinesiol. 2023, 8, 114. [Google Scholar] [CrossRef] [PubMed]
  13. Place, N.; Bruton, J.D.; Westerblad, H. Mechanisms of Fatigue Induced by Isometric Contractions in Exercising Humans and in Mouse Isolated Single Muscle Fibres. Clin. Exp. Pharmacol. Physiol. 2009, 36, 334–339. [Google Scholar] [CrossRef] [PubMed]
  14. Alway, S.E.; Hughson, R.L.; Green, H.J.; Patla, A.E.; Frank, J.S. Twitch Potentiation after Fatiguing Exercise in Man. Eur. J. Appl. Physiol. 1987, 56, 461–466. [Google Scholar] [CrossRef]
  15. Bigland-Ritchie, B.; Johansson, R.; Lippold, O.C.; Woods, J.J. Contractile Speed and EMG Changes during Fatigue of Sustained Maximal Voluntary Contractions. J. Neurophysiol. 1983, 50, 313–324. [Google Scholar] [CrossRef]
  16. Neyroud, D.; Rüttimann, J.; Mannion, A.F.; Millet, G.Y.; Maffiuletti, N.A.; Kayser, B.; Place, N. Comparison of Neuromuscular Adjustments Associated with Sustained Isometric Contractions of Four Different Muscle Groups. J. Appl. Physiol. 2013, 114, 1426–1434. [Google Scholar] [CrossRef]
  17. Bülow, P.M.; Nørregaard, J.; Mehlsen, J.; Danneskiold-Samsøe, B. The Twitch Interpolation Technique for Study of Fatigue of Human Quadriceps Muscle. J. Neurosci. Methods 1995, 62, 103–109. [Google Scholar] [CrossRef]
  18. Koo, T.K.; Li, M.Y. A Guideline of Selecting and Reporting Intraclass Correlation Coefficients for Reliability Research. J. Chiropr. Med. 2016, 15, 155–163. [Google Scholar] [CrossRef]
  19. Hill, E.C.; Housh, T.J.; Keller, J.L.; Smith, C.M.; Anders, J.V.; Schmidt, R.J.; Johnson, G.O.; Cramer, J.T. Low-Load Blood Flow Restriction Elicits Greater Concentric Strength than Non-Blood Flow Restriction Resistance Training but Similar Isometric Strength and Muscle Size. Eur. J. Appl. Physiol. 2020, 120, 425–441. [Google Scholar] [CrossRef]
  20. Smith, R.W.; Neltner, T.J.; Anders, J.P.V.; Keller, J.L.; Housh, T.J.; Schmidt, R.J.; Johnson, G.O. Fatigability, Coactivation, and Neuromuscular Responses of the Biceps Brachii and Triceps Brachii Following Sustained, Maximal, Isometric Forearm Flexion to Task Failure. J. Exerc. Physiol. Online 2021, 24, 55–74. [Google Scholar]
  21. Ollivier, K.; Portero, P.; Maïsetti, O.; Hogrel, J.-Y. Repeatability of Surface EMG Parameters at Various Isometric Contraction Levels and during Fatigue Using Bipolar and Laplacian Electrode Configurations. J. Electromyogr. Kinesiol. Off. J. Int. Soc. Electrophysiol. Kinesiol. 2005, 15, 466–473. [Google Scholar] [CrossRef] [PubMed]
  22. Arnett, J.E.; Smith, R.W.; Neltner, T.J.; Anders, J.P.V.; Ortega, D.G.; Housh, T.J.; Schmidt, R.J.; Johnson, G.O. The Effects of Joint Angle and Anchoring Scheme on Performance Fatigability and Neuromuscular Responses Following Isometric Forearm Flexion Tasks to Failure. J. Soc. NeuroSports 2023, 1, 7. [Google Scholar]
  23. Weir, J.P. Quantifying Test-Retest Reliability Using the Intraclass Correlation Coefficient and the SEM. J. Strength Cond. Res. 2005, 19, 231–240. [Google Scholar] [CrossRef] [PubMed]
  24. Halaki, M.; Ginn, K.; Halaki, M.; Ginn, K. Normalization of EMG Signals: To Normalize or Not to Normalize and What to Normalize To? IntechOpen: London, UK, 2012; ISBN 978-953-51-0805-4. [Google Scholar]
  25. Ibitoye, M.O.; Hamzaid, N.A.; Zuniga, J.M.; Hasnan, N.; Wahab, A.K.A. Mechanomyographic Parameter Extraction Methods: An Appraisal for Clinical Applications. Sensors 2014, 14, 22940–22970. [Google Scholar] [CrossRef]
  26. Soderberg, G.L. Selected Topics in Surface Electromyography for Use in the Occupational Setting: Expert Perspectives; Soderberg, G.L., Ed.; U.S. Department of Health and Human Services, Public Health Service, Centers for Disease Control, National Institute for Occupational Safety and Health: Washington, DC, USA, 1992. [Google Scholar]
  27. Allen, G.M.; Gandevia, S.C.; McKenzie, D.K. Reliability of Measurements of Muscle Strength and Voluntary Activation Using Twitch Interpolation. Muscle Nerve 1995, 18, 593–600. [Google Scholar] [CrossRef]
  28. Behrens, M.; Husmann, F.; Gube, M.; Felser, S.; Weippert, M.; Bruhn, S.; Zschorlich, V.; Mau-Moeller, A. Intersession Reliability of the Interpolated Twitch Technique Applied during Isometric, Concentric, and Eccentric Actions of the Human Knee Extensor Muscles. Muscle Nerve 2017, 56, 324–327. [Google Scholar] [CrossRef]
  29. Dutra, Y.M.; Lopes, J.P.F.; Murias, J.M.; Zagatto, A.M. Within- and between-Day Reliability and Repeatability of Neuromuscular Function Assessment in Females and Males. J. Appl. Physiol. 2023, 135, 1372–1383. [Google Scholar] [CrossRef]
  30. Place, N.; Maffiuletti, N.A.; Martin, A.; Lepers, R. Assessment of the Reliability of Central and Peripheral Fatigue after Sustained Maximal Voluntary Contraction of the Quadriceps Muscle. Muscle Nerve 2007, 35, 486–495. [Google Scholar] [CrossRef]
  31. Todd, G.; Gorman, R.B.; Gandevia, S.C. Measurement and Reproducibility of Strength and Voluntary Activation of Lower-Limb Muscles. Muscle Nerve 2004, 29, 834–842. [Google Scholar] [CrossRef]
  32. Rodriguez-Falces, J.; Place, N. Determinants, Analysis and Interpretation of the Muscle Compound Action Potential (M Wave) in Humans: Implications for the Study of Muscle Fatigue. Eur. J. Appl. Physiol. 2018, 118, 501–521. [Google Scholar] [CrossRef]
  33. Dotan, R.; Woods, S.; Contessa, P. On the Reliability and Validity of Central Fatigue Determination. Eur. J. Appl. Physiol. 2021, 121, 2393–2411. [Google Scholar] [CrossRef] [PubMed]
  34. Keller, J.L.; Housh, T.J.; Anders, J.P.V.; Neltner, T.J.; Schmidt, R.J.; Johnson, G.O. Anchor Scheme, Intensity, and Time to Task Failure Do Not Influence Performance Fatigability or Changes in Neuromuscular Responses Following Bilateral Leg Extensions. J. Exerc. Physiol. Online 2020, 23, 119–134. [Google Scholar]
  35. Thomas, K.; Goodall, S.; Howatson, G. Performance Fatigability Is Not Regulated to A Peripheral Critical Threshold. Exerc. Sport Sci. Rev. 2018, 46, 240–246. [Google Scholar] [CrossRef]
  36. Hureau, T.J.; Romer, L.M.; Amann, M. The “Sensory Tolerance Limit”: A Hypothetical Construct Determining Exercise Performance? Eur. J. Sport Sci. 2018, 18, 13–24. [Google Scholar] [CrossRef]
  37. Hartman, M.E.; Ekkekakis, P.; Dicks, N.D.; Pettitt, R.W. Dynamics of Pleasure-Displeasure at the Limit of Exercise Tolerance: Conceptualizing the Sense of Exertional Physical Fatigue as an Affective Response. J. Exp. Biol. 2019, 222, jeb186585. [Google Scholar] [CrossRef]
  38. Tucker, R. The Anticipatory Regulation of Performance: The Physiological Basis for Pacing Strategies and the Development of a Perception-Based Model for Exercise Performance. Br. J. Sports Med. 2009, 43, 392–400. [Google Scholar] [CrossRef]
  39. Vigotsky, A.D.; Halperin, I.; Lehman, G.J.; Trajano, G.S.; Vieira, T.M. Interpreting Signal Amplitudes in Surface Electromyography Studies in Sport and Rehabilitation Sciences. Front. Physiol. 2017, 8, 985. [Google Scholar] [CrossRef]
  40. Allen, D.G.; Lamb, G.D.; Westerblad, H. Skeletal Muscle Fatigue: Cellular Mechanisms. Physiol. Rev. 2008, 88, 287–332. [Google Scholar] [CrossRef]
  41. Bigland-Ritchie, B.; Furbush, F.; Woods, J.J. Fatigue of Intermittent Submaximal Voluntary Contractions: Central and Peripheral Factors. J. Appl. Physiol. 1986, 61, 421–429. [Google Scholar] [CrossRef]
  42. Matkowski, B.; Place, N.; Martin, A.; Lepers, R. Neuromuscular Fatigue Differs Following Unilateral vs Bilateral Sustained Submaximal Contractions. Scand. J. Med. Sci. Sports 2011, 21, 268–276. [Google Scholar] [CrossRef]
  43. Lamb, G.D. Mechanisms of Excitation-Contraction Uncoupling Relevant to Activity-Induced Muscle Fatigue. Appl. Physiol. Nutr. Metab. Physiol. Appl. Nutr. Metab. 2009, 34, 368–372. [Google Scholar] [CrossRef] [PubMed]
  44. McKay, A.K.A.; Stellingwerff, T.; Smith, E.S.; Martin, D.T.; Mujika, I.; Goosey-Tolfrey, V.L.; Sheppard, J.; Burke, L.M. Defining Training and Performance Caliber: A Participant Classification Framework. Int. J. Sports Physiol. Perform. 2022, 17, 317–331. [Google Scholar] [CrossRef] [PubMed]
  45. ACSM. ACSM’s Guidelines for Exercise Testing and Prescription; Lippincott Williams & Wilkins: Philadelphia, PA, USA, 2020; ISBN 978-1-975150-21-1. [Google Scholar]
  46. Lagally, K.M.; Robertson, R.J. Construct Validity of the OMNI Resistance Exercise Scale. J. Strength Cond. Res. 2006, 20, 252–256. [Google Scholar] [CrossRef]
  47. Robertson, R.J.; Goss, F.L.; Rutkowski, J.; Lenz, B.; Dixon, C.; Timmer, J.; Frazee, K.; Dube, J.; Andreacci, J. Concurrent Validation of the OMNI Perceived Exertion Scale for Resistance Exercise. Med. Sci. Sports Exerc. 2003, 35, 333–341. [Google Scholar] [CrossRef]
  48. Kulig, K.; Andrews, J.G.; Hay, J.G. Human Strength Curves. Exerc. Sport Sci. Rev. 1984, 12, 417–466. [Google Scholar] [CrossRef]
  49. Gearhart, R.E.; Goss, F.L.; Lagally, K.M.; Jakicic, J.M.; Gallagher, J.; Robertson, R.J. Standardized Scaling Procedures for Rating Perceived Exertion during Resistance Exercise. J. Strength Cond. Res. 2001, 15, 320–325. [Google Scholar]
  50. Keller, J.L.; Housh, T.J.; Hill, E.C.; Smith, C.M.; Schmidt, R.J.; Johnson, G.O. Neuromuscular Responses of Recreationally Active Women during a Sustained, Submaximal Isometric Leg Extension Muscle Action at a Constant Perception of Effort. Eur. J. Appl. Physiol. 2018, 118, 2499–2508. [Google Scholar] [CrossRef]
  51. Albertus, Y.; Tucker, R.; St Clair Gibson, A.; Lambert, E.V.; Hampson, D.B.; Noakes, T.D. Effect of Distance Feedback on Pacing Strategy and Perceived Exertion during Cycling. Med. Sci. Sports Exerc. 2005, 37, 461–468. [Google Scholar] [CrossRef]
  52. Hermens, H.J.; Freriks, B.; Disselhorst-Klug, C.; Rau, G. Development of Recommendations for SEMG Sensors and Sensor Placement Procedures. J. Electromyogr. Kinesiol. Off. J. Int. Soc. Electrophysiol. Kinesiol. 2000, 10, 361–374. [Google Scholar] [CrossRef]
  53. Kwatny, E.; Thomas, D.H.; Kwatny, H.G. An Application of Signal Processing Techniques to the Study of Myoelectric Signals. IEEE Trans. Biomed. Eng. 1970, 17, 303–313. [Google Scholar] [CrossRef]
  54. Shechtman, O. The Coefficient of Variation as an Index of Measurement Reliability. In Methods of Clinical Epidemiology; Doi, S.A.R., Williams, G.M., Eds.; Springer: Berlin/Heidelberg, Germany, 2013; pp. 39–49. ISBN 978-3-642-37131-8. [Google Scholar]
  55. Cohen, J. Statistical Power Analysis for the Behavioral Sciences, 2nd ed.; Routledge: New York, NY, USA, 1988; ISBN 978-0-203-77158-7. [Google Scholar]
Figure 1. Mean (±SD) time-to-task failure (TTF) for the rating of perceived exertion fatigue task (RPEFT) at RPE = 6 and the torque fatigue task (TRQFT) at the torque produced during the first 1-s of the RPEFT at RPE = 6, respectively. * RPEFT6 (588.2 ± 352.2 s) > TRQFT6 (60.8 ± 21.3 s) at p < 0.001.
Physiologia 05 00015 g001
Figure 2. Mean (±SD) and individual torque values from the pretest and posttest maximal voluntary isometric contraction (MVIC) assessments following the rating of perceived exertion fatigue (RPEFT) task at RPE = 6 and torque fatigue task (TRQFT) at the torque produced during the first 1-s of the RPEFT at RPE = 6, respectively. * Pretest (74.2 ± 12.8 N·m) > Posttest (64.8 ± 13.9 N·m) at p < 0.001 following the RPEFT6. ** Pretest (75.9 ± 12.9 N·m) > Posttest (60.2 ± 10.5 N·m) at p < 0.001 following the TRQFT3.
Physiologia 05 00015 g002
Figure 3. (A) Mean (±SD) and individual normalized electromyographic mean power frequency (EMG MPF) values from the pretest and posttest maximal voluntary isometric contraction (MVIC) assessments following the torque fatigue task (TRQFT) at the torque produced during the first 1-s of the rating of perceived exertion fatigue task (RPEFT) at RPE = 6. (B) Mean (±SD) percent change (%) for EMG MPF from the RPEFT and TRQFT, calculated as ((pretest − posttest)/pretest) × 100. * Pretest (100.0 ± 0.0% MVIC) > Posttest (84.3 ± 10.2% MVIC) at p < 0.001. # Percent change for EMG MPF following the TRQFT (15.7 ± 10.2%) > RPEFT (−1.4 ± 19.3%) at p = 0.011.
Physiologia 05 00015 g003
Figure 4. (A) Mean (±SD) and individual potentiated twitch torque (PTT) values from the pretest and posttest maximal voluntary isometric contraction (MVIC) assessments following the torque fatigue task (TRQFT) at the torque produced during the first 1-s of the ratings of perceived exertion fatigue task (RPEFT) at RPE = 6. (B) Mean (±SD) percent change (%) for PTT from the RPEFT and TRQFT, calculated as ((pretest − posttest)/pretest) × 100. * Pretest (9.3 ± 2.6) > Posttest (7.6 ± 2.7) at p = 0.003 following the RPEFT. ** Pretest (7.8 ± 3.6) > Posttest (3.9 ± 2.0) at p < 0.001 following the TRQFT. # Percent change for PTT following the TRQFT (49.6 ± 16.1%) > RPEFT (17.9 ± 18.5%) at p < 0.001.
Physiologia 05 00015 g004
Figure 5. (A) Experimental setup on Biodex System 4 ProTM calibrated isokinetic dynamometer. (B) Typical torque tracing (thin black line) during the forearm flexion maximal voluntary isometric contractions (MVICs), as well as the high-frequency doublets (100 Hz) and evoked twitch following the MVICs.
Physiologia 05 00015 g005
Table 1. Test–retest reliability analyses for MVIC torque, neuromuscular parameters (EMG AMP and EMG MPF), and PTT values during the pretest forearm flexion MVICs from test visit 1 versus test visit 2.
VariablesTest Visit 1Test Visit 2PICCICC95%SEMCV (%)
MVIC (mean ± SD)
Torque (N∙m)74.2 ± 12.875.9 ± 12.90.4010.8220.588 to 0.9365.4516.9
Neuromuscular Parameters (mean ± SD)
EMG AMP (µVrms)992.7 ± 491.2954.1 ± 553.20.6840.7730.446 to 0.918248.5952.8
EMG MPF (Hz)83.2 ± 17.483.7 ± 15.60.9270.321−0.245 to 0.71213.7719.5
PTT (N∙m)9.3 ± 2.67.8 ± 3.60.1620.256−0.226 to 0.6572.6736.9
Note: P = Alpha from ANOVA for Systematic Error; ICC = Intraclass Correlation Coefficient; ICC95% = ICC 95% Confidence Interval; SEM = Standard Error of Measurement; Coefficient of Variation; MVIC = Maximal Voluntary Isometric Contraction; EMG = Electromyographic; AMP = Amplitude; MPF = Mean Power Frequency; PTT = Potentiated Twitch Torque.
Table 2. Descriptive characteristics for the absolute maximal voluntary isometric contraction (MVIC) torque (N∙m) and percent change (%) values during the pretest and posttest assessments from the rating of perceived exertion fatigue task (RPEFT) at RPE = 6 and the torque fatigue task (TRQFT) at the torque corresponding to the torque produced during the first 1-s of the RPEFT at RPE = 6.
Anchor SchemeRPEFTTRQFT
ParticipantsPretestPosttest%PretestPosttest%
191.781.710.990.472.719.6
275.847.038.074.564.513.5
350.845.111.253.553.00.8
470.966.16.879.951.635.5
579.864.319.572.054.324.6
6103.699.34.289.671.620.0
776.960.421.586.768.121.5
870.071.9−2.776.661.020.3
974.065.211.971.558.318.5
1075.462.716.980.967.416.8
1169.167.52.481.554.732.8
1284.976.210.398.181.716.7
1360.252.213.355.443.721.1
1465.558.410.964.250.321.7
1564.154.115.663.850.021.6
Mean ± SD74.2 ± 12.864.8 ± 13.912.7 ± 9.575.9 ± 12.860.2 ± 10.520.3 ± 7.9
Table 3. Descriptive characteristics for the absolute (µVrms) electromyographic amplitude (EMG AMP) and percent change (%) values from the pretest and posttest assessments during the rating of perceived exertion fatigue task (RPEFT) at RPE = 6 and the torque fatigue task (TRQFT) at the torque corresponding to the torque produced during the first 1-s of the RPEFT at RPE = 6.
Anchor SchemeRPEFTTRQFT
ParticipantsPretestPosttest%PretestPosttest%
1828.7684.617.4502.1799.1−59.2
2817.8778.94.81064.21114.3−4.7
3440.8457.7−3.8639.9847.8−32.5
41478.3924.937.41454.11091.524.9
5857.41037.1−21.0940.6796.915.3
6492.9462.56.21016.4463.254.4
71099.11013.97.7871.51233.7−41.6
8349.8374.2−7.0617.1743.5−20.5
91267.4623.450.81015.21024.1−0.9
101310.8761.041.9791.8683.413.7
11430.0674.8−56.9629.5331.547.3
122223.01977.211.12617.01490.443.1
131267.71088.614.11265.31675.6−32.4
141054.7846.619.7639.2459.428.1
15972.4488.749.7248.1691.2−178.6
Mean ± SD992.7 ± 491.2812.9 ± 392.611.5 ± 28.2954.1 ± 553.2896.4 ± 378.5−9.6 ± 58.1
Table 4. Descriptive characteristics for the absolute (Hz) electromyographic mean power frequency (EMG MPF) and percent change (%) values from the pretest and posttest assessments during the rating of perceived exertion fatigue task (RPEFT) at RPE = 6 and the torque fatigue task (TRQFT) at the torque corresponding to the torque produced during the first 1-s of the RPEFT at RPE = 6.
Anchor SchemeRPEFTTRQFT
ParticipantsPretestPosttest%PretestPosttest%
163.378.7−24.276.757.724.8
263.246.127.172.760.916.2
357.967.6−16.852.857.1−8.1
481.781.50.271.362.612.2
5108.085.121.375.468.49.4
686.067.122.097.374.823.2
787.395.9−9.9111.499.310.8
8106.3119.1−12.1111.773.534.2
978.8113.0−43.392.877.916.1
10112.6116.0−2.976.465.813.9
1190.374.018.076.367.112.1
1282.477.36.282.380.02.8
1396.6101.1−4.778.761.022.5
1469.963.59.186.969.520.1
1564.271.2−10.992.568.925.5
Mean ± SD83.2 ± 17.483.8 ± 21.2−1.4 ± 19.383.7 ± 15.669.6 ± 10.815.7 ± 10.2
Table 5. Descriptive characteristics for the potentiated twitch torque (PTT; N∙m) and percent change (%) values during the pretest and posttest assessments from the rating of perceived exertion fatigue task (RPEFT) at RPE = 6 and the torque fatigue task (TRQFT) at the torque corresponding to the torque produced during the first 1-s of the RPEFT at RPE = 6.
Anchor SchemeRPEFTTRQFT
ParticipantsPretestPosttest%PretestPosttest%
111.39.912.49.55.838.9
29.63.761.57.53.257.3
38.38.7−4.87.3272.6
47.35.820.55.53.340.0
57.77.35.28.13.853.1
68.66.326.75.31.375.5
75.54.714.55.32.847.2
87.76.811.77.52.961.3
99.97.128.36.84.238.2
1012.79.922.04.93.724.5
1114.313.27.7106.634.0
121211.90.811.48.426.3
1355.2−4.051.962.0
149.17.715.418.66.167.2
1510.35.150.552.746.0
Mean ± SD9.3 ± 2.67.6 ± 2.717.9 ± 18.57.8 ± 3.63.9 ± 2.049.6 ± 16.1
Disclaimer/Publisher’s Note: The statements, opinions and data contained in all publications are solely those of the individual author(s) and contributor(s) and not of MDPI and/or the editor(s). MDPI and/or the editor(s) disclaim responsibility for any injury to people or property resulting from any ideas, methods, instructions or products referred to in the content.

