
A New Simple Method for the Determination of Complex Wine Aroma Compounds Using GC-MS/MS—The Case of the Greek Variety “Agiorgitiko”


Abstract
:1. Introduction
2. Materials and Methods
2.1. Wines
2.2. Chemicals and Reagents
2.3. Isolation of Volatiles
2.4. Calibration Curve
2.5. GC-MS/MS Settings
2.6. MS Parameters
2.7. Method Validation
2.7.1. Linearity
2.7.2. Repeatability and Recovery
2.7.3. Reproducibility
2.7.4. Limit of Detection and Limit of Quantification
2.8. Sensory Analysis
3. Results
3.1. Method Development Sample Preparation
MS Parameters
3.2. Method Validation
3.2.1. Linearity
3.2.2. Repeatability—Recovery
3.2.3. Reproducibility
3.2.4. Limit of Detection
3.3. Analysis of Wines
4. Discussion
5. Conclusions
Author Contributions
Funding
Institutional Review Board Statement
Informed Consent Statement
Data Availability Statement
Acknowledgments
Conflicts of Interest
Appendix A

| Name | CAS Registry Number | Molecular Formula | Mr | Purity | Company |
|---|---|---|---|---|---|
| 2-Methoxy-4-methylphenol | 93-51-6 | C8H1002 | 138.16 | 99.6% | Sigma Aldrich (St. Louis, MO, USA) |
| 2-Methoxy-4-vinylphenol | 7786-61-0 | C9H1002 | 150.17 | 99.6% | Sigma Aldrich (St. Louis, MO, USA) |
| 2-Phenethyl acetate | 103-45-7 | C10H1202 | 164.2 | 99.5% | Honeywell Fluka (Charlotte, NC, USA) |
| 2-Phenylethanol | 60-12-8 | C8H120 | 122.16 | 99.3% | Sigma Aldrich (St. Louis, MO, USA) |
| 3-(Methylthio)propionaldehyde | 3268-49-3 | C4H8SO | 104.17 | 97.2% | Sigma Aldrich (St. Louis, MO, USA) |
| 4-Ethylguaiacol | 2785-89-9 | C9H1202 | 152.19 | 98.0% | Sigma Aldrich (St. Louis, MO, USA) |
| 4-Ethylphenol | 123-07-9 | C8H100 | 122.17 | 99.2% | Acros Organics (Geel, Belgium) |
| 4-Vinylphenol solution 10 wt. % | 2628-17-3 | C8H80 | 120.15 | 96.0% | Sigma Aldrich (St. Louis, MO, USA) |
| Acetovanillone | 498-02-2 | C9H1003 | 166.17 | 98.0% | Sigma Aldrich (St. Louis, MO, USA) |
| β-ionone | 79-77-6 | C13H200 | 192.3 | 97.1% | Honeywell Fluka (Charlotte, NC, USA) |
| Benzyl-acetate | 140-11-4 | C9H1002 | 150.17 | 99.9% | Sigma Aldrich (St. Louis, MO, USA) |
| Citral | 5392-40-5 | C10H160 | 152.23 | 96.0% | Sigma Aldrich (St. Louis, MO, USA) |
| Citronellol | 106-22-9 | C10H200 | 156.27 | 95.0% | Acros Organics (Geel, Belgium) |
| Damascenone natural | 23696-85-7 | C13H180 | 190.28 | 1.1–1.4 wt.% | Sigma Aldrich (St. Louis, MO, USA) |
| Decyl aldehyde | 112-31-2 | C10H200 | 156.27 | 98.5% | Acros Organics (Geel, Belgium) |
| Ethyl 2-methylbutyrate | 7452-79-1 | C7H1402 | 130.19 | 99.3% | Acros Organics (Geel, Belgium) |
| Ethyl 3-hydroxybutyrate | 5405-41-4 | C6H1203 | 132.16 | 99.6% | Sigma Aldrich (St. Louis, MO, USA) |
| Ethyl butyrate | 105-54-4 | C6H1202 | 116.16 | ≥98.0% | Honeywell Fluka (Charlotte, NC, USA) |
| Ethyl caproate | 123-66-0 | C8H1602 | 144.21 | 99.7% | Acros Organics (Geel, Belgium) |
| Ethyl caprylate | 106-32-1 | C10H2002 | 172.26 | 99.2% | Sigma Aldrich (St. Louis, MO, USA) |
| Ethyl cinnamate trans | 103-36-6 | CllH1202 | 176.21 | 99.7% | Acros Organics (Geel, Belgium) |
| Ethyl decanoate | 110-38-3 | C12H2402 | 200.32 | 99.7% | Sigma Aldrich (St. Louis, MO, USA) |
| Ethyl dodecanoate | 106-33-2 | C14H2802 | 228.37 | 99.7% | Sigma Aldrich (St. Louis, MO, USA) |
| Ethyl isobutyrate | 97-62-1 | C6H1202 | 116.16 | 99.3% | Honeywell Fluka (Charlotte, NC, USA) |
| Ethyl isovalerate | 108-64-5 | C7H1402 | 130.18 | 99.7% | Honeywell Fluka (Charlotte, NC, USA) |
| Ethyl vanillin | 121-32-4 | C9H1003 | 166.17 | 97.0% | Acros Organics (Geel, Belgium) |
| Eugenol | 97-53-0 | C10H1202 | 164.2 | 99.9% | Acros Organics (Geel, Belgium) |
| Geraniol | 106-24-1 | C10H180 | 154.25 | 99.0% | Acros Organics (Geel, Belgium) |
| Guaiacol | 90-05-1 | C7H802 | 124.14 | 99.5% | Sigma Aldrich (St. Louis, MO, USA) |
| Hexanal | 66-25-1 | C6H120 | 100.16 | ≥97.5% | Sigma Aldrich (St. Louis, MO, USA) |
| Hexylacetate | 142-92-7 | C8H1602 | 144.21 | ≥98.5% | Honeywell Fluka (Charlotte, NC, USA) |
| Isoamyl acetate | 123-92-2 | C7H1402 | 130.19 | ≥99.0% | Acros Organics (Geel, Belgium) |
| Isobutyl acetate | 110-19-0 | C6H1202 | 116.16 | ≥98.5% | Honeywell Fluka (Charlotte, NC, USA) |
| Isoeugenol | 97-54-1 | C10H1202 | 164.2 | 99.3% | Sigma Aldrich (St. Louis, MO, USA) |
| Linalool | 78-70-6 | C10H180 | 154.25 | 98.5% | Acros Organics (Geel, Belgium) |
| Rose oxide | 16409-43-1 | C10H180 | 154.25 | 99.9% | Honeywell Fluka (Charlotte, NC, USA) |
| Thymol | 89-83-8 | C10H140 | 150.22 | 99.9% | Sigma Aldrich (St. Louis, MO, USA) |
| Vanillin | 121-33-5 | C8H803 | 152.15 | 99.5% | Acros Organics (Geel, Belgium) |
| Whiskey lactone | 39212-23-2 | C9H1602 | 156.22 | 99.4% | Sigma Aldrich (St. Louis, MO, USA) |
References
- International Organisation of Vine and Wine. State of the World Vitivinicultural Sector in 2022. Available online: https://www.oiv.int/sites/default/files/documents/OIV_State_of_the_world_Vine_and_Wine_sector_in_2022_2.pdf (accessed on April 2023).
- Lattey, K.A.; Bramley, B.R.; Francis, I.L. Consumer acceptability, sensory properties and expert quality judgements of Australian Cabernet Sauvignon and Shiraz wines. Aust. J. Grape Wine Res. 2010, 16, 189–202. [Google Scholar] [CrossRef]
- Mezei, L.V.; Johnson, T.E.; Goodman, S.; Collins, C.; Bastian, S.E.P. Meeting the demands of climate change: Australian consumer acceptance and sensory profiling of red wines produced from non-traditional red grape varieties. OENO One 2021, 55, 29–46. [Google Scholar] [CrossRef]
- Pozo-Bayón, M.A.; Muñoz González, C.; Esteban-Fernández, A. Chapter 7. In Wine Safety, Consumer Preference, and Human Health; Victoria Moreno-Arribas, M., Suáldea, B.B., Eds.; Springer: Cham, Switzerland, 2016; pp. 51–69. [Google Scholar] [CrossRef]
- Bruwer, J.; Saliba, A.; Miller, B. Consumer behaviour and sensory preference differences: Implications for wine product marketing. J. Consum. Mark. 2011, 28, 5–18. [Google Scholar] [CrossRef]
- Ristic, R.; Danner, L.; Johnson, T.E.; Meiselman, H.L.; Hoek, A.C.; Jiranek, V.; Bastian, S.E.P. Wine-related aromas for different seasons and occasions: Hedonic and emotional responses of wine consumers from Australia, UK and USA. Food Qual. Prefer. 2018, 71, 250–260. [Google Scholar] [CrossRef]
- Pereira, A.G.; Fraga, M.; Paula, G.O.; Carpena, M.; Jimenez-Lopez, C.; Lourenço-Lopes, C.; Barros, L.; CFR Ferreira, I.; Prieto, M.A.; Simal-Gandara, J. Management of Wine Aroma Compounds: Principal Basis and Future Perspectives, Winemaking—Stabilization. In Chemistry and Biochemistry of Winemaking, Wine Stabilization and Aging; IntechOpen: London, UK, 2020. [Google Scholar] [CrossRef]
- Hernandez-Orte, P.; Cersosimo, M.; Loscos, N.; Cacho, J.; Garcia-Moruno, E.; Ferreira, V. The development of varietal aroma from non-floral grapes by yeasts of different genera. Food Chem. 2008, 107, 1064–1077. [Google Scholar] [CrossRef]
- Swiegers, J.H.; Bartowsky, E.J.; Henschke, P.A.; Pretorius, I.S. Yeast and bacterial modulation of wine aroma and flavour. Aust. J. Grape Wine Res. 2008, 11, 139–173. [Google Scholar] [CrossRef]
- Francis, I.L.; Newton, J.L. Determining wine aroma from compositional data. Aust. J. Grape Wine Res. 2005, 11, 114–126. [Google Scholar] [CrossRef]
- Hernandez-Orte, P.; Ibarz, M.J.; Cacho, J.; Ferreira, V. Effect of the addition of ammonium and amino acids to musts of Airen variety on aromatic composition and sensory properties of the obtained wine. Food Chem. 2005, 89, 163–174. [Google Scholar] [CrossRef]
- Styger, G.; Prior, B.; Bauer, F.F. Wine flavor and aroma. J. Ind. Microbiol. Biotechnol. 2011, 38, 1145–1159. [Google Scholar] [CrossRef] [PubMed]
- Jarauta, I.; Cacho, J.; Ferreira, V. Concurrent Phenomena Contributing to the Formation of the Aroma of Wine during Aging in Oak Wood: An Analytical Study. J. Agric. Food Chem. 2005, 53, 4166–4177. [Google Scholar] [CrossRef] [PubMed]
- Chira, K.; González-Centeno, M.R.; Teissedre, P.L. Wine Ageing in Oak Barrel: Effect of Toasting Process. Agri. Res. Tech. OpenAccess J. 2017, 12, 555847. [Google Scholar] [CrossRef]
- Fresno, J.M.D.; Morata, A.; Loira, I.; Escott, C. Evolution of the Phenolic Fraction and Aromatic Profile of Red Wines Aged in Oak Barrels. ACS Omega 2020, 5, 7235–7243. [Google Scholar] [CrossRef] [PubMed]
- Holmberg, L. Wine fraud. Int. J. Wine Res. 2010, 2, 105–113. [Google Scholar] [CrossRef]
- Villano, C.; Lisanti, M.T.; Gambuti, A.; Vecchio, R.; Moio, L.; Frusciante, L.; Aversano, R.; Carputo, D. Wine varietal authentication based on phenolics, volatiles and DNA markers: State of the art, perspectives and drawbacks. Food Control 2017, 80, 1–10. [Google Scholar] [CrossRef]
- Valentin, L.; Barroso, L.P.; Barbosa, R.M.; Paulo, G.A.D.; Castro, I.A. Chemical typicality of South American red wines classified according to their volatile and phenolic compounds using multivariate analysis. Food Chem. 2020, 302, 125340. [Google Scholar] [CrossRef] [PubMed]
- Schüttler, A.; Friedel, M.; Jung, R.; Rauhut, D. Characterizing aromatic typicality of Riesling wines: Merging volatile compositional and sensory aspects. Food Res. Int. 2015, 69, 26–37. [Google Scholar] [CrossRef]
- García-Carpintero, E.G.; Sánchez-Palomo, E.; Gallego, M.A.G.; González-Viñas, M.A. Free and bound volatile compounds as markers of aromatic typicalness of Moravia Dulce, Rojal and Tortosv red wines. Food Chem. 2012, 131, 90–98. [Google Scholar] [CrossRef]
- Fabani, M.P.; Ravera, M.J.; Wunderlin, D.A. Markers of typical red wine varieties from the Valley of Tulum. Food Chem. 2013, 141, 1055–1062. [Google Scholar] [CrossRef] [PubMed]
- Parr, W.V.; Green, J.A.; White, K.G.; Sherlock, R.R. The distinctive flavour of New Zealand Sauvignon blanc: Sensory characterisation by wine professionals. Food Qual. Prefer. 2007, 18, 849–861. [Google Scholar] [CrossRef]
- Stupak, M.; Goodall, I.; Tomaniova, M.; Pulkrabova, J.; Hajslova, J. A novel approach to assess the quality and authenticity of Scotch Whisky based on gas chromatography coupled to high resolution mass spectrometry. Anal. Chim. Acta 2018, 1042, 60–70. [Google Scholar] [CrossRef]
- Lukić, I.; Carlin, S.; Vrhovsek, U. Comprehensive 2D Gas Chromatography with TOF-MS Detection Confirms the Matchless Discriminatory Power of Monoterpenes and Provides In-Depth Volatile Profile Information for Highly Efficient White Wine Varietal Differentiation. Foods 2020, 9, 17–87. [Google Scholar] [CrossRef] [PubMed]
- Ziółkowska, A.; Wąsowicz, E.; Jeleń, H.H. Differentiation of wines according to grape variety and geographical origin based on volatiles profiling using SPME-MS and SPME-GC/MS methods. Food Chem. 2016, 213, 714–720. [Google Scholar] [CrossRef] [PubMed]
- Barrio-Galán, R.D.; Valle-Herrero, H.D.; Bueno-Herrera, M.; López-De-La-Cuesta, P.; Pérez-Magariño, S. Volatile and Non-Volatile Characterization of White and Rosé Wines from Different Spanish Protected Designations of Origin. Beverages 2021, 7, 49. [Google Scholar] [CrossRef]
- Ivanova, V.; Stefova, M.; Stafilov, T.; Vojnoski, B.; Bíró, I.; Bufa, A.; Kilár, F. Validation of a Method for Analysis of Aroma Compounds in Red Wine using Liquid–Liquid Extraction and GC–MS. Food Anal. Methods 2012, 5, 1427–1434. [Google Scholar] [CrossRef]
- Mayr, C.M.; Capone, D.L.; Pardon, K.H.; Black, C.A.; Pomeroy, D.; Francis, I.L. Quantitative Analysis by GC-MS/MS of 18 Aroma Compounds Related to Oxidative Off-Flavor in Wines. J. Agric. Food Chem 2015, 63, 3394–3401. [Google Scholar] [CrossRef] [PubMed]
- Arcari, S.G.; Caliari, V.; Sganzerla, M.; Godoy, H.T. Volatile composition of Merlot red wine and its contribution to the aroma: Optimization and validation of analytical method. Helena Teixeira Godoy 2017, 174, 752–766. [Google Scholar] [CrossRef] [PubMed]
- Marquez, A.; Serratosa, M.P.; Merida, J.; Zea, L.; Moyano, L. Optimization and validation of an automated DHS-TD-GC-MS method for the determination of aromatic esters in sweet wines. Talanta 2014, 123, 32–40. [Google Scholar] [CrossRef] [PubMed]
- Liu, Z.; Ezernieks, V.; Reddy, P.; Elkins, A.; Krill, C.; Murphy, K.; Rochfort, S.; Spangenberg, G. A Simple GC-MS/MS Method for Determination of Smoke Taint-Related, Volatile Phenols in Grapes. Metabolites 2020, 10, 294. [Google Scholar] [CrossRef] [PubMed]
- ELOT EN ISO 8586:2012; Sensory Analysis—General Guidelines for the selection, training and monitoring of selected assessors and expert sensory assessors. International Organization for Standardization: Geneva, Switzerland, 2012.
- ELOT EN ISO 5496:2006; Sensory Analysis—Methodology—Initiation and Training of Assessors in the Detection and Recognition of Odours. International Organization for Standardization: Geneva, Switzerland, 2006.
- ELOT EN ISO 8589:2012; Sensory Analysis—General Guidelines for the Design of Test Rooms. International Organization for Standardization: Geneva, Switzerland, 2012.
- European Accreditation. Accreditation for Sensory Testing Laboratories. EA-4/09; European Accreditation: Paris, France, 2003. [Google Scholar]
- Antia, G.; Pereira, M.; Fraga, P.; Garcia-Oliveira, M.; Carpena, C.; Jimenez-Lopez, C.; Lourenço-Lopes, L.; Barros, L.; Isabel, C.F.R.; Ferreira, M.A.; et al. Management of Wine Aroma Compounds: Principal Basis and Future Perspectives. In Chemistry and Biochemistry of Winemaking, Wine Stabilization and Aging; IntechOpen: London, UK, 2020. [Google Scholar] [CrossRef]
- Ferreira, V.; Lopez, R.; Cacho, J.F. Quantitative determination of the odorants of young red wines from different grape varieties. J. Sci. Food Agric. 2000, 80, 1659–1667. [Google Scholar] [CrossRef]
- López, R.; Ortín, N.; Pérez-Trujillo, J.P.; Cacho, J.; Ferreira, V. Impact odorants of different young white wines from the Canary Islands. J. Sci. Food Agric. 2003, 51, 3419–3425. [Google Scholar] [CrossRef]
- Campo, E.; Ferreira, V.; Escudero, A.; Marqués, J.C.; Cacho, J. Quantitative gas chromatography-olfactometry and chemical quantitative study of the aroma of four Madeira wines. Anal. Chim. Acta 2006, 563, 180–187. [Google Scholar] [CrossRef]
- Noguerol-Pato, R.; González-Barreiro, C.; Cancho-Grande, B.; Simal-Gándara, J. Quantitative determination and characterization of the main odourants of Mencía monovarietal red wines. Food Chem. 2009, 117, 473–484. [Google Scholar] [CrossRef]
- Vázquez-Pateiro, I.; Arias-González, U.; Mirás-Avalos, J.M.; Falqué, E. Evolution of the Aroma of Treixadura Wines during Bottle Aging. Foods 2020, 9, 1419. [Google Scholar] [CrossRef] [PubMed]
- De-La-Fuente-Blanco, A.; Sáenz-Navajas, M.P.; Valentin, D.; Ferreira, V. Fourteen ethyl esters of wine can be replaced by simpler ester vectors without compromising quality but at the expense of increasing aroma concentration. Food Chem. 2020, 307, 125553. [Google Scholar] [CrossRef] [PubMed]
- Renault, P.; Coulon, J.; de Revel, G.; Barbe, J.C.; Bely, M. Increase of fruity aroma during mixed T. delbrueckii/S. cerevisiae wine fermentation is linked to specific esters enhancement. Int. J. Food Microbiol. 2015, 207, 40–48. [Google Scholar] [CrossRef] [PubMed]
- Rocha, S.M.; Rodrigues, F.; Coutinho, P.; Delgadillo, I.; Coimbra, M.A. Volatile composition of Baga red wine: Assessment of the identification of the would-be impact odourants. Anal. Chim. Acta 2004, 513, 257–262. [Google Scholar] [CrossRef]


| Concentration LEVEL | 10 μg/L | 500 μg/L | 500 μg/L | ||||||||
|---|---|---|---|---|---|---|---|---|---|---|---|
| Compound | % Recovery | s | RSD % | % Recovery | s | RSD % | Uncertainty of Combined Reproducibility | Uncertainty in Level of Confidence 95% (k = 2) | LOQ (μg/L) | LOD (μg/L) | R2 |
| 2-methoxy-4-methyl phenol | 87.8 | 10.0 | 11.3 | 109.4 | 14.4 | 13.2 | 7.9 | 15.8 | 0.05 | 0.015 | 0.9954 |
| 2-methoxy-4-vinylphenol | 108.0 | 13.1 | 12.1 | 97.2 | 15.3 | 15.8 | 9.5 | 19 | 0.05 | 0.015 | 0.9992 |
| 2-phenyl-ethanol | 92.3 | 13.4 | 14.5 | 81.2 | 5.2 | 6.4 | 17 | 34 | 1 | 0.3 | 0.9993 |
| 2-phenyl-ethyl-acetate | 88.8 | 20.0 | 22.5 | 119.7 | 5.1 | 4.2 | 16.3 | 32.6 | 0.05 | 0.015 | 0.9948 |
| 3-methylthio-propionaldehyde | 109.3 | 11.8 | 10.8 | 110.7 | 10.3 | 9.3 | 8.7 | 17.4 | 0.5 | 0.15 | 0.9996 |
| 4-vinyl-phenol | 94.9 | 15.3 | 16.1 | 92.3 | 7.4 | 8.0 | 8.4 | 16.8 | 5 | 1.5 | 0.9986 |
| Acetovanillone | 90.9 | 8.6 | 9.5 | 106.7 | 7.5 | 7.0 | 9.5 | 19 | 0.05 | 0.015 | 0.9995 |
| β-Ionone | 111.2 | 5.1 | 5.5 | 182.6 | 29.6 | 16.2 | 16.6 | 33.2 | 0.1 | 0.03 | 0.9885 |
| Benzyl-acetate | 94.3 | 13.0 | 13.8 | 111.2 | 9.7 | 8.7 | 6.2 | 12.4 | 0.1 | 0.03 | 0.9997 |
| Citral | 92.8 | 13.3 | 14.3 | 94.1 | 8.2 | 8.7 | 36.2 | 72.4 | 5 | 1.5 | 0.9937 |
| Citronellol | 95.3 | 12.6 | 13.2 | 102.7 | 10.3 | 10.0 | 7.4 | 14.8 | 1 | 0.3 | 0.9912 |
| Damascenone | 96.8 | 17.4 | 18.0 | 112.7 | 11.1 | 9.8 | 5 | 10 | 5 | 1.5 | 0.9963 |
| Decyl-aldehyde | 92.0 | 18.7 | 20.3 | 96.3 | 8.6 | 9.0 | 12.7 | 25.4 | 1 | 0.3 | 0.9974 |
| Ethyl-2-methyl butyrate | 112.7 | 13.6 | 12.1 | 114.8 | 9.0 | 7.9 | 7.5 | 15 | 0.05 | 0.015 | 0.9975 |
| Ethyl-3-hydroxybutyrate | 115.9 | 5.0 | 4.3 | 110.8 | 9.0 | 8.2 | 5.3 | 10.6 | 0.1 | 0.03 | 0.9979 |
| Ethyl -butyrate | 113.4 | 5.2 | 4.6 | 111.3 | 7.7 | 6.9 | 6.3 | 12.6 | 0.5 | 0.15 | 0.9962 |
| Ethyl -caproate | 109.4 | 4.7 | 4.3 | 107.3 | 9.7 | 9.0 | 5.3 | 10.6 | 0.05 | 0.015 | 0.9939 |
| Ethyl-caprylate | 109.4 | 5.9 | 5.4 | 110.2 | 4.2 | 3.8 | 7.2 | 14.4 | 0.1 | 0.03 | 0.9972 |
| Ethyl-cinnamate | 89.2 | 10.2 | 11.5 | 106.3 | 13.1 | 12.4 | 6.7 | 13.4 | 0.1 | 0.03 | 0.9969 |
| Ethyl-decanoate | 111.3 | 7.1 | 6.4 | 115.9 | 4.1 | 3.5 | 12.9 | 25.8 | 0.05 | 0.015 | 0.9889 |
| Ethyl-dodecanoate | 88.6 | 15.8 | 17.8 | 110.9 | 7.3 | 6.6 | 15.1 | 30.2 | 0.05 | 0.015 | 0.9968 |
| Ethyl-guaiacol | 89.7 | 10.2 | 11.4 | 104.7 | 7.2 | 6.9 | 14.1 | 28.2 | 0.5 | 0.15 | 0.9978 |
| Ethyl-isobutyrate | 114.0 | 9.3 | 8.2 | 115.7 | 5.7 | 5.0 | 14.2 | 28.4 | 1 | 0.3 | 0.9972 |
| Ethyl-isovalerate | 102.1 | 13.0 | 12.8 | 91.3 | 6.7 | 7.3 | 6.7 | 13.4 | 1 | 0.3 | 0.9895 |
| Ethyl-phenol | 87.6 | 15.6 | 17.8 | 90.7 | 11.6 | 12.8 | 6 | 12 | 0.1 | 0.03 | 0.997 |
| Ethyl-vanillin | 101.3 | 12.8 | 12.7 | 112.4 | 9.7 | 8.7 | 8.3 | 16.6 | 0.1 | 0.03 | 0.9991 |
| Eugenol | 93.2 | 10.0 | 10.7 | 100.8 | 8.7 | 8.6 | 7.6 | 15.2 | 0.5 | 0.15 | 0.9999 |
| Geraniol | 99.7 | 13.7 | 13.8 | 103.0 | 4.6 | 4.5 | 10.8 | 21.6 | 1 | 0.3 | 0.9936 |
| Guaiacol | 98.9 | 10.3 | 10.4 | 111.8 | 4.2 | 3.8 | 7.2 | 14.4 | 0.05 | 0.015 | 0.998 |
| Hexanal | 94.2 | 18.4 | 19.5 | 112.1 | 8.7 | 7.8 | 9.3 | 18.6 | 1 | 0.3 | 0.9979 |
| Hexyl-acetate | 93.5 | 7.9 | 8.5 | 105.8 | 7.7 | 7.3 | 4.8 | 9.6 | 1 | 0.3 | 0.9995 |
| Isoamyl-acetate | 103.2 | 19.5 | 18.8 | 103.7 | 12.7 | 12.3 | 9.7 | 19.4 | 1 | 0.3 | 0.9998 |
| Isobutyl-acetate | 112.5 | 9.5 | 8.5 | 105.8 | 8.1 | 7.7 | 11.4 | 22.8 | 1 | 0.3 | 0.9997 |
| Isoeugenol | 84.6 | 7.2 | 8.6 | 102.9 | 6.8 | 6.6 | 9.2 | 18.4 | 1 | 0.3 | 0.9991 |
| Linalool | 93.4 | 13.1 | 14.0 | 111.5 | 8.2 | 7.3 | 4.2 | 8.4 | 1 | 0.3 | 0.9988 |
| Rose oxide | 93.8 | 17.0 | 18.2 | 108.6 | 8.4 | 7.7 | 4.2 | 8.4 | 1 | 0.3 | 0.9827 |
| Thymol | 86.9 | 17.0 | 19.5 | 110.9 | 10.3 | 9.3 | 5.3 | 10.6 | 0.1 | 0.03 | 0.9968 |
| Vanillin | 94.6 | 18.0 | 19.0 | 102.8 | 13.1 | 12.8 | 10.4 | 20.8 | 0.1 | 0.03 | 0.9997 |
| trans-Whiskey lactone | 95.2 | 15.6 | 16.4 | 108.1 | 5.2 | 4.8 | 14.2 | 28.4 | 0.5 | 0.15 | 0.9988 |
| cis-Whiskey lactone | 98.8 | 19.4 | 19.7 | 102.8 | 12.1 | 11.8 | 13.1 | 26.2 | 0.5 | 0.15 | 0.9915 |
| Name | Mr | Q1 | Q3 | CE | tR |
|---|---|---|---|---|---|
| 2-methoxy-4-methyl phenol | 138.16 | 123.18 | 94.88 | 5 | 19.39 |
| 2-methoxy-4-methyl phenol | 138.16 | 123.18 | 67.08 | 5 | 19.39 |
| 2-methoxy-4-vinyl phenol | 150.17 | 135.24 | 77.1 | 15 | 21.94 |
| 2-methoxy-4-vinyl phenol | 150.17 | 135.24 | 107.03 | 15 | 21.94 |
| 2-Phenethyl-acetate | 164.2 | 104.28 | 78.04 | 15 | 20.74 |
| 2-Phenethyl-acetate | 164.2 | 104.28 | 103.02 | 15 | 20.74 |
| 2-Phenyl-ethanol | 122.16 | 91.12 | 65.06 | 15 | 17.67 |
| 2-Phenyl-ethanol | 122.16 | 91.12 | 63.3 | 15 | 17.67 |
| 3-Methylthio propionaldehyde | 104.17 | 76.08 | 61.12 | 5 | 12.32 |
| 3-Methylthio propionaldehyde | 104.17 | 76.08 | 48.06 | 5 | 12.32 |
| 4-vinyl phenol | 120.15 | 91.2 | 65.06 | 15 | 19.9 |
| 4-vinyl phenol | 120.15 | 91.2 | 50.67 | 15 | 19.9 |
| Acetovanillone | 166 | 150.95 | 107.92 | 15 | 21.7 |
| Acetovanillone | 166 | 150.95 | 122.97 | 15 | 21.7 |
| Acetovanillone | 166 | 150.95 | 76.99 | 15 | 21.7 |
| β-ionone | 192.3 | 177.53 | 162.18 | 15 | 24.8 |
| β-ionone | 192.3 | 177.53 | 147.16 | 15 | 24.8 |
| Benzyl-acetate | 150.17 | 108.18 | 107.09 | 5 | 18.76 |
| Benzyl-acetate | 150.17 | 108.18 | 79.13 | 5 | 18.76 |
| Citral | 152.23 | 94.21 | 79.18 | 10 | 21 |
| Citral | 152.23 | 94.21 | 77.14 | 10 | 21 |
| Citronellol | 156.07 | 82.25 | 67.12 | 5 | 20.12 |
| Citronellol | 156.07 | 8225 | 65.09 | 5 | 20.12 |
| Damascenone | 190.28 | 121.35 | 105.32 | 5 | 23.32 |
| Damascenone | 190.28 | 121.35 | 118.86 | 5 | 23.32 |
| Decyl-aldehyde | 156.27 | 82.36 | 67.06 | 5 | 19.7 |
| Decyl-aldehyde | 156.27 | 82.36 | 65.14 | 5 | 19.7 |
| Ethyl-2-methyl butyrate | 130.19 | 102.25 | 73.6 | 5 | 10.62 |
| Ethyl-2-methyl butyrate | 130.19 | 102.25 | 74.34 | 5 | 10.62 |
| Ethyl-3-hydroxybutyrate | 13216 | 88.13 | 60.09 | 5 | 13.08 |
| Ethyl-3-hydroxybutyrate | 132.16 | 88.13 | 60.76 | 5 | 13.08 |
| Ethyl-butyrate | 116.16 | 88.13 | 73.05 | 5 | 9.1 |
| Ethyl-butyrate | 116.16 | 88.13 | 61.14 | 5 | 9.1 |
| Ethyl-Caproate | 144.21 | 87.94 | 60.05 | 5 | 11.66 |
| Ethyl-Caproate | 144.21 | 87.94 | 61.02 | 5 | 11.66 |
| Ethyl-caprylate | 172.3 | 87.94 | 59.98 | 5 | 19.45 |
| Ethyl-caprylate | 172.3 | 87.94 | 61.04 | 5 | 19.45 |
| Ethyl-cinnamate | 176.2 | 130.98 | 102.95 | 5 | 21.36 |
| Ethyl-cinnamate | 176.2 | 130.98 | 76.99 | 5 | 21.36 |
| Ethyl-cinnamate | 176.2 | 130.98 | 90.95 | 5 | 21.36 |
| Ethyl-decanoate | 200.3 | 87.94 | 59.97 | 5 | 23.42 |
| Ethyl-decanoate | 200.3 | 87.94 | 61.05 | 5 | 23.42 |
| Ethyl-dodecanoate | 228.4 | 87.94 | 60.01 | 5 | 25.77 |
| Ethyl-dodecanoate | 228.4 | 87.94 | 60.98 | 5 | 25.77 |
| Ethyl-guaiacol | 152.19 | 137.3 | 122.04 | 5 | 21.19 |
| Ethyl-guaiacol | 152.19 | 137.3 | 94.01 | 5 | 21.19 |
| Ethyl-isobutyrate | 116.16 | 116.16 | 73.08 | 5 | 7.8 |
| Ethyl-isobutyrate | 116.16 | 116.16 | 88.24 | 5 | 7.8 |
| Ethyl-isovalerate | 130.18 | 88.18 | 60.02 | 5 | 10.74 |
| Ethyl-isovalerate | 130.18 | 88.18 | 55.01 | 5 | 10.74 |
| Ethyl-phenol | 122.17 | 106.95 | 77 | 15 | 15.56 |
| Ethyl-phenol | 12217 | 106.95 | 78.99 | 15 | 15.56 |
| Ethyl-vanillin | 166.2 | 136.91 | 108.93 | 5 | 21.15 |
| Ethyl-vanillin | 166.2 | 136.91 | 80.97 | 5 | 21.15 |
| Eugenol | 164.2 | 164.01 | 148.98 | 5 | 19.24 |
| Eugenol | 164.2 | 164.01 | 130.97 | 5 | 19.24 |
| Eugenol | 164.2 | 164.01 | 120.96 | 5 | 19.24 |
| Geraniol | 154.25 | 93.22 | 72.25 | 5 | 20.63 |
| Geraniol | 154.25 | 93.22 | 91.07 | 5 | 20.63 |
| Guaiacol | 124.1 | 108.91 | 80.97 | 5 | 13.7 |
| Guaiacol | 124.1 | 108.91 | 53.03 | 5 | 13.7 |
| Hexanal | 100.16 | 56.07 | 41.15 | 5 | 9.08 |
| Hexanal | 100.16 | 56.07 | 39.29 | 5 | 9.08 |
| Hexyl-acetate | 144.2 | 83.94 | 54.93 | 5 | 15.2 |
| Hexyl-acetate | 144.2 | 83.94 | 56.15 | 5 | 15.2 |
| Isoamyl-acetate | 130.19 | 70.02 | 55.05 | 5 | 8.61 |
| Isoamyl-acetate | 130.19 | 70.02 | 53.06 | 5 | 8.61 |
| Isobutyl-acetate | 116.16 | 73.15 | 43.15 | 5 | 8.27 |
| Isobutyl-acetate | 116.16 | 56.09 | 41.24 | 5 | 8.27 |
| Isoeugenol | 164.2 | 164 | 148.98 | 5 | 21.03 |
| Isoeugenol | 164.2 | 164 | 130.94 | 5 | 21.03 |
| Isoeugenol | 164.2 | 164 | 120.95 | 5 | 21.03 |
| Linalool | 154.25 | 93.23 | 77.05 | 5 | 17.32 |
| Linalool | 154.25 | 93.23 | 91.03 | 5 | 17.32 |
| Rose oxide | 154.25 | 69.11 | 41.23 | 5 | 18 |
| Rose oxide | 154.25 | 69.11 | 65.29 | 5 | 18 |
| Thymol | 150.22 | 135.34 | 91.03 | 15 | 21.45 |
| Thymol | 150.22 | 135.34 | 115.06 | 15 | 21.45 |
| Vanillin | 120.15 | 151.97 | 150.97 | 10 | 20.25 |
| Vanillin | 120.15 | 151.97 | 122.92 | 10 | 20.25 |
| Whiskey lactone | 156.22 | 99.03 | 71.06 | 5 | 18 |
| Whiskey lactone | 156.22 | 99.03 | 41.18 | 5 | 18 |
| Whiskey lactone | 156.22 | 114.16 | 71.06 | 5 | 18 |
| Phenol | 94.11 | 94.10 | 66.10 | 10 | 13.4 |
| Compound | Range of Concentration (μg/L) | Average (μg/L) | Odor Threshold (μg/L) |
|---|---|---|---|
| 2-phenyl-ethanol | 8073–94,723 | 41,076 | 14,000 |
| Acetates | |||
| 2-phenyl-ethyl-acetate | 9.6–125 | 37.2 | 250 |
| Isoamyl-acetate | 103–1490 | 356 | 30 |
| Isobutyl-acetate | 14.2–78.3 | 39.7 | 1600 |
| Total acetates | 121–1692 | 422 | |
| Esters | |||
| Ethyl-2-methylbutyrate | 10.6–54.1 | 22.7 | 18 |
| Ethyl-3-hydroxybutyrate | 167–612 | 399 | 20,000 |
| Ethyl-butyrate | 52.7–324 | 136 | 20 |
| Ethyl-caproate | 60.2–352 | 160 | 14 |
| Ethyl-caprylate | 45.6–276 | 137 | 5 |
| Ethyl-decanoate | 9.3–115 | 32.8 | 200 |
| Ethyl-dodecanoate | 9.0–10.2 | 9.6 | 800 |
| Ethyl-isobutyrate | 38–345 | 142 | 15 |
| Ethyl-isovalerate | 11.1–114 | 39.1 | 3 |
| Total esters | 372–1892 | 1036 | |
| Oak Compounds | |||
| Acetovanillone | 26.4–85.8 | 61.6 | 1000 |
| Ethyl-guaiacol | 14.1–89.4 | 39.8 | 33 |
| Vanillin | 16.2–276 | 80.8 | 200 |
| trans-Whiskey lactone | 20.1–208 | 93.1 | 67 |
| cis-Whiskey lactone | 20.8–746 | 244 | 790 |
| Total “Oak” Compounds | 26–1176 | 479 | |
| Phenols | |||
| 2-methoxy-4-vinylphenol | 21.7–963 | 53.4 | 40 |
| 4-vinyl-phenol | 41.4–1119 | 269 | 180 |
| Ethyl-phenol | 20.9–228 | 87.8 | 140 |
| Total Phenols | 20.9–1382 | 266 |
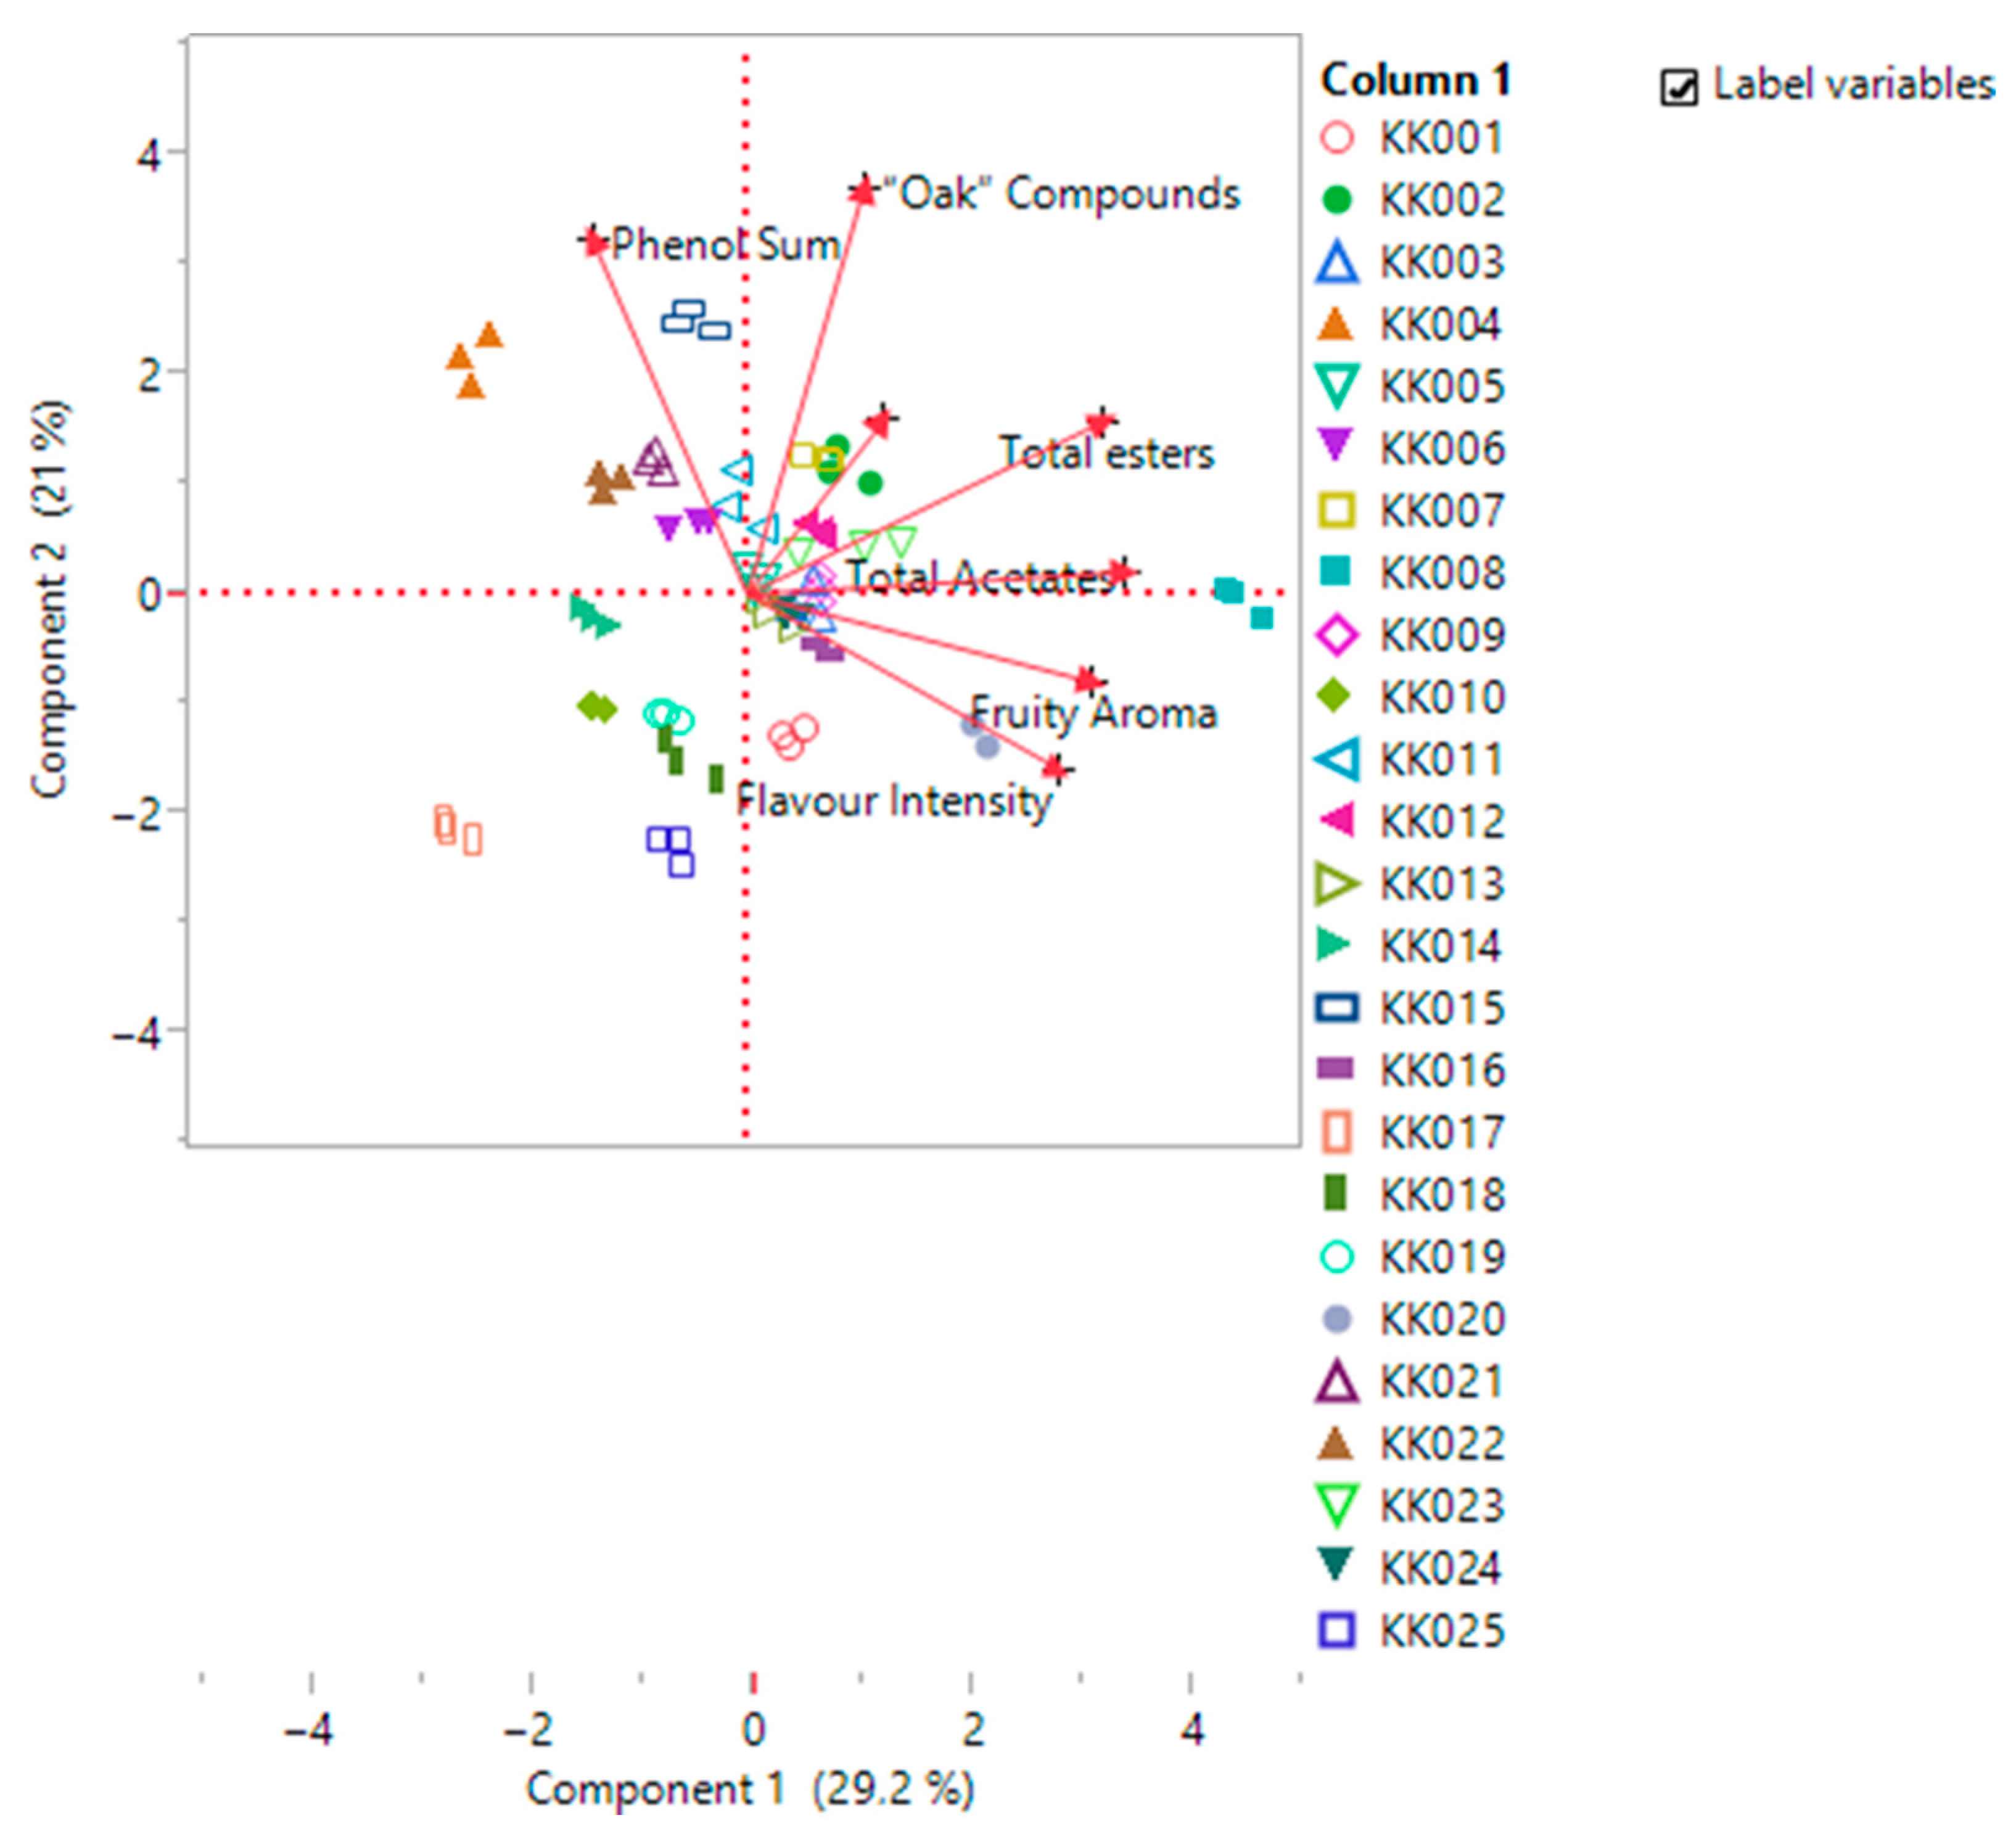
| Concentration (μg/L) | Sensory Result (0–10) | |||||||
|---|---|---|---|---|---|---|---|---|
| Sample Code | 2-phenyl- ethanol | Total Phenols | Total Acetates | Total Esters | Oak Compounds | Fruity Aroma | Barrel Aroma | Flavor Intensity |
| KK001 | 7.1 × 10⁴ | 20.9 | 445.1 | 962.1 | 392 | 4.9 | 1.7 | 4.3 |
| KK002 | 8.8 ×10⁴ | 265 | 285.9 | 995 | 1175.8 | 5.1 | 3.4 | 4.2 |
| KK003 | 6.0 × 10⁴ | 157.9 | 474.4 | 1255.3 | 437.2 | 4 | 3.4 | 4.3 |
| KK004 | 9.5 × 10⁴ | 1382 | 472.7 | 995.4 | 629 | 3.4 | 1.4 | 2.7 |
| KK005 | 7.6 × 10⁴ | 198.2 | 562.6 | 1078.9 | 545 | 3.2 | 4.3 | 4 |
| KK006 | 5.5 × 10⁴ | 99.7 | 402 | 809 | 551.1 | 3.7 | 4.8 | 4 |
| KK007 | 4.7 × 10⁴ | 41.7 | 315.6 | 911.7 | 1124.2 | 4.8 | 4.1 | 4.1 |
| KK008 | 4.7 × 10⁴ | NA | 1692.6 | 1892.6 | 502.7 | 5.9 | 2.6 | 4 |
| KK009 | 7.7 × 10⁴ | 385.3 | 297 | 1698.5 | 431.9 | 4.7 | 2.7 | 3.7 |
| KK010 | 8.4 × 10⁴ | NA | 315.4 | 815.7 | 279 | 4.3 | 1.9 | 3.2 |
| KK011 | 2.8 × 10⁴ | 824.2 | 302.4 | 885.7 | 525.6 | 5.6 | 2.5 | 4.2 |
| KK012 | 2.8 × 10⁴ | 38.3 | 367.7 | 1433.8 | 532.8 | 3.8 | 4.8 | 4.1 |
| KK013 | 2.6 × 10⁴ | 43.2 | 387.5 | 1098.4 | 318.5 | 4.4 | 4.8 | 3.9 |
| KK014 | 2.8 × 10⁴ | 211.6 | 423.1 | 577.4 | 287.3 | 3.7 | 4.1 | 3.6 |
| KK015 | 2.2 × 10⁴ | 637.8 | 299.5 | 1087.7 | 958.6 | 4.7 | 3.1 | 3.5 |
| KK016 | 2.3 × 10⁴ | 212.1 | 422.2 | 984 | 310.4 | 5.5 | 3.3 | 4.2 |
| KK017 | 2.2 × 10⁴ | NA | 121.1 | 703.2 | 26.4 | 3.7 | 0 | 3.3 |
| KK018 | 1.5 × 10⁴ | 42.4 | 262.9 | 752.3 | 200.3 | 4.1 | 3.3 | 4.2 |
| KK019 | 2.1 × 10⁴ | 84.6 | 213.7 | 606.4 | 338.1 | 4.6 | 3.3 | 4 |
| KK020 | 2.9 × 10⁴ | 21.7 | 612.6 | 1297.8 | 291.3 | 5.3 | 3.3 | 4.8 |
| KK021 | 2.1 × 10⁴ | 271.4 | 315.8 | 1344 | 595.9 | 3.3 | 3.6 | 3.4 |
| KK022 | 1.7 × 10⁴ | 508.1 | 271.8 | 879 | 404.5 | 3.7 | 4.5 | 3.7 |
| KK023 | 2.7 × 10⁴ | 66.8 | 743.8 | 1374.4 | 444.9 | 4.6 | 3.7 | 3.6 |
| KK024 | 8.1 × 10³ | 80.6 | 220.8 | 1085.9 | 540.1 | 4.8 | 3.6 | 4.2 |
| KK025 | 1.2 × 10⁴ | NA | 326.9 | 372.8 | 123.3 | 4.9 | 2.6 | 4.2 |
| OAV | OAV Sum | OAV % | ||||||||
|---|---|---|---|---|---|---|---|---|---|---|
| Code | 2-phenyl-ethanol | Total Acetates | Total Esters | Phenol Sum | “Oak” Compounds | Fruity | Barrel | SUM | Fruity% | Barrel% |
| KK001 | 5.1 | 12 | 47.3 | 0.1 | 2.1 | 64.4 | 2.2 | 66.6 | 96.7 | 3.3 |
| KK002 | 6.3 | 6.9 | 64.8 | 1.5 | 5.9 | 77.9 | 7.4 | 85.3 | 91.3 | 8.7 |
| KK003 | 4.3 | 13.6 | 70 | 2 | 2.3 | 87.9 | 4.2 | 92.1 | 95.4 | 4.6 |
| KK004 | 6.8 | 12.5 | 61.9 | 8.8 | 4.4 | 81.1 | 13.2 | 94.3 | 86 | 14 |
| KK005 | 5.4 | 15 | 53.6 | 1.1 | 2.8 | 74.1 | 3.9 | 78 | 95 | 5 |
| KK006 | 3.9 | 10.3 | 41.3 | 0.7 | 3.6 | 55.6 | 4.3 | 59.9 | 92.8 | 7.2 |
| KK007 | 3.3 | 7.6 | 52.1 | 0.3 | 4.1 | 63.1 | 4.4 | 67.5 | 93.5 | 6.5 |
| KK008 | 3.4 | 50.2 | 115.7 | NA | 3.1 | 169.3 | 3.1 | 172.4 | 98.2 | 1.8 |
| KK009 | 5.5 | 7.1 | 123.9 | 2.2 | 2.1 | 136.5 | 4.3 | 140.8 | 96.9 | 3.1 |
| KK010 | 6 | 8.1 | 39.6 | NA | 1.2 | 53.7 | 1.2 | 55 | 97.8 | 2.2 |
| ΚΚ011 | 2 | 8.9 | 48.9 | 6.2 | 3.9 | 59.8 | 10.1 | 69.9 | 85.6 | 14.4 |
| ΚΚ012 | 2 | 11.1 | 98.2 | 1 | 2.7 | 111.3 | 3.6 | 114.9 | 96.8 | 3.2 |
| ΚΚ013 | 1.9 | 11.3 | 81.1 | 1.1 | 1.6 | 94.4 | 2.7 | 97.1 | 97.2 | 2.8 |
| ΚΚ014 | 2 | 12.4 | 30.2 | 2 | 1.1 | 44.6 | 3.1 | 47.6 | 93.6 | 6.4 |
| ΚΚ015 | 1.6 | 8.9 | 61.1 | 4.5 | 4.1 | 71.6 | 8.7 | 80.2 | 89.2 | 10.8 |
| ΚΚ016 | 1.6 | 12.9 | 61.9 | 3.1 | 1.4 | 76.4 | 4.4 | 80.9 | 94.5 | 5.5 |
| ΚΚ017 | 1.5 | 3.4 | 61.3 | NA | 0 | 66.2 | 0 | 66.3 | 100 | 0 |
| ΚΚ018 | 1 | 8.3 | 45.6 | 0.2 | 0.8 | 55 | 1 | 56 | 98.2 | 1.8 |
| ΚΚ019 | 1.5 | 6.4 | 37.6 | 0.5 | 1.6 | 45.6 | 2.2 | 47.7 | 95.5 | 4.5 |
| ΚΚ020 | 2.1 | 17.9 | 94.9 | 0.5 | 1.5 | 115 | 2 | 117 | 98.2 | 1.8 |
| ΚΚ021 | 1.5 | 8.9 | 96.9 | 3.2 | 3.6 | 107.3 | 6.8 | 114.1 | 94 | 6 |
| ΚΚ022 | 1.2 | 7.6 | 48.6 | 4.3 | 3 | 57.5 | 7.4 | 64.9 | 88.6 | 11.4 |
| ΚΚ023 | 1.9 | 21.5 | 97.1 | 1.7 | 3.7 | 120.5 | 5.4 | 126 | 95.7 | 4.3 |
| ΚΚ024 | 0.6 | 6.8 | 75.1 | 1.2 | 2.8 | 82.5 | 4 | 86.5 | 95.4 | 4.6 |
| ΚΚ025 | 0.9 | 9.9 | 20.5 | NA | 0.6 | 31.2 | 0.6 | 31.9 | 98.1 | 1.9 |
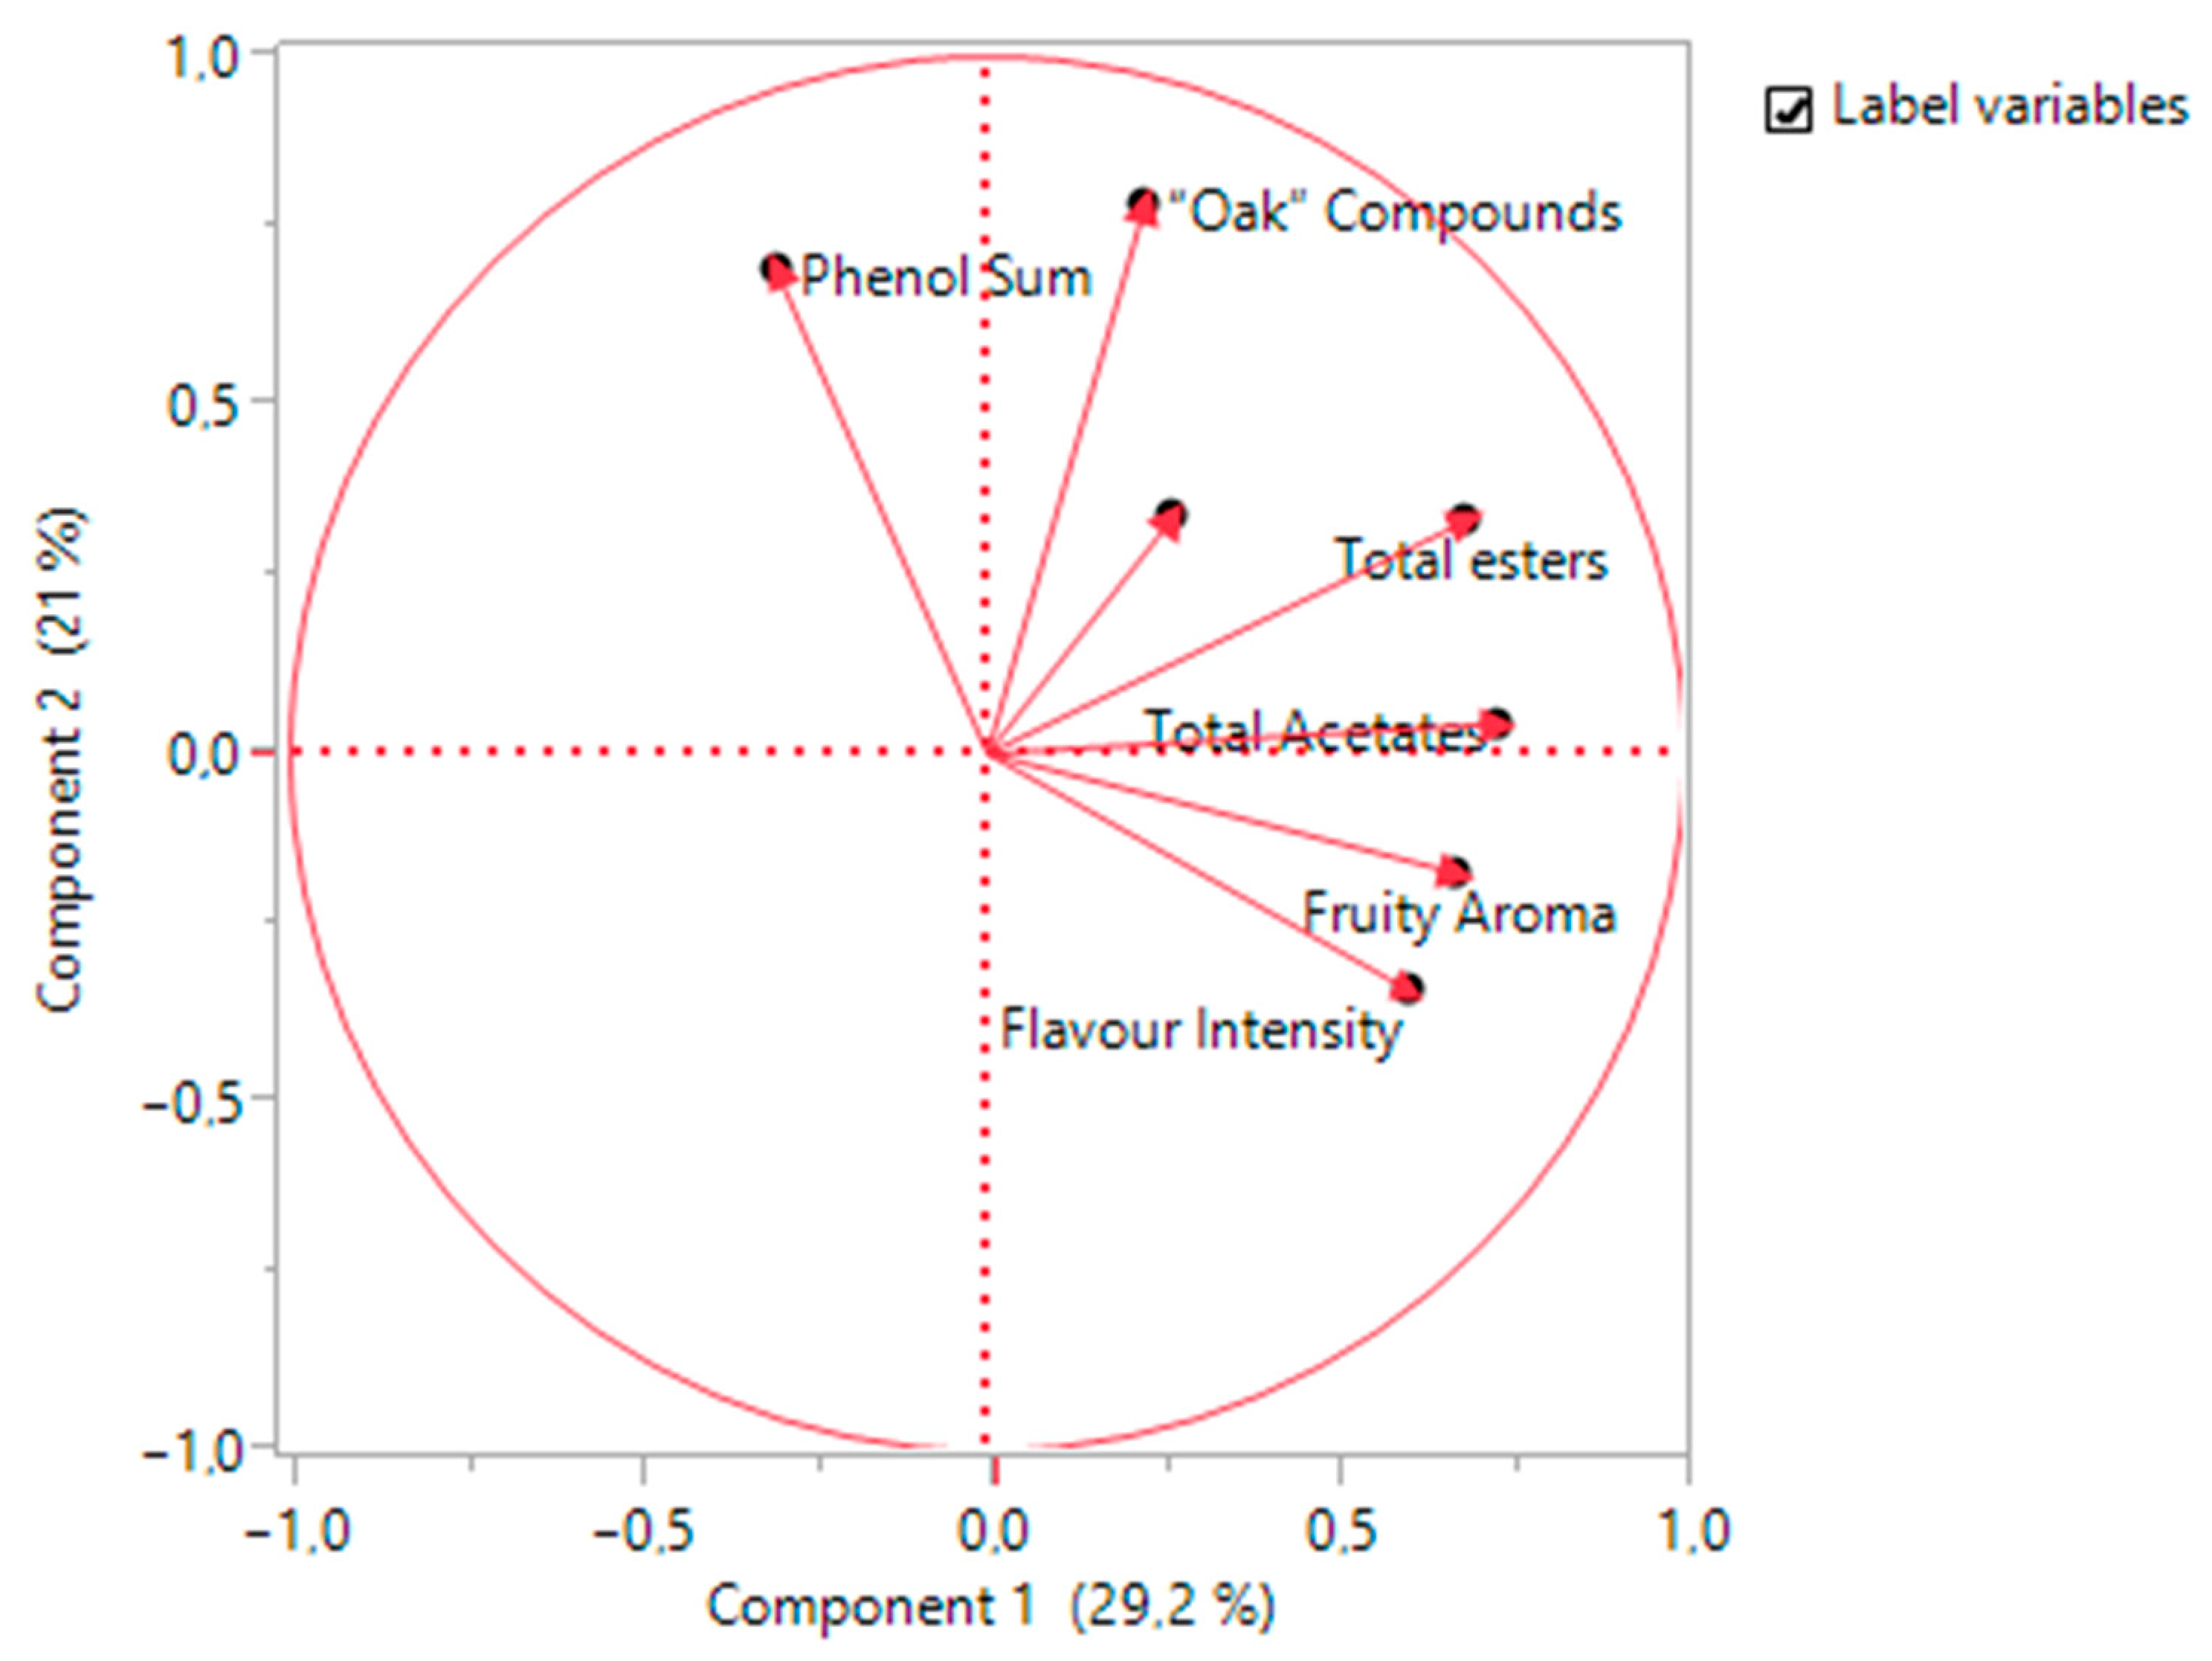
| Prin1 | Prin2 | |
|---|---|---|
| Phenol Sum | −0.21102 | 0.56998 |
| Total Acetates | 0.51338 | 0.03573 |
| Total esters | 0.48203 | 0.27627 |
| “Oak” Compounds | 0.15779 | 0.64906 |
| Fruity Aroma | 0.46956 | −0.14097 |
| Barrel Aroma | 0.18523 | 0.27852 |
| Flavor Intensity | 0.4241 | −0.2807 |
| Phenol Sum | Total Acetates | Total Esters | “Oak” Compounds | Fruity Aroma | Barrel Aroma | Flavor Aroma | |
|---|---|---|---|---|---|---|---|
| Phenol Sum | 1 | −0.1507 | −0.0656 | 0.3032 | −0.0409 | −0.0114 | −0.3239 |
| Total Acetates | −0.1507 | 1 | 0.6042 | 0.0138 | 0.3627 | 0.0097 | 0.0884 |
| Total esters | −0.0656 | 0.6042 | 1 | 0.2399 | 0.2023 | 0.1194 | 0.0547 |
| “Oak” Compounds | 0.3032 | 0.0138 | 0.2399 | 1 | 0.1123 | 0.2869 | −0.0006 |
| Fruity Aroma | −0.0409 | 0.3627 | 0.2023 | 0.1123 | 1 | −0.1643 | 0.494 |
| Barrel Aroma | −0.0114 | 0.0097 | 0.1194 | 0.2869 | −0.1643 | 1 | 0.3771 |
| Fl Aroma | −0.3239 | 0.0884 | 0.0547 | −0.0006 | 0.494 | 0.3771 | 1 |
| Coefficient | Phenol Sum | Total Acetates | Total Esters | Oak Compounds |
|---|---|---|---|---|
| Fruity Aroma | 0.2683 | 0.5049 | 0.3520 | 0.3753 |
| Barrel Aroma | 0.2388 | 0.1787 | 0.2590 | 0.4881 |
Disclaimer/Publisher’s Note: The statements, opinions and data contained in all publications are solely those of the individual author(s) and contributor(s) and not of MDPI and/or the editor(s). MDPI and/or the editor(s) disclaim responsibility for any injury to people or property resulting from any ideas, methods, instructions or products referred to in the content. |
© 2024 by the authors. Licensee MDPI, Basel, Switzerland. This article is an open access article distributed under the terms and conditions of the Creative Commons Attribution (CC BY) license (https://creativecommons.org/licenses/by/4.0/).
Share and Cite
Ligas, I.; Goulioti, E.; Tarantilis, P.; Kotseridis, Y. A New Simple Method for the Determination of Complex Wine Aroma Compounds Using GC-MS/MS—The Case of the Greek Variety “Agiorgitiko”. AppliedChem 2024, 4, 122-139. https://doi.org/10.3390/appliedchem4020009
Ligas I, Goulioti E, Tarantilis P, Kotseridis Y. A New Simple Method for the Determination of Complex Wine Aroma Compounds Using GC-MS/MS—The Case of the Greek Variety “Agiorgitiko”. AppliedChem. 2024; 4(2):122-139. https://doi.org/10.3390/appliedchem4020009
Chicago/Turabian StyleLigas, Ioannis, Elli Goulioti, Petros Tarantilis, and Yorgos Kotseridis. 2024. "A New Simple Method for the Determination of Complex Wine Aroma Compounds Using GC-MS/MS—The Case of the Greek Variety “Agiorgitiko”" AppliedChem 4, no. 2: 122-139. https://doi.org/10.3390/appliedchem4020009