Article

Exploring the Roles of Chelating/Fuel Agents in Shaping the Properties of Copper Ferrites

1
Department of Physics, Jamia Millia Islamia, Delhi 110025, India
2
Materials Science Group, Inter-University Accelerator Centre, New Delhi 110067, India
3
Nuclear Physics Institute of Czech Academy of Sciences, Řež 130, 25065 Husinec, Czech Republic
4
Centre for Nanoscience and Nanotechnology, Jamia Millia Islamia, New Delhi 110025, India
5
Department of Materials Engineering, Ben-Gurion University of the Negev, Beer Sheva 84105, Israel
6
Department of Chemical and Materials Engineering, University of Alberta, Edmonton, AB T6G 2V4, Canada
*
Authors to whom correspondence should be addressed.
AppliedChem 2025, 5(2), 9; https://doi.org/10.3390/appliedchem5020009 (registering DOI)
Submission received: 25 February 2025 / Revised: 8 April 2025 / Accepted: 22 April 2025 / Published: 28 April 2025

Abstract

:
In this study, copper ferrite nanoparticles, a type of ferrimagnetic spinel ferrite, were synthesized using the sol-gel auto-combustion method with three different fuels: citric acid, urea, and ethylene glycol. The crystal structures of the synthesized samples were analyzed using X-ray diffraction (XRD), and the growth of secondary phases like Fe2O3 and CuO for samples prepared with urea and ethylene glycol indicated the presence of impurities. Additionally, we observed that the particle size varied significantly with the type of fuel, being the smallest for citric acid and the largest for urea. The electrical and magnetic properties showed strong correlations with the particle size and the presence of impurities. In particular, the optical band gap values, derived from UV-Vis spectroscopy, varied significantly with the choice of fuel, ranging from 2.06 to 3.75 eV. The highest band gap of 3.75 eV was observed in samples synthesized with citric acid. Magnetic properties were measured using a vibrating sample magnetometer (VSM), and it was found that the copper ferrite synthesized with citric acid exhibited the highest values of magnetic saturation and coercivity. These findings demonstrate that the choice of fuel during the synthesis process has substantial impacts on the structural, optical, and magnetic properties of CuFe2O4 nanoparticles.

1. Introduction

Spinel ferrites are metal oxide semiconductors with the general chemical formula AB2O4, where A (divalent) and B (trivalent) represent different metal cations that are located at tetrahedral (A site) and octahedral (B site) positions, respectively [1]. Spinels can be categorized as either inverse or normal types according to how these divalent and trivalent cations are distributed throughout the lattice in tetrahedral and octahedral sites [2]. In a normal spinel, A cations are found in the tetrahedral sites, and B cations are located in the octahedral sites. When a divalent cation occupies the octahedral sites and a trivalent cation occupies both tetrahedral and half of the octahedral sites, then this spinel structure refers to inverse spinel ferrites [3]. The position of the metal cations in the spinel structure has a considerable impact on the physicochemical properties of ferrites [4]. Nanocrystalline magnetic materials have garnered interest from diverse sectors, including semiconductor physics [5], catalysis, biomedical applications, materials science, and engineering [6], owing to their exceptional and distinct characteristics [7]. These substances are regarded as nanomaterials due to their particle sizes of up to 100 nm [8]. This unique property leads to changes or enhancements in the mechanical, optical, electrical, magnetic, and thermal reactivity properties relative to their bulk counterparts. In bulk materials, the properties are mostly determined by their chemical composition, but for nanomaterials, additional factors like particle size and morphology are important in determining their characteristics [9,10].
Recently, the synthesis of nanocrystalline spinel ferrites received substantial attention from researchers because of their exceptional and desirable electrical and magnetic behaviors [11]. Spinel ferrites are considered as soft magnetic ferrites and are utilized in different applications, such as magnetic sensors, microwave communications systems, inductors, and transformers [12].
Soft magnetic materials, including Ni-Zn ferrites, Mn-Zn ferrites, ZnFe2O4, NiFe2O4, and CuFe2O4, play crucial roles in modern technology. These materials are widely utilized in electrical devices and the telecommunication industry due to their exceptional properties. Their high resistivity, low eddy current losses, low coercivity, and excellent thermal and chemical stability make them highly suitable for a broad range of applications [13].
The microstructure, as well as the electrical and magnetic properties of different ferrites, such as NiFe2O4, CuFe2O4, Mg-Zn-Al ferrites, Ni1−xZnxFe2O4 and Mn1−xZnxFe2O4 ferrites, are influenced by various factors, such as the synthesis method, doping concentration, calcination temperature, and the fuel used in preparation techniques [14,15,16,17].
CuFe2O4 is classified as an inverse spinel soft ferrite. In particular, the tunable physical properties of copper ferrite make it useful in a broad range of applications. It is described as a cubic close-packed arrangement of oxygen ions with Cu2+ and Fe3+ ions at tetrahedral and octahedral oxygen coordination sites (A and B, respectively) [18,19]. Copper ferrite can exist in two different structures, tetragonal (t-CuFe2O4) and cubic (c-CuFe2O4), depending upon the calcination temperature [20]. CuFe2O4 can alter its physical properties under a variety of environmental conditions, including phase transitions, electrical switching, semiconducting, magnetic, electrical, and chemical stability [21]. CuFe2O4 has conceded significant research interest, particularly due to its highly adjustable structural morphologies. A few examples of the reported morphologies of CuFe2O4 in the previous literature are nanotubes [22], nanorods [23], nanofibers [24], nano rings, nanospheres [25], nano spindles, and honeycomb structures [26,27].
Over the years, a variety of synthesis methods have aided in the synthesis of CuFe2O4 and other ferrites, such as Mn-Zn ferrites, ZnFe2O4, Ni-Zn ferrites, NiFe2O4, and Ni1−xZnxFe2O4 nanoparticles [28]. These methods include sol-gel auto-combustion, hydrothermal reactions, solid-state reaction processes, precipitation, and aerosols [29].
The most frequent problems with many of these methods are their long synthesis time, challenging and intricate procedures, costly starting ingredients, and low yields. The synthesis process from the sol-gel combustion method possesses advantages over traditional methods, including a low cost, good chemical homogeneity, rapid reaction time, and large-scale production [30].
In addition, the sol-gel combustion method is a chemical synthesis technique that offers several advantages. It enables the safe and efficient synthesis of various metal oxide nanoparticles on a pilot scale without requiring sophisticated equipment while also allowing for rapid and straightforward production [31,32]. Fuel plays a crucial role in the synthesis process in the sol-gel method. Various organic compounds, including urea, glycine, ethylene glycol, citric acid, and aniline, have been employed as fuel substances to enhance the efficiency of the reaction. The synthesis process was found to be primarily governed by the nature and composition of the fuel used [33]. Among these fuels, citric acid is the most commonly used for synthesizing a wide range of ferrites due to its cost-effectiveness, and it serves as a more efficient complexing agent than fuels such as hydrazine and glycine, facilitating the production of fine ferrite powders with smaller particle sizes [34].
Zhihui Ye et al. examined the effects of different synthesis methods on the structural and magnetic properties of CuFe2O4. They employed several approaches for synthesizing copper ferrite, including co-precipitation, the hydrothermal process, the solid-state reaction process, and the sol-gel method. Their study examined the catalytic properties of copper ferrites in the degradation of lignin organic molecules, reporting a maximum degradation efficiency of 61.76% using the sol-gel method with ethylene glycol as the fuel. Additionally, they observed that the average particle size increased from 15.4 nm to 33.4 nm, depending on the specific treatment method used for precipitation [35]. Jaume Calvo-de la Rosa investigated an optimized polymer-assisted sol-gel synthesis method for fabricating copper ferrites. The study conducted a multivariable analysis to examine the effects of the calcination temperature on the structural and magnetic properties of CuFe2O4. By varying the temperature from 850 °C to 950 °C over time, the study found that both magnetism and nanoparticle agglomeration increased with higher temperatures and a longer calcination duration [36]. Junaid et al. explored the effects of indium ion incorporation on the structural, magnetic, spectral, and dielectric properties of copper spinel ferrites synthesized via the sol-gel technique using citric acid as a fuel. The study found that the crystallite size increased from 11.33 nm to 12.59 nm with increasing indium concentrations, which was attributed to the difference in ionic radii between Cu and In. Additionally, magnetic interactions weakened due to the substitution of Fe3+ ions by In3+ ions in the octahedral sites, causing a redistribution of Fe3+ ions from octahedral to tetrahedral sites [37]. Oliveira et al. investigated the photocatalytic activity of CuFe2O4 synthesized via the sol-gel combustion method with urea as a chelating agent, calcined at temperatures between 400 °C and 1100 °C. The material displayed the cubic phase at both lower (400 °C) and higher (above 600 °C) temperatures, with crystallite sizes ranging from 8.2 nm to 49.8 nm, influenced by the calcination temperature. The morphology transitioned from spherical to plate-like as the temperature increased, indicating a phase transformation, as confirmed by X-ray diffraction (XRD). CuFe2O4 calcined at 400 °C exhibited the highest photocatalytic degradation efficiency for malachite green and rhodamine B dyes, likely due to the presence of a secondary Fe2O3 phase and the smaller crystallite size, which increases the surface area and active sites for photocatalysis [38]. Astaraki et al. studied the effects of the ethylene glycol (EG) and water contents on the magnetic properties, phase formation, and photocatalytic activity of CuFe2O4/Cu2O/Cu nanocomposite powders synthesized via the sol-gel combustion method. XRD analysis revealed the cubic phase, along with secondary phases of Cu2O and Cu. As the EG concentration increased (up to 50 cc and 10 cc of water), the copper oxide phase was completely removed. Significant changes in morphology and crystallite size (ranging from 144 to 187 nm) were observed due to increased agglomeration of magnetic nanoparticles with higher EG concentrations. The hysteresis loop showed that the saturation magnetization (Ms) decreased as the ethylene glycol content rose from 10 to 50 cc, which was attributed to lower crystallinity, correlating with the XRD results. Larger crystallites in samples with lower EG concentrations allowed easier domain wall movement due to fewer grain boundaries, resulting in a lower Ms as the EG concentration increased. The highest photocatalytic degradation efficiency (99.1%) was achieved for methylene blue dye [39]. Wahba investigated the optical, magnetic, and photocatalytic properties of CuFe2O4 nanocomposites synthesized via the sol-gel auto-combustion method using three different chelating agents: glycine, succinic acid, and tartaric acid. The XRD analysis revealed that glycine and succinic acid led to the formation of CuFe2O4 along with impurities such as Fe2O3 and CuO, whereas tartaric acid facilitated the formation of the purest CuFe2O4 with only minimal traces of Fe2O3. This suggests that glycine and succinic acid may be less effective at fully complexing Cu and Fe ions, leading to the formation of undesired secondary phases. The highest porosity was observed in the glycine-assisted sample due to extensive gas release during synthesis. Magnetic properties were significantly influenced by the choice of chelating agent, with coercivity—indicating resistance to demagnetization—varying across samples. In photocatalytic performance, the degradation efficiency of Congo red dye was highest for glycine-assisted CuFe2O4 (96%), followed by succinic acid (92%) and tartaric acid (39%) [40]. Kandhasamya et al. also synthesized olivine (LiCo1/3Mn1/3Ni1/3PO4) via the sol-gel method using different fuels such as citric acid, triethanolamine, and polyvinylpyrrolidone and explored the effects of fuels on the electrochemical behavior [41].
Building upon previous research, a comprehensive study on the influences of citric acid, urea, and ethylene glycol as fuels on the structural, optical, and magnetic characteristics of synthesized CuFe2O4 nanoparticles has not yet been thoroughly investigated. To address this gap, we conducted a comparative study of CuFe2O4 nanoparticles synthesized via the sol-gel auto-combustion method, focusing on the impacts of different chelating agents—citric acid, urea, and ethylene glycol—on their structural, optical, and magnetic properties.

2. Materials and Methods

The high-purity chemicals required to synthesized the samples were supplied by Sigma-Aldrich (Mumbai, India). Citric acid (C6H8O7) (99%), copper nitrate (Cu(NO3)2.6H2O), and ferric nitrate (Fe(NO3)3.9H2O) (98%) are highly pure. All the compounds were readily available for use, of analytical quality, and could be purchased commercially.

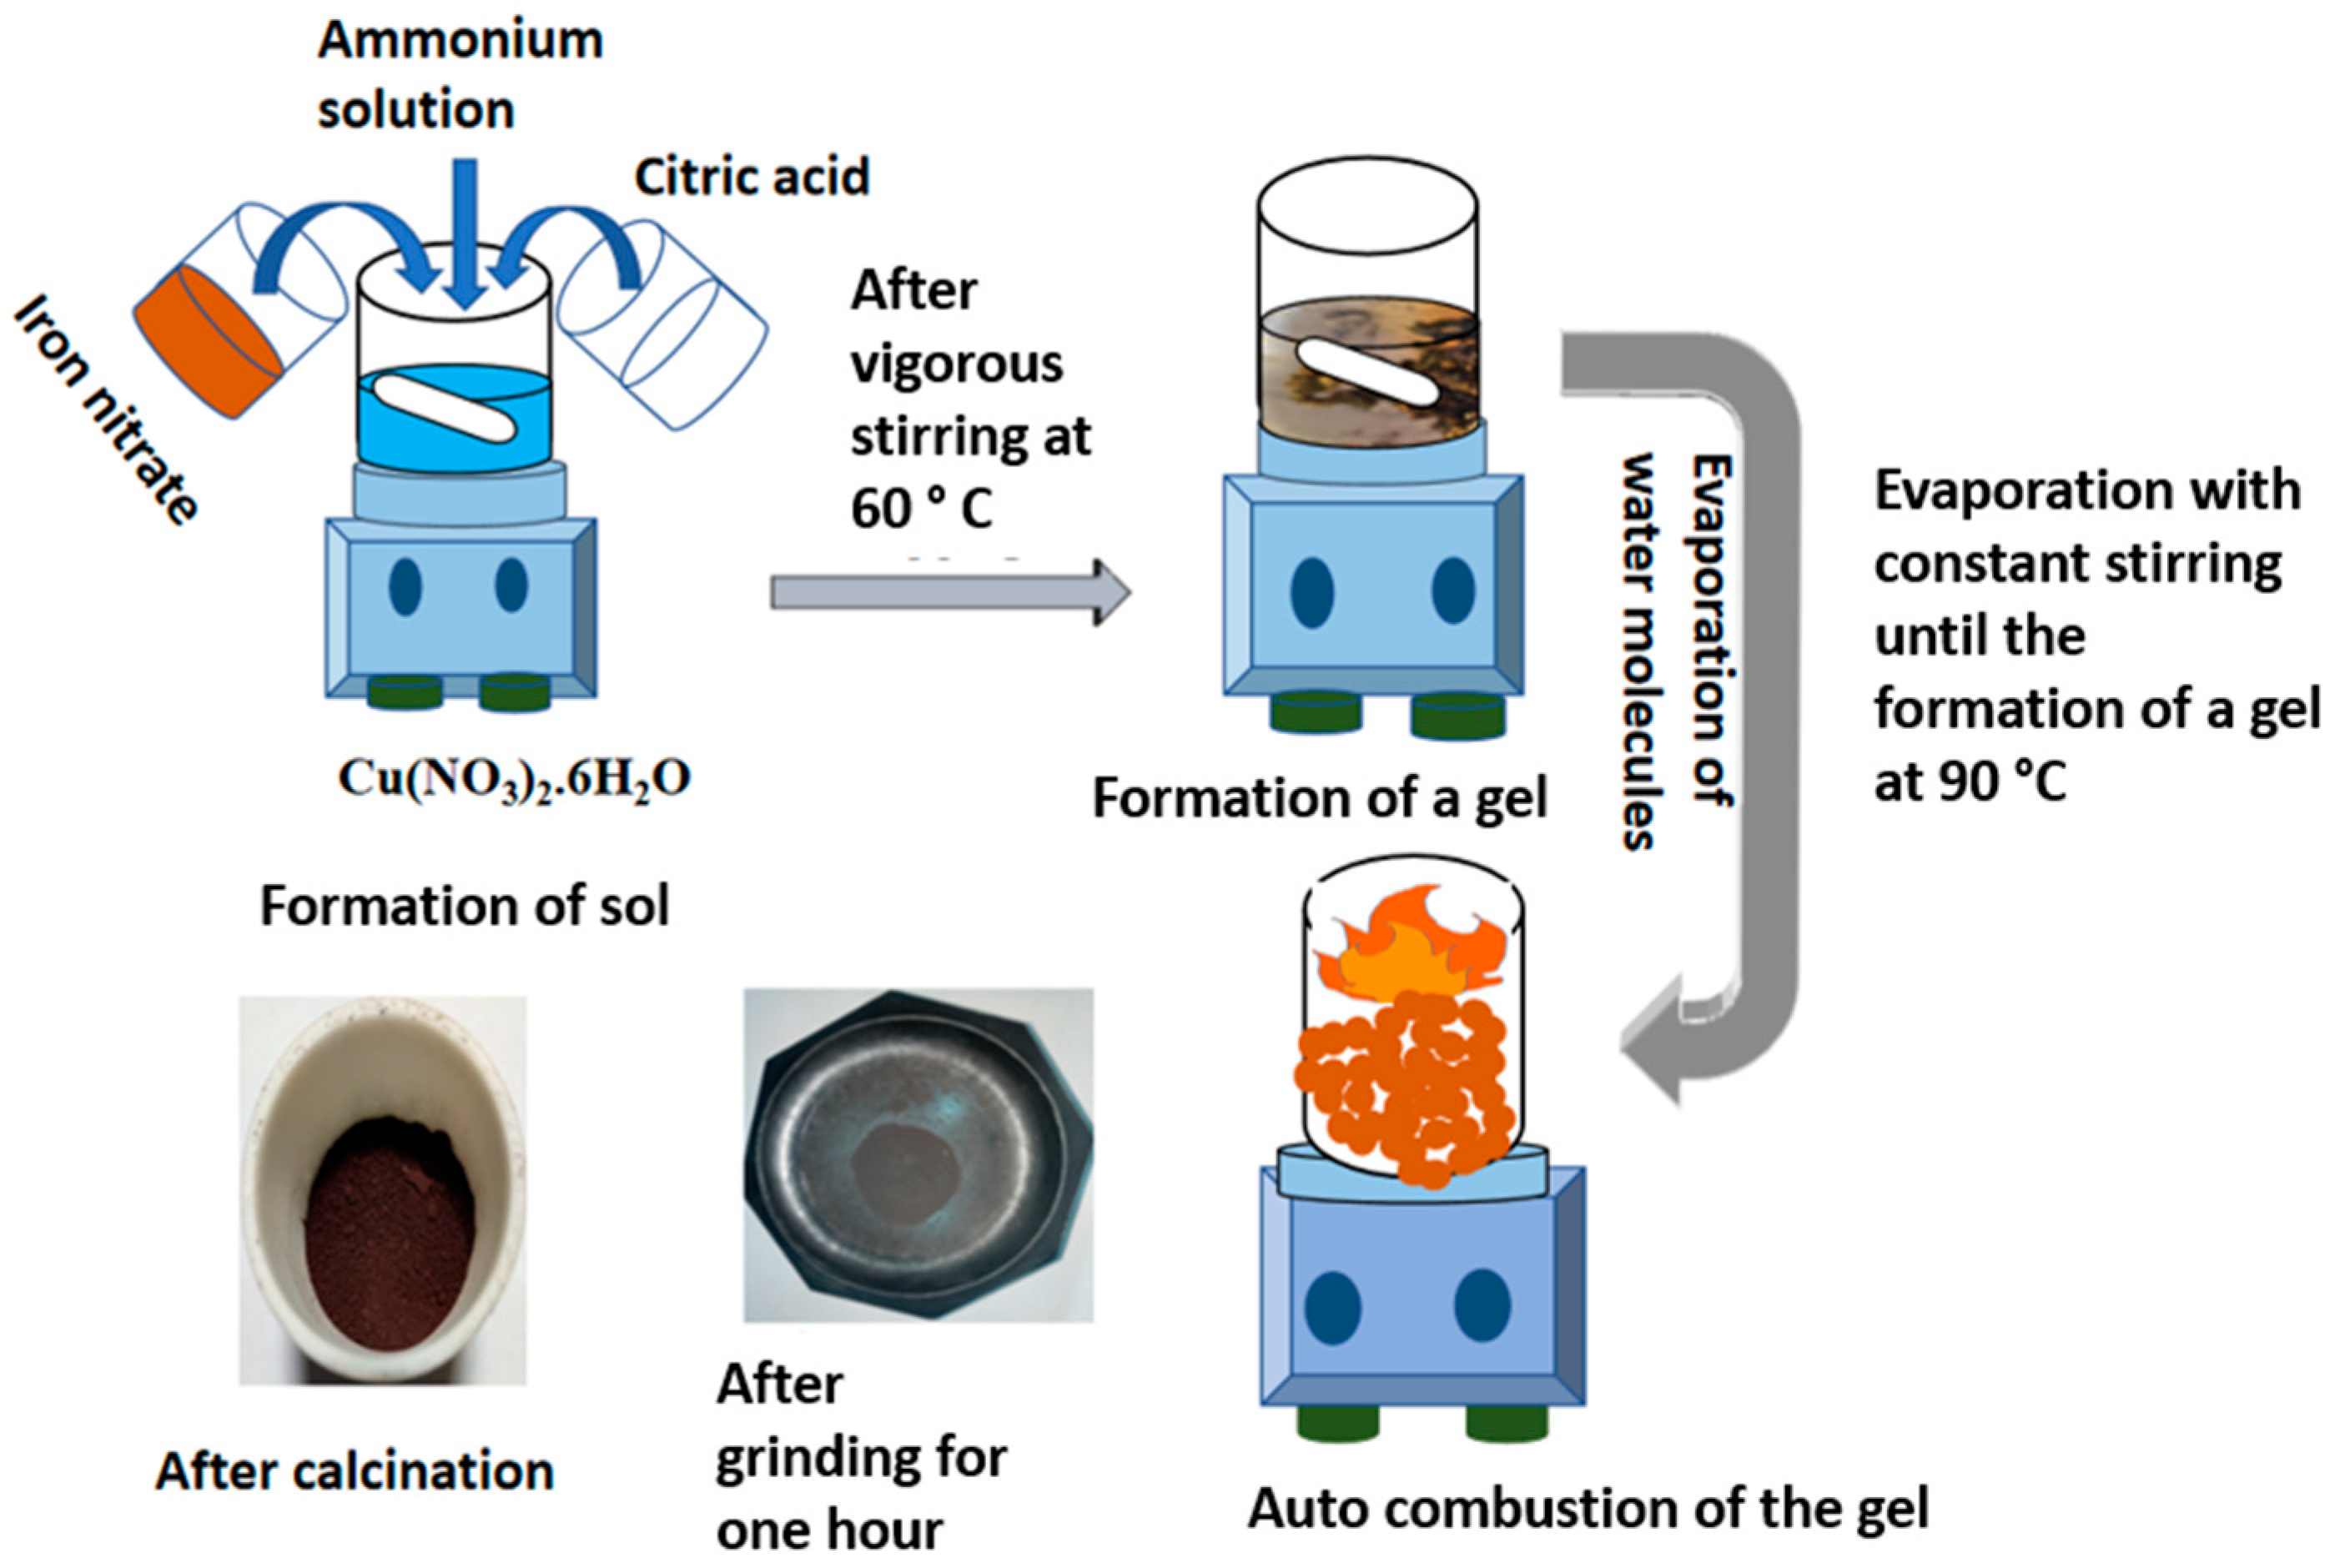
2.1. Method of Synthesis

To synthesize CuFe2O4 with citric acid, a solution was prepared by dissolving 7.35 g of Fe(NO3)3.9H2O (ferric nitrate) and 2.56 g of Cu(NO3)2.6H2O (copper nitrate) in 50 mL of deionized water (DI). Subsequently, 5.25 g of citric acid was added to the mix along with nitrate in a ratio of 1:1. The temperature of the solution was raised up to 60 °C on a magnetic stirrer (BR Biochem Life Sciences Private Limited, New Delhi, India), with a rotating speed of 300 rpm to form a clear and green solution with a pH < 1. The pH value of the solution was adjusted to 7 by an ammonia solution. The resultant solution was heated continuously to 90 °C. After stirring it constantly until a gel formed, the temperature was raised to 110 °C. The gel was allowed to auto-combust; subsequently, it was dried and ground into ferrite powder. A sample of brown powder was ground for two hours and subsequently heated to 700 °C for eight hours in a muffle furnace (Bionics Scientific, Delhi, India) (shown in Figure 1). A similar method was employed to synthesize copper ferrites using 5.05 g of urea. In the case of ethylene glycol, the same amount of nitrate precursor was dissolved in 50 mL of DI water, and then 50 mL of ethylene glycol was added as a fuel. The temperature was increased to 60 °C while maintaining the same stirring speed. An ammonia solution was added dropwise to adjust the pH of the solution. After the combustion process, the gel was converted into a powder. Following this, the powder sample was ground, and the same calcination temperature was used to heat it. We compared the properties of the samples synthesized using nearly the same amount of fuel.

2.2. Characterization Techniques

2.2.1. X-Ray Diffractometry (XRD)

The structural parameters and crystallinity of the samples were analyzed using a Rigaku SmartLab X-ray diffractometer (XRD) (Tokyo, Japan) with a Cu Kα source (λ = 1.54 Å). The analysis was conducted over a 2θ range of 10° to 80° with a scan rate of 2° per minute. The XRD results for all samples are reported in Table 1.

2.2.2. Field Emission Scanning Electron Microscopy (FESEM)

The morphological study of the prepared samples was conducted using a field emission scanning electron microscope (FESEM; SEM) with a Quanta 3D FEG (FEI, Eindhoven, The Netherlands).

2.2.3. High-Resolution Transmission Electron Microscopy (HRTEM)

The particle size was assessed using high-resolution transmission electron microscopy (HRTEM) with the TECNAI 200 kV model (Barcelona, Spain). This advanced imaging technique allows for detailed observations of the particles at the nanoscale, providing accurate measurements of their dimensions and morphology. By utilizing a 200 kV acceleration voltage, the TECNAI system enhances the resolution and contrast of the images, enabling a better understanding of the material’s structural properties.

2.2.4. Ultraviolet–Visible Spectrophotometry

The bandgap of the synthesized samples was measured using a UV-Vis spectrophotometer manufactured by Agilent Technologies (Santa Clara, CA, USA). This analysis was conducted at room temperature and covered a wavelength range from 200 to 450 nm. The UV-Vis spectrophotometer allows for the accurate assessment of the optical properties of materials, enabling us to determine the energy difference between the valence band and the conduction band of the samples. This information is essential for understanding the electronic behavior and potential applications of the synthesized materials in optoelectronic devices.

2.2.5. Vibrating Sample Magnetometer (VSM)

The magnetic properties of the synthesized samples were studied using a Vibrating Sample Magnetometer (VSM) (Cryogenic Limited, London, UK) over an applied field range of −20 kOe to +20 kOe.

3. Results

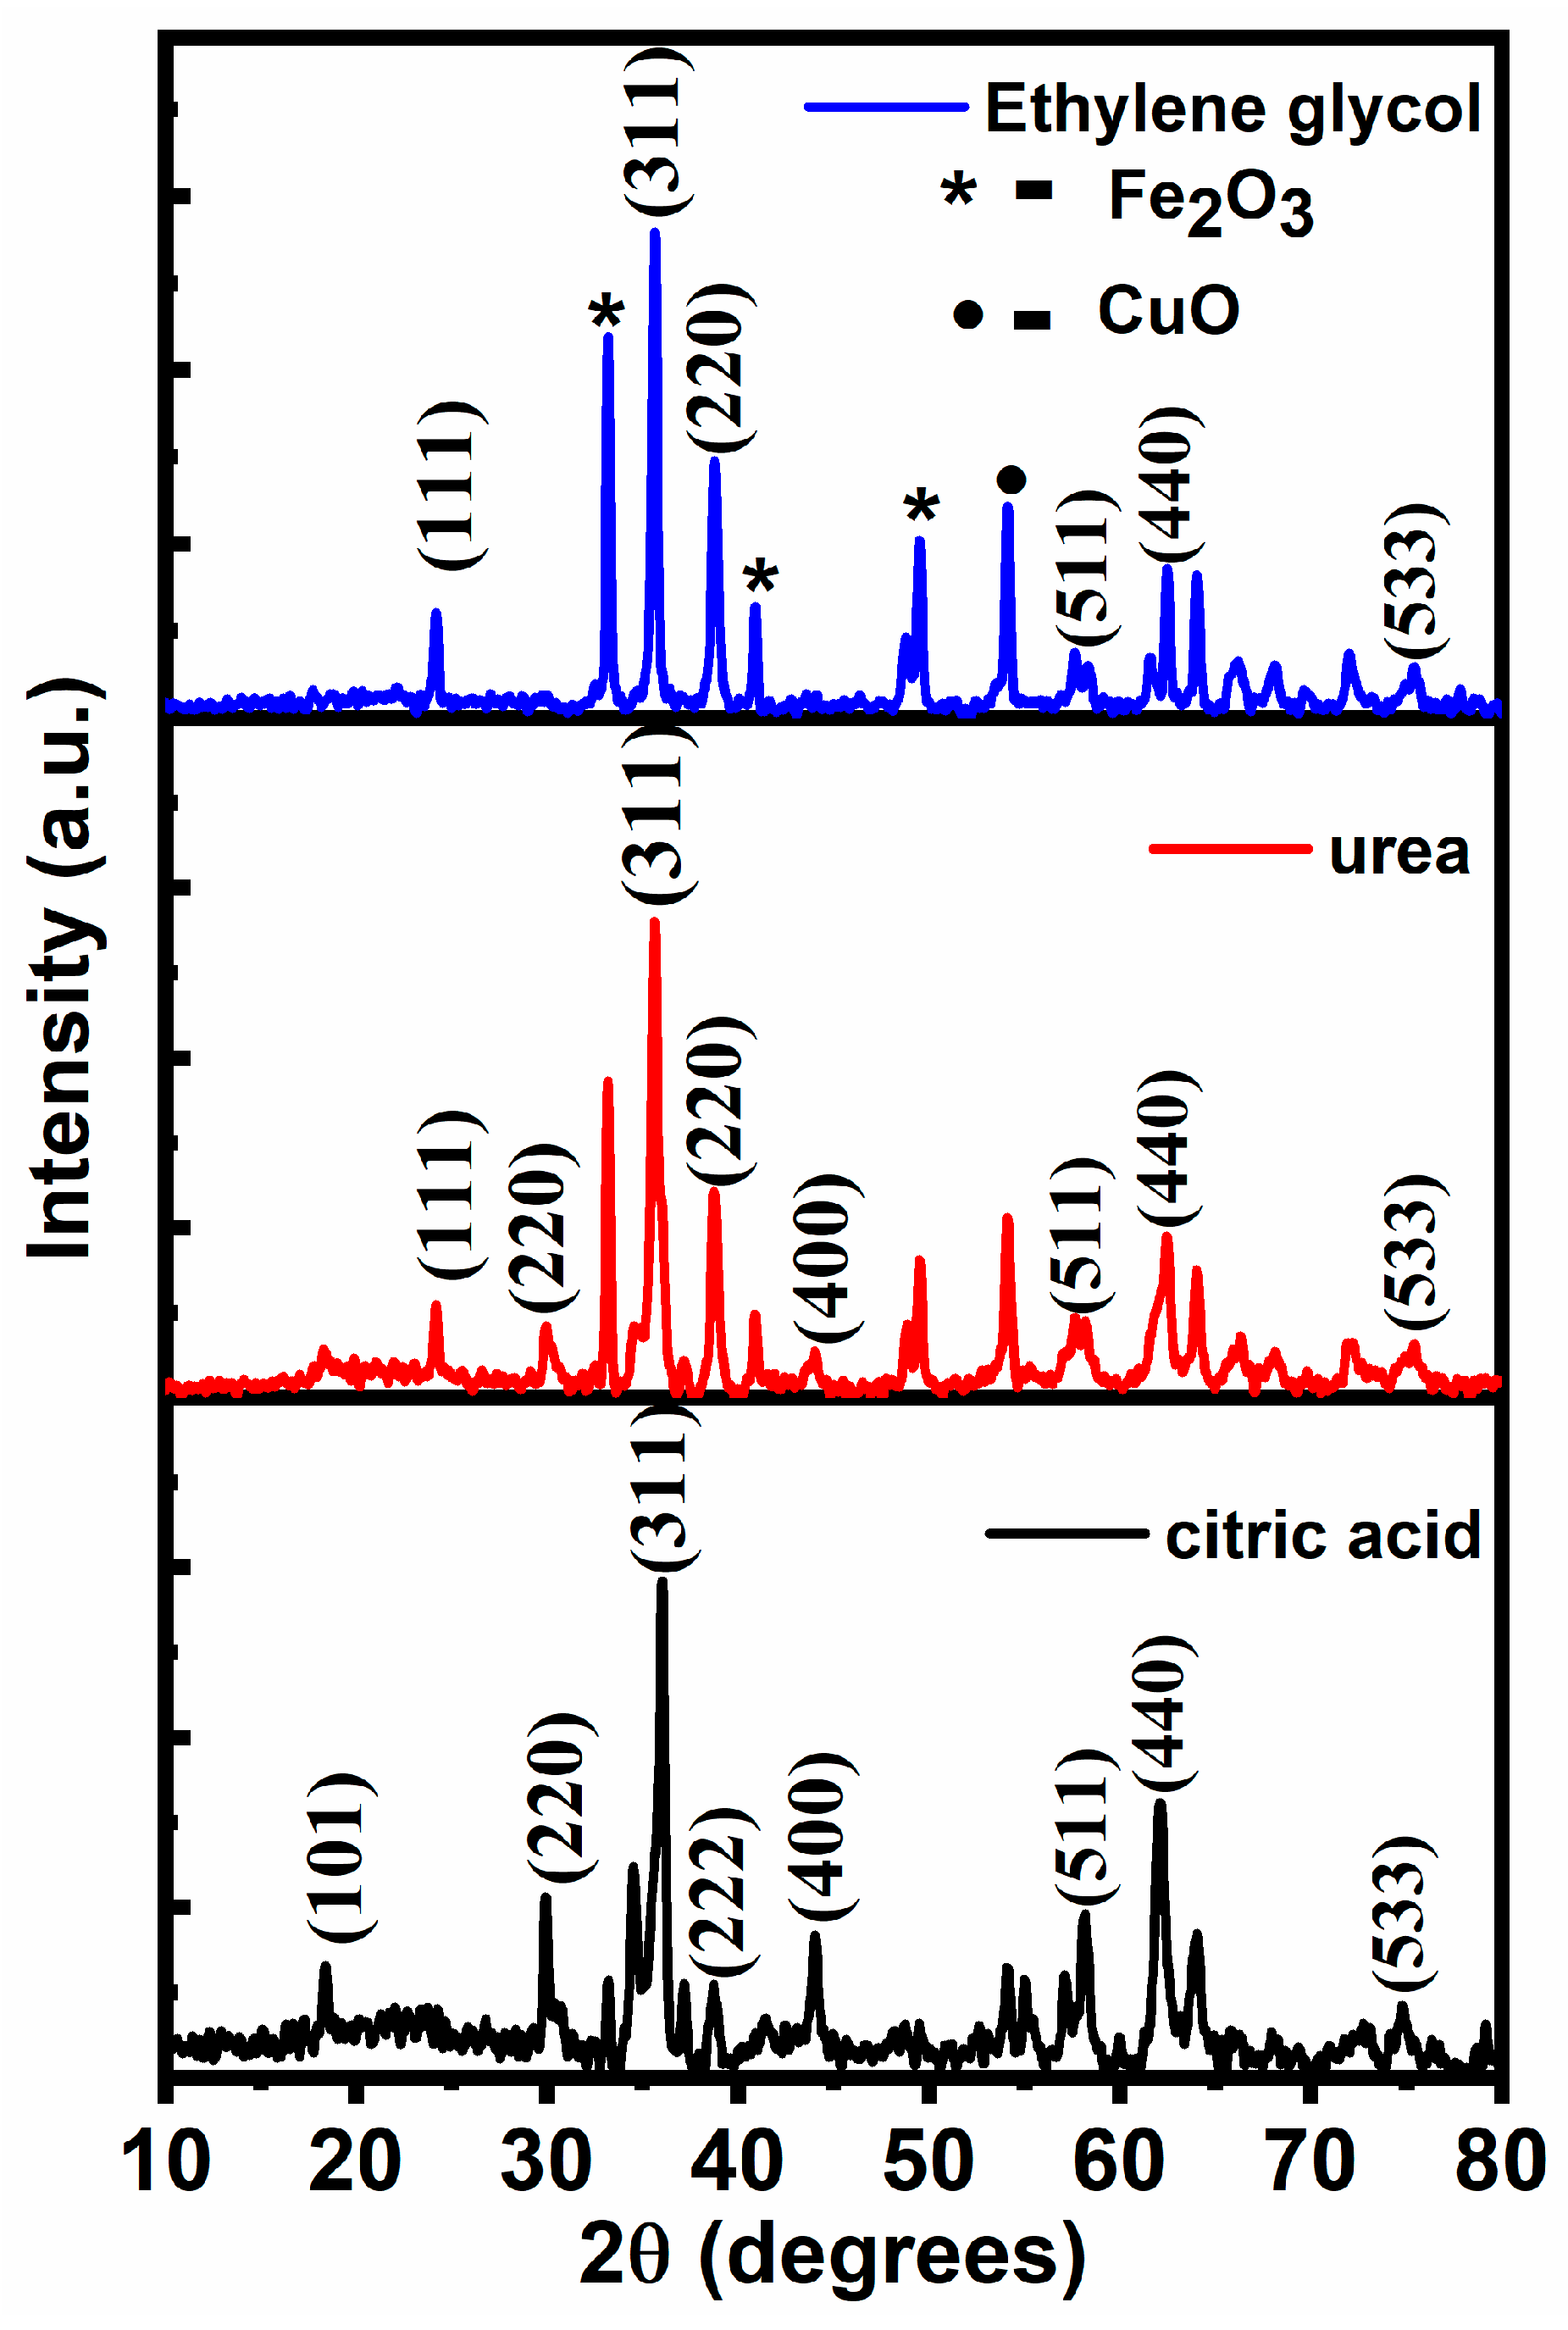
3.1. X-Ray Diffraction

The powder XRD patterns of copper ferrite nanoparticles synthesized by the sol-gel self-combustion method using citric acid, urea, and ethylene glycol as fuels are shown (see Figure 2). The XRD patterns indicate that all peaks correspond to copper ferrite, with some additional impurities. The XRD pattern shows strong reflections for the planes (hkl) (2 2 0), (3 1 1), (2 2 2), (4 0 0), (5 3 3), (5 1 1), and (4 4 0) that belong to a cubic structure of face-centered cubic (FCC) consistent with the JCPDF card no. 25-0283. From Figure 2, the additional impurities of Fe2O3 and CuO appear along with CuFe2O4 for urea and ethylene glycol fuels. Conversely, pure CuFe2O4 with minimal Fe2O3 was observed in the citric acid-facilitated sample. The secondary phases in urea and ethylene glycol may arise because these fuels are less effective at fully complexing Fe and Cu ions [40]. The citric acid chelating group formed a stronger bond with Cu and Fe, promoting the formation of CuFe2O4 and inhibiting the growth of secondary phases like Fe2O3 and CuO [42].
The Scherrer equation (see Equation (1)) was used to calculate the average crystallite size of the prepared samples, and the corresponding results are shown in Table 2. We found the average crystallite size with a range of 19–29 nm. The full width at half maximum (FWHM) of the main peaks was used to calculate the crystallite size of the prepared samples using Gaussian fit from the origin. The citric acid-assisted sample exhibited the smallest crystallite size (19 ± 0.18) among the synthesized samples. Conversely, the urea-assisted sample showed the largest average crystallite size (29 ± 0.56 nm). The differences in ignition temperatures and combustion heat of fuels lead to variations in the average crystallite sizes of the particles. Moreover, the standard relation (see Equations (1) and (2)), the corresponding Miller indices (h k l), and the interplanar spacing (d) were used to calculate the lattice constants (a) for each sample (shown in Table 2).
D = k λ β h k l cos θ
The lattice constant and d-spacing were also calculated for the most intense peak (311) of CuFe2O4 for all. Bragg’s law [43] and standard relations of the cubic lattice are used to calculate the d-spacing [44] and lattice constant, respectively, from Equations (2) and (3), and the results are shown in Table 1.
n λ = 2 sin θ
a = h 2 + k 2 + l 2
The structural properties of CuFe2O4 synthesized using different fuels show notable variations that are influenced by the choice of fuel. The sample synthesized with citric acid exhibited the smallest average crystallite size (19 nm), indicating better control over particle growth during the synthesis process. Smaller grains often result from controlled nucleation and growth during synthesis, leading to a more homogeneous particle distribution. Controlling the grain size prevents uncontrolled coalescence, which can lead to inconsistent particle sizes. In contrast, the urea and ethylene glycol samples showed larger crystallite sizes of 29 nm and 27 nm, respectively, likely due to differences in combustion characteristics leading to less uniform particle growth. The d-spacing values for the (hkl) planes remained consistent for the urea and ethylene glycol samples (1.42 Å) and slightly smaller for the citric acid sample (1.40 Å), suggesting minor variations in the interplanar spacing. The lattice constant (a) also varied slightly, with citric acid yielding the smallest value (8.66 Å), followed by urea (8.70 Å) and ethylene glycol (8.71 Å). The calculated values are compared with the existing literature on copper ferrite [45]. Overall, the citric acid fuel appears to produce CuFe2O4 with relatively finer crystallites and slightly tighter lattice parameters in comparison with the other two fuels.

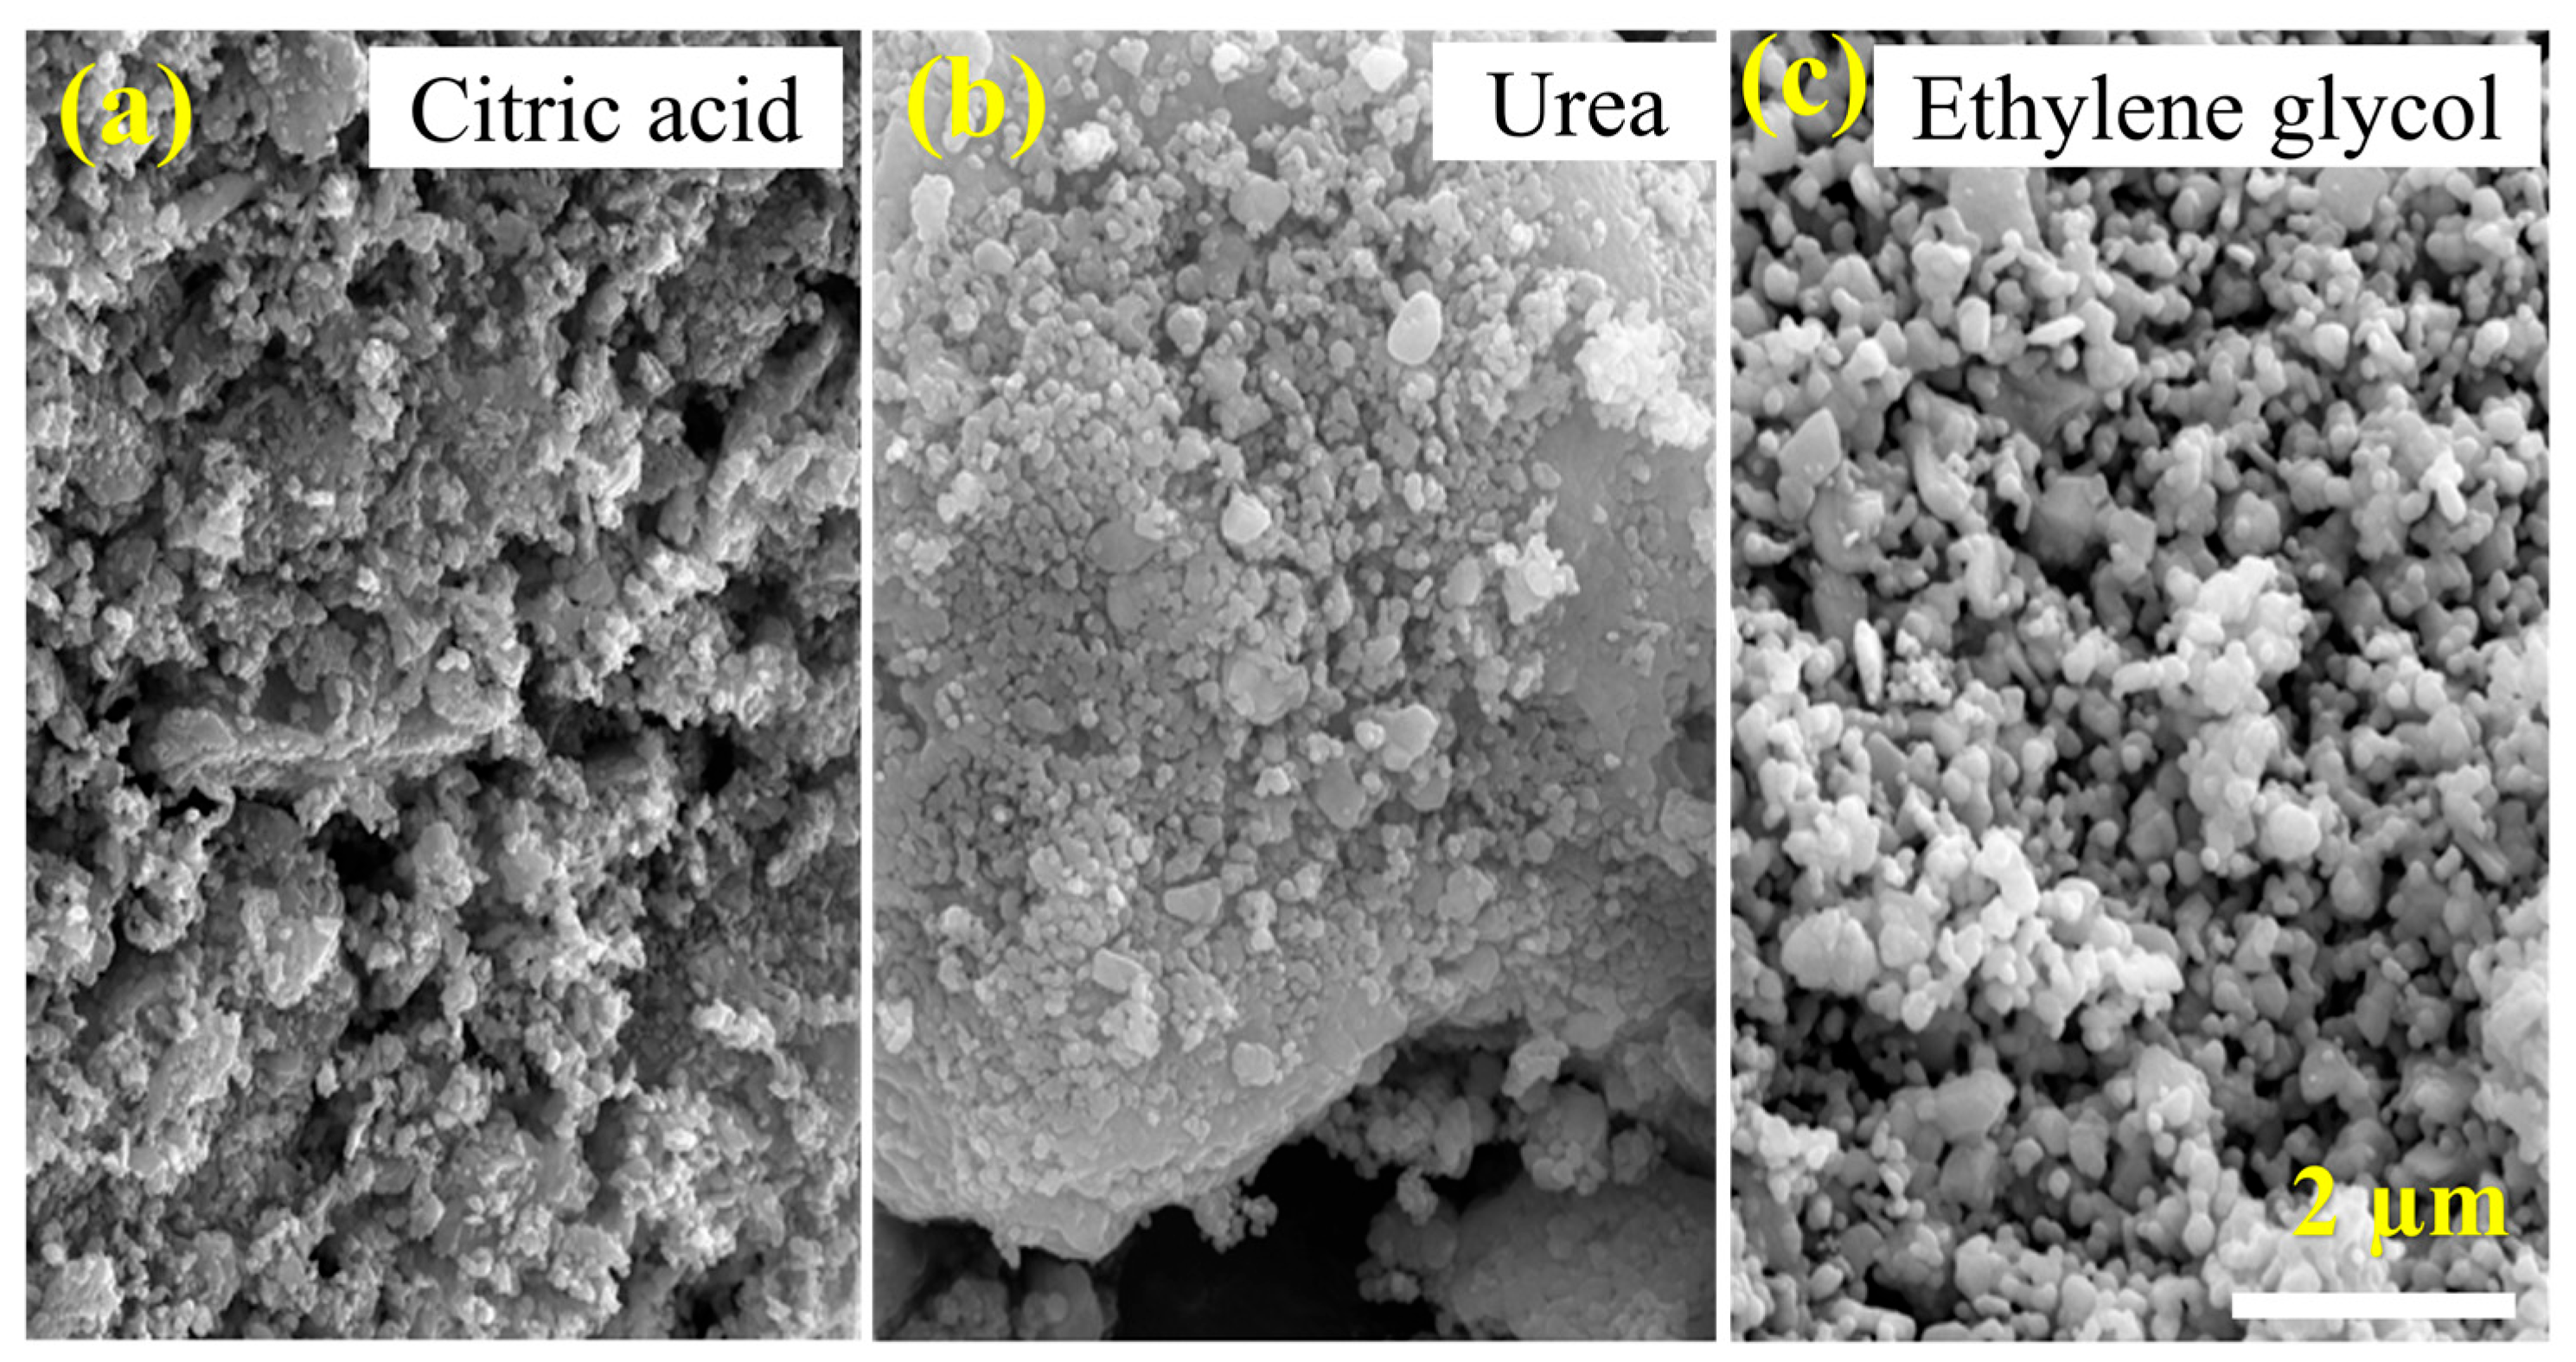
3.2. Scanning Electron Microscopy (SEM)

The surface structures of copper ferrite samples made with different fuels were studied using scanning electron microscopy (SEM). The effects of the fuel on the particle morphology and SEM images of the samples were examined. The copper ferrite synthesized with ethylene glycol has a spherical (sponge-like) morphology, whereas a mixed spherical and bumpy tubular structure was observed for the citric acid fuel. According to a previous finding, the surface morphologies of the samples made with various fuels varied due to the fuel’s varying reaction times [46]. The SEM images revealed that the particles were well-distributed with a uniform size distribution, although varying degrees of agglomeration were observed across the samples (see Figure 3). The samples synthesized with citric acid and urea showed a significantly higher degree of agglomeration compared to those synthesized with ethylene glycol. This was attributed to the higher carbon content after combustion, the faster chemical reaction, and the increased heat generation (as illustrated in Figure 3). This observation highlights the critical role that fuel selection plays in determining particle morphology. These findings emphasize that optimizing the choice of fuel is essential for tailoring particle characteristics to specific applications.

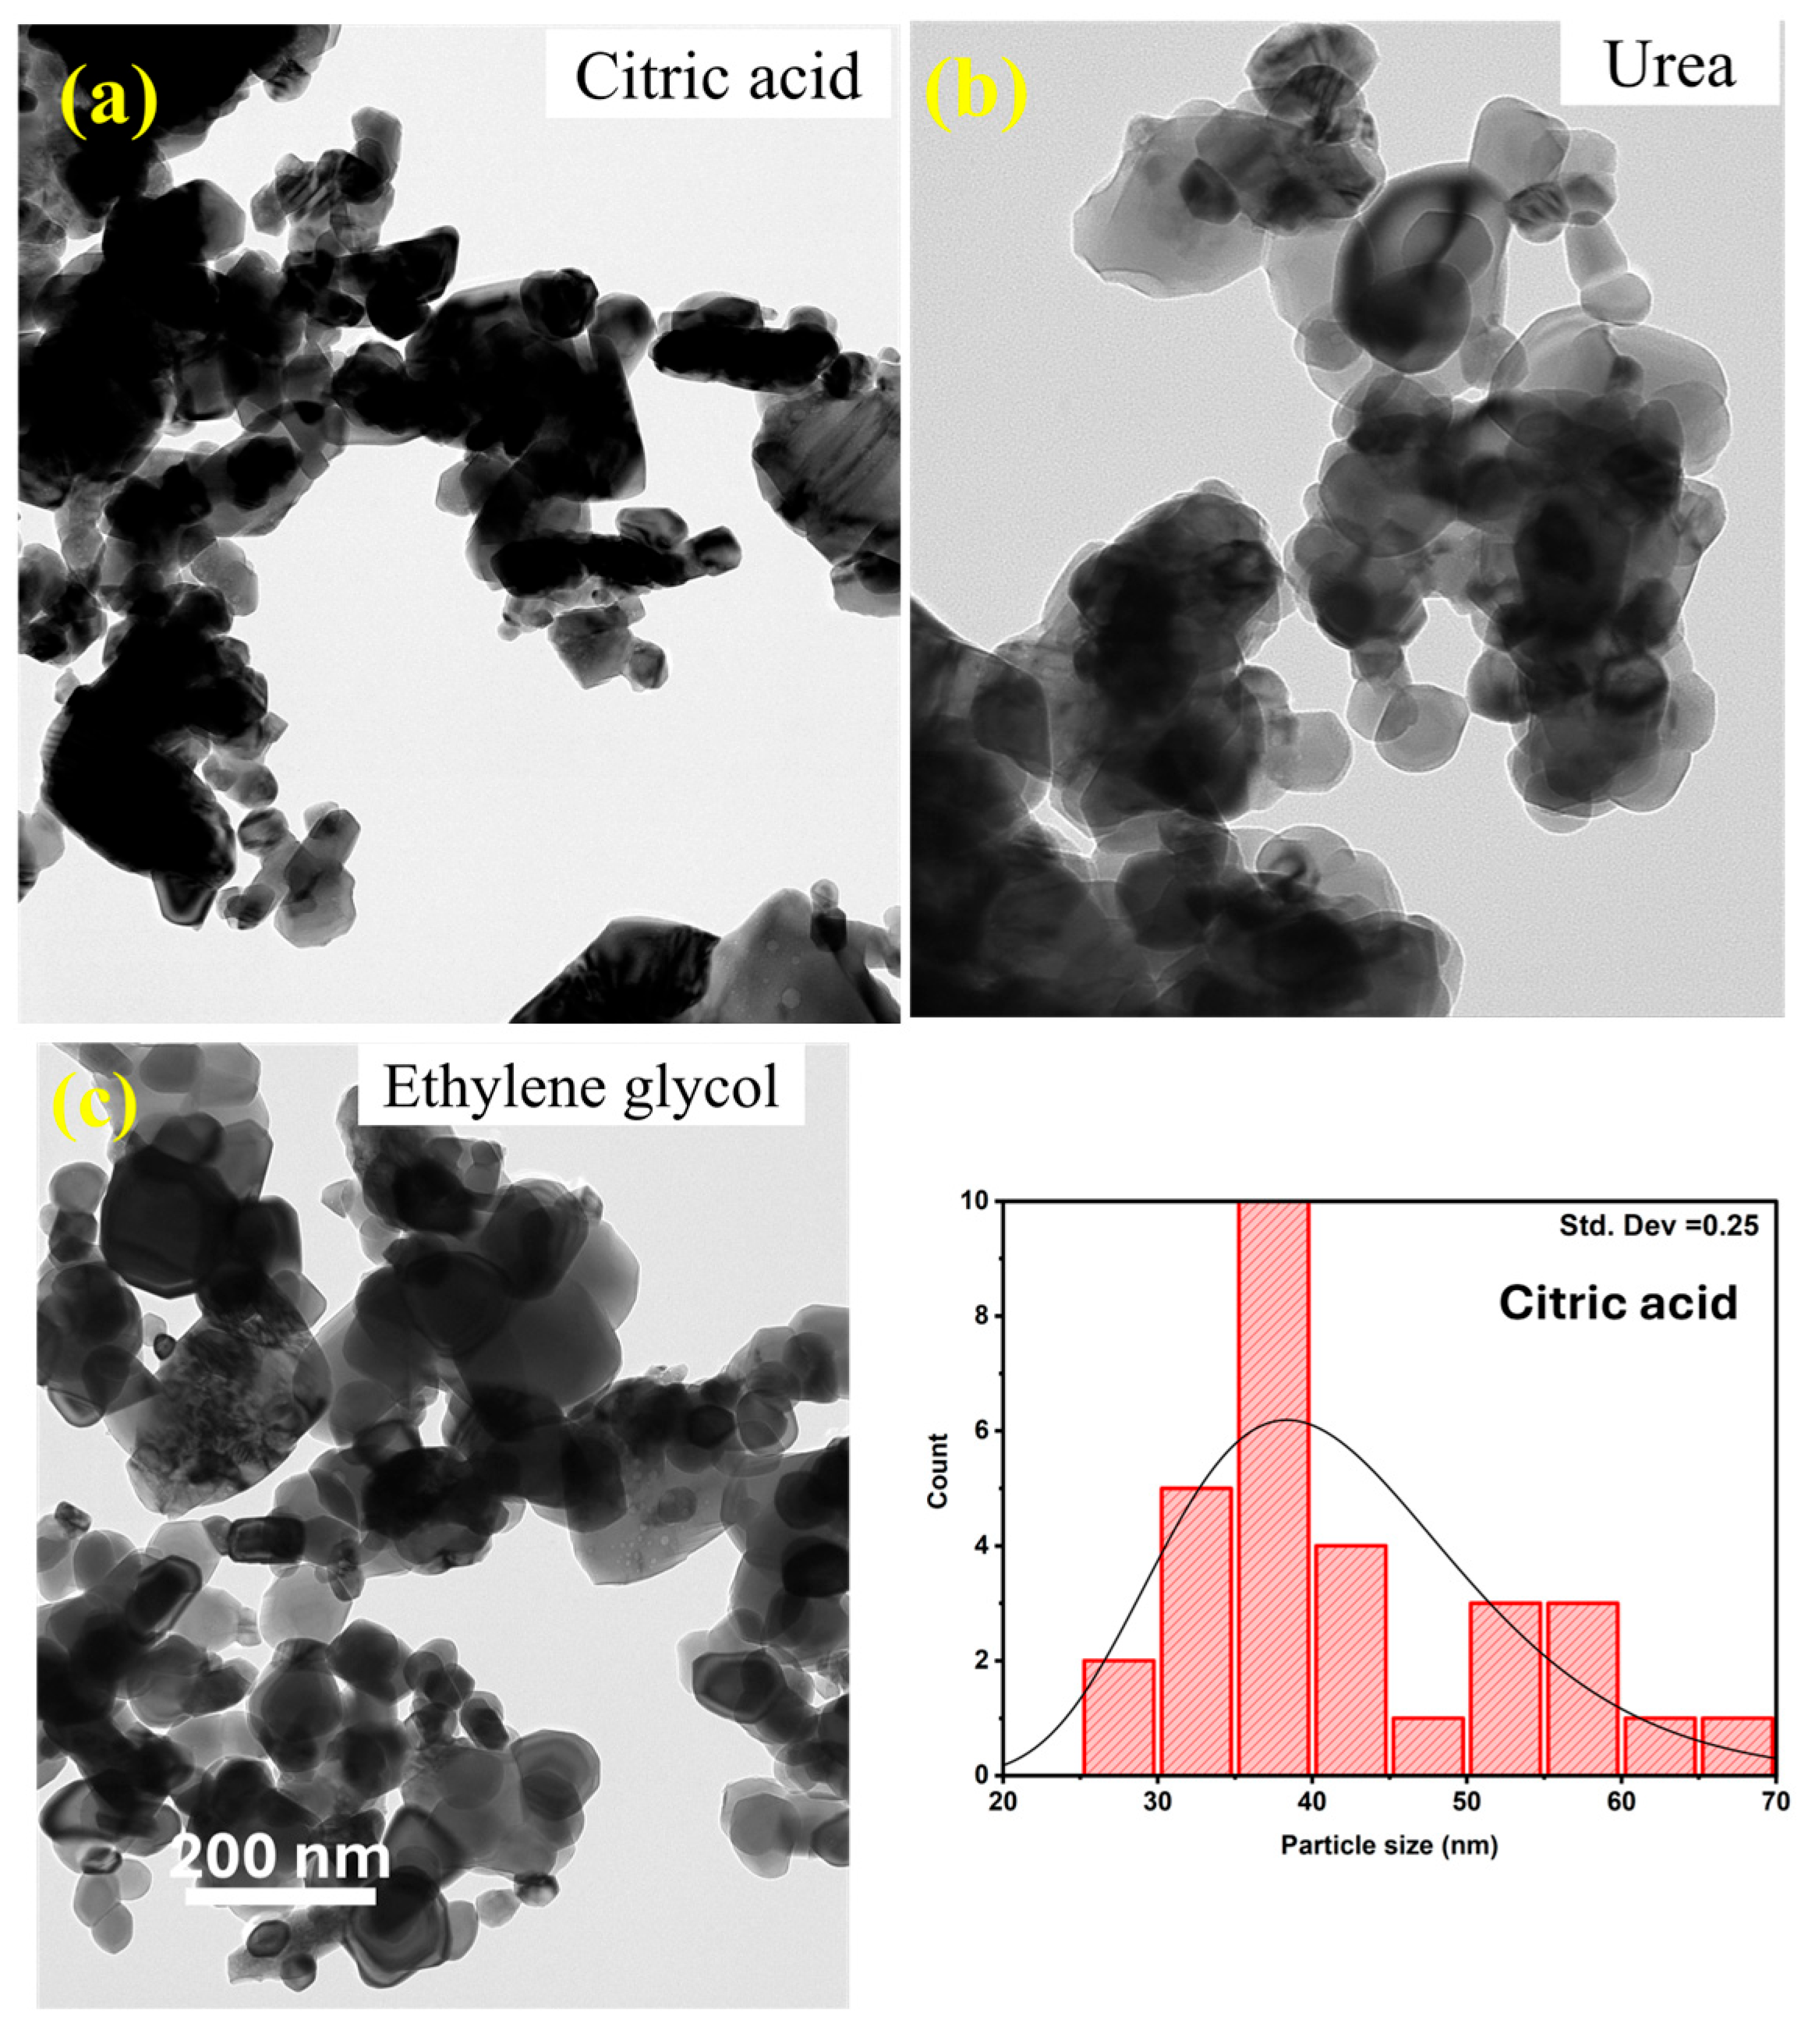
3.3. High-Resolution Transmission Electron Microscopy (HRTEM)

TEM samples were prepared by dissolving powder samples in ethanol and ultrasonicating them for 20 min, then applying a few drops to the grid for measurements. The morphology and particle size of the prepared samples were also investigated using TEM analysis (see Figure 4). TEM images showed the presence of nanoparticles that exhibited a morphology similar to that of CuFe2O4 ferrites. Similar to XRD, the TEM results showed that the fuel significantly affected the particle size and morphology of the obtained samples. The particle size was calculated using TEM, revealing a minimum for citric acid and a maximum for urea. The average particle sizes for citric acid, ethylene glycol, and urea were 41 ± 20 nm, 55.44 ± 23 nm, and 58.92 ± 26 nm, respectively. The morphology of the samples appeared to be a nearly spherical and bumpy tubular structure, and the nanoparticles aligned with the findings from SEM analyses.

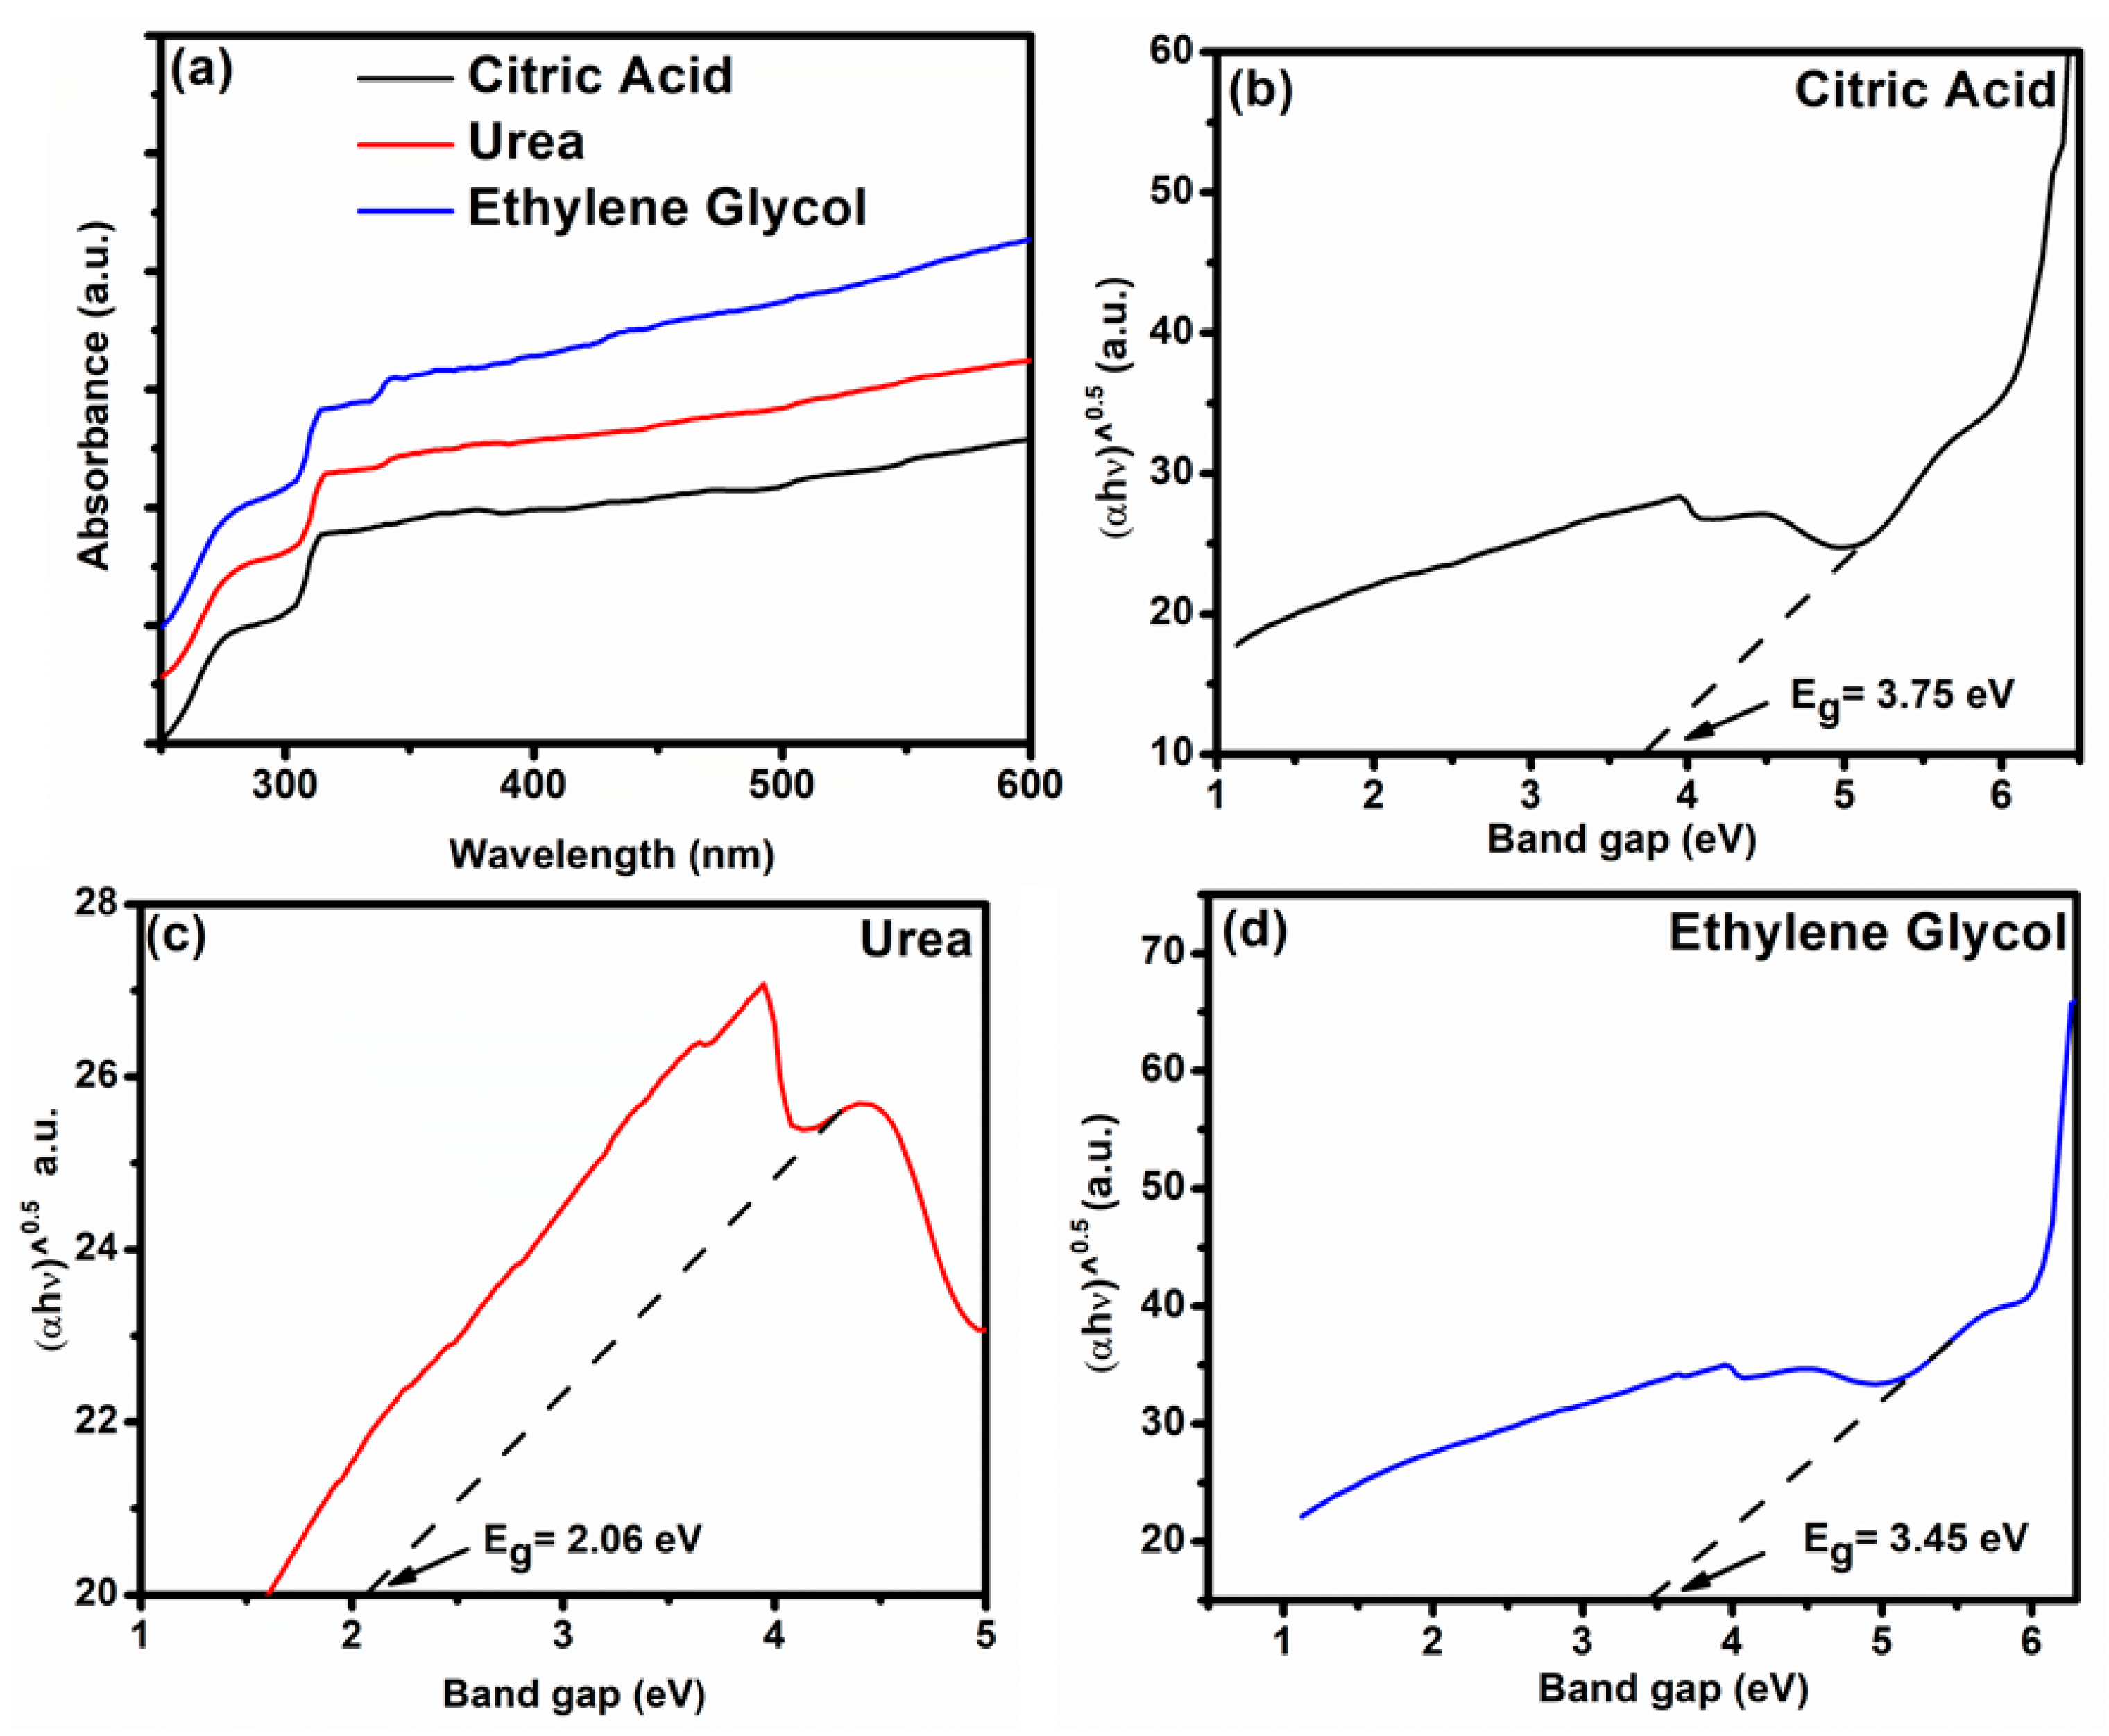
3.4. UV–Visible (UV-Vis) Spectroscopy

UV-Vis spectroscopy was used to examine the optical properties of the prepared samples. The bandgap of nanoparticles is strongly influenced by their size, primarily due to surface effects. As the particle size decreases, the surface-to-volume ratio increases, causing surface atoms to experience different bonding environments. This alters the electronic structure, leading to changes in the electronic and optical properties. The optical bandgap of CuFe2O4 nanoparticles is influenced by factors such as structural homogeneity, cation distribution, particle size, density, and porosity [11]. The optical spectra of synthesized samples were observed in the range of 250–600 nm (shown in Figure 5). The optical band gap (Eg) of the as-prepared samples is achieved through the following equation by a Tauc plot [47].
α h ν = A h ν E g n
α = 2.303 log A L
Here, α, , A, Eg, L, and n (with values of 2 and 1/2, representing the direct and indirect energy bandgaps) denote the optical absorption coefficient, photon energy, transition probability dependence constant, optical band gap, thickness, and the number expressing the absorption transition process, respectively. We avoided the first linear region, which could be primarily dominated by Urbach energy, and considered the second region for estimating the bandgap. A significant variation in the size of the band gap was obtained due to the fuel type, and it was found to be 3.75 eV, 2.06 eV, and 3.45 eV for citric acid, urea, and ethylene glycol, respectively (see Figure 5). The particle size was found to be the smallest for citric acid fuel, and correspondingly, the relatively largest bandgap size was obtained. We identified urea fuel as having the smallest bandgap, likely due to the introduction of sub-energy levels between the conduction band and the valence band. Therefore, the optical properties of CuFe2O4 nanoparticles are strongly influenced by the type of fuels used in sample preparation.

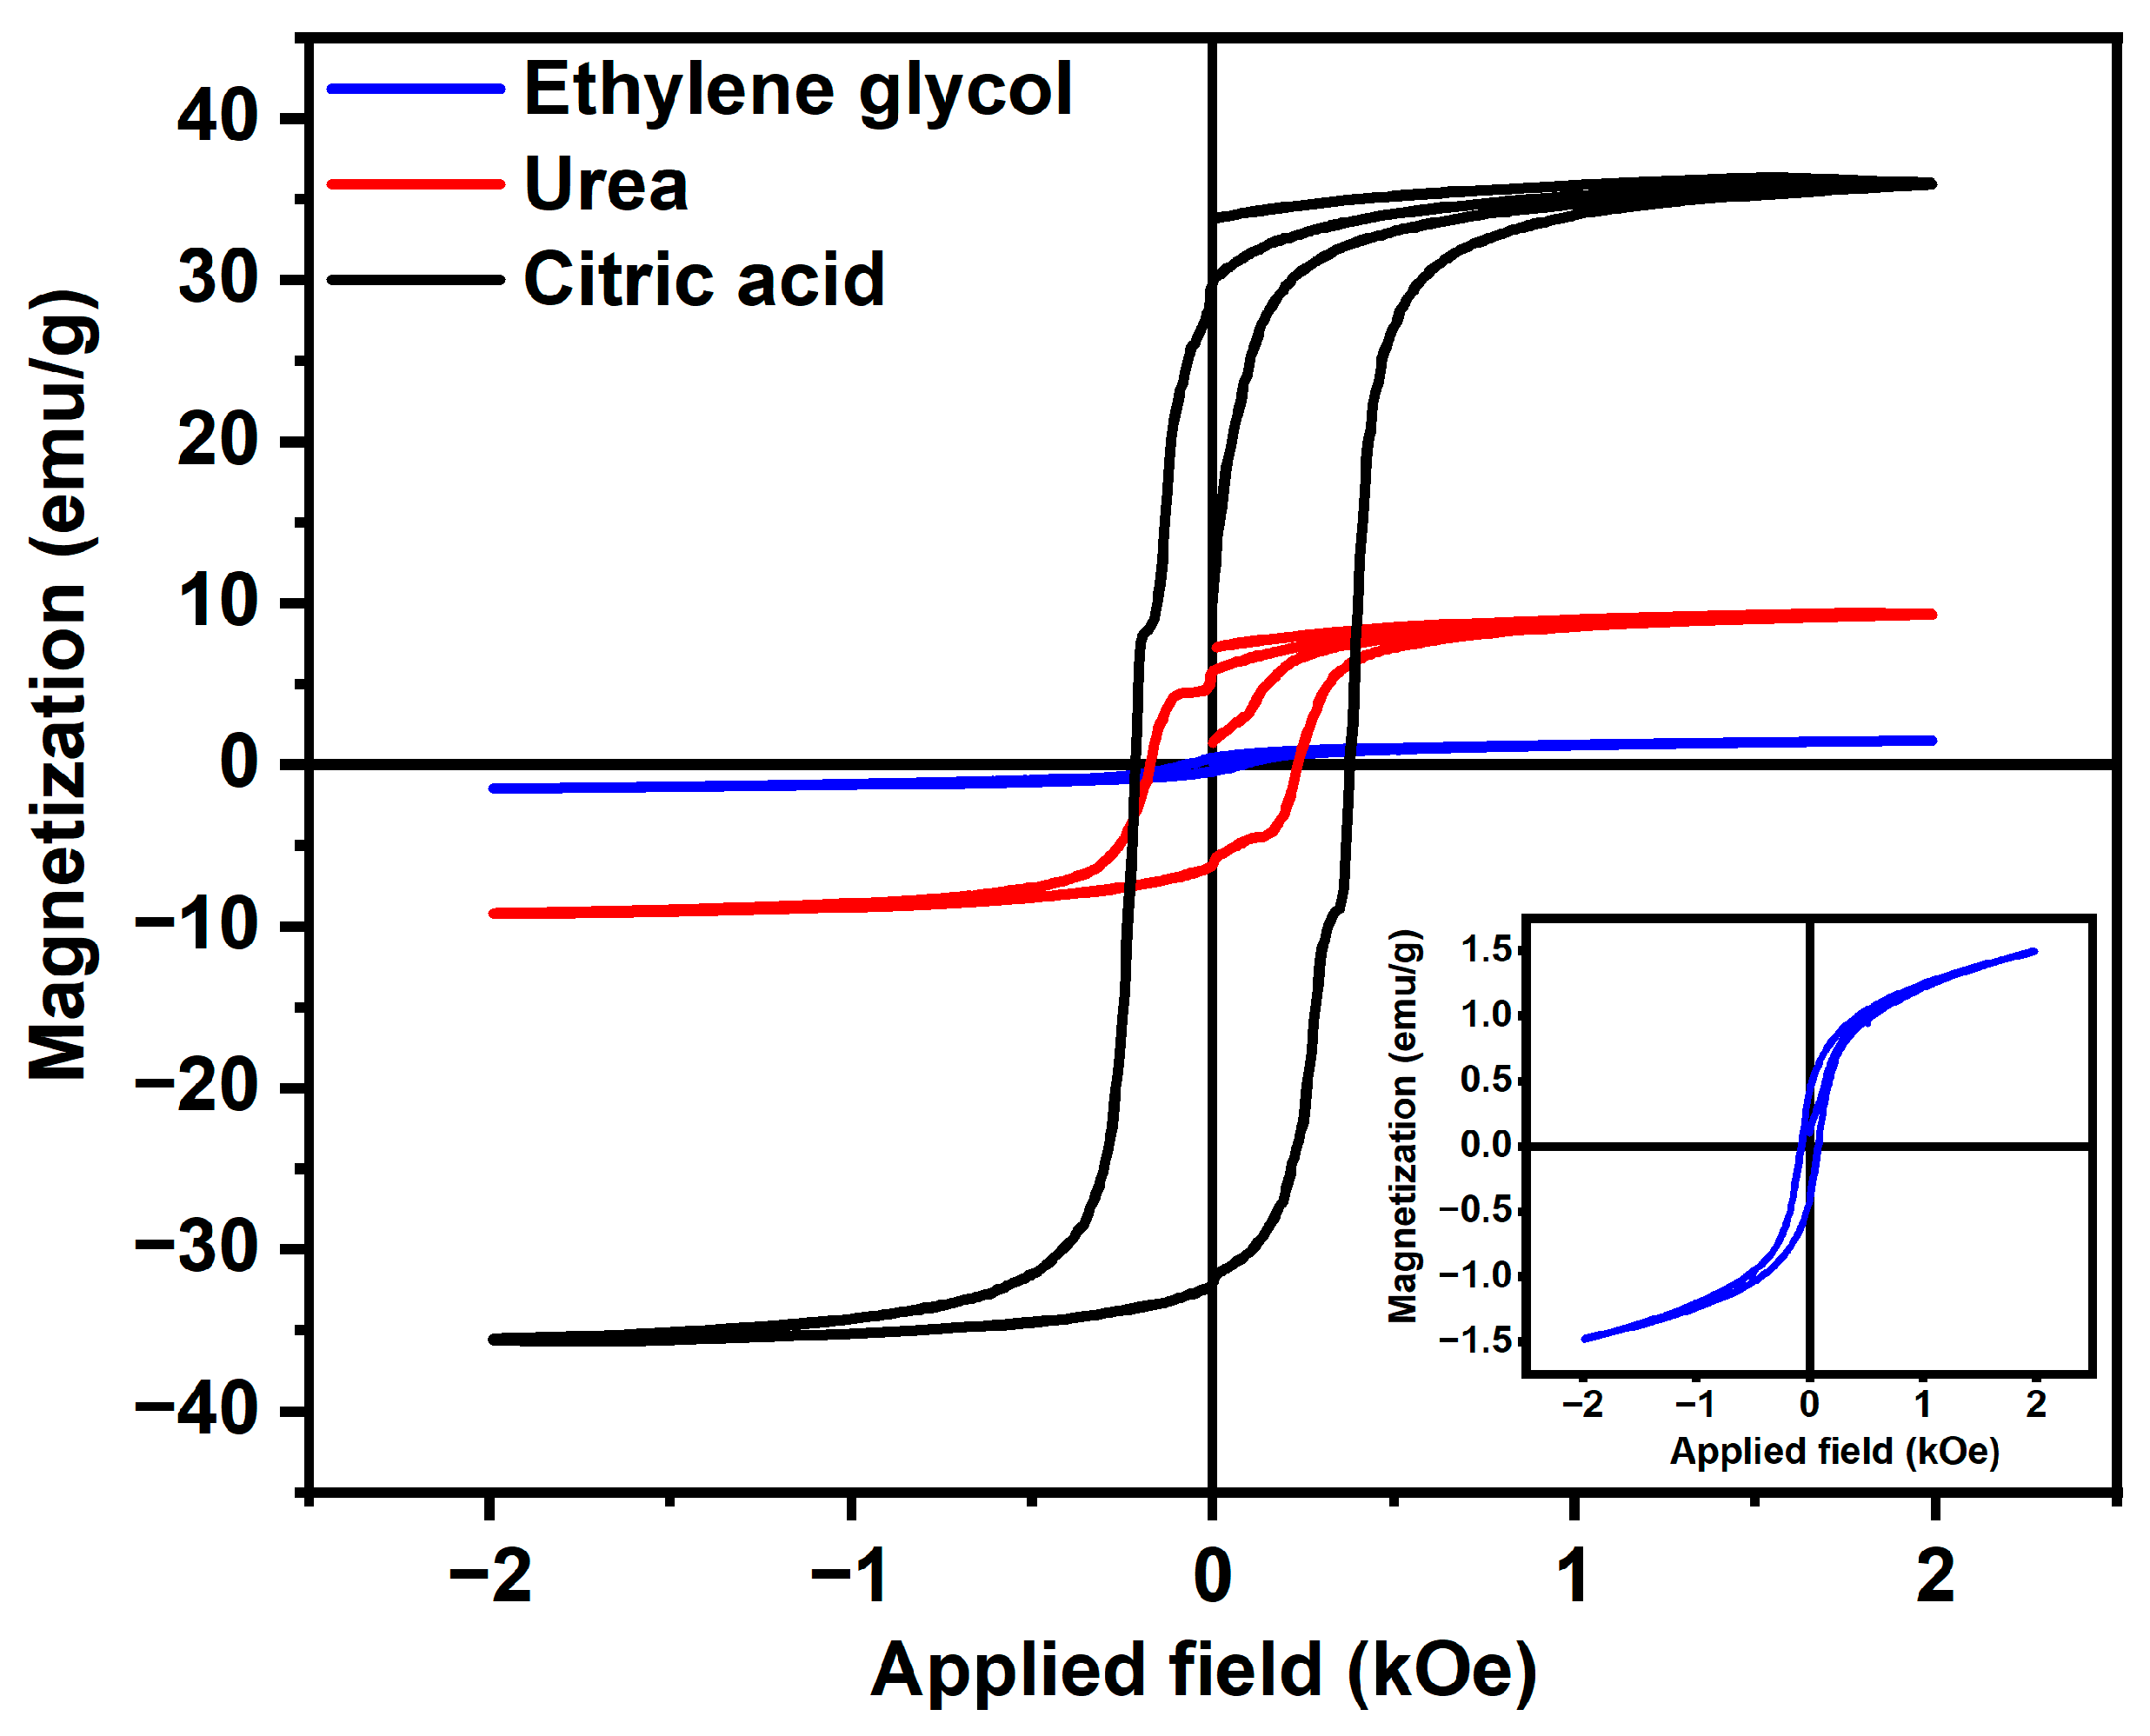
3.5. Vibrating Sample Magnetometer (VSM)

The plots of the vibrating sample magnetometer (VSM) for copper ferrites synthesized with various fuels, including citric acid, ethylene glycol, and urea, are depicted in Figure 6. The M-H curve for all samples exhibits symmetry and reaches a state of saturation magnetization. All samples display a hysteresis loop, indicating a ferrimagnetic–magnetic nature [48]. Similar to the optical results, the magnetic properties of the synthesized nanoparticles showed a correlation with the particle size. Furthermore, the formation of impurity phases such as Fe2O3 and CuO increased from citric acid to ethylene glycol, significantly affecting the sample’s magnetic properties. The magnetic saturation (MS) of copper ferrites with citric acid was 35.88 emu/gm, which is closely related to the value reported in the literature [49]. Magnetic saturation decreases from citric acid to ethylene glycol. This decrease in the (MS) value can be attributed to the quenching of the magnetic moment. According to Table 3, the squareness ratio (SQR) values ranged from 0.29 to 0.88, indicating that they are soft magnetic materials.
The magnetic response of spinel ferrites is also influenced by several factors, such as the size of the crystallites, chelating agent, impurity content, and distribution of cations [50]. The magnetic properties of CuFe2O4 samples synthesized by different fuels showed that the type of fuel has a significant influence on their performance. Among them, the sample prepared with citric acid showed relatively better magnetic behavior with the highest magnetic saturation of 35.88 emu/g, the highest remanence of 31.60 emu/g, and an MR/MS ratio of 0.88, showing strong domain alignment and high remanent magnetization. The MS of the urea-based sample was more moderate, with a value of 9.34 emu/g, having an MR/MS ratio of 0.51. The EG sample showed the lowest MS of 1.59 emu/g, indicating the poorest magnetic behavior due to the presence of a secondary phase of Fe2O3 [51]. In all samples, the coercivity was low, indicating that they are soft magnets. These variations also suggest that the nature of the fuel used may be influencing the nature of the resultant crystal structure and phase purity beyond affecting the particle morphology and that citric acid yields the optimal magnetic properties.

4. Discussion

Copper ferrite nanoparticles have been successfully synthesized using the sol-gel auto-combustion method with citric acid, urea, and ethylene glycol as fuels. The chemical, structural, and magnetic properties of ferrites are found to be strongly influenced by the fuel and synthesis methods. The XRD results confirmed the formation of cubic CuFeO4 alongside Fe2O3 and CuO, as well as other impurities, due to the use of ethylene glycol, consistent with previous reports [51]. This may result from the chelating activities of urea and citric acid on Cu and Fe ions, which encourages their even distribution and preferred formation while hindering crystal development. These observations are consistent with the findings of the impurity content. The intensity patterns of ethylene glycol samples may be affected by the presence of Fe2O3 and CuO impurities. The sample with citric acid has minimal contaminants, enabling a clearer analysis of the broadened CuFe2O4 peaks, likely resulting from the smaller crystal grain size.
The citric acid exhibited smaller crystallite sizes compared to the samples of ethylene glycol and urea. This difference in crystallite size may be attributed to the varying combustion pathways of the different fuels. Additionally, a distinct trend in combustion behavior was observed based on the selected chelating agent [52]. The combustion processes of urea and citric acid occur rapidly. Citric acid burns very quickly, while urea also combusts rapidly, though with slightly less intensity. In contrast, ethylene glycol leads to a slower and more prolonged auto-combustion process. The rapid release of heat and gases during combustion appears to support crystallite formation and control impurities. Additionally, the high porosity of the material is likely due to the swift release of combustion gases during the glycine synthesis process. Previous research indicates that the combustion of metal nitrates, urea, and citric acid can raise the flame temperature to between 1100 and 1450 °C. This sudden increase in temperature causes the rapid release of several gases, including carbon monoxide (CO), carbon dioxide (CO2), ammonia (NH3), nitrogen monoxide (NO), nitrogen dioxide (NO2), and water vapor (H2O) [30,31]. Therefore, the growth of microporous structures is aided by the combined effects of this massive energy release and gas production. These results are consistent with our SEM observations, which show that the citric acid- and urea-assisted samples had a lower porosity level than the ethylene glycol-synthesized samples.
The presence of impurity phases had a substantial effect on the electrical and magnetic properties of samples. In particular, the bandgap of urea samples was found to be the smallest among all samples, whereas poor magnetic properties were obtained for the samples prepared with ethylene glycol. The width and shape of the hysteresis loop are influenced by several factors, including the crystallite size, impurities, cation distribution, magnetic anisotropy, and synthesis conditions. For instance, fuels that produce rapid and high-energy combustion (e.g., citric acid) tend to generate smaller crystallite sizes and higher lattice strain due to the fast release of gases and heat. In contrast, fuels with slower combustion profiles (e.g., ethylene glycol) facilitate more gradual crystal growth, often resulting in larger crystallite sizes and reduced strain. These differences directly impact the lattice parameters, crystallite size, and degree of crystallinity, as observed in our experimental results. These samples showed low magnetic saturation due to impurities like Fe2O3 and CuO, as indicated by the XRD results. Previous studies indicate that the type of fuel used affects the magnetic properties (see Table 4). Finally, we compared our results with previous reports and found agreement between them. (see Table 4).

5. Conclusions

The sol-gel auto-combustion method was used to synthesize copper ferrite nanoparticles with a spinel structure. Three different fuels—ethylene glycol, citric acid, and urea—were employed during the synthesis process. The X-ray diffraction analysis confirmed the cubic phase of spinel copper ferrite, with impurities primarily identified in the urea and ethylene glycol samples. The nanoparticle size of the synthesized samples was found to strongly depend on the fuel selection. Notably, nanoparticles synthesized with citric acid exhibited a smaller average particle size of 19 nm. Regardless of the fuel used, the nanoparticles exhibited a sponge-like, spherical, and bumpy tubular structural morphology. Furthermore, the particle size significantly influenced the electrical and magnetic properties of the prepared samples. In particular, saturation magnetization, coercivity, and remanent magnetization decreased as the nanoparticle size grew. Furthermore, the formation of impurity phases, particularly Fe2O3 and CuO, significantly reduced the magnetic behavior of CuFe2O4 materials. The experimental results indicated that the use of citric acid as a fuel led to smaller particle sizes and relatively better magnetic properties compared to ethylene glycol and urea.

Author Contributions

Conceptualization, M.K. (Manika Khanuja) and N.M.; methodology, M.S.; validation, M.S., M.K. (Manika Khanuja) and N.M.; investigation, M.S. and M.K. (Mayur Khan); resources, M.K. (Manika Khanuja); data curation, M.S. and M.K. (Mayur Khan); writing—original draft preparation, M.S.; writing—review and editing, N.M.; visualization, M.S. and M.K. (Mayur Khan); supervision, M.K. (Manika Khanuja); project administration, M.K. (Manika Khanuja); funding acquisition, M.K. (Manika Khanuja). All authors have read and agreed to the published version of the manuscript.

Funding

This research received no external funding.

Institutional Review Board Statement

Not applicable.

Informed Consent Statement

Not applicable.

Data Availability Statement

The raw data supporting the conclusions of this article will be made available by the authors on request.

Acknowledgments

M.S. and M.K. (Manika Khanuja) acknowledge the Central Instrumentation Facility Centre, Jamia Millia Islamia (JMI), and AIRF (JNU) for their help with the characterization facilities. N.M. acknowledges the support provided by the MITACS Elevate Fellowship.

Conflicts of Interest

The authors declare no conflicts of interest.

References

  1. Majid, F.; Dildar, S.; Ata, S.; Bibi, I.; Mohsin, I.U.; Ali, A.; Almoneef, M.M.; Iqbal, M.; Irshad, S.; Nazir, A.; et al. Cobalt doping of nickel ferrites via sol gel approach: Effect of doping on the structural and dielectric properties. Z. Phys. Chem. 2021, 235, 1811–1829. [Google Scholar] [CrossRef]
  2. Ata, S.; Bano, S.; Bibi, I.; Alwadai, N.; Mohsin, I.U.; Al Huwayz, M.; Iqbal, M.; Nazir, A. Cationic distributions and dielectric properties of magnesium ferrites fabricated by sol-gel route and photocatalytic activity evaluation. Z. Phys. Chem. 2023, 237, 67–86. [Google Scholar] [CrossRef]
  3. Qin, H.; He, Y.; Xu, P.; Huang, D.; Wang, Z.; Wang, H.; Wang, Z.; Zhao, Y.; Tian, Q.; Wang, C. Spinel ferrites (MFe2O4): Synthesis, improvement and catalytic application in environment and energy field. Adv. Colloid Interface Sci. 2021, 294, 102486. [Google Scholar] [CrossRef]
  4. Sanchez-Lievanos, K.R.; Stair, J.L.; Knowles, K.E. Cation distribution in spinel ferrite nanocrystals: Characterization, impact on their physical properties, and opportunities for synthetic control. Inorg. Chem. 2021, 60, 4291–4305. [Google Scholar] [CrossRef] [PubMed]
  5. Khan, M.; Kumar, S.; Mishra, A.; Sulania, I.; Tripathi, M.N.; Tripathi, A. Study of structural and electronic properties of few-layer MoS2 film. Mater. Today Proc. 2022, 57, 100–105. [Google Scholar] [CrossRef]
  6. Khan, M.; Tripathi, M.N.; Tripathi, A. Strain-induced structural, elastic, and electronic properties of 1L-MoS2. J. Mater. Res. 2022, 37, 3340–3351. [Google Scholar] [CrossRef]
  7. Alabada, R.; Aadil, M.; Mubarik, S.; Alsalmah, H.A.; Hassan, W.; Ahmad, Z.; Ibrahim, M.M.; Mersal, G.A. Wet-chemical synthesis of sponge-like porous Zn-doped copper oxide ceramic as an efficient solar-light triggered photocatalyst for multiple applications. Z. Phys. Chem. 2023, 237, 1713–1731. [Google Scholar] [CrossRef]
  8. Amiri, M.; Salavati-Niasari, M.; Akbari, A. Magnetic nanocarriers: Evolution of spinel ferrites for medical applications. Adv. Colloid Interface Sci. 2019, 265, 29–44. [Google Scholar] [CrossRef]
  9. Talebniya, S.; Sharifi, I.; Saeri, M.R.; Doostmohammadi, A. Study of cation distribution and magnetic properties of MFe2O4 (M= Fe, Co, Zn, Mn, and Cu) nanoparticles. J. Supercond. Nov. Magn. 2022, 35, 899–908. [Google Scholar] [CrossRef]
  10. Khan, M.; Kedia, S.K.; Mishra, A.; Avasthi, D.K.; Tripathi, A. Investigation of the annealing temperature for few-layer MoS2 and ion-beam induced athermal annealing/purification behaviour by in-situ XRD. Appl. Surf. Sci. 2023, 639, 158106. [Google Scholar] [CrossRef]
  11. Salih, S.J.; Wali, M.M. Review on magnetic spinel ferrite (MFe2O4) nanoparticles: From synthesis to application. Heliyon 2023, 9, 6. [Google Scholar] [CrossRef] [PubMed]
  12. Dastjerdi, O.; Dehghani, H.S.; Mirshekari, S. A review of synthesis, characterization, and magnetic properties of soft spinel ferrites. Inorg. Chem. Commun. 2023, 153, 110797. [Google Scholar] [CrossRef]
  13. Dippong, T.; Levei, E.A.; Cadar, O. Recent Advances in Synthesis and Applications of MFe2O4 (M = Co, Cu, Mn, Ni, Zn) Nanoparticles. Nanomaterials 2021, 6, 1560. [Google Scholar] [CrossRef] [PubMed]
  14. Şaşmaz Kuru, T. Effect of calcination temperature on structural, magnetic, and dielectric properties of Mg0.75Zn0.25Al0.2Fe1.8O4 ferrites. J. Mater. Sci. Mater. Electron. 2024, 35, 415. [Google Scholar] [CrossRef]
  15. Rajivgandhi, G.N.; Ramachandran, G.; Kanisha, C.C.; Alharbi, N.S.; Kadaikunnan, S.; Khaled, J.M.; Alanzi, K.F.; Li, W.-J. Effect of Ti and Cu doping on the structural, optical, morphological and anti-bacterial properties of nickel ferrite nanoparticles. Res. Phys. 2021, 23, 104065. [Google Scholar] [CrossRef]
  16. Hwang, J.; Choi, M.; Shin, H.-S.; Ju, B.-K.; Chun, M. Structural and magnetic properties of NiZn ferrite nanoparticles synthesized by a thermal decomposition method. Appl. Sci. 2020, 10, 6279. [Google Scholar] [CrossRef]
  17. Amadan, R.; El-Masry, M.M. Effect of (Co and Zn) doping on structural, characterization and the heavy metal removal efficiency of CuFe2O4 nanoparticles. J. Aust. Ceram. Soc. 2024, 60, 509–524. [Google Scholar] [CrossRef]
  18. Masunga, N.; Mmelesi, O.K.; Kefeni, K.K.; Mamba, B.B. Recent advances in copper ferrite nanoparticles and nanocomposites synthesis, magnetic properties and application in water treatment. J. Environ. Chem. Eng. 2019, 7, 103179. [Google Scholar] [CrossRef]
  19. Sharma, M.; Singh, A.K.; Siddiqui, A.M. Synthesis and structural analysis of copper ferrite nanoparticles. In Proceedings of the AIP Conference Proceedings, Jodhpur, India, 18–22 December 2019; Volume 2265, p. 1. [Google Scholar] [CrossRef]
  20. Calvo-de la Rosa, J.; Segarra Rubí, M. Influence of the synthesis route in obtaining the cubic or tetragonal copper ferrite phases. Inorg. Chem. 2020, 59, 8775–8788. [Google Scholar] [CrossRef]
  21. Lakshman, M. Recent developments in coupling reactions catalyzed by copper ferrite nanoparticles (CuFe2O4 NPs). J. Synth. Chem. 2023, 1, 148–154. [Google Scholar]
  22. Wu, D.; Lu, G.; Yao, J.; Zhou, C.; Liu, F.; Liu, J. Adsorption and catalytic electro-peroxone degradation of fluconazole by magnetic copper ferrite/carbon nanotubes. Chem. Eng. J. 2019, 370, 409–419. [Google Scholar] [CrossRef]
  23. Du, J.; Liu, Z.; Wu, W.; Li, Z.; Han, B.; Huang, Y. Preparation of single-crystal copper ferrite nanorods and nanodisks. Mater. Res. Bull. 2005, 40, 928–935. [Google Scholar] [CrossRef]
  24. Ponhan, W.; Maensiri, S. Fabrication and magnetic properties of electrospun copper ferrite (CuFe2O4) nanofibers. Solid State Sci. 2009, 11, 479–484. [Google Scholar] [CrossRef]
  25. Flores-Lasluisa, J.X.; Salinas-Torres, D.; López-Ramón, M.V.; Álvarez, M.A.; Moreno-Castilla, C.; Cazorla-Amorós, D.; Morallón, E. Copper ferrite nanospheres composites mixed with carbon black to boost the oxygen reduction reaction. Colloids Surf. A Physicochem. Eng. Asp. 2021, 613, 126060. [Google Scholar] [CrossRef]
  26. Khan, M.; Meena, R.; Avasthi, D.K.; Tripathi, A. Study of Ion Velocity Effect on the Band Gap of CVD-Grown Few-Layer MoS2. ACS Omega 2023, 8, 46540–46547. [Google Scholar] [CrossRef]
  27. Reitz, C.; Suchomski, C.; Haetge, J.; Leichtweiss, T.; Jagličić, Z.; Djerdj, I.; Brezesinski, T. Soft-templating synthesis of mesoporous magnetic CuFe2O4 thin films with ordered 3D honeycomb structure and partially inverted nanocrystalline spinel domains. Chem. Commun. 2012, 48, 4471–4473. [Google Scholar] [CrossRef]
  28. Kuznetsov, M.V.; Morozov, Y.G.; Belousova, O.V. Synthesis of copper ferritenanoparticles. Inorganicmaterials 2013, 49, 606–615. [Google Scholar] [CrossRef]
  29. Kolahalam, L.A.; Viswanath, I.K.; Diwakar, B.S.; Govindh, B.; Reddy, V.; Murthy, Y.L.N. Review on nanomaterials: Synthesis and applications. Mater. Today Proc. 2019, 18, 2182–2190. [Google Scholar] [CrossRef]
  30. Kurian, M.; Nair, D.S. Effect of preparation conditions on nickel zinc ferrite nanoparticles: A comparison between sol–gel auto combustion and co-precipitation methods. J. Saudi Chem. Soc. 2016, 20, S517–S522. [Google Scholar] [CrossRef]
  31. Parauha, Y.R.; Sahu, V.; Dhoble, S.J. Prospective of combustion method for preparation of nanomaterials: A challenge. Mater. Sci. Eng. B 2021, 267, 115054. [Google Scholar] [CrossRef]
  32. Kandhasamy, S.; Pandey, A.; Minakshi, M. Polyvinylpyrrolidone assisted sol–gel route LiCo1/3Mn1/3Ni1/3PO4 composite cathode for aqueous rechargeable battery. Electrochim. Acta 2012, 60, 170–176. [Google Scholar] [CrossRef]
  33. Sutka, A.; Mezinskis, G. Sol-gel auto-combustion synthesis of spinel-type ferrite nanomaterials. Front. Mater. Sci. 2012, 6, 128–141. [Google Scholar] [CrossRef]
  34. Varma, A.; Mukasyan, A.S.; Rogachev, A.S.; Manukyan, K.V. Solution combustion synthesis of nanoscale materials. Chem. Rev. 2016, 116, 14493–14586. [Google Scholar] [CrossRef] [PubMed]
  35. Ye, Z.; Deng, Z.; Zhang, L.; Chen, J.; Wang, G.; Wu, Z. The structure of copper ferrite prepared by five methods and its catalytic activity on lignin oxidative degradation. Mater. Res. Express 2020, 7, 035007. [Google Scholar] [CrossRef]
  36. Calvo-de la Rosa, J.; Segarra, M. Optimization of the synthesis of copper ferrite nanoparticles by a polymer-assisted sol–gel method. ACS Omega 2019, 4, 18289–18298. [Google Scholar] [CrossRef]
  37. Junaid, M.; Khan, M.A.; Abubshait, S.A.; Akhtar, M.N.; Kattan, N.A.; Laref, A.; Javed, H.M.A. Structural, spectral, dielectric and magnetic properties of indium substituted copper spinel ferrites synthesized via sol gel technique. Ceram. Int. 2020, 46, 27410–27418. [Google Scholar] [CrossRef]
  38. Oliveira, T.P.; Rodrigues, S.F.; Marques, G.N.; Viana Costa, R.C.; Garçone Lopes, C.G.; Aranas, C., Jr.; Rojas, A.; Gomes Rangel, J.H.; Oliveira, M.M. Synthesis, characterization, and photocatalytic investigation of CuFe2O4 for the degradation of dyes under visible light. Catalysts 2022, 12, 623. [Google Scholar] [CrossRef]
  39. Astaraki, H.; Masoudpanah, S.M.; Alamolhoda, S. Effects of ethylene glycol contents on phase formation, magnetic properties and photocatalytic activity of CuFe2O4/Cu2O/Cu nanocomposite powders synthesized by solvothermal method. J. Mater. Res. Technol. 2021, 14, 229–241. [Google Scholar] [CrossRef]
  40. Wahba, M.A. Unveiling significant changes in optical, magnetic, and visible-light photocatalytic performance of CuFe2O4 nanocompositions through chelating agent modulation. Ceram. Int. 2025, 51, 4329–4342. [Google Scholar] [CrossRef]
  41. Kandhasamy, S.; Singh, P.; Thurgate, S.; Ionescu, M.; Appadoo, D.; Minakshi, M. Olivine-type cathode for rechargeable batteries: Role of chelating agents. Electrochim. Acta 2012, 82, 302–308. [Google Scholar] [CrossRef]
  42. Soufi, A.; Hajjaoui, H.; Elmoubarki, R.; Abdennouri, M.; Barka, N. Sol-gel auto-combustion synthesis of Cu1-xMgxFe2O4 nanoparticles and their heterogenous Fenton-like activity towards tartrazine. Inorg. Chem. Commun. 2022, 142, 109717. [Google Scholar] [CrossRef]
  43. Bandyopadhyay, R.; Selbo, J.; Amidon, G.E.; Hawley, M. Application of powder X-ray diffraction in studying the compaction behavior of bulk pharmaceutical powders. J. Pharm. Sci. 2005, 94, 2520–2530. [Google Scholar] [CrossRef]
  44. Basak, M.; Rahman, M.L.; Ahmed, M.F.; Biswas, B.; Sharmin, N. The use of X-ray diffraction peak profile analysis to determine the structural parameters of cobalt ferrite nanoparticles using Debye-Scherrer, Williamson-Hall, Halder-Wagner and Size-strain plot: Different precipitating agent approach. J. Alloys Compd. 2022, 895, 162694. [Google Scholar] [CrossRef]
  45. Deraz, N.M. Size and crystallinity-dependent magnetic properties of copper ferrite nano-particles. J. Alloys Compd. 2010, 501, 317–325. [Google Scholar] [CrossRef]
  46. Dumitrescu, A.M.; Borhan, A.I.; Iordan, A.R.; Dumitru, I.; Palamaru, M.N. Influence of chelating/fuel agents on the structural features, magnetic and dielectric properties of Ni ferrite. Powder Technol. 2014, 268, 95–101. [Google Scholar] [CrossRef]
  47. Dhiwahar, A.T.; Sundararajan, M.; Sakthivel, P.; Dash, C.S.; Yuvaraj, S. Microwave-assisted combustion synthesis of pure and zinc-doped copper ferrite nanoparticles: Structural, morphological, optical, vibrational, and magnetic behavior. J. Phys. Chem. Solids 2020, 138, 109257. [Google Scholar] [CrossRef]
  48. Patil, D.R.; Chougule, B.K. Effect of copper substitution on electrical and magnetic properties of NiFe2O4 ferrite. Mater. Chem. Phys. 2009, 117, 35–40. [Google Scholar] [CrossRef]
  49. Sharma, M.; Sharma, G.; Tyagi, N.; Siddiqui, A.M.; Khanuja, M. Advanced photocatalytic degradation of textile dyes and removal of heavy metal ions from MFe2O4 using photo-Fenton mechanism. J. Mater. Sci. Mater. Electron. 2024, 35, 497. [Google Scholar] [CrossRef]
  50. Fathi, H.; Masoudpanah, S.M.; Alamolhoda, S.; Parnianfar, H. Effect of fuel type on the microstructure and magnetic properties of solution combusted Fe3O4 powders. Ceram. Int. 2017, 43, 7448–7453. [Google Scholar] [CrossRef]
  51. Pavithradevi, S.; Suriyanarayanan, N.; Boobalan, T. Synthesis, structural, dielectric and magnetic properties of polyol assisted copper ferrite nano particles. J. Magn. Magn. Mater. 2017, 426, 37–143. [Google Scholar] [CrossRef]
  52. Siriwipa, P.; Kamwanna, T.; Amornkitbamrung, V. Effect of fabrication method on the structural and the magnetic properties of copper ferrite. J. Korean Phys. Soc. 2016, 68, 697–704. [Google Scholar] [CrossRef]
  53. Vara Prasad, B.B.V.S.; Ramesh, K.V.; Srinivas, A. Structural and magnetic studies of nano-crystalline ferrites MFe2O4 (M= Zn, Ni, Cu, and Co) synthesized via citrate gel autocombustion method. J. Supercond. Nov. Magn. 2017, 30, 3523–3535. [Google Scholar] [CrossRef]
  54. Ghumare, A.B.; Mane, M.L.; Shirsath, S.E.; Lohar, K.S. Role of pH and sintering temperature on the properties of tetragonal–cubic phases composed copper ferrite nanoparticles. J. Inorg. Organomet. Polym. Mater. 2018, 28, 2612–2619. [Google Scholar] [CrossRef]
  55. Padampalle, A.S.; Suryawanshi, A.D.; Navarkhele, V.M.; Birajdar, D.S. Structural and magnetic properties of nanocrystalline copper ferrites synthesized by sol-gel autocombustion method. Int. J. Rec. Technol. Eng. 2013, 2, 2277–3878. [Google Scholar]
  56. Sivakumar, A.; Dhas, S.S.J.; Almansour, A.I.; Kumar, R.S.; Arumugam, N.; Dhas, S.M.B. Assessment of crystallographic and magnetic phase stabilities of cubic copper ferrite at shocked conditions. J. Mater. Sci. Mater. Electron. 2021, 32, 2732–12742. [Google Scholar] [CrossRef]
  57. Tehrani-Bagha, A.R.; Gharagozlou, M.; Emami, F. Catalytic wet peroxide oxidation of a reactive dye by magnetic copper ferrite nanoparticles. J. Environ. Chem. Eng. 2016, 4, 1530–1536. [Google Scholar] [CrossRef]
Figure 1. Experimental method for copper ferrite synthesis from different fuels.
Appliedchem 05 00009 g001
Figure 2. XRD patterns of copper ferrite with different fuels.
Appliedchem 05 00009 g002
Figure 3. SEM results of copper ferrite synthesized with different fuels. (a) Citric acid; (b) Urea; (c) Ethylene glycol.
Appliedchem 05 00009 g003
Figure 4. TEM results of copper ferrite synthesized with different fuels and particle size distribution of CuFe2O4 (citric acid). (a) Citric acid; (b) Urea; (c) Ethylene glycol.
Appliedchem 05 00009 g004
Figure 5. (a) UV-Vis results for copper ferrite synthesized with different fuels and tauc plot bandgap energy of Copper ferrites for (b) Citric acid; (c) Urea; (d) Ethylene glycol.
Appliedchem 05 00009 g005
Figure 6. VSM results for copper ferrite synthesized with different fuels.
Appliedchem 05 00009 g006
Table 1. Results of the XRD analysis for copper ferrite samples prepared with various fuels.
Citric AcidUreaEthylene Glycol
S.N2θ (Degree)FWHM (Degree)D (nm)2θ (Degree)FWHM (Degree)D (nm)2θ (Degree)FWHM (Degree)D (nm)
118.387240.4090719.6654224.178470.3212925.2771833.206840.2607531.78027
229.945310.3573923.0008733.197650.2871828.8547535.634650.3395524.56565
335.549510.38579321.6159435.659020.3418724.4006238.238390.4217819.927
438.736030.438719.1875138.775040.2992128.1359940.61330.2486834.04962
544.027320.566815.1123549.514760.2416636.18749.503690.3214327.20518
658.161710.501918.1046354.122910.3069829.0490954.120410.3089128.86728
762.123480.545916.9819962.306540.3089330.0372662.485480.3185829.15497
Table 2. The lattice constant (a), crystallite size (D) and d-spacing for copper ferrites synthesized with different fuels.
FuelAverage Crystallite Size (D), nmd-Spacing (311), ÅLattice Constant (a), Å
Citric acid19 ± 0.18 1.408.66
Urea29 ± 0.561.428.70
Ethylene glycol27 ± 0.321.428.71
Table 3. Magnetic parameters for copper ferrites synthesized with different fuels.
SamplesMagnetic Saturation (MS), emu/gmRemanence (MR), emu/gmCoercivity (-HC), kOeMR/MS
CuFe2O4 (CA)35.88 ± 0.31731.600.280.88
CuFe2O4 (Urea)9.34 ± 0.06854.770.090.51
CuFe2O4 (EG)1.59 ± 0.07210.470.080.29
Table 4. The effects of the fuel and synthesis method on the crystallite size and magnetic properties of CuFe2O4.
S.n.MethodsFuelSize (nm)Ms(emu/gm)Reference
1.Self-combustion with different temperatures from 773 to 1173 °CUrea26.2–40.343.3–34.9 [52]
Glycine36.3–38.631.3–24.7
2.Citrate gel auto-combustion methodCitric acid18.424[53]
3.Sol-gel auto-combustion method with a ratio of metal nitrates to citric acid of 1:3 at different calcination temperatures of 600, 800, and 1000 °C and different pH valuesCitric acid17.97, 25.20, 32.36, 34.399.26, 15.25,
19.26, 25.15
[54]
4.Solution combustion method with different calcination temperatures ranging from 400 to 1100 °CUrea8.2–49.8NA[38]
5.Sol-gel auto-combustion method with a ratio of metal nitrates to citric acid of 1:3 at different calcination temperatures of 350, 550, 750, 950, and 1050 °C for 5 hCitric acid22, 45, 66, 85 9.50, 9.91, 11, 21.34[55]
6.Sol-gel with different shock conditionsUrea35.46–35.56 35.35–35.75[56]
7.Polymeric precursor methodCitric acid and Ethylene glycol296.5[57]
8.Sol-gel auto-combustionCitric acid19 ± 0.18 35.88Present work
Urea29 ± 0.569.34
Ethylene glycol27 ± 0.321.59
Disclaimer/Publisher’s Note: The statements, opinions and data contained in all publications are solely those of the individual author(s) and contributor(s) and not of MDPI and/or the editor(s). MDPI and/or the editor(s) disclaim responsibility for any injury to people or property resulting from any ideas, methods, instructions or products referred to in the content.

