Review

Comparison of Satellite-Based and Ångström–Prescott Estimated Global Horizontal Irradiance under Different Cloud Cover Conditions in South African Locations

1
Research & Development Division, South African Weather Service, Pretoria 0001, South Africa
2
Department of Physics, University of South Africa, Pretoria 0001, South Africa
3
Move Beyond Consulting (Pty) Ltd., Pretoria 0081, South Africa
*
Author to whom correspondence should be addressed.
Solar 2022, 2(3), 354-374; https://doi.org/10.3390/solar2030021
Submission received: 13 April 2022 / Revised: 27 June 2022 / Accepted: 28 June 2022 / Published: 16 August 2022

Abstract

:
The study compares the performance of satellite-based datasets and the Ångström–Prescott (AP) model in estimating the daily global horizontal irradiance (GHI) for stations in South Africa. The daily GHI from four satellites (namely SOLCAST, CAMS, NASA SSE, and CMSAF SARAH) and the Ångström–Prescott (AP) model are evaluated by validating them against ground observation data from eight radiometric stations located in all six macro-climatological regions of South Africa, for the period 2014-19. The evaluation is carried out under clear-sky, all-sky, and overcast-sky conditions. CLAAS-2 cloud fractional coverage data are used to determine clear and overcast sky days. The observed GHI data are first quality controlled using the Baseline Surface Radiation Network methodology and then quality control of the HelioClim model. The traditional statistical benchmarks, namely the relative mean bias error (rMBE), relative root mean square error (rRMSE), relative mean absolute error (rMAE), and the coefficient of determination (R2) provided information about the performance of the datasets. Under clear skies, the estimated datasets showed excellent performance with maximum rMBE, rMAE, and rRMSE less than 6.5% and a minimum R2 of 0.97. In contrast, under overcast-sky conditions there was noticeably poor performance with maximum rMBE (24%), rMAE (29%), rRMSE (39%), and minimum R2 (0.74). For all-sky conditions, good correlation was found for SOLCAST (0.948), CMSAF (0.948), CAMS (0.944), and AP model (0.91); all with R2 over 0.91. The maximum rRMSE for SOLCAST (10%), CAMS (12%), CMSAF (12%), and AP model (11%) was less than 13%. The maximum rMAE for SOLCAST (7%), CAMS (8%), CMSAF (8%), and AP model (9%) was less than 10%, showing good performance. While the R2 correlations for the NASA SSE satellite-based GHI were less than 0.9 (0.896), the maximum rRMSE was 18% and the maximum rMAE was 15%, showing rather poor performance. The performance of the SOLCAST, CAMS, CMSAF, and AP models was almost the same in the study area. CAMS, CMSAF, and AP models are viable, freely available datasets for estimating the daily GHI at South African locations with quantitative certainty. The relatively poor performance of the NASA SSE datasets in the study area could be attributed to their low spatial resolution of 0.5° × 0.5° (~55 km × 55 km). The feasibility of the datasets decreased significantly as the proportion of sky that was covered by clouds increased. The results of the study could provide a basis/data for further research to correct biases between in situ observations and the estimated GHI datasets using machine learning algorithms.

1. Introduction

The Sun is the source of energy that influences atmospheric motions and the climate of the Earth [1,2,3,4,5]. Solar radiation is the term that was coined for the energy from the Sun. The amount and distribution of incoming solar energy affects the weather and climate on Earth. The quantity and intensity of solar radiation reaching the Earth varies over time and space [6]. The amount of solar radiation that reaches the Earth’s surface is affected by the distance between the Sun and the Earth, as well as the existence of clouds and other atmospheric constituents. The transmittance of the atmosphere attenuates the incoming solar radiation before it reaches the ground surface throughout its passage through the atmosphere. The amount of solar radiation at the ground surface is about 50% of what it is at the top of the Earth before it interacts with the atmosphere [4]. The sum of direct solar irradiance (DNI) and diffuse horizontal irradiance (DIF) is the global horizontal irradiance (GHI) [1]. A pyranometer is used to measure the GHI arriving from the whole hemisphere. Accurate GHI data are highly valuable for the economic and technical evaluation of solar technologies, engineering designs [7,8,9,10,11,12,13,14,15], and the development, calibration, and validation of pragmatic models [10]. Environmental studies, climate change studies, agricultural sciences, ecology, and meteorology all benefit from GHI [10,11,13,14,16,17]. As a result, obtaining reliable GHI at a site is important.
GHI measurements taken with a pyranometer from in situ solar radiation stations are the most precise way to gather GHI data. Nevertheless, GHI recording sites are few and far between, as well as expensive to establish, maintain, and calibrate. As a result, GHI in situ measured data are sparse [10,12,13,14,15,16,17,18,19,20,21]. To compensate, reliable data is collected at a sparsely distributed network in order to create, calibrate, and validate models that can be reliably applied to approximate and predict exploitable solar irradiance at other sites [22]. Estimates of GHI can also be generated by interpolating against observed GHI [23]. Uncertainty in the generated data is a disadvantage of this technique. Satellite-derived GHI datasets can provide dependable alternate GHI datasets and compensate for the lack of in situ radiometric sites by increasing the quantity of GHI data.
The Ångström–Prescott (AP) model [24,25], with calibrated coefficients a and b for six South African climatological regions [26], showed that it is capable of accurately estimating the daily GHI data in South Africa. SOLCAST [27,28], CAMS [29,30,31], and CMSAF SARAH [32] satellite-based datasets demonstrated in the study by [33] that they can accurately estimate hourly GHI data in all six climatological regions of South Africa. Hourly datasets that are based on reanalysis, ERA5 [34] and MERRA2 [35], performed poorly in all six climatological regions of South Africa. The poor performance of reanalysis-based datasets was suspected to be due to a very low spatial resolution and a failure to differentiate between cloudy and non-cloudy conditions [33]. The performance of NASA SSE [36] in estimating the hourly GHI in six climatological regions was not assessed in the previous study [33] because it is only available as daily averages.
The objective of this work is to determine the best overall method for estimating the daily GHI in South African locations using satellite-based databases (NASA SSE, CAMS, CMSAF, and SOLCAST) and the Ångström–Prescott (AP) model. Daily satellite-based datasets (NASA SSE, CAMS, CMSAF, and SOLCAST) and Ångström–Prescott (AP) model estimates will be compared to daily measured in situ GHI to determine the overall best method. The comparison is performed under three different sky conditions: clear, all-sky, and overcast. To quantify the capabilities of the datasets, conventional statistical benchmarks namely the relative mean bias error (rMBE), relative root mean square error (rRMSE), relative mean absolute error (rMAE), and the coefficient of determination (R2) have been used. The objective of this work is to determine the overall best method among the satellite-based databases (NASA SSE, CAMS, CMSAF, and SOLCAST) and the Ångström–Prescott (AP) model in estimating the daily GHI in South African locations. The overall best method will be determined by comparing daily satellite-based datasets (NASA SSE, CAMS, CMSAF, and SOLCAST) and the Ångström–Prescott (AP) model estimates against daily measured in situ GHI.

2. Materials and Methods

2.1. Observation GHI Datasets

There are eight locations for this study. These are radiometric stations in the network of the South African Weather Service (SAWS). All eight locations are radiometric stations that record 1-min GHI data. These stations are located in six of South Africa’s macroclimate zones. The study excluded four stations: Bethlehem, Prieska, Cape Point, and Mahikeng because there was no in situ sunshine duration data. Figure 1 shows the eight study sites, while Table 1 summarizes the station name, latitude, longitude, altitude, and study period. The eight stations use a Kipp & Zonen CMP11 secondary-standard pyranometer to measure GHI. GHI measurements are taken using a Campbell Scientific CR1000 data logger at 0.2 hertz (5 s) sampling frequency and integrated to 1 min. Sunshine duration data were collected using Campbell–Stokes sunshine recorders.

2.2. Satellite-Based Datasets

The National Aeronautics and Space Administration (NASA)’s Surface Meteorology and Solar Energy (SSE) produces primary solar radiation data on a world spatial resolution of 1° × 1° grid, which is subsequently remapped to a 0.5° × 0.5° (~55 km × 55 km) grid via bilinear interpolation. NASA SSE solar parameters are available as daily, monthly, and annual averages, as well as climatological averages. NASA SSE was designed to provide guidance in solar and wind-powered renewable energy systems. The data is processed, archived, and made available as daily averages from July 1983 to about 4 days of near real-time [36]. SOLCAST [27,28], CAMS [29,30,31], and CMSAF SARAH [32] datasets were elucidated in our previous study [33].

2.3. Ångström–Prescott (AP) Model

The authors’ previous study [26] detailed the Ångström–Prescott (AP) model [24,25]. As expressed in Equation (1), the AP model estimates daily the GHI using the AP coefficients a and b, daily top of the atmosphere GHI ( GHI TOA ) , theoretical sunshine duration (N), and the measured sunshine duration (n) data.
GHI GHI TOA = a + b ( n N )

2.4. Study Method

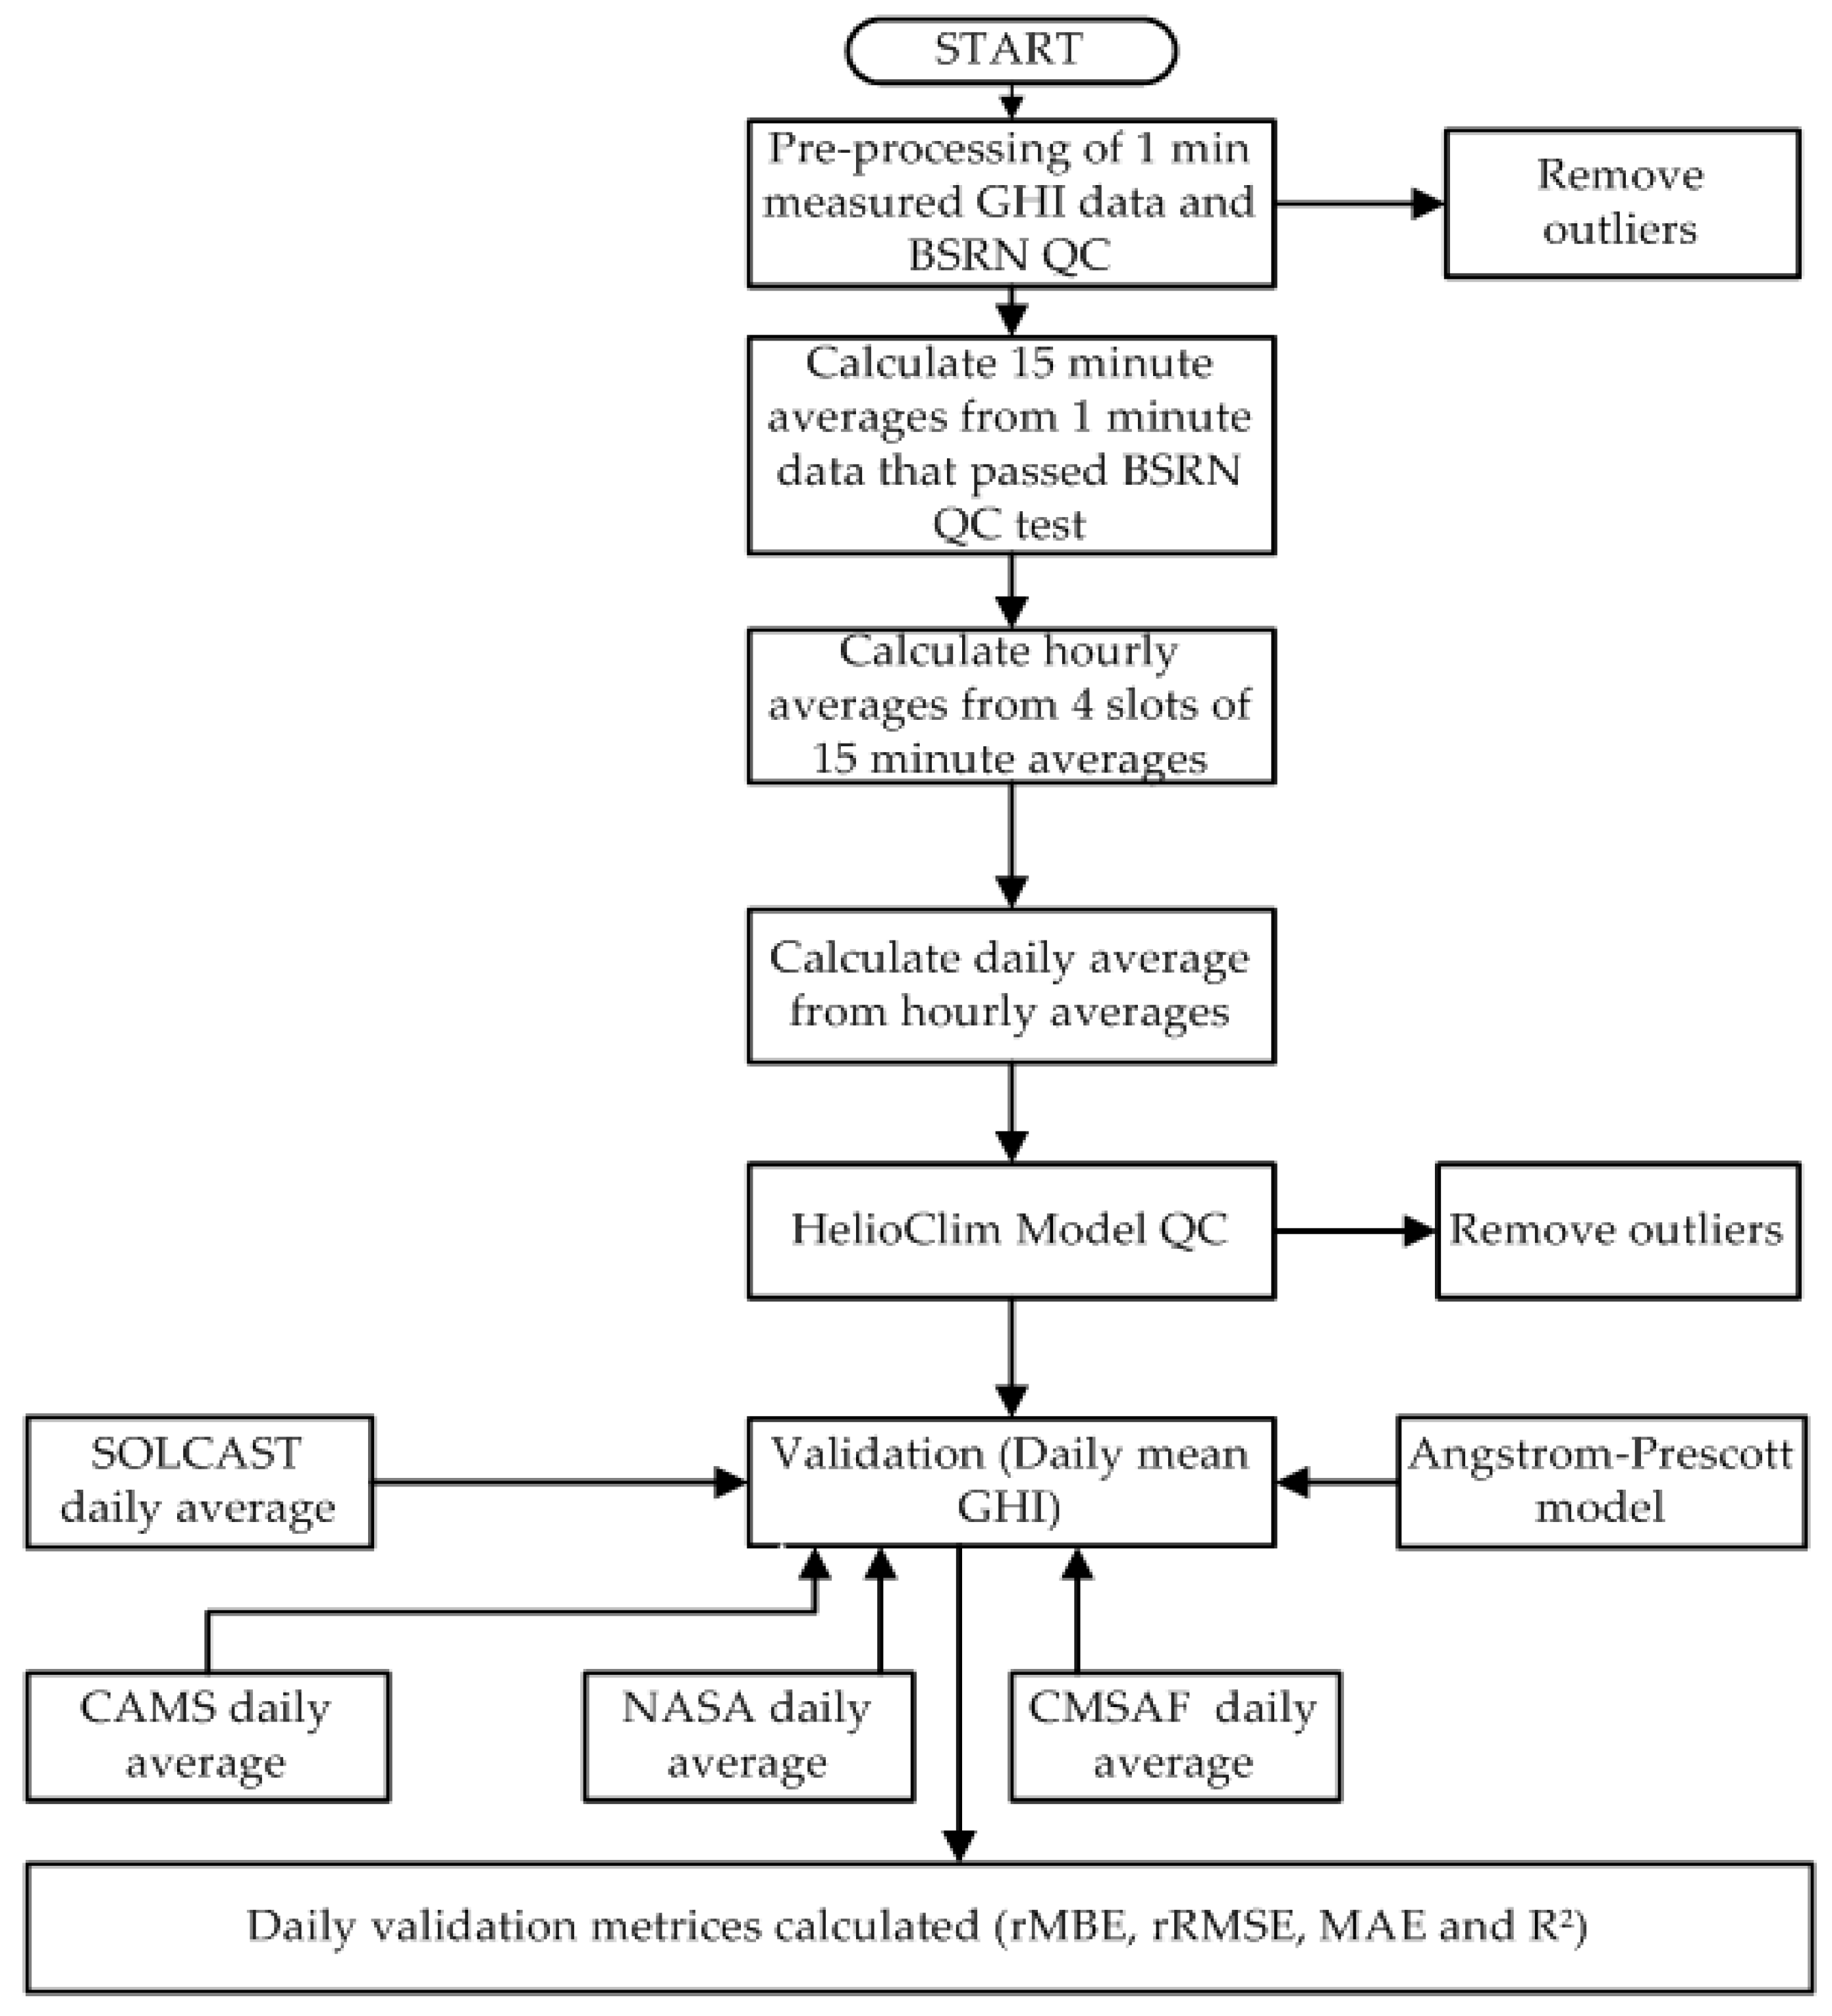
Figure 2 illustrates a flow diagram of the research method. Our previous studies [26,33,37] have clarified this method. The process starts with the collecting of 1-min GHI datasets and the implementation of a basic or level one quality control technique to observation data (Section 2.5), followed by identifying clear-sky and overcast-sky days (Section 2.6), and then quantitatively assessing the datasets (Section 2.7).

2.5. Control of Observation Data

The GHI observations from a pyranometer were pre-processed in one-minute averages, subjected to the Baseline Surface Radiation Network (BSRN) quality control test [38,39,40], and the outliers were discarded. NASA SSE, CAMS, and CMSAF SARAH daily averages were sourced, whereas SOLCAST daily averages were calculated from sourced hourly averages. The hourly average values for zenith angles greater than 85°, i.e., before sunrise and after sunset, were set to zero. The hourly average was used to calculate the daily average GHI data. The daily average also included the night values, i.e., the average calculated throughout a 24-h period. Daily GHI averages were again subjected to the HelioClim model QC [41], as described in prior investigations [26,33,37].

2.6. Clear-Sky and Cloud-Sky Determination

There are several techniques for determining the total amount of clouds covering the sky over a period and classifying that period as clear-sky, cloud-sky, or overcast-sky. Ground-based observations (trained meteorological observers using a naked eye), ceilometer devices, total sky imagers, sunshine index ( n N ) threshold, clearness index ( GHI GHI TOA ) threshold, reanalysis, and satellite-based datasets are examples. To determine clear-sky and overcast-sky days, the mean daily (cfc day, i.e., average percent of cloud amount during daylight) fractional cloud cover (CFC): cloud property dataset using SEVIRI, Edition 2 (CLAAS-2) [42,43] was used. The CLAAS-2 satellite set is generated using the geostationary Meteosat Spinning Enhanced Visible and Infrared Imager (SEVIRI). It has a 0.05° × 0.05° (~5.5 km × 5.5 km) spatial resolution [42,43]. A clear-sky day was classified as one in which the daily mean fraction of the sky that was covered by clouds was less than or equal to 5%, i.e., CFC   5 % . An overcast day was classified as one in which the daily mean fraction of the sky that was covered by clouds was greater than or equal to 95% i.e., CFC 95 % [44,45].

2.7. Quantitative Assessment

A quantitative evaluation is carried out using conventional relative benchmarks, such as mean bias error (rMBE), which calculates the mean magnitude of the residues in percentage terms. A negative rMBE indicates that the estimate is underestimated, and vice versa. The relative root mean square error (rRMSE) measures the average magnitude of the residues in percentage terms. As the residues are squared before being averaged, the rRMSE gives more weight to large residues. The relative mean absolute error (rMAE) measures the absolute mean magnitude of the residues in percentage terms without considering their direction, implying that individual residues are weighted equally in the mean. The rMAE is always less than or equal to the rRMSE. The smaller the difference between rRMSE and rMAE, the lower the variance in the sample’s residues. If the rMAE equals the rRMSE, all of the residues are of the same magnitude. The lower the rMBE, rMAE, and rRMSE values, the better the correlation, and vice versa. These relative benchmarks were sourced from the works [46,47] and were applied in our previous studies [26,33,37]. The benchmarks are expressed in terms shown in Equations (2)–(4).
rMBE = 100 1 n i = 1 n ( Pi Oi ) O ¯ i
rRMSE = 100 O i ¯ 1 n i = 1 n ( Pi P o ) 2
rMAE = 100 1 n i = 1 n | Pi Oi | O ¯ i .
The coefficient of determination (R2), which measures how well a statistical model estimates an outcome, is also considered. It is a number between 0 and 1, ( 0 R 2 1 ). If R2 is between 0 and 1, the model moderately predicts the outcome. If R2 is close to 1, the model can accurately estimate the outcome; if R2 is close to zero, the model cannot accurately estimate the outcome. R2 is expressed by the Equation (5).
R 2 = 1 i = 1 n   ( Pi Oi ) 2   i = 1 n ( Pi O ¯ i ) 2   .
where Pi is the predicted value, Oi is the measured value, O ¯ i is the mean of the measured values, and n is the total number of observations points that are used.

2.8. Most Viable Estimated Dataset with Relative Rating per Station

In our previous study [33], we elucidated and applied the methodology for determining the most viable option between satellite-based datasets and the AP model at each of the eight stations.

2.9. Quantifying the Impact of Cloud Coverage on Dataset Performance

To quantify the impact of the fraction of the sky that is covered by clouds on the performance of the datasets, the differences in rRMSE for each dataset per station under different fractions of the sky covered by clouds were determined. The rRMSE was chosen above other benchmarks because it gives more weight to large residues because they are squared without first being averaged. The rRMSE discrepancies between overcast-sky and clear-sky conditions, overcast-sky and all-sky conditions, and all-sky and clear-sky conditions were quantified.

3. Results and Discussions

3.1. All-Sky Cloud Condition Results

The results from [26] were converted from MJ m−2d−1 to W/m2 to allow for a better comparison between daily satellite-based estimates and the Ångström–Prescott (AP) of the all-sky cloud cover results for the study area, namely poor, good, and excellent. Table 2 shows the resulting ranges for each metric and class.

3.1.1. Copernicus Atmosphere Monitoring Service (CAMS)

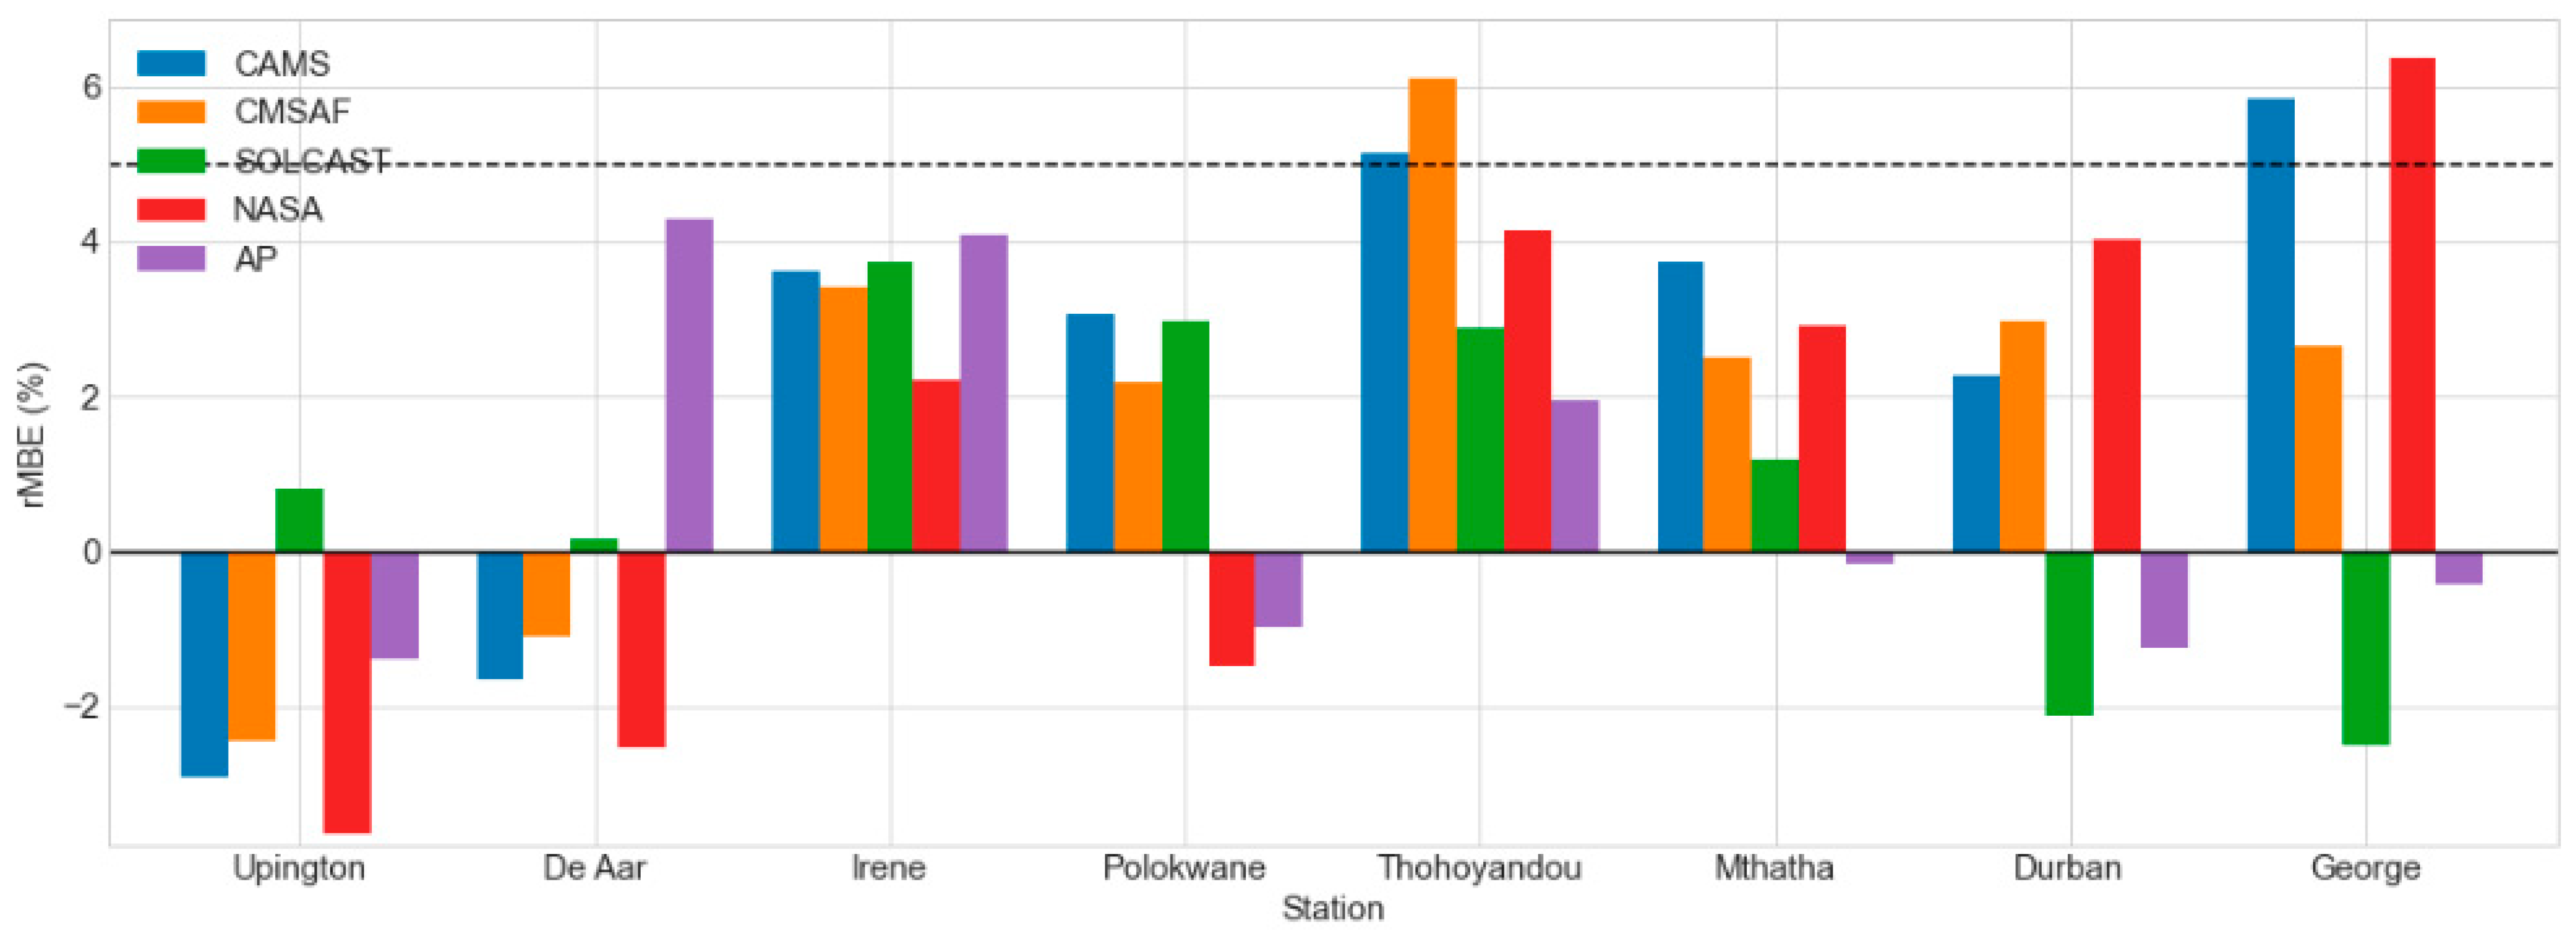
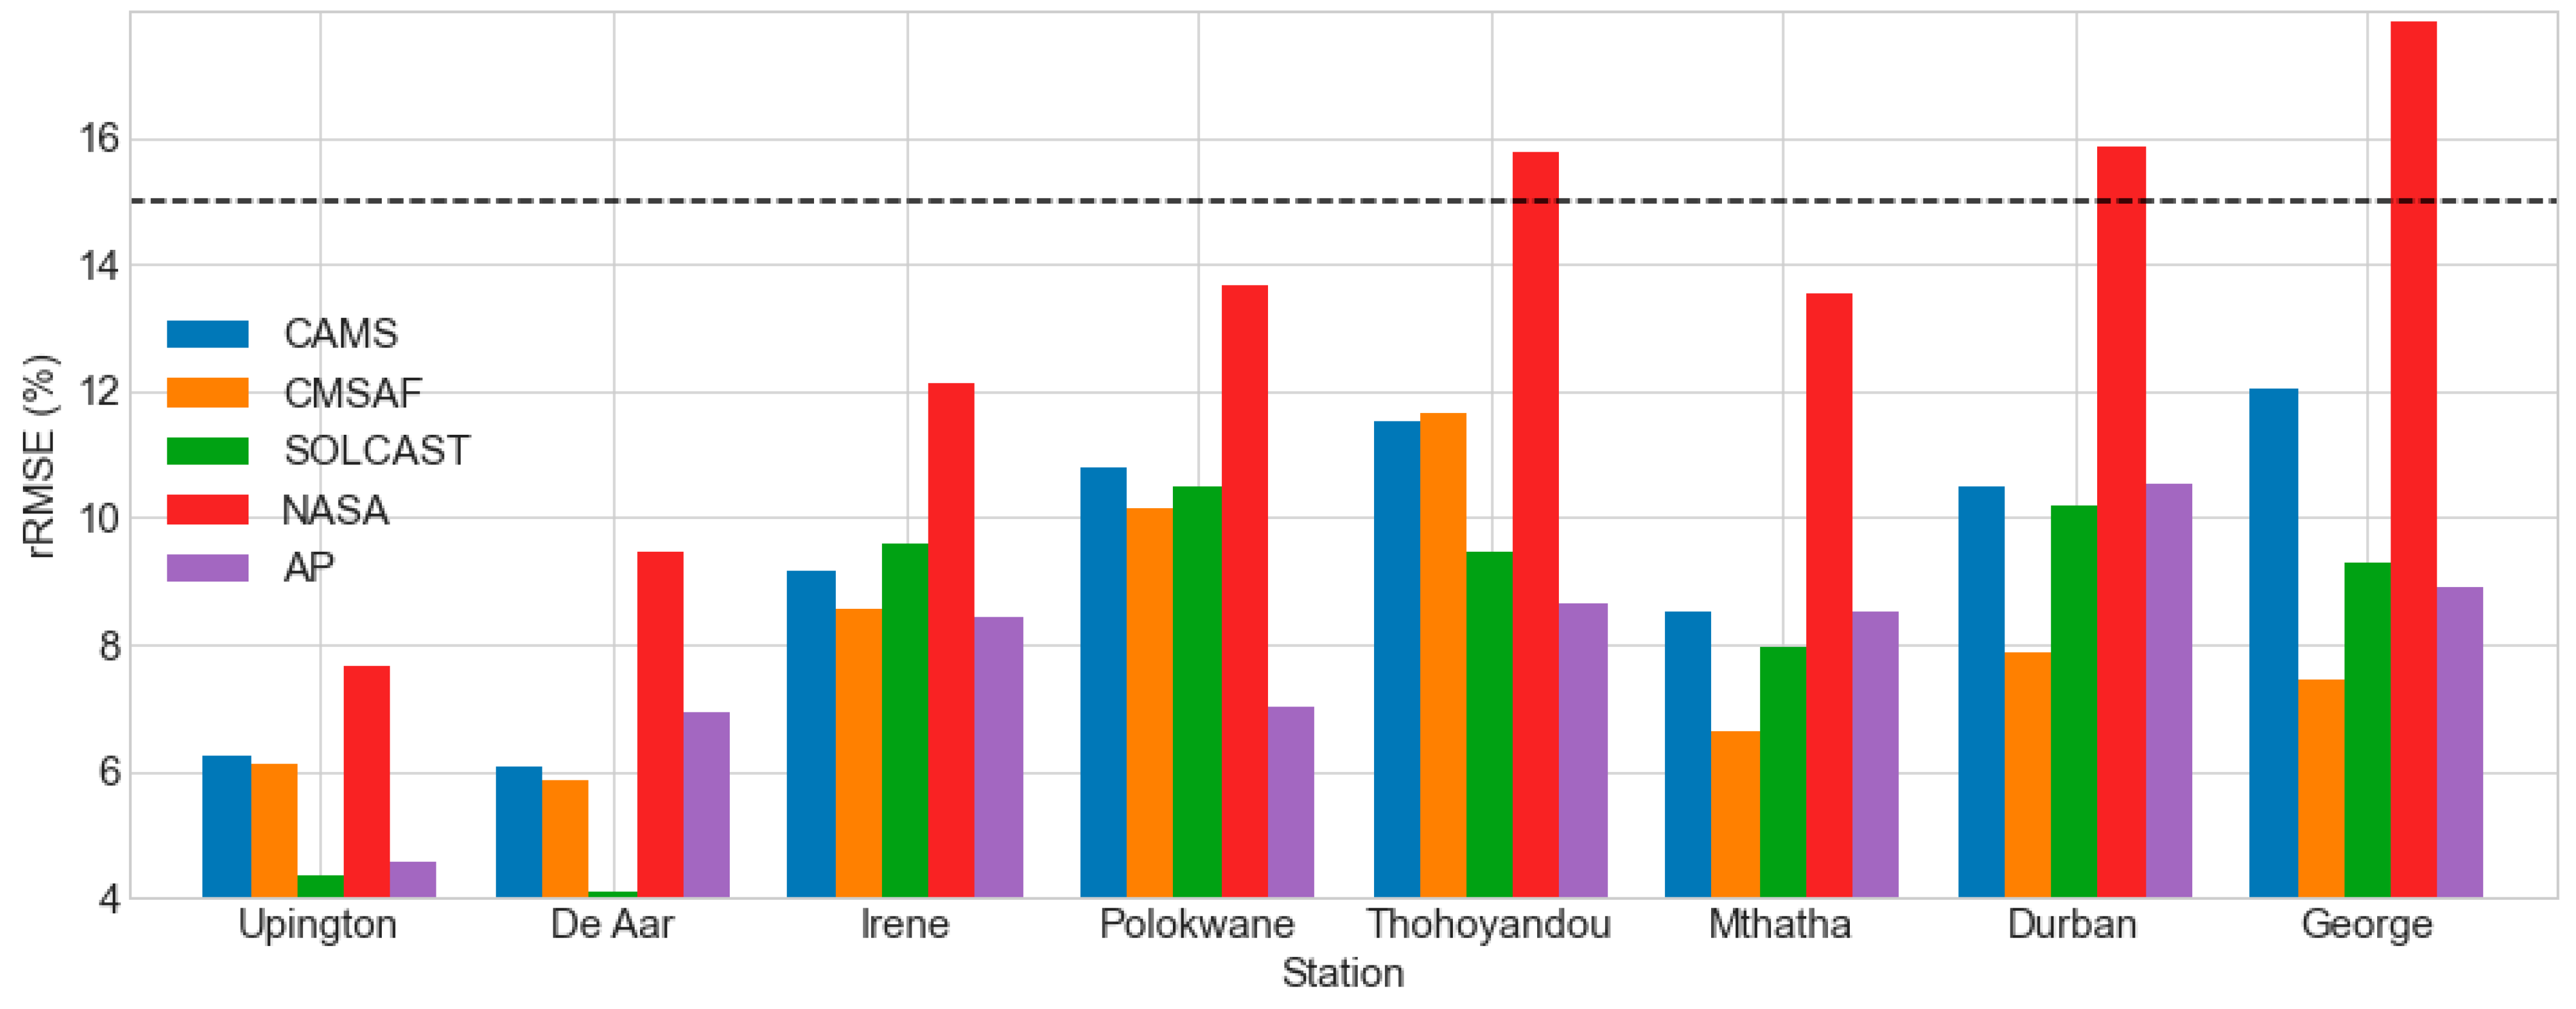
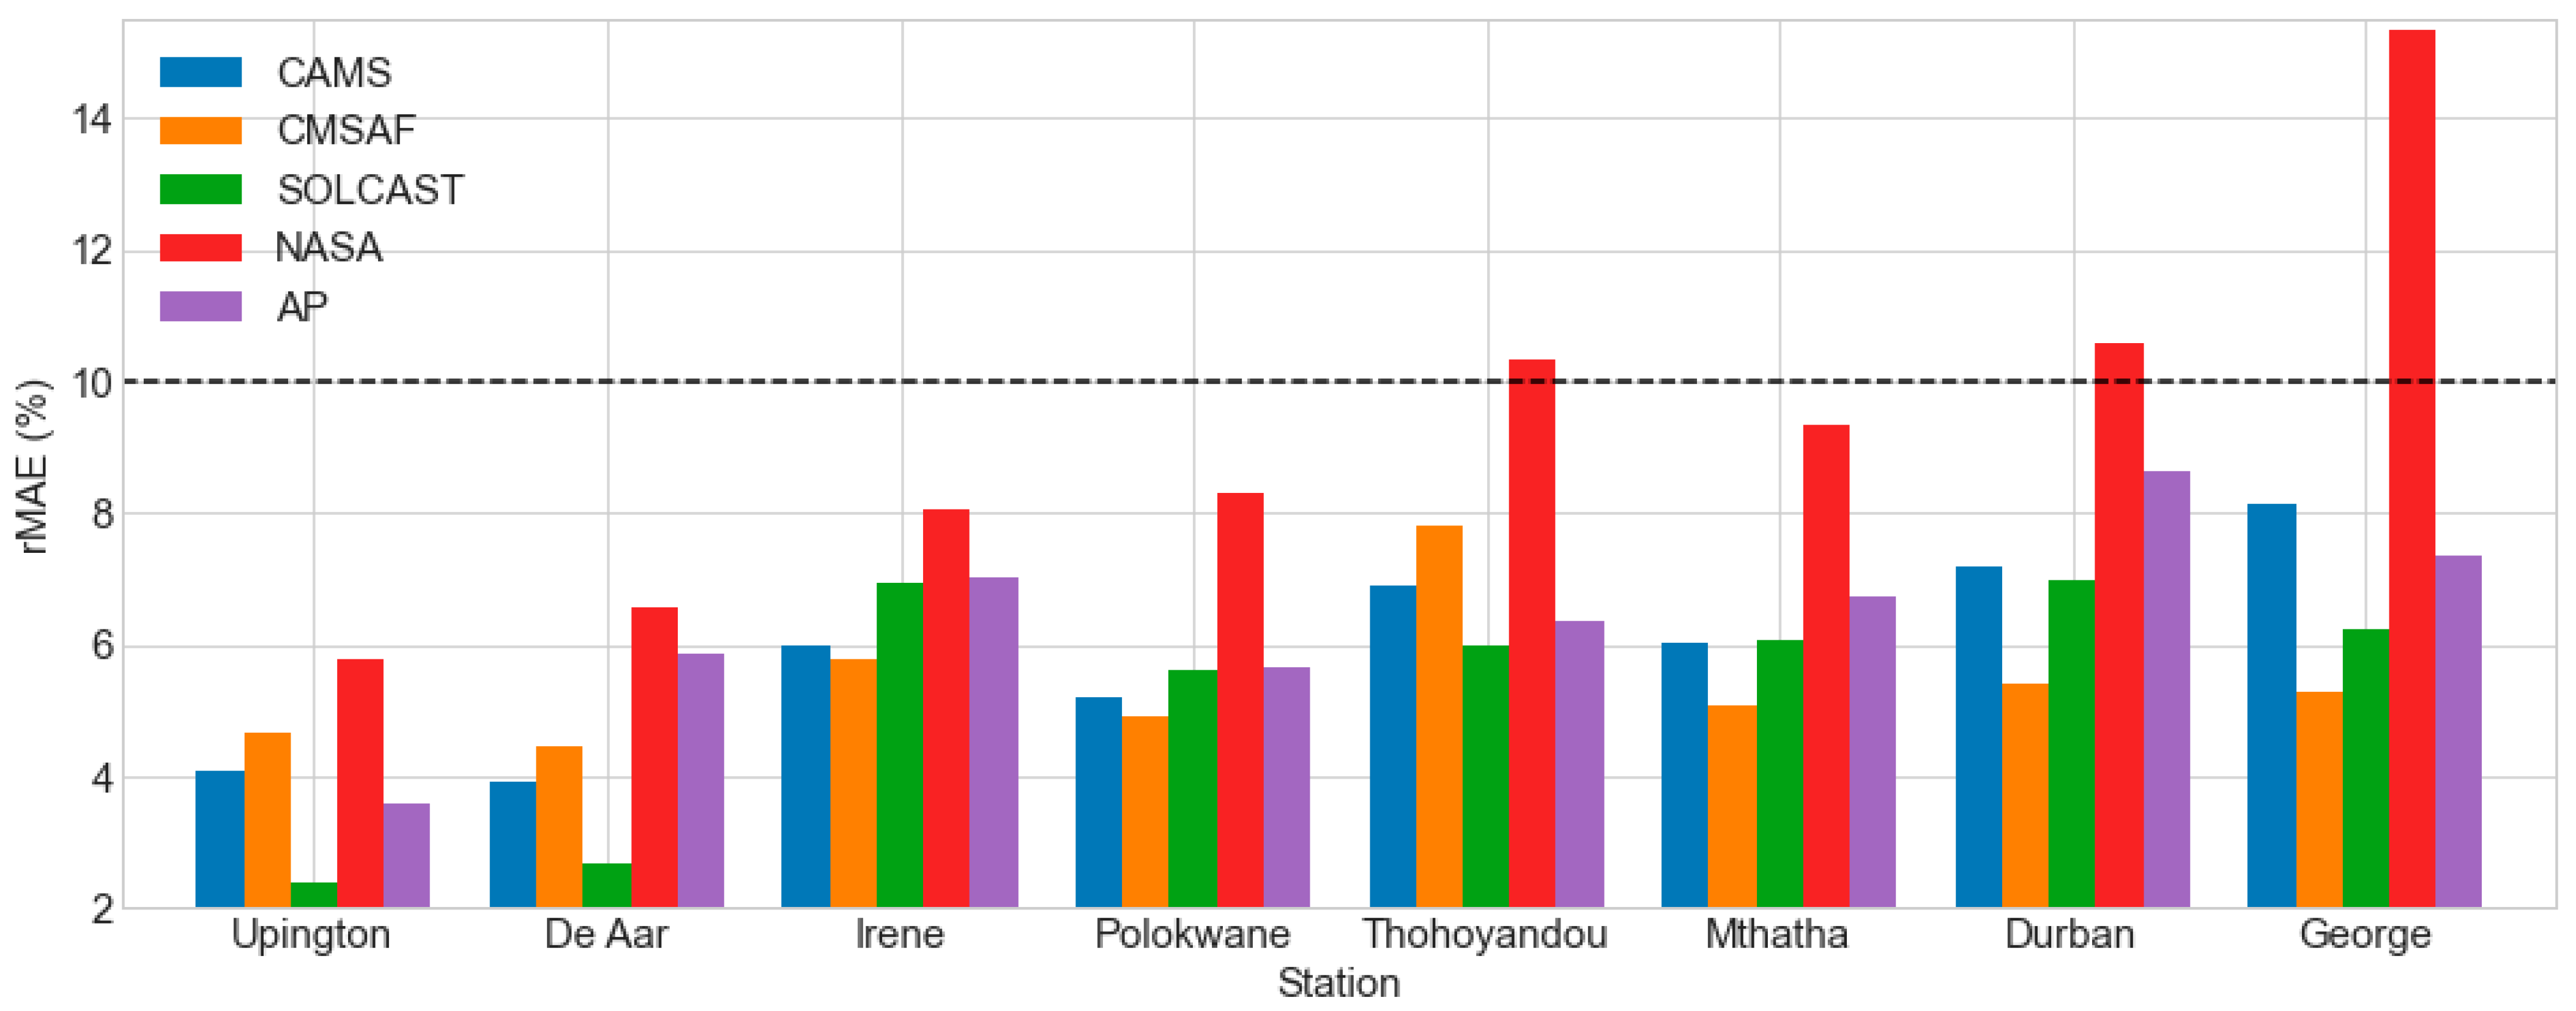
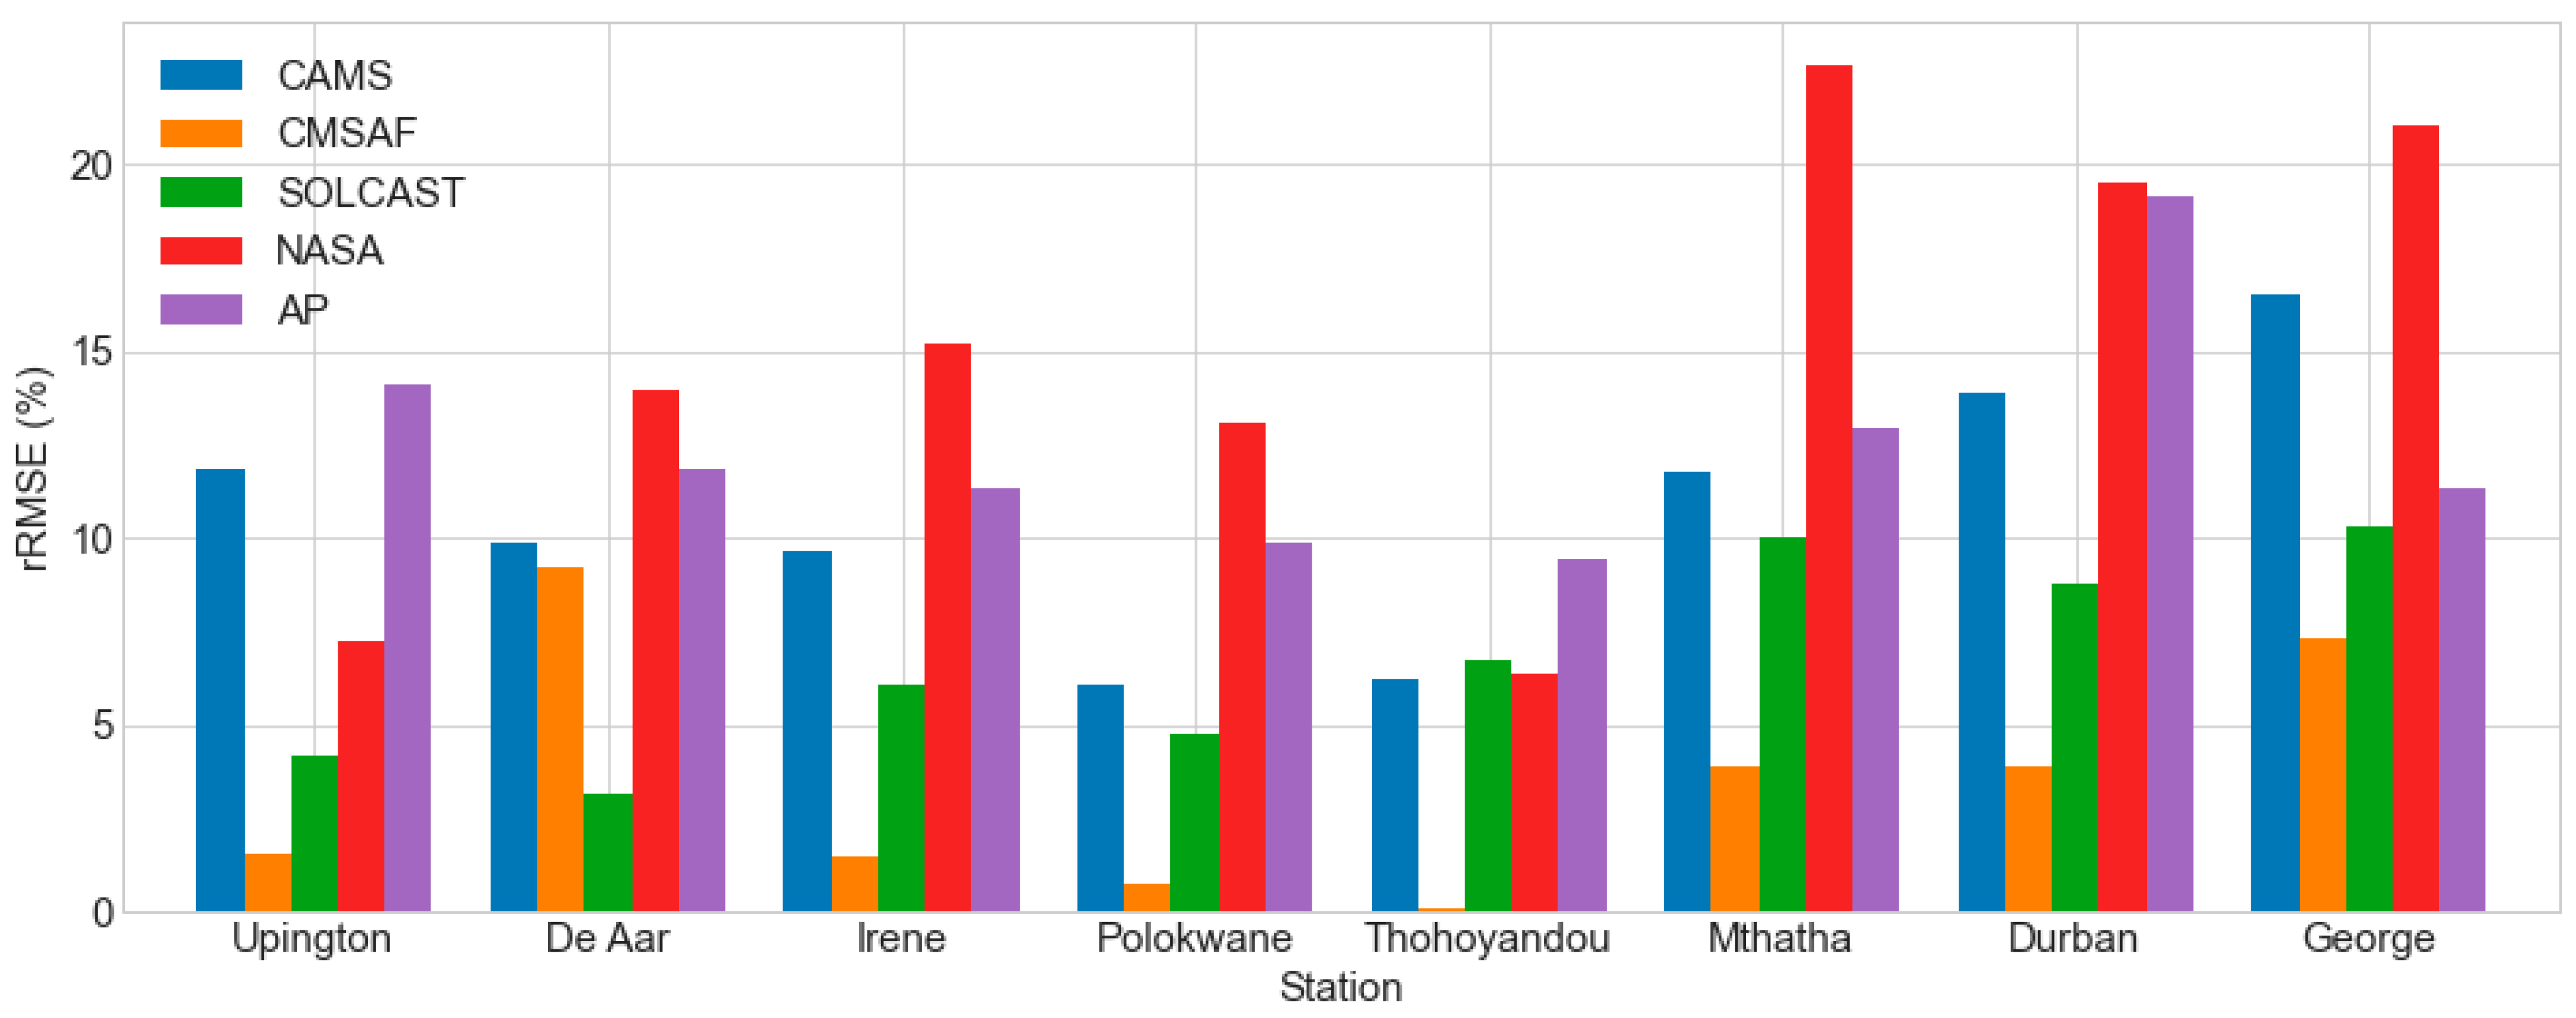
CAMS underestimated the GHI in De Aar (by −2%) and Upington (by −3%), as evidenced by the bar chart of the rMBE in Figure 3, and overestimated the GHI in the remaining six locations. The overall rMBE for CAMS ranged from −3 to 6% across all the locations. According to the bar chart in Figure 4, the daily rRMSE for CAMS was between within 5 % rRMSE 12 % for all the stations. Table 3 displays the daily correlation results. Except for Polokwane (R2 = 0.944), CAMS had an R2 > 0.95 in seven sites, indicating that the daily measured and calculated data coincided well. The daily benchmarks for CAMS can be summarized as follows from Figure 3 through Figure 5 and Table 3:
  • 3 % daily   rMBE 6 %;
  • 5 % daily   rRMSE 12 % ;
  • 3 % daily   rMAE 8 % and
  • 0.944 daily   R 2 0.990 .

3.1.2. Satellite Application Facility on Climate Monitoring (CMSAF)

The data range in Figure 3 demonstrates that CMSAF underestimated the GHI at two locations, Upington (by −2%) and De Aar (by −1%). The GHI was overstated at the other six stations based on CMSAF data. Figure 4 shows the results for the daily rRMSE. For all the stations, this parameter was within the 5 % rRMSE 12 % range. CMSAF had R2 > 0.96 in seven stations for daily correlation results, as shown in Table 3, with the exception of Polokwane (R2 = 0.948). Table 4 indicates the most viable daily dataset per site when all the daily benchmarks are considered.
CMSAF proves to be the best performing daily aggregate in five of eight stations. The daily CMSAF benchmarks can be summarized as follows from Figure 3 to Figure 5 and Table 3:
  • 2 % daily   rMBE 6 % ;
  • 5 % daily   rRMSE 12 % ;
  • 4 % daily   rMAE 8 % and
  • 0.948 daily   R 2 0.990 .

3.1.3. SOLCAST

Figure 3 demonstrates that the SOLCAST dataset marginally underestimated the daily GHI at George and Durban, both with an rMBE of roughly −2%, and overstated the daily GHI at the remaining six locations. The rMBE ranged from 0.15% to 4% among those locations. SOLCAST had R2 > 0.96 in seven sites, except Polokwane (R2 = 0.948), as indicated in Table 3. Table 4 shows the most feasible daily dataset per station. For the daily aggregates, SOLCAST was dominating in three of the eight stations. The daily CMSAF benchmarks can be summarized as follows from Figure 3 to Figure 5 as well as Table 3: 3, SOLCAST had R 2 > 0.96 in seven stations, except Polokwane ( R 2 = 0.948 ). From Figure 3 to Figure 5 and from Table 3, the daily benchmarks for CMSAF can be summarised as:
  • 2 % daily   rMBE 4 %;
  • 4 % daily   rRMSE 10 % ;
  • 2 % daily   rMAE 7 % and
  • 0.948 daily   R 2 0.995

3.1.4. Ångström–Prescott (AP) Model

The AP model marginally underestimated the daily GHI at Upington (−1.4%), Polokwane (−1%), George (−0.4%), Mthatha (−0.15%), and Durban (−1.2%), as shown in the bar chart in Figure 3, and it overestimated the daily GHI at De Aar (4%), Irene (4%), and Thohoyandou (2%). According to the bar chart in Figure 4, the daily rRMSE for all the locations was within the range of 5 % daily   rRMSE 11 % According to Table 3, SOLCAST had a correlation R2 > 0.9 in all of the stations. Table 4 shows that the AP model was dominant in two of the eight sites for daily averages. The daily AP benchmarks can be summarized as follows from Figure 3, Figure 4 and Figure 5 and Table 3:
  • 1 % daily   rMBE 4 % ;
  • 5 % daily   rRMSE 11 % ;
  • 4 % daily   rMAE 9 % and
  • 0.910 daily   R 2 0.951 .

3.1.5. NASA SSE

As seen in the bar chart in Figure 3, the NASA SSE underestimated the daily GHI at Upington (−4%), De Aar (−3%), and Polokwane (−1.5%) while overestimating the daily GHI at the remaining five sites. The rMBE ranged from 2 to 6%. According to the bar chart in Figure 4, the daily rRMSE was less than 10% in Upington (8%) and De Aar (10%), it was in a range   10 % < rRMSE < 15 %   in three stations, and greater than 15% in Thohoyandou (15.8%), Durban (15.8%), and George (22%). Table 3 shows that NASA SSE had R2 > 0.9 in seven stations and less than 0.9 in George (0.896). The daily benchmarks for NASA SSE can be summed up as follows from Figure 3 to Figure 5 and Table 3:
  • 4 % daily   rMBE 6 %;
  • 8 % daily   rRMSE 18 % ;
  • 5 % daily   rMAE 15 % and
  • 0.896 daily   R 2 0.979 .

3.2. Clear-Sky Conditions Results

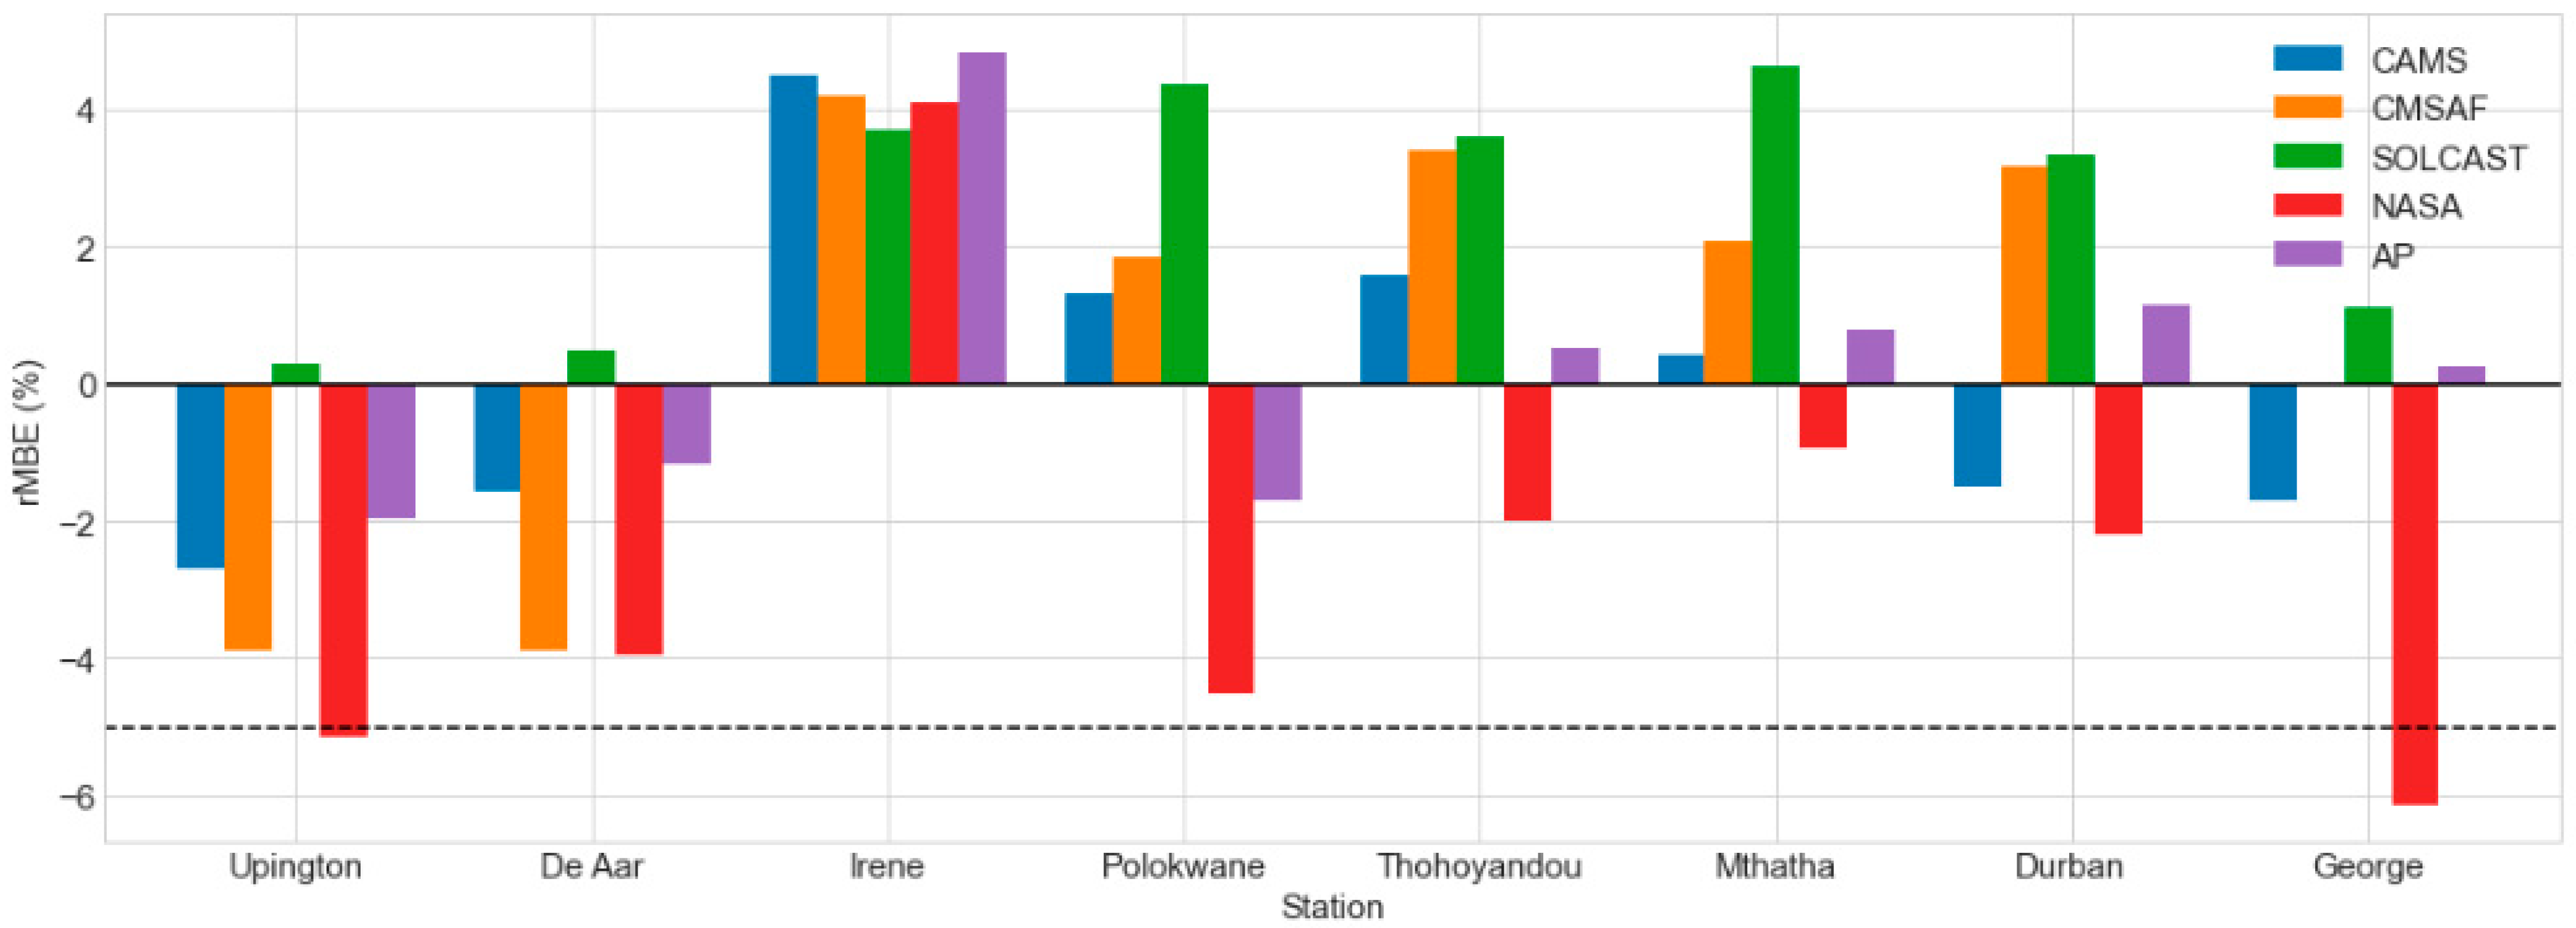
Figure 6 depicts the rMBE results under clear sky conditions: The SOLCAST dataset slightly overestimated the GHI in all of the stations (rMBE <+5%), indicating high performance under clear-sky conditions. The NASA SSE dataset slightly underestimated the GHI in nearly all the stations (rMBE <−5%), indicating a reasonable performance except in George (−6.3%) and Upington (−5.16%), where it exhibited a rather poor performance. For the CAMS, CMSAF, and AP datasets, there was a minor over-underestimation ( rMBE < | ± 5 | % ) at all the stations, indicating that the datasets performed well under clear-sky conditions.
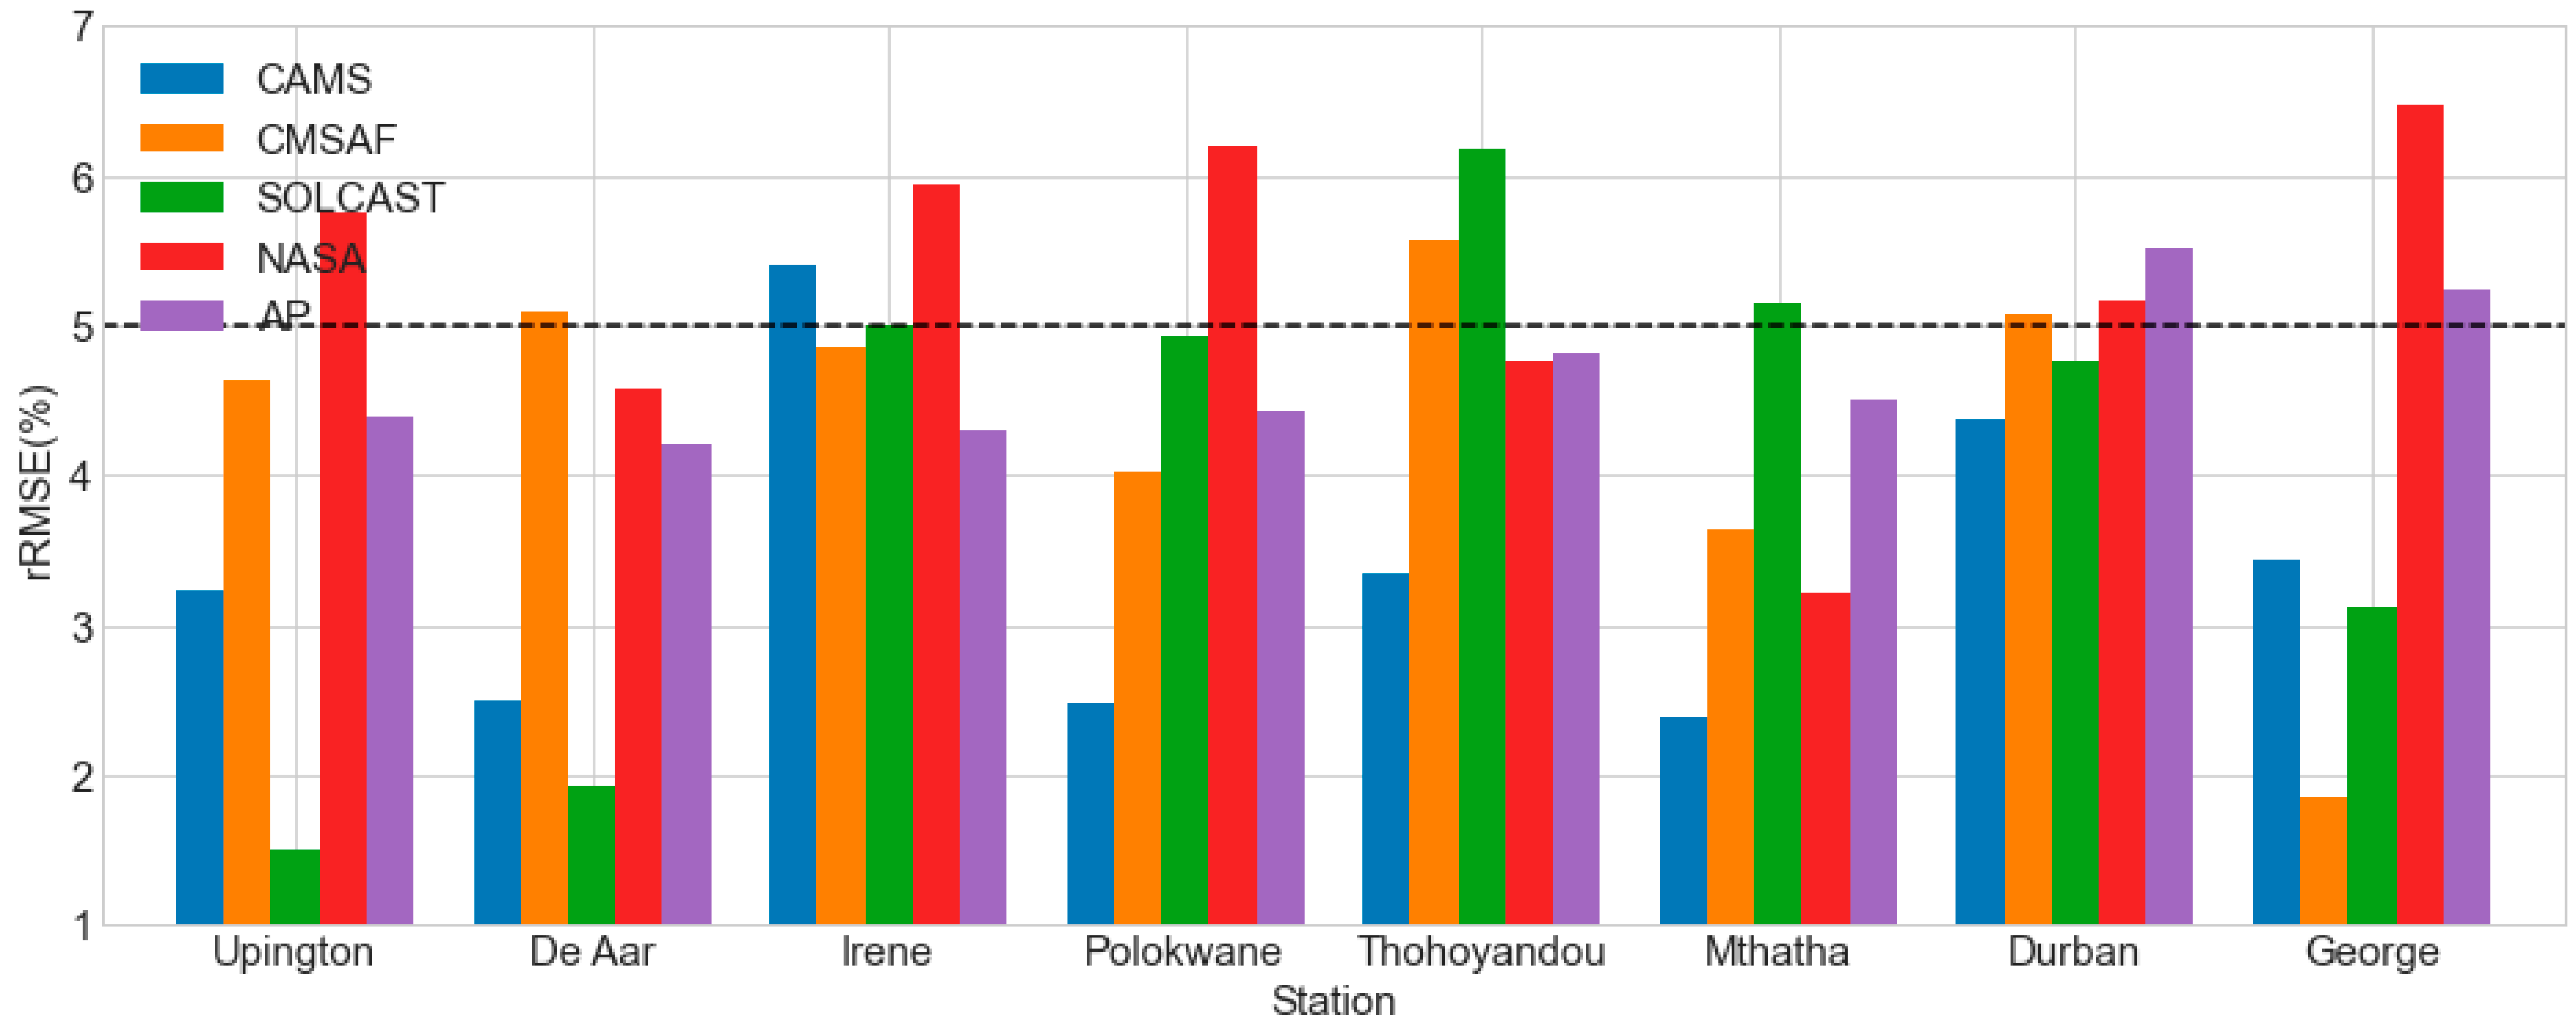
Figure 7 shows the rRMSE results under clear skies. All of the datasets (AP, SOLCAST, CAMS, CMSAF, and NASA SSE) performed admirably, with rRMSE less than 5% in practically all the stations. The only exceptions were Durban (5.51%) and George (5.23%) for the AP model; Thohoyandou (6.17%) for the SOLCAST dataset; Irene (5.4%) for the CAMS dataset; De Aar (5.09%), Durban (5.07%), and Thohoyandou (5.56%) for the CMSAF dataset; and Upington (5.76%), Irene (5.94%), Polokwane (6.2%). Overall, the datasets performed quite well under clear-sky conditions, with a rRMSE of 6.5% across all the stations.
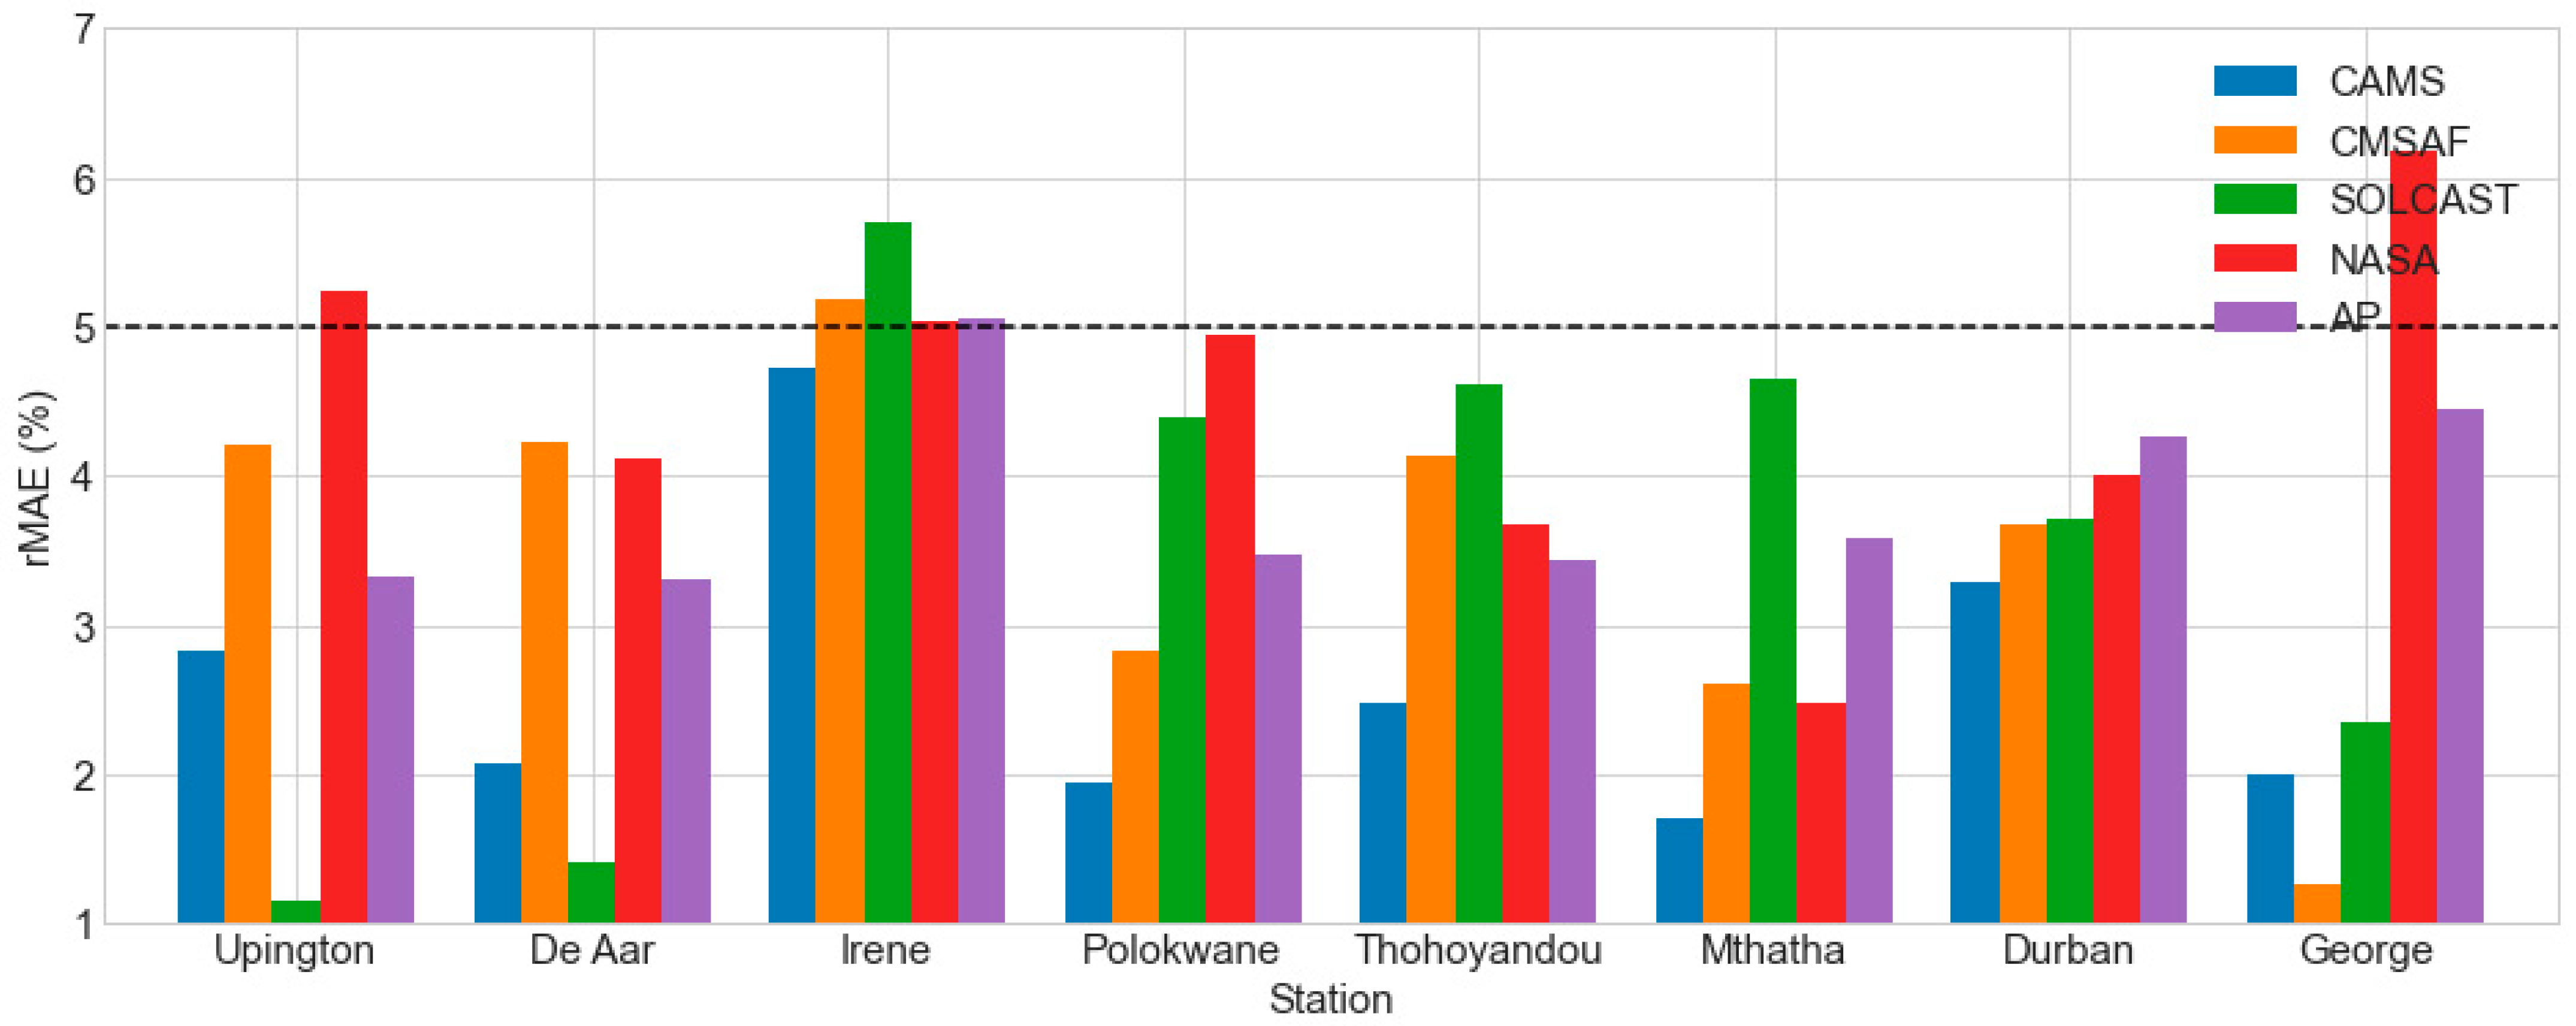
Figure 8 shows the rMAE results under clear skies. The CAMS dataset performed admirably, with an average rMAE of <5% across all the stations. CMSAF (5.18%), SOLCAST (5.69%), and the AP model (5.06%) performed well in all the stations except Irene, where they performed fairly. The NASA SSE dataset performed well enough in five out of eight stations with rMAE < 5%, and it performed well in Upington (5.24%), Irene (5.04%), and George (6.17%). Overall, the rMAE was <6.2% across all the stations, indicating that the datasets perform quite well under clear-sky conditions.
Table 5 displays the correlation coefficient (R2) results under clear skies. All the datasets (AP, SOLCAST, CAMS, CMSAF, and NASA SSE) performed admirably, with R2 > 0.975 in nearly all the stations. The lone exception was Thohoyandou, where R2 = 0.974 for the AP model, indicating a strong association. Under clear-sky conditions, there was a good correlation between the observation and estimated GHI datasets, as seen by R2 > 0.97 in all research locations.

3.3. Overcast-Sky Conditions Results

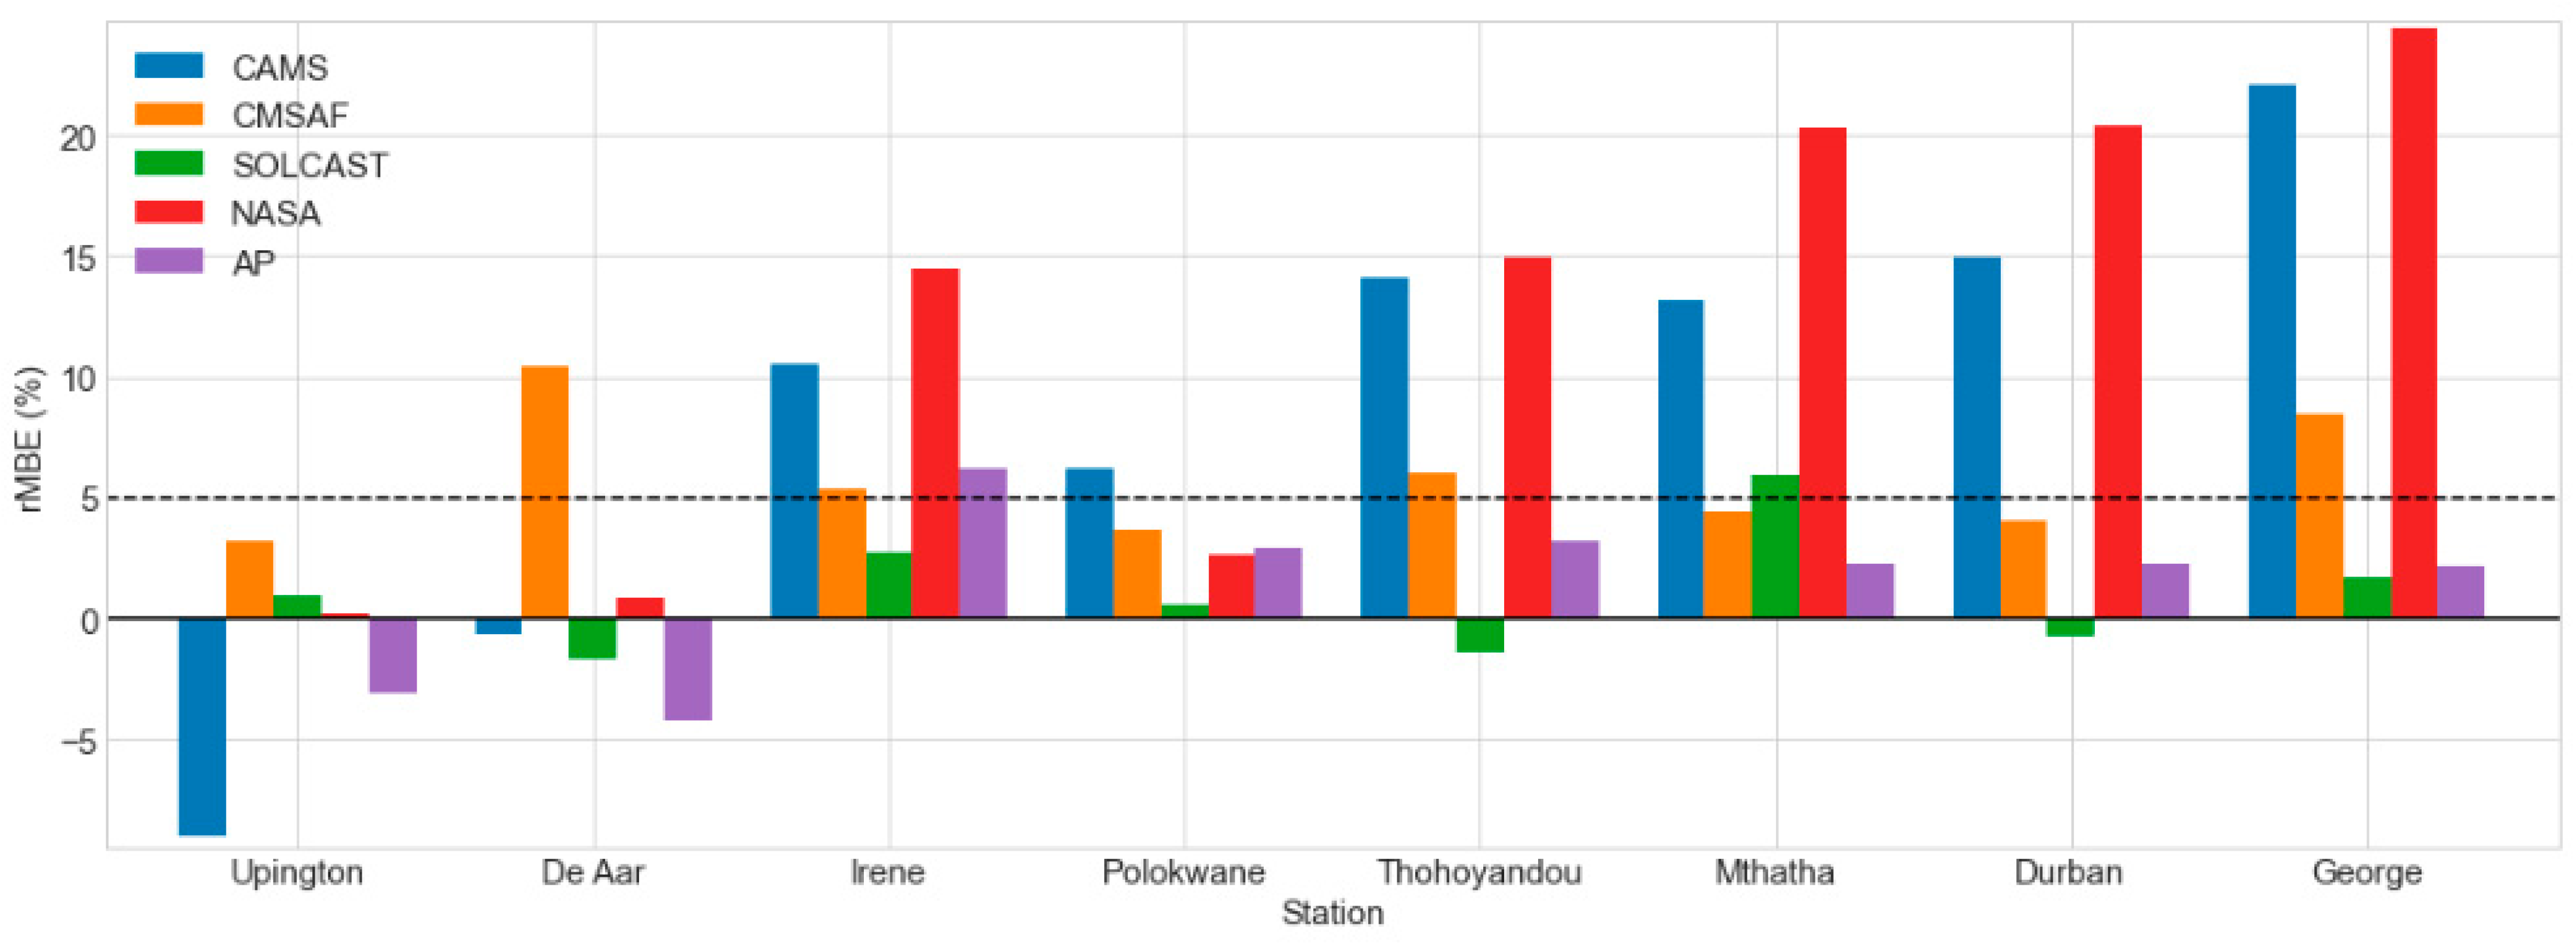
Figure 9 depicts the rMBE results under overcast sky conditions. CMSAF and NASA SSE overestimated the GHI at all the stations (positive rMBE). The CMSAF rMBE was <5% in Upington (3.21%), Polokwane (3.64%), Mthatha (4.39%), and Durban (4.03%). The CMSAF dataset performed quite poorly at the remaining stations, with rMBE ranging from 5.36% (at Irene) to 10.45% (at De Aar).
With an rMBE of <5%, the NASA SSE dataset performed well in Upington (0.2%), De Aar (0.89%), and Polokwane (2.6%). NASA SSE performed poorly in the remaining stations, with rMBE ranging from 14.44% (at Irene) to 24.45% (at George).
Except for Irene, the AP model performed well, with an rMBE of <±5% in almost all the stations (6.02%). The model underestimated the GHI at Upington (−3.06%) and De Aar (−4.18%) while overestimating the GHI at the remaining stations, with rMBE ranging from 2.17% (at George) to 6.2% (at Irene).
Except for Mthatha, the SOLCAST dataset performed well under overcast skies, with rMBE < ±5% in almost all the stations (5.91%). The SOLCAST dataset underestimated the GHI at De Aar (−1.7%), Thohoyandou (−1.35%), and Durban (−0.77%), but overestimated it at Upington (0.96%), Irene (2.78%), Polokwane (0.62%), Mthatha (5.91%), and George (1.69%).
The CAMS dataset only showed a good performance (rMBE < 5%) at De Aar (−0.67%). The dataset underestimated the GHI at De Aar (−0.67%) and Upington (−9%), while overestimating the GHI at the remaining stations, with rMBE ranging from 6.25% (at Polokwane) to 22.12% (at George).
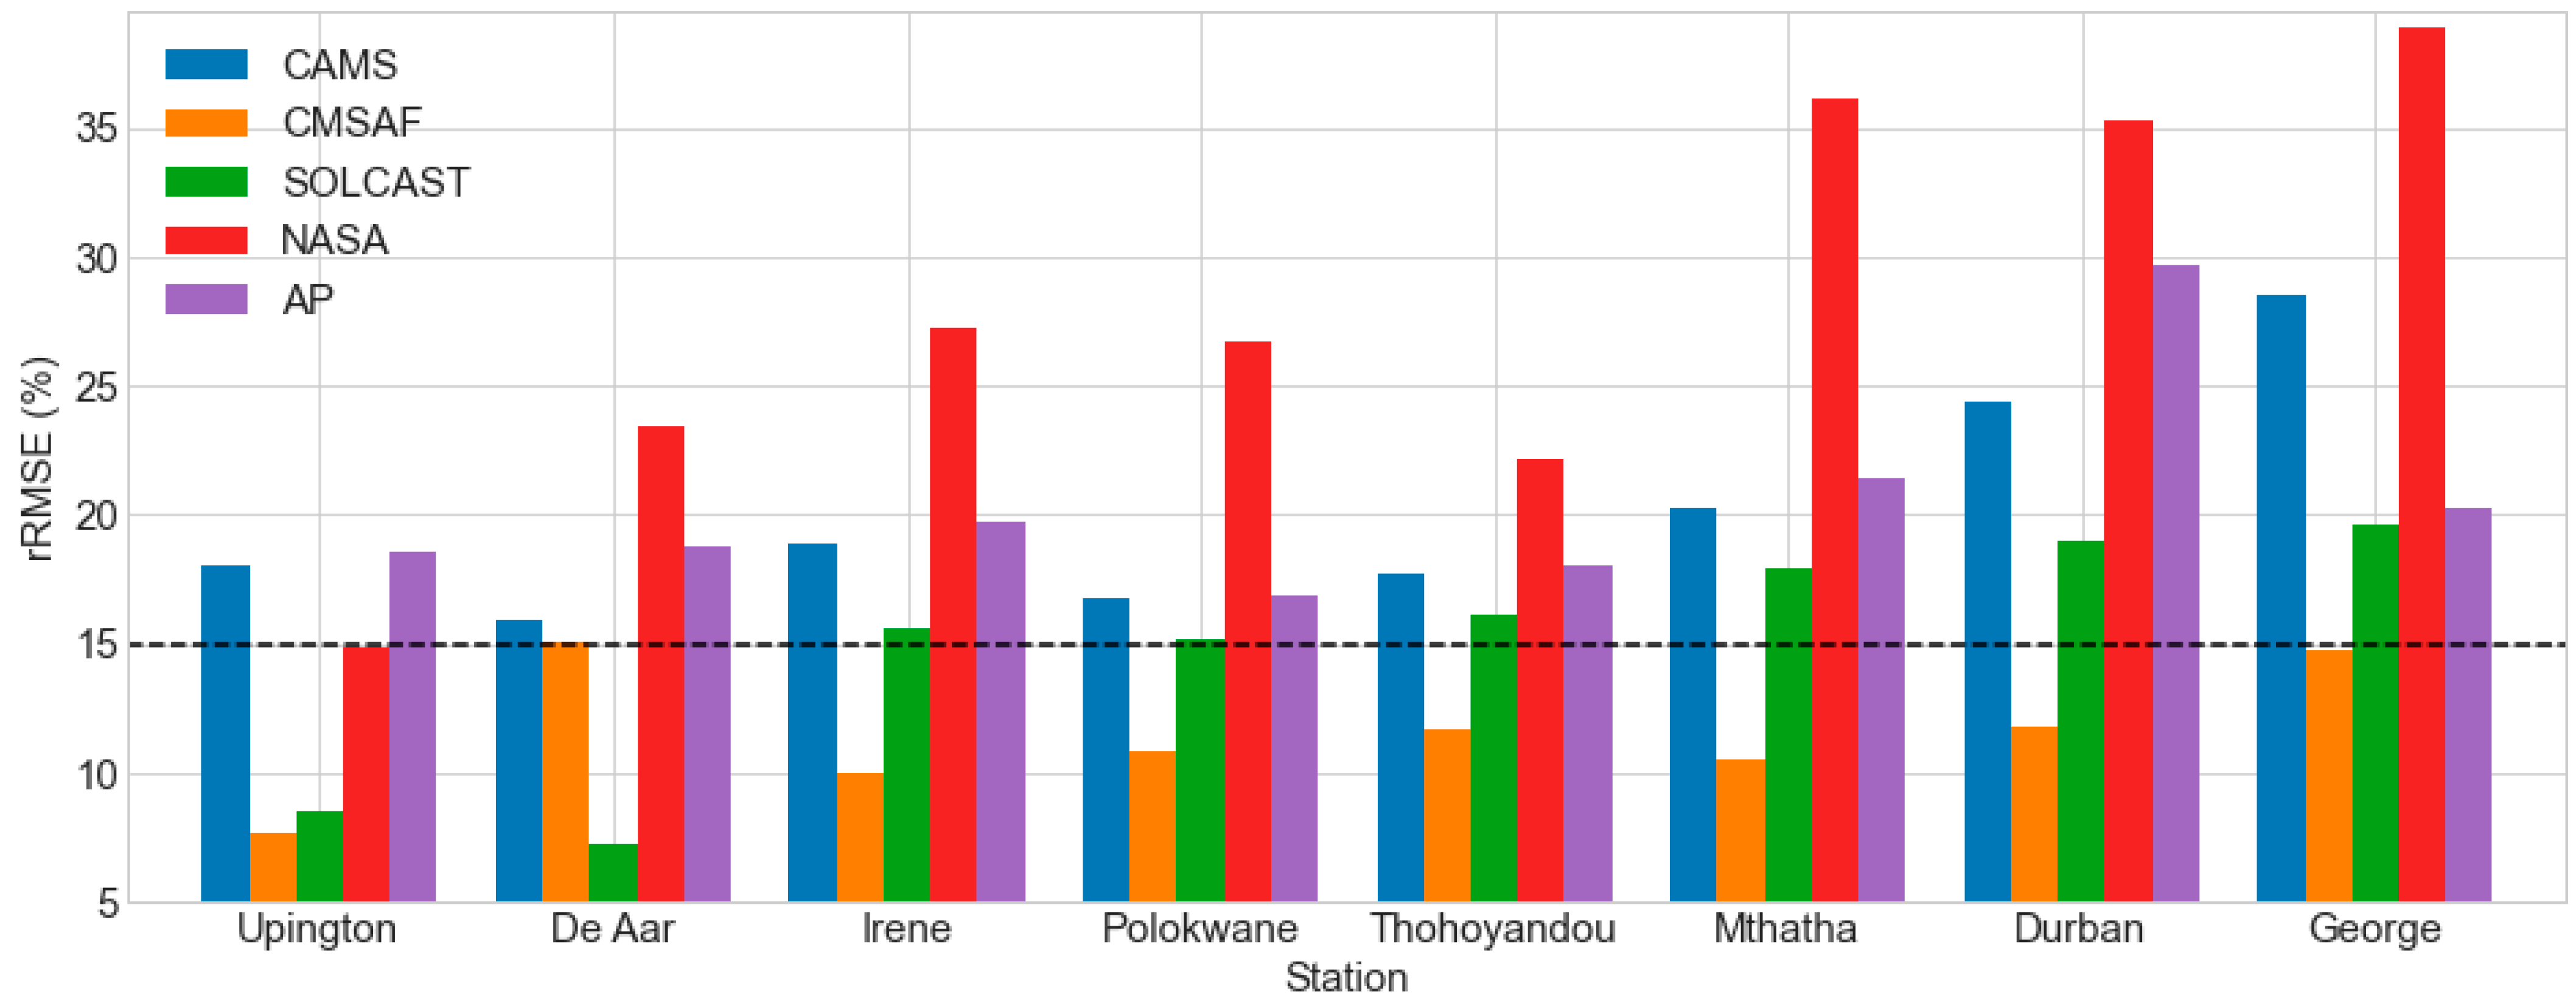
Figure 10 depicts the rRMSE results under overcast conditions. Except for the Da Aar station (15.06%), the CMSAF dataset performed well at all the stations, with rRMSE ranging from 7.63% (at Upington) to 14.79% (at George).
For the CAMS dataset, no station performed well (rRMSE > 15%); the rRMSE ranged from 15.96% (at De Aar) to 28.56% (at George). The AP model performed poorly, with rRMSE ranging from 16.84% (at Polokwane) to 29.67% (at Durban). SOLCAST performed well (rRMSE 15%) in Upington (8.49%) and De Aar (7.29%), but poorly at the other stations, with rRMSE ranging from 15.22% (at Polokwane) to 19.58% (at George). The NASA SSE data collection performed admirably.
The AP model showed a poor performance with rRMSE ranging from 16.84% (at Polokwane) to 29.67% (at Durban). SOLCAST showed a good performance (rRMSE < 15%) at Upington (8.49%) and De Aar (7.29%) and a poor performance at the rest of the stations with rRMSE ranging from 15.22% (at Polokwane) to 19.58% (at George). The NASA SSE dataset revealed a strong performance (14.92%) at Upington and a poor performance (rRMSE > 15%) at the other stations, with rRMSE ranging from 22.15% (at Thohoyandou) to 38.88% (at George).
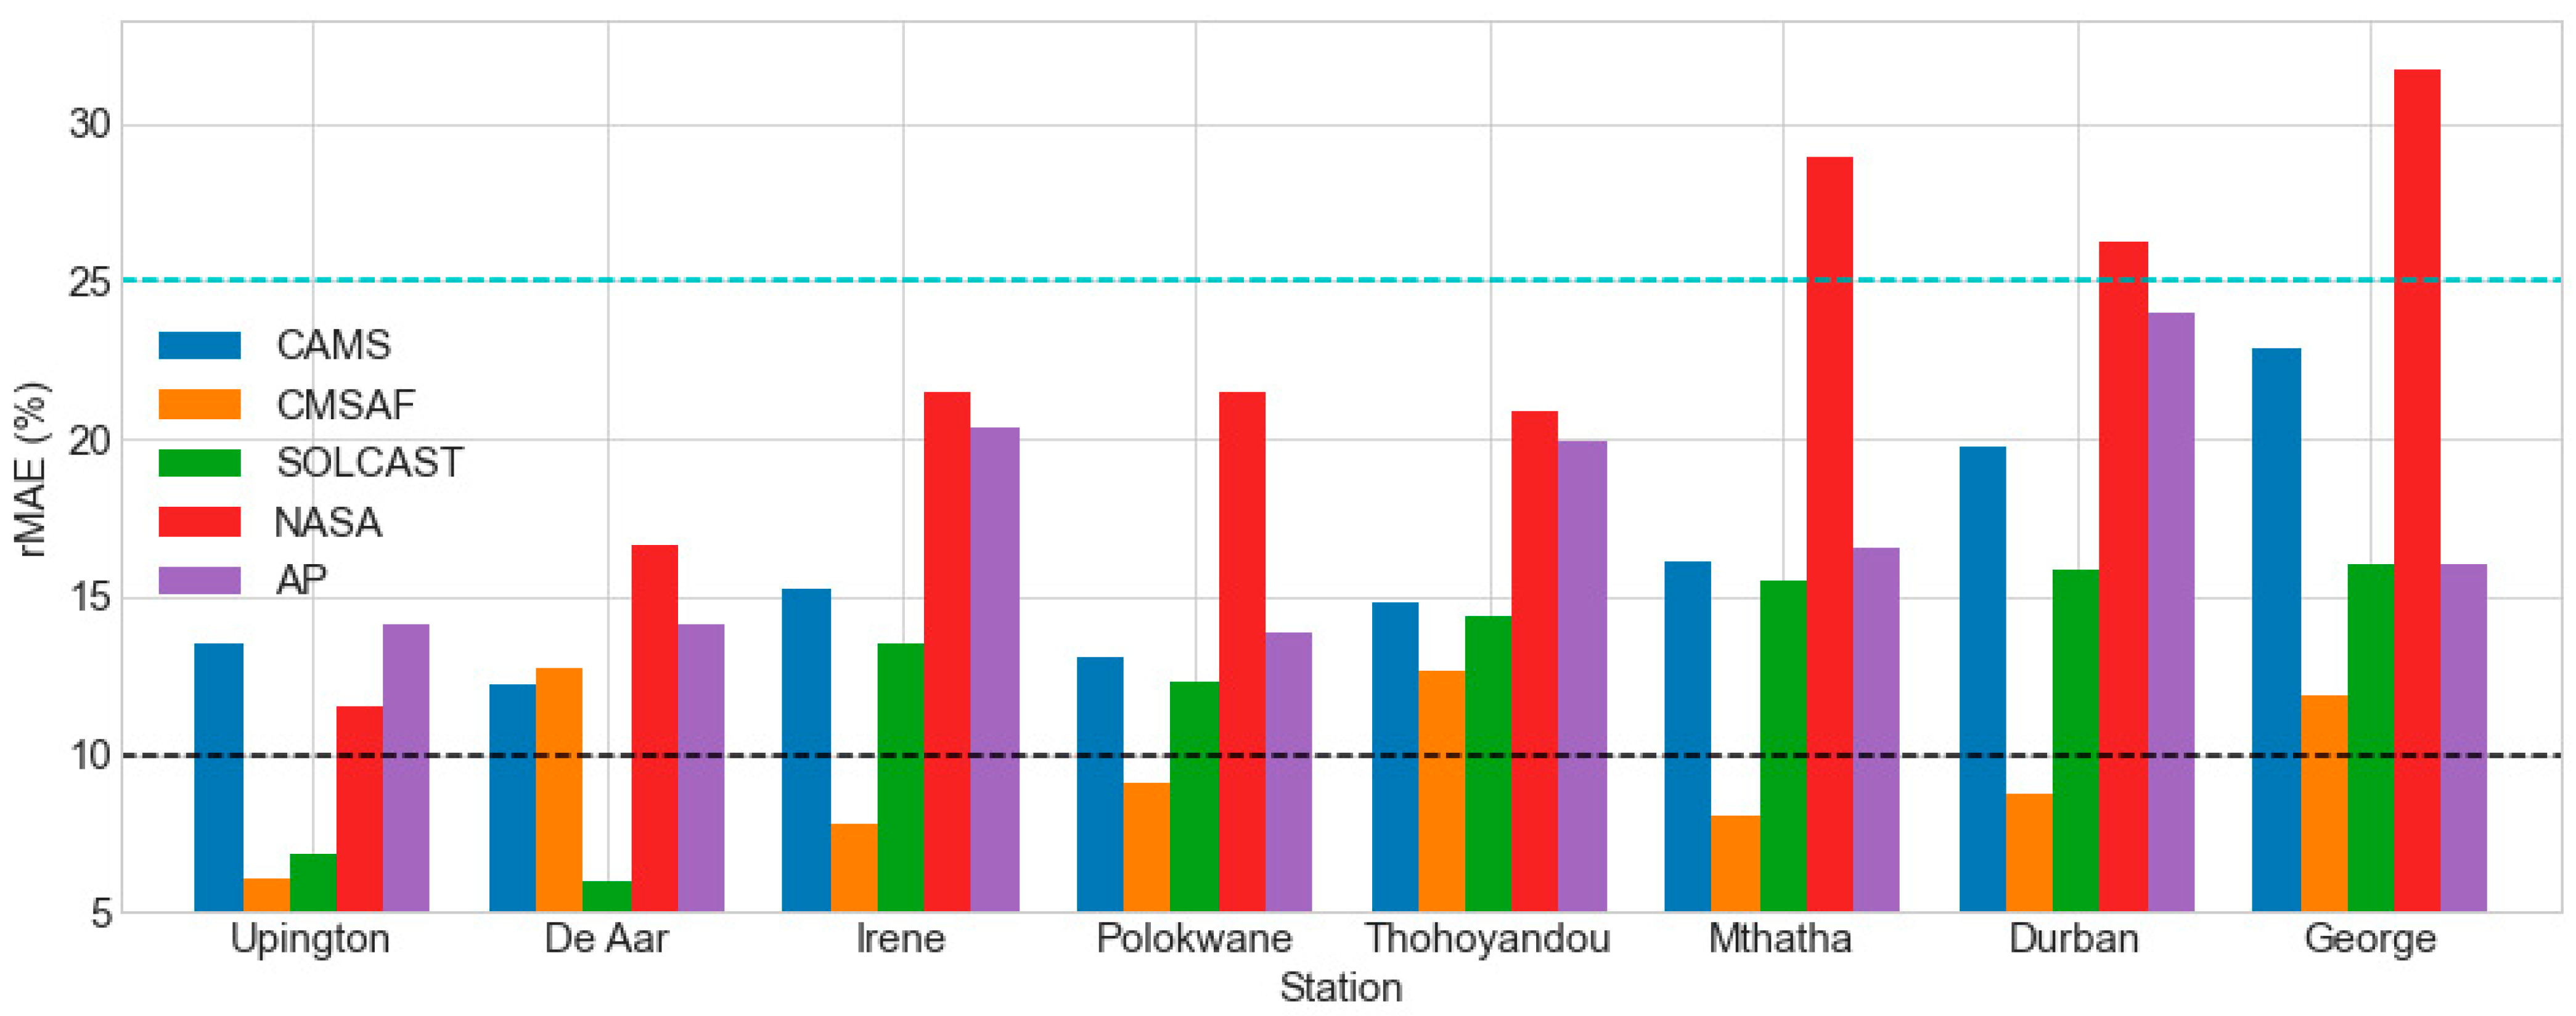
Figure 11 shows the rMAE results under overcast skies: The CMSAF dataset performed well (rMAE 10%) at five of eight stations, with rMAE ranging from 6.07% (at Upington) to 9.06% (at Polokwane), but poorly (rMAE > 10%) at George (11.85%), Thohoyandou (12.64%), and De Aar (12.73%). The SOLCAST dataset performed well at Upington (6.88%) and De Aar (5.97%), but poorly at the other stations, with rMAE ranging from 12.33% (at Polokwane) to 16.07% (at George). CAMS, NASA SSE, and the AP model all performed poorly under overcast conditions. The rMAE for CAMS ranged from 12.22% (at De Aar) to 22.87% (at George). In Polokwane, the AP model rMAE varied from 13.82% to 23.96%, while in Durban, it was 23.96%.
Table 6 presents the correlation coefficient (R2) findings under overcast skies. The CMSAF dataset indicated a high correlation at Upington (0.988), Irene (0.981), Mthatha (0.979), and Durban (0.976), but only a moderate correlation at George (0.968), De Aar (0.959), Polokwane (0.962), and Thohoyandou (0.942). The SOLCAST dataset demonstrated a high correlation at De Aar (0.982) and Upington (0.983), as well as a moderate correlation at Durban (0.925), Thohoyandou (0.957), and Mthatha (0.934). The SOLCAST dataset performed poorly in Polokwane (0.913), George (0.918), and Irene (0.936).
The CAMS dataset indicated reasonable correlation at six stations, with R2 ranging from 0.923 (at Durban) to 0.944 (at Mthatha), but weak correlation at De Aar (0.908) and Polokwane (0.907). The AP model shows weak correlation at all sites, with R2 ranging from 0.812 (at Thohoyandou) to 0.912 (at Upington). The NASA SSE showed an excellent correlation at Upington (0.942) but a weak correlation at the other stations, with R2 ranging from 0.737 (at Polokwane) to 0.863 (at Irene).

3.4. Clear-Sky versus Overcast-Sky Conditions

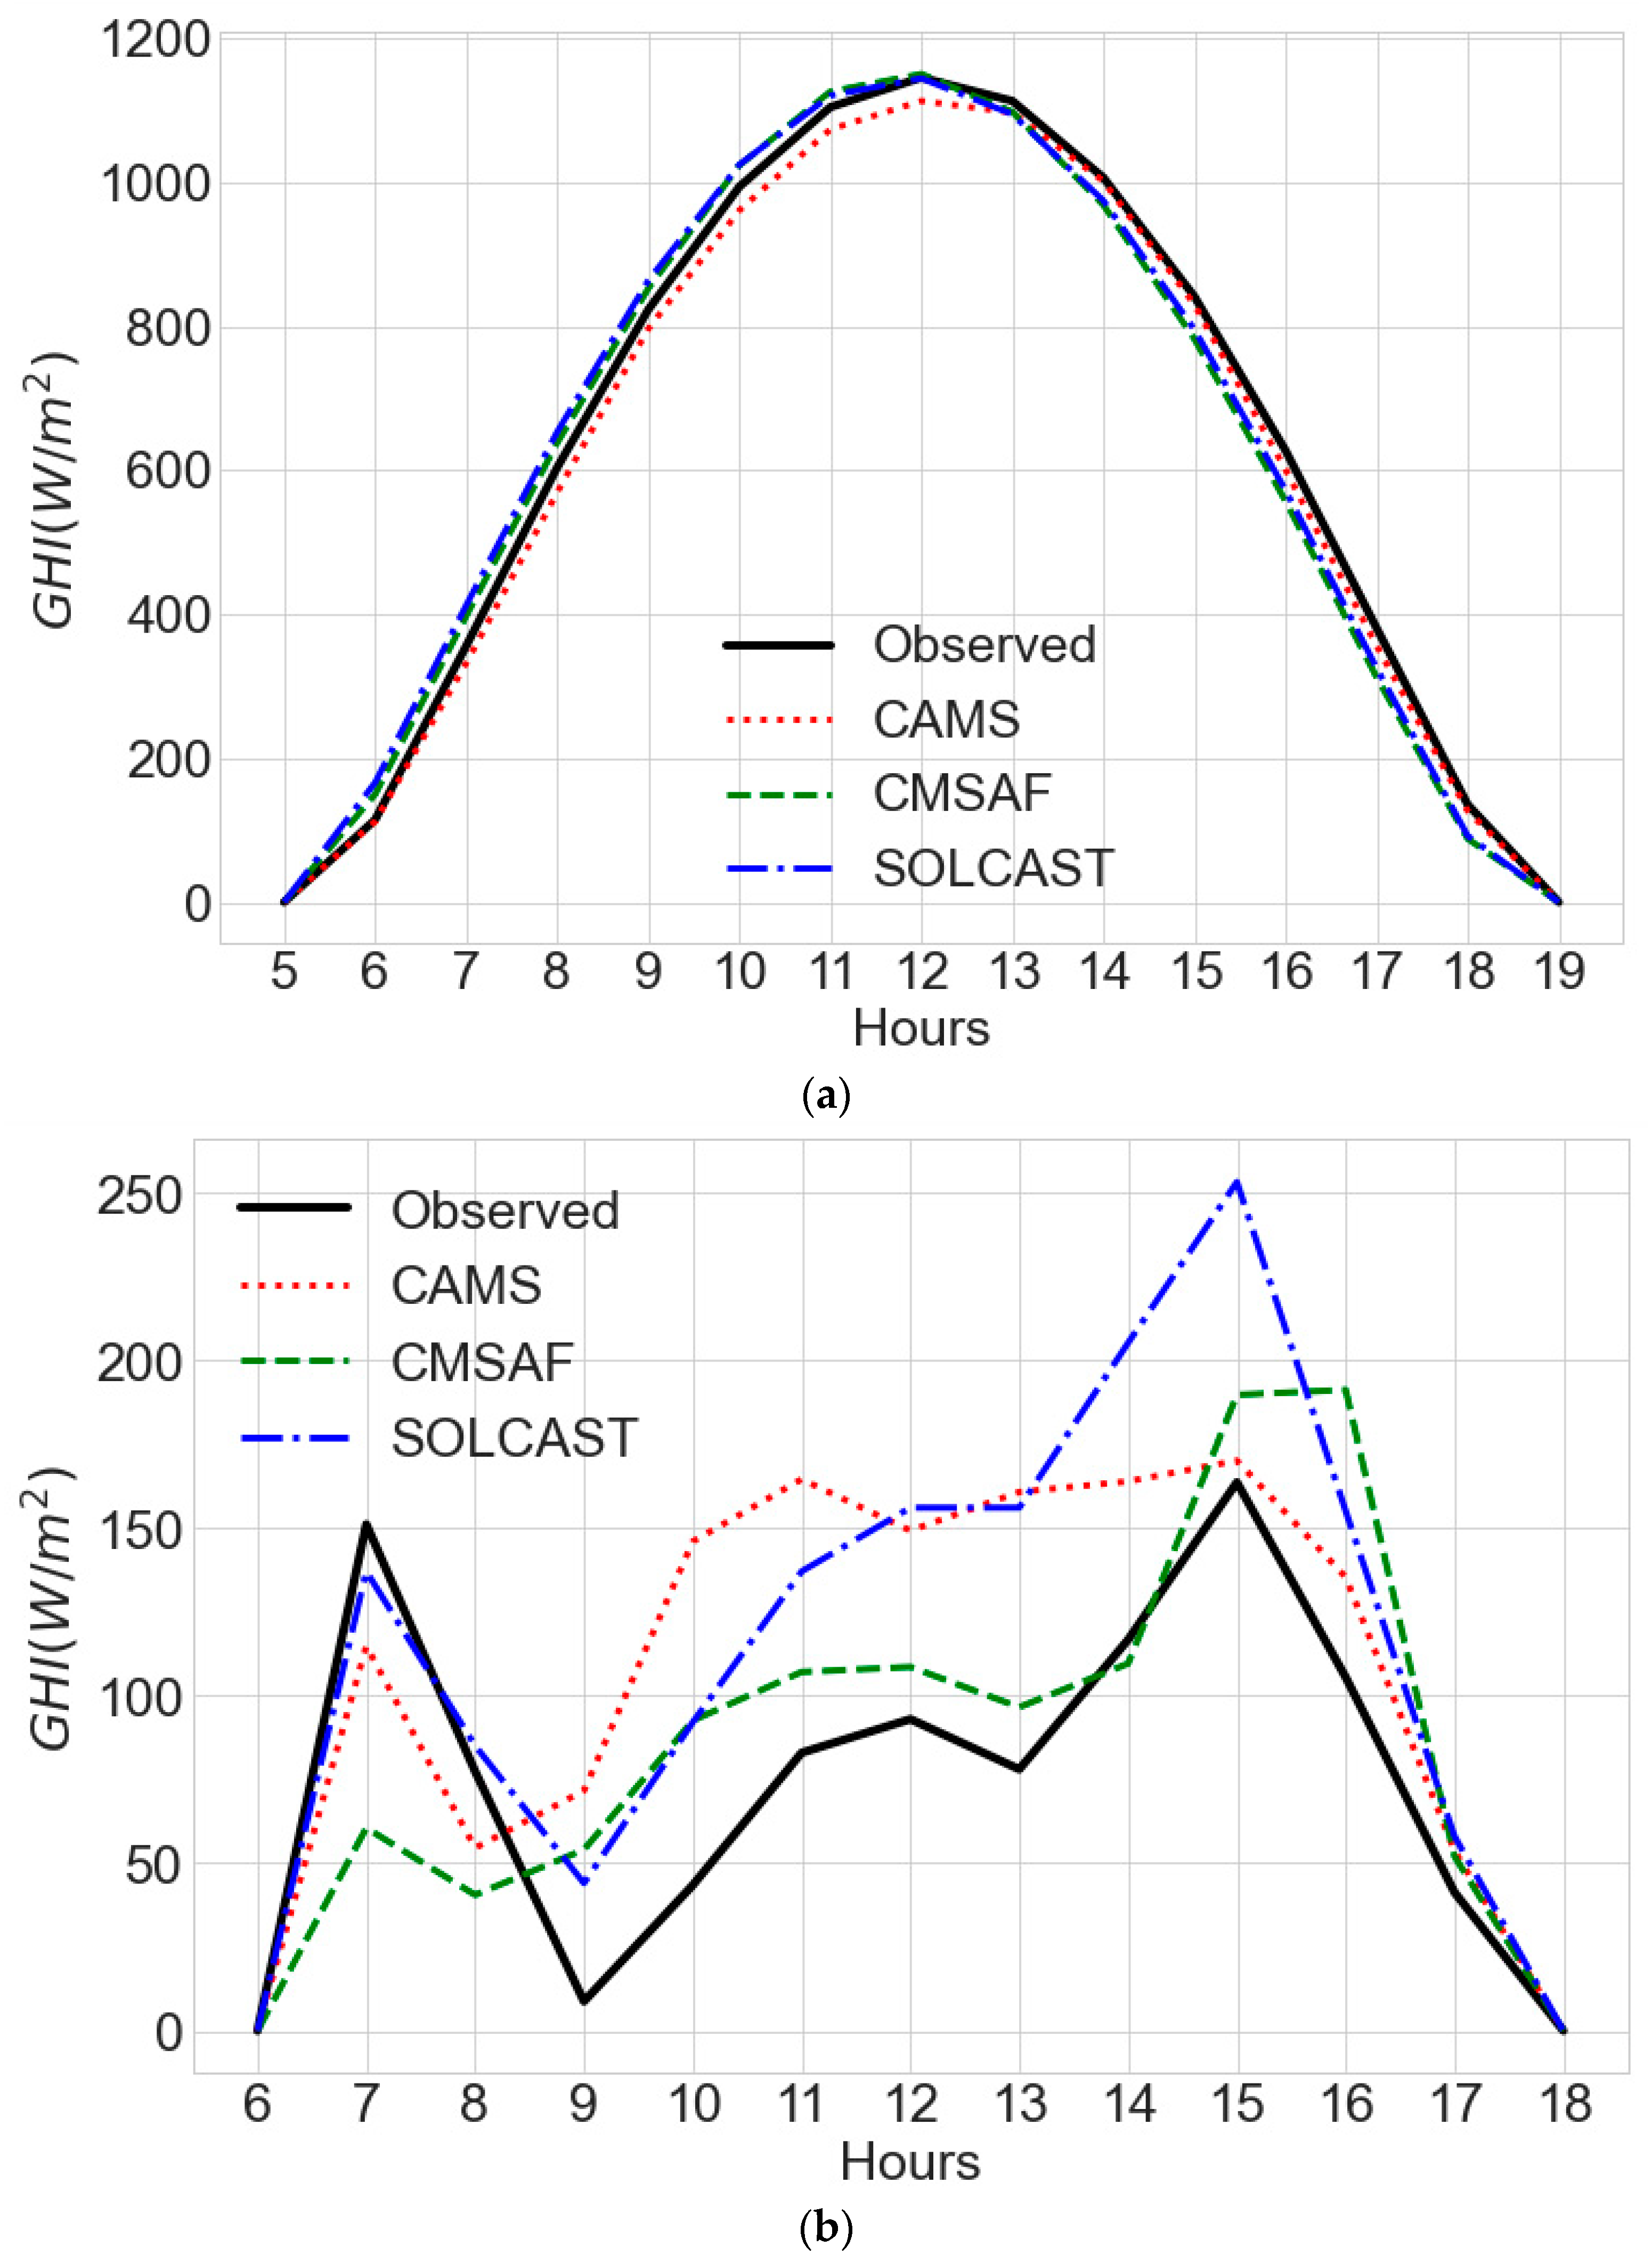
Figure 12a depicts an hourly curve for a clear-sky day (Irene station on 24 May 2019), whereas Figure 12b depicts a daily curve for an overcast-sky day (Irene station on 15 November 2019) for observed GHI, CAMS, CMSAF, and SOLCAST. As NASA SSE and AP datasets are not available on an hourly time-scale, they are not represented in the line graphs. CAMS, CMSAF, and SOLCAST successfully predicted the GHI under clear-sky conditions based on Figure 12a. According to Figure 12b, under overcast-sky conditions, CAMS, CMSAF, and SOLCAST all demonstrated poor rendition, i.e., they diverged from the observed GHI dataset line. It is also clear from Figure 12b that the CAMS, CMSAF, and SOLCAST datasets differ in how they estimate GHI in the presence of clouds (i.e., they diverge), implying that different algorithms that are implemented to parameterize clouds by different data providers perform differently.
This demonstrates that datasets that are used to estimate GHI do not precisely parameterize the actual fraction of the sky that is covered by cloud fluctuation. When the estimated data are compared to the observed GHI data, this inadequacy is one of the primary bias sources. The presence of clouds in the sky significantly reduces the feasibility of GHI datasets.

4. Discussion

4.1. All-Sky Conditions

The excellent performance of daily CAMS dataset as shown by rMBE in Figure 3, rRMSE in Figure 4, rMAE in Figure 5, and R2 in Table 4 might be because the main inputs to Heliosat-4 (aerosol properties, total column water vapor, and ozone content) are provided by the CAMS global services every three hours; cloud properties are derived from Meteosat satellites with 15-min temporal resolution. The higher temporal resolution of the input parameters may account for the lower observed biases between the observation and the CAMS-estimated GHI. The higher spatial resolution of 3–5 km in Southern Africa might also be the reason while CAMS showed an excellent performance. The works by [18,48,49,50] in the Netherlands, Morocco, Germany, and the tropical Atlantic Ocean demonstrated that CAMS can estimate GHI with variance from site to site. The authors endorsed CAMS as a viable alternate source of GHI data.
The SOLCAST daily GHI performed exceptionally well, as evidenced by rMBE in Figure 3, rRMSE in Figure 4, rMAE in Figure 5, and R2 in Table 4. This could be attributed to the higher spatial resolution 1–2 km and the use of the REST2v5 [51] clear sky model to calculate the clear sky index when converting satellite images to GHI, which was found by Sun et al., 2019 [52] to have an excellent worldwide performance.
In five of the eight sites, the daily CMSAF proved more viable than other datasets under consideration. CMSAF’s excellent spatial resolution of 5 km may be responsible for the good performance. The CMSAF results are consistent with [53], who discovered daily rRMSE ranging from 15% to 20% and rMAE ranging from 11% to 15% for European sites under all-sky conditions. Trolliet et al., 2018 [50] found that CMSAF and CAMS performed similarly in the tropical Atlantic Ocean. The good performance of the CMSAF dataset could be attributed to the use of a new improved Radiative Transfer Model (RTM) and updated look-up tables (LUT) [54]. The scheme’s development was made possible by the availability of high-performance computing (HPC) [54]. CMSAF calibrated and then validated fixed standard inputs albedo (0.2), ozone (345DU), and water vapor column (15 mm) using the Mesoscale Atmospheric Global Irradiance Code (MAGIC) algorithm [54]. The only drawback of the scheme was the lack of African aerosol climatology data. When compared to in situ observed aerosol data in west Africa, Neher et al., 2019 [55] discovered that the aerosols climatology utilized in CMSAF satellite GHI retrievals scheme was underestimated. The ensuing biases in the CMSAF dataset could be attributed to the use of erroneous aerosol climatology.
The NASA SSE satellite dataset performed badly, being outperformed by the other satellite-based datasets (CMSAF, SOLCAST, and CAMS), as well as the AP model. The low spatial resolution of 0.5° × 0.5° (~55 km × 55 km) could explain the poor performance. It has less spatial detail, but higher-resolution datasets, such as SOLCAST (~2 km × 2 km), CMSAF (~5 km × 5 km), CAMS (~5 km × 5 km), and AP (site-specific), have more spatial detail, allowing them to estimate GHI more accurately. NASA SSE must enhance their spatial resolution in order to improve their GHI performance estimation capability. It is unusual to locate a 50 × 50 km2 area in South Africa with uniform terrain, ground cover, and cloud cover. Jed et al., 2022 [56] validated daily NASA SSE with a year of GHI in situ observations from four different sites in Mauritania and Algeria. Based on their validation results, rRMSE ranging from 11% to 31%, rMAE ranging from 9% to 30%, and R2 ranging from 0.43 to 0.78, they recommended that NASA SSE datasets be utilized for solar energy projects in Algeria and Mauritania where no actual in situ measured GHI is obtainable. As shown in the table below, the overall statistical criteria that was used to assess the performance of the datasets under all-sky conditions differed (Table 7).

4.2. Clear-Sky, All-Sky, and Clear-Sky Conditions

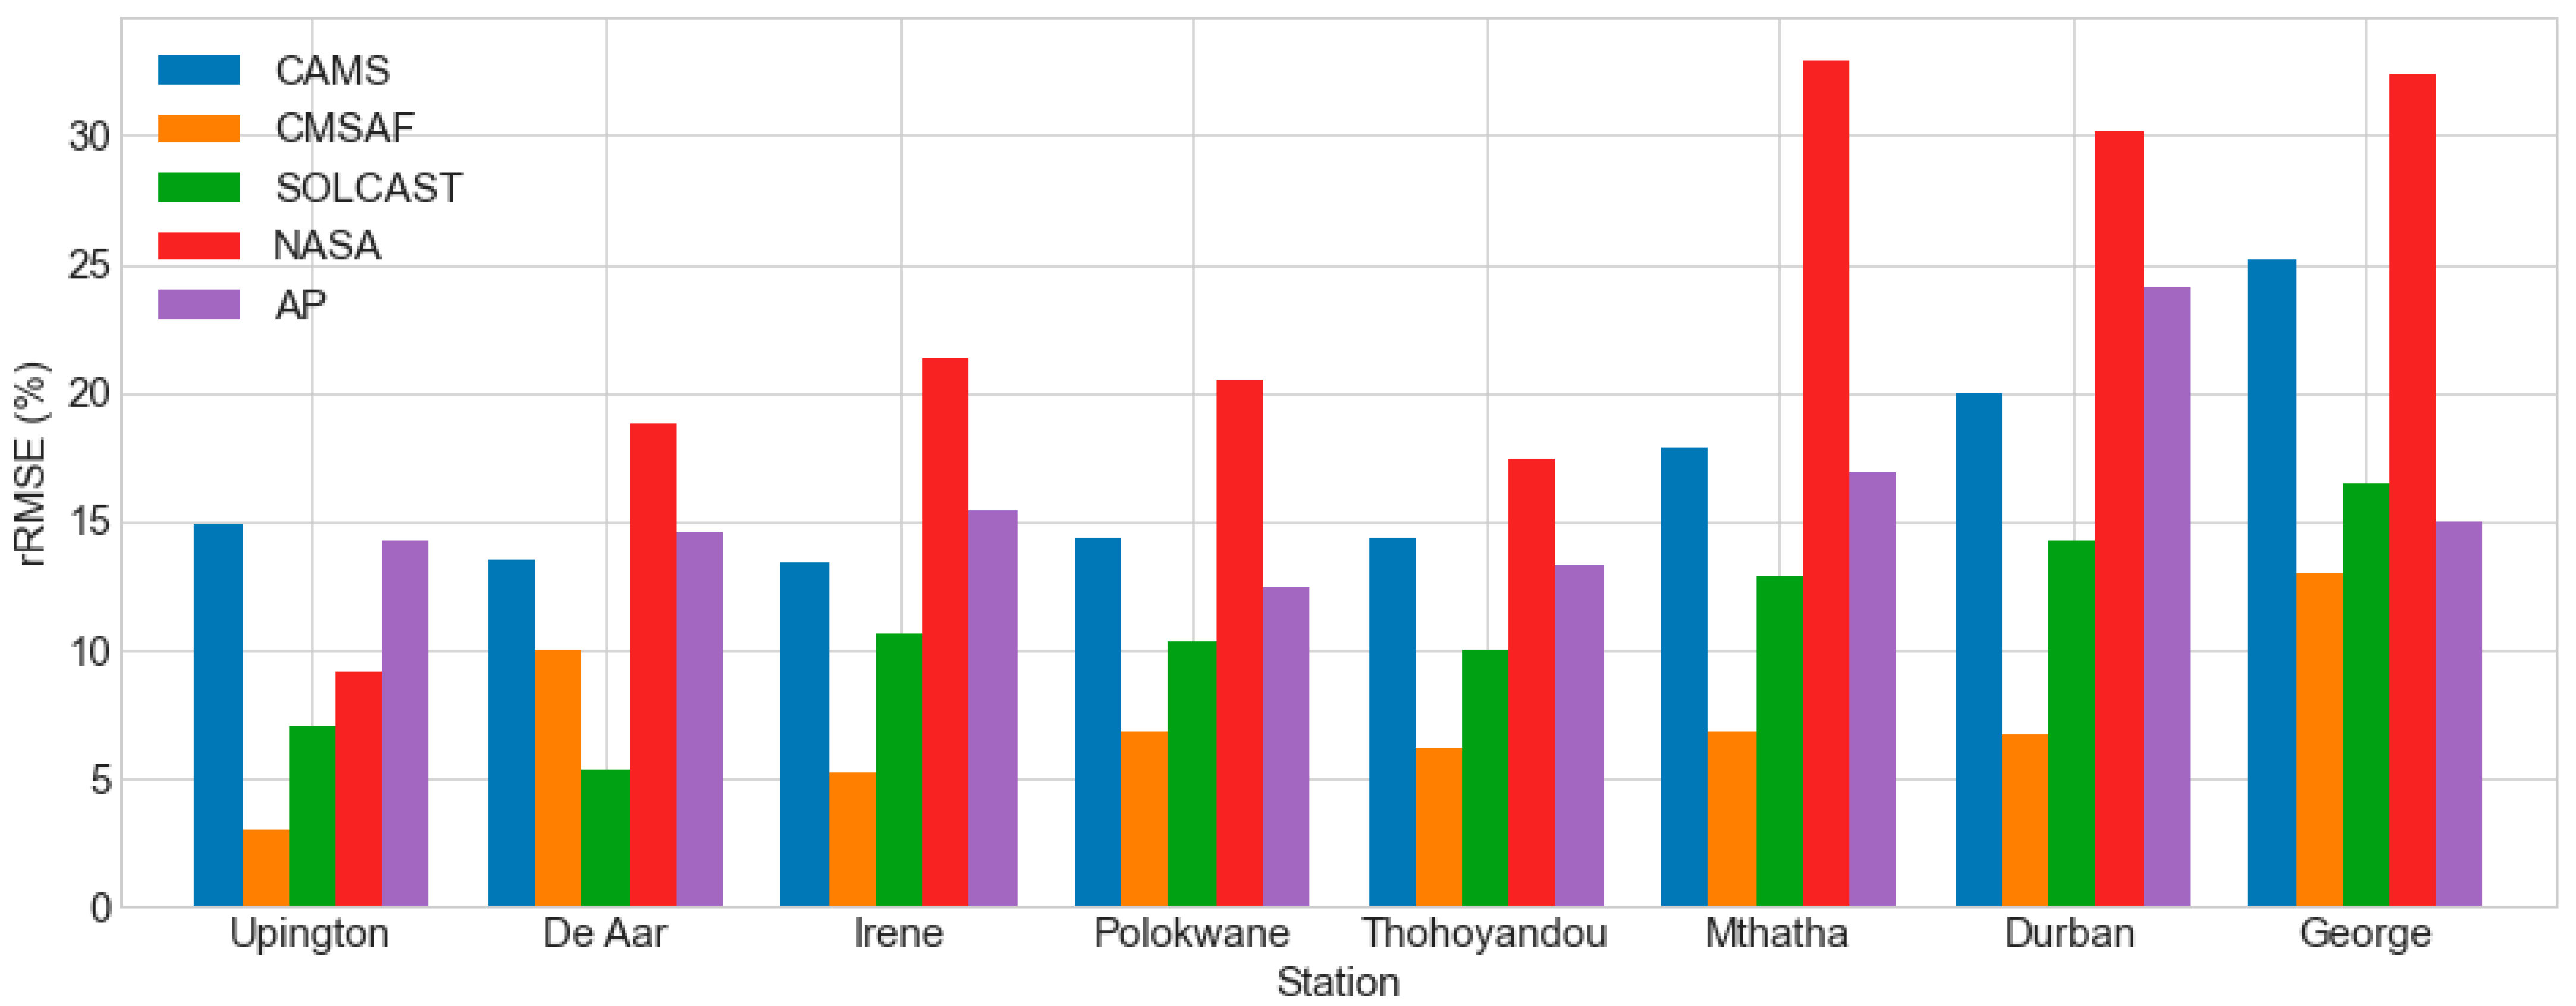
Figure 13 depicts the differences in rRMSE between overcast and clear sky conditions. Overall, the average differences for all the stations that were evaluated based on rRMSE magnitude differences were as follows: CMSAF (7%) was followed by SOLCAST (11%), AP (16%), CAMS (17%), and NASA SSE (23%). There are significant differences in rRMSE between overcast and clear skies. CMSAF exhibited a smaller differential in practically every station. CMSAF’s high performance in the presence of clouds is related to an improvement in the look-up tables (LUTs) based eigenvector hybrid approach by adding variables that are introduced by cloudy skies to treat cloudy skies, as stated in [54].
The SOLCAST dataset performed well in estimating GHI under cloud conditions. This could be due to the usage of dependable and accurate Meteosat satellites with high spatial resolution (1–2 km) cloud information data from the European Organization for the Exploitation of Meteorological Satellites (EUMETSAT) across Africa [27]. The REST2v5 clear-sky model [51] with water vapor data from ERA5 [34] and aerosols data from MERRA2 [35] is utilized as a consistent cloud detection algorithm.
Under overcast conditions, CAMS performed relatively poorly in estimating GHI. The low performance could be ascribed to the McClear model [57] failing to identify actual cloud-free conditions in some places due to errors in aerosols that are used as inputs to the McClear model, as reported by [48,58].
Except for Upington, all of the NASA SSE stations showed quite substantial rRMSE disparities. This could be because Upington has a homogenous terrain compared to the other stations, and the grid is practically similar to the point of standardization.
Figure 14 depicts the difference in rRMSE between overcast and clear skies. Overall, the average rRMSE discrepancies for all the stations ranked by rRMSE difference magnitude were as follows: CMSAF (4%), SOLCAST (7%), CAMS (11%), AP (13%), and NASA SSE (15%). When comparing overcast-sky and clear-sky situations, there is a moderate apparent difference in rRMSE. Except for Upington, CMSAF showed low rRMSE differences while NASA SSE had significant rRMSE differences. Increases in rRMSE with increasing total fractional cloud coverage were also reported in the works of [56,59,60,61,62,63].
Figure 15 shows the rRMSE difference between all-sky and clear-sky conditions. Overall, the average disparities for all the stations were as follows, ranked by the magnitude of their discrepancies: AP (3%) is followed by CMSAF (4%), SOLCAST (4%), CAMS (6%), and NASA SSE (8%). AP showed only a minor change across all the sites; however, NASA SSE showed a significant variance across almost all the stations except Upington. The discrepancies are also substantial in Mthatha, Durban, and George, which are coastal stations with a low proportion of clear sky days, with an annual average of less than 6% clear sky days, according to [33]. Merchand et al., 2019 [48] found that coastal stations performed worse than inland stations, which they ascribed to an underestimation of clear-sky conditions.
The AP model performed well in estimating the daily GHI. Available gridded sunshine duration datasets will be validated and corrected for bias in the future. This will enable South African sunshine duration data to be used as an input to estimate the daily GHI values at any location in South Africa. Future research will examine whether climate change affects the stability of the AP model coefficients over time in each climate zone. Cloud cover has been proven to have a substantial impact on GHI estimates. Future study will investigate the use of satellite and reanalysis cloud datasets as potential inputs to cloud-based models; cloud cover may provide better GHI predictions. Since satellite and reanalysis datasets are constantly enhanced, validation will be performed on a regular basis. There was variation in performance with site, and some datasets performed better at specific locations. Validation of the different datasets in other places to identify a more suited one is recommended.

5. Conclusions

The study compared the daily GHI extracted from four satellite-based databanks (namely SOLCAST, CAMS, CMSAF, and NASA SSE) and the Ångström–Prescott (AP) model, by validating them against BSRN QC and HelioClim model quality-checked observed daily GHI from at eight ground stations in South Africa. The study also looked into the overall best approach for estimating the daily GHI using satellite data and the Ångström–Prescott (AP) model. Furthermore, the study investigated the dataset’s performance under clear-sky and overcast-sky conditions.
The study found that daily GHI estimations using satellite-based and Ångström–Prescott (AP) models were comparable and can be considered as a good alternative source of GHI in the study area with determinable confidence, particularly in areas with no observation GHI measurements. The presence of clear-sky conditions (excellent performance), all-sky conditions (moderate performance), and overcast-sky conditions was also found to affect the performance of the estimated datasets (poor performance).
SOLCAST was the best overall performer in estimating the daily GHI under clear-sky and all-sky conditions; CMSAF was the best overall performer under overcast-sky conditions; and NASA SSE was the worst overall performer in different cloud cover conditions. CAMS, CMSAF, and the Ångström–Prescott (AP) model performed better, and their performance in the study region was nearly identical. For estimating the daily GHI in South Africa with quantitative confidence, the CAMS, CMSAF, and Ångström–Prescott (AP) models are recommended. The poor performance of the NASA SSE dataset in the study area could be attributed to its low spatial resolution. In some stations, the AP model outperforms satellite-based estimates, but they can only be used in areas with measured sunshine duration data; satellite datasets can be extracted from any South African location. Cloud parameterization schemes and spatial resolution should be enhanced to improve dataset performance. The results may give data for future research to correct biases between in situ observations and estimated GHI datasets using machine learning algorithms.

Author Contributions

Conceptualization, B.M., methodology, B.M.; software, B.M.; validation, M.D.L.; formal analysis, B.M.; investigation, B.M.; data curation, B.M.; writing—original draft preparation, B.M.; supervision, M.D.L. and S.J.M.; writing—review and editing, B.M.; M.D.L. and S.J.M. All authors have read and agreed to the published version of the manuscript.

Funding

The APC was funded by the South African Weather Service.

Institutional Review Board Statement

Not applicable.

Informed Consent Statement

Not applicable.

Acknowledgments

The authors would like to thank the South African Weather Services (SAWS) for providing the Global Horizontal Irradiance (GHI) data, that was used as a reference for satellite based and AP model derived data used in the validation; the Copernicus Atmosphere Monitoring Service (CAMS) Solar Radiation Data (SoDa) for freely providing the CAMS daily GHI data used in the study on their website; the European Organization for the Exploitation of Meteorological Satellites (EUMETSAT) for providing freely available surface daily Satellite Application Facility on Climate Monitoring (CMSAF SARAH) data on their website, and the National Aeronautics and Space Administration (NASA) Prediction Of Worldwide Energy Resources (POWER) for providing freely daily GHI data on their website.

Conflicts of Interest

The authors declare no conflict of interest.

References

  1. Duffie, J.A.; Beckman, W.A.; Blair, N. Solar Engineering of Thermal Processes, Photovoltaics and Wind; John Wiley & Sons: Hoboken, NJ, USA, 2020. [Google Scholar]
  2. Iqbal, M. An Introduction to Solar Radiation; Elsevier: Amsterdam, The Netherlands, 2012. [Google Scholar]
  3. Foster, R.; Ghassemi, M.; Cota, A. Solar Energy: Renewable Energy and the Environment; CRC Press: Boca Raton, FL, USA, 2009. [Google Scholar]
  4. Sen, Z. Solar Energy Fundamentals and Modeling Techniques: Atmosphere, Environment, Climate Change and Renewable Energy; Springer Science & Business Media: Berlin/Heidelberg, Germany, 2008. [Google Scholar]
  5. Kalogirou, S.A. Solar Energy Engineering: Processes and Systems; Academic Press: Cambridge, MA, USA, 2013. [Google Scholar]
  6. Wald, L. Basics in Solar Radiation at Earth Surface. 2018. Available online: https://hal-minesparistech.archives-ouvertes.fr/hal-01676634 (accessed on 15 February 2021).
  7. Schwandt, M.; Chhatbar, K.; Meyer, R.; Mitra, I.; Vashistha, R.; Giridhar, G.; Gomathinayagam, S.; Kumar, A. Quality check procedures and statistics for the Indian SRRA solar radiation measurement network. Energy Procedia 2014, 57, 1227–1236. [Google Scholar] [CrossRef]
  8. Zawilska, E.; Brooks, M. An assessment of the solar resource for Durban, South Africa. Renew. Energy 2011, 36, 3433–3438. [Google Scholar] [CrossRef]
  9. Urraca, R.; Gracia-Amillo, A.M.; Huld, T.; Martinez-De-Pison, F.J.; Trentmann, J.; Lindfors, A.V.; Riihelä, A.; Sanz-Garcia, A. Quality control of global solar radiation data with satellite-based products. Sol. Energy 2017, 158, 49–62. [Google Scholar] [CrossRef]
  10. Zawilska, E.; Brooks, M.J.; Meyer, A.J. A review of solar resource assessment initiatives in South Africa: The case for a national network. In Proceedings of the World Renewable Energy Forum, Denver, CO, USA, 13–17 May 2012. [Google Scholar]
  11. Jiang, H.; Yang, Y.; Bai, Y.; Wang, H. Evaluation of the total, direct, and diffuse solar radiations from the ERA5 reanalysis data in China. IEEE Geosci. Remote Sens. Lett. 2020, 17, 47–51. [Google Scholar] [CrossRef]
  12. Sianturi, Y.; Marjuki; Sartika, K. Evaluation of ERA5 and MERRA2 reanalyses to estimate solar irradiance using ground observations over Indonesia region. AIP Conf. Proc. 2020, 2223, 020002. [Google Scholar]
  13. Tang, W.; Yang, K.; He, J.; Qin, J. Quality control and estimation of global solar radiation in China. Sol. Energy 2010, 84, 466–475. [Google Scholar] [CrossRef]
  14. Zhang, Q.; Cui, N.; Feng, Y.; Jia, Y.; Li, Z.; Gong, D. Comparative Analysis of Global Solar Radiation Models in Different Regions of China. Adv. Meteorol. 2018, 2018, 3894831. [Google Scholar] [CrossRef]
  15. Almorox, J.; Benito, M.; Hontoria, C. Estimation of monthly Angström-Prescott equation coefficients from measured daily data in Toledo, Spain. Renew. Energy 2005, 30, 931–936. [Google Scholar] [CrossRef]
  16. Adamala, S.; Reddy, Y.V.K. Evaluation of Different Solar Radiation Estimation Methods for Indian Locations. In Water Resources and Environmental Engineering II; Springer: Berlin/Heidelberg, Germany, 2018; pp. 47–56. [Google Scholar]
  17. De Medeiros, F.J.; Silva, C.M.; Bezerra, B.G. Calibration of Ångström-Prescott Equation to Estimate Daily Solar Radiation on Rio Grande do Norte State, Brazil. Rev. Bras. Meteorol. 2017, 32, 409–416. [Google Scholar] [CrossRef]
  18. Marchand, M.; Ghennioui, A.; Wey, E.; Wald, L. Comparison of several satellite-derived databases of surface solar radiation against ground measurement in Morocco. Adv. Sci. Res. 2018, 15, 21–29. [Google Scholar] [CrossRef]
  19. Martín-Pomares, L.; Romeo, M.G.; Polo, J.; Frías-Paredes, L.; Fernández-Peruchena, C.M. Sampling design optimization of ground radiometric stations. In Solar Resources Mapping; Springer International Publishing: Cham, Switzerland, 2019; pp. 253–281. [Google Scholar]
  20. Wilbert, S.; Stoffel, T.; Myers, D.; Wilcox, S.; Habte, A.; Vignola, F.; Wood, J.; Pomares, L.M. Measuring Solar Radiation and Relevant Atmospheric Parameters. In Best Practices Handbook for the Collection and Use of Solar Resource Data for Solar Energy Applications; National Renewable Energy Laboratory: Golden, CO, USA, 2017. Available online: https://hal-mines-paristech.archives-ouvertes.fr/hal-01184753 (accessed on 12 March 2020).
  21. Moradi, I. Quality control of global solar radiation using sunshine duration hours. Energy 2009, 34, 1–6. [Google Scholar] [CrossRef]
  22. Garg, H.P.; Garg, S.N. Measurement of solar radiation—II. Calibration and standardization. Renew. Energy 1993, 3, 335–348. [Google Scholar] [CrossRef]
  23. Žák, M.; Mikšovský, J.; Pišoft, P. CMSAF radiation data: New possibilities for climatological applications in the Czech Re-public. Remote Sens. 2015, 7, 14445–14457. [Google Scholar] [CrossRef]
  24. Angstrom, A. Solar and terrestrial radiation: Report to the international commission for solar research on actinometric investigations of solar and atmospheric radiation. Quart. J. Roy. Meteorol. Soc. 1924, 50, 121–126. [Google Scholar] [CrossRef]
  25. Prescott, J.A. Evaporation from a water surface in relation to solar radiation. Trans. Roy. Soc. S. Aust. 1940, 46, 114–118. [Google Scholar]
  26. Mabasa, B.; Lysko, M.D.; Tazvinga, H.; Mulaudzi, S.T.; Zwane, N.; Moloi, S.J. The Ångström–Prescott Regression Coefficients for Six Climatic Zones in South Africa. Energies 2020, 13, 5418. [Google Scholar] [CrossRef]
  27. SOLCAST. Available online: https://solcast.com (accessed on 7 April 2022).
  28. SOLCAST Historical Data Validation. Available online: https://solcast.com/historical-and-tmy/validation-and-accuracy (accessed on 7 April 2022).
  29. Copernicus Portal. Available online: https://atmosphere.copernicus.eu/data (accessed on 26 March 2022).
  30. Solar Radiation Data (SoDa) Service. Available online: http://solar.atmosphere.copernicus.eu/cams-radiation-service (accessed on 2 March 2022).
  31. Qu, Z.; Oumbe, A.; Blanc, P.; Espinar, B.; Gesell, G.; Gschwind, B.; Klüser, L.; Lefèvre, M.; Saboret, L.; Schroedter-Homscheidt, M.; et al. Fast radiative transfer parameterisation for assessing the surface solar irradiance: The Heliosat-4 method. Meteorol. Z. 2017, 26, 33–57. [Google Scholar] [CrossRef]
  32. Pfeifroth, U.; Kothe, S.; Trentmann, J.; Hollmann, R.; Fuchs, P.; Kaiser, J.; Werscheck, M. Surface Radiation Data Set—Heliosat (SARAH), 2nd ed.; Satellite Application Facility on Climate Monitoring: Offenbach, Germany, 2019; Available online: https://www.cmsaf.eu/SharedDocs/Literatur/document/2016/saf_cm_dwd_val_meteosat_hel_2_1_pdf.pdf?__blob=publicationFile (accessed on 17 February 2022).
  33. Mabasa, B.; Lysko, M.D.; Moloi, S.J. Validating Hourly Satellite Based and Reanalysis Based Global Horizontal Irradiance Datasets over South Africa. Geomatics 2021, 1, 429–449. [Google Scholar] [CrossRef]
  34. Hersbach, H.; Bell, B.; Berrisford, P.; Hirahara, S.; Horányi, A.; Muñoz-Sabater, J.; Nicolas, J.; Peubey, C.; Radu, R.; Schepers, D.; et al. The ERA5 Global Reanalysis. Q. J. R. Meteorol. Soc. 2020, 146, 1999–2049. [Google Scholar] [CrossRef]
  35. Gelaro, R.; McCarty, W.; Suárez, M.J.; Todling, R.; Molod, A.; Takacs, L.; Randles, C.A.; Darmenov, A.; Bosilovich, M.G.; Reichle, R.; et al. The Modern-Era Retrospective Analysis for Research and Applications, Version 2 (MERRA-2). J. Clim. 2017, 30, 5419–5454. [Google Scholar] [CrossRef]
  36. NASA SSE. These Data Were Obtained from the NASA Langley Research Center (LaRC) POWER Project Funded through the NASA Earth Sci-ence/Applied Science Program. Available online: https://power.larc.nasa.gov/data-access-viewer/ (accessed on 2 February 2020).
  37. Mabasa, B.; Lysko, M.D.; Tazvinga, H.; Zwane, N.; Moloi, S.J. The Performance Assessment of Six Global Horizontal Irradiance Clear Sky Models in Six Climatological Regions in South Africa. Energies 2021, 14, 2583. [Google Scholar] [CrossRef]
  38. Long, C.N.; Dutton, E.G. BSRN Global Network Recommended QC Tests, V2. 2010. Available online: https://epic.awi.de/30083/1/BSRN_recommended_QC_tests_V2.pdf (accessed on 11 March 2022).
  39. Roesch, A.; Wild, M.; Ohmura, A.; Dutton, E.G.; Long, C.N.; Zhang, T. Assessment of BSRN radiation records for the computation of monthly means. Atmos. Meas. Tech. 2011, 4, 339–354. [Google Scholar] [CrossRef]
  40. Driemel, A.; Augustine, J.; Behrens, K.; Colle, S.; Cox, C.; Cuevas-Agulló, E.; Denn, F.M.; Duprat, T.; Fukuda, M.; Grobe, H.; et al. Baseline Surface Radiation Network (BSRN): Structure and data description (1992–2017). Earth Syst. Sci. Data 2018, 10, 1491–1501. [Google Scholar] [CrossRef]
  41. Geiger, M.; Diabaté, L.; Ménard, L.; Wald, L. A web service for controlling the quality of measurements of global solar irradiation. Sol. Energy 2002, 73, 475–480. [Google Scholar] [CrossRef]
  42. Finkensieper, S.; Stengel, M.; Selbach, N.; Rainer, H.; Werscheck, M.; Meirink, J.F. ICDR SEVIRI Clouds—Based on CLAAS-2 Methods, Satellite Application Facility on Climate Monitoring. Available online: https://wui.cmsaf.eu/safira/action/viewICDRDetails?acronym=CLAAS_V002_ICDR (accessed on 2 February 2021).
  43. Benas, N.; Finkensieper, S.; Stengel, M.; van Zadelhoff, G.-J.; Hanschmann, T.; Hollmann, R.; Meirink, J.F. The MSG-SEVIRI-based cloud property data record CLAAS-2. Earth Syst. Sci. Data 2017, 9, 415–434. [Google Scholar] [CrossRef]
  44. Tuononen, M.; O’Connor, E.J.; Sinclair, V.A. Evaluating solar radiation forecast uncertainty. Atmos. Chem. Phys. 2019, 19, 1985–2000. [Google Scholar] [CrossRef]
  45. Cloud Coverage in South Africa (Mini-Project). Available online: https://www.cmsaf.eu/EN/Products/Tools/R/Monthly_Report_Cloud_Coverage_pdf.pdf?__blob=publicationFile&v=2 (accessed on 2 December 2021).
  46. Gueymard, C.A. A review of validation methodologies and statistical performance indicators for modeled solar radiation data: Towards a better bankability of solar projects. Renew. Sustain. Energy Rev. 2014, 39, 1024–1034. [Google Scholar] [CrossRef]
  47. Carlos, M.; Peruchena, F.; Martín Gastón, M. A simple and efficient procedure for increasing the temporal resolution of global horizontal solar irradiance series. Renew. Energy 2016, 86, 375–383. [Google Scholar] [CrossRef]
  48. Marchand, M.; Lefèvre, M.; Saboret, L.; Wey, E.; Wald, L. Verifying the spatial consistency of the CAMS Radiation Service and HelioClim-3 satellite-derived databases of solar radiation using a dense network of measuring stations: The case of The Netherlands. Adv. Sci. Res. 2019, 16, 103–111. [Google Scholar] [CrossRef]
  49. Marchand, M.; Saint-Drenan, Y.M.; Saboret, L.; Wey, E.; Wald, L. Performance of CAMS Radiation Service and HelioClim-3 databases of solar radiation at surface: Evaluating the spatial variation in Germany. Adv. Sci. Res. 2020, 17, 143–152. [Google Scholar] [CrossRef]
  50. Trolliet, M.; Walawender, J.P.; Bourlès, B.; Boilley, A.; Trentmann, J.; Blanc, P.; Lefèvre, M.; Wald, L. Downwelling surface solar irradiance in the tropical Atlantic Ocean: A comparison of re-analyses and satellite-derived data sets to PIRATA measurements. Ocean Sci. 2018, 14, 1021–1056. [Google Scholar] [CrossRef]
  51. Gueymard, C.A. REST2: High-performance solar radiation model for cloudless-sky irradiance, illuminance, and photosyntheti-cally active radiation—Validation with a benchmark dataset. Sol. Energy 2008, 82, 272–285. [Google Scholar] [CrossRef]
  52. Sun, X.; Bright, J.M.; Gueymard, C.A.; Acord, B.; Wang, P.; Engerer, N.A. Worldwide performance assessment of 75 global clear-sky irradiance models using principal component analysis. Renew. Sustain. Energy Rev. 2019, 111, 550–570. [Google Scholar] [CrossRef]
  53. Urraca, R.; Gracia-Amillo, A.M.; Koubli, E.; Huld, T.; Trentmann, J.; Riihelä, A.; Lindfors, A.V.; Palmer, D.; Gottschalg, R.; Antonanzas-Torres, F. Extensive validation of CM SAF surface radiation products over Europe. Remote Sens. Environ. 2017, 199, 171–186. [Google Scholar] [CrossRef]
  54. Mueller, R.W.; Matsoukas, C.; Gratzki, A.; Behr, H.D.; Hollmann, R. The CM-SAF operational scheme for the satellite based retrieval of solar surface irradiance—A LUT based eigenvector hybrid approach. Remote Sens. Environ. 2009, 113, 1012–1024. [Google Scholar] [CrossRef]
  55. Neher, I.; Crewell, S.; Meilinger, S.; Pfeifroth, U.; Trentmann, J. Photovoltaic power potential in West Africa using long-term satellite data. Atmos. Chem. Phys. 2020, 20, 12871–12888. [Google Scholar] [CrossRef]
  56. Jed, M.; Ihaddadene, N.; Jed, M.E.; Ihaddadene, R.; El Bah, M. Validation of the Accuracy of NASA Solar Irradiation Data for Four African Regions. Planning 2022, 17, 29–39. [Google Scholar] [CrossRef]
  57. Lefèvre, M.; Oumbe, A.; Blanc, P.; Espinar, B.; Gschwind, B.; Qu, Z.; Wald, L.; Schroedter-Homscheidt, M.; Hoyer-Klick, C.; Arola, A.; et al. McClear: A new model estimating downwelling solar radiation at ground level in clear-sky conditions. Atmos. Meas. Tech. 2013, 6, 2403–2418. [Google Scholar] [CrossRef]
  58. Thomas, C.; Wey, E.; Blanc, P.; Wald, L. Validation of three satellite-derived databases of surface solar radiation using measurements performed at 42 stations in Brazil. Adv. Sci. Res. 2016, 13, 81–86. [Google Scholar] [CrossRef]
  59. Ameen, B.; Balzter, H.; Jarvis, C.; Wey, E.; Thomas, C.; Marchand, M. Validation of hourly global horizontal irradiance for two satellite-derived datasets in northeast Iraq. Remote Sens. 2018, 10, 1651. [Google Scholar] [CrossRef]
  60. Li, R.; Wang, D.; Liang, S. Comprehensive assessment of five global daily downward shortwave radiation satellite products. Sci. Remote Sens. 2021, 4, 100028. [Google Scholar] [CrossRef]
  61. Zhang, X.; Liang, S.; Wang, G.; Yao, Y.; Jiang, B.; Cheng, J. Evaluation of the reanalysis surface incident shortwave radiation products from NCEP, ECMWF, GSFC, and JMA using satellite and surface observations. Remote Sens. 2016, 8, 225. [Google Scholar] [CrossRef]
  62. Xia, S.; Mestas-Nuñez, A.; Xie, H.; Vega, R. An evaluation of satellite estimates of solar surface irradiance using ground observations in San Antonio, Texas, USA. Remote Sens. 2017, 9, 1268. [Google Scholar] [CrossRef]
  63. Eissa, Y.; Korany, M.; Aoun, Y.; Boraiy, M.; Abdel Wahab, M.; Alfaro, S.; Blanc, P.; El-Metwally, M.; Ghedira, H.; Hungershoefer, K.; et al. Validation of the surface downwelling solar irradiance estimates of the helioclim-3 database in egypt. Remote Sens. 2015, 7, 9269–9291. [Google Scholar] [CrossRef]
Figure 1. Depiction of the distribution of research locations in South Africa’s six macroclimate regions (From [26,33,37]).
Solar 02 00021 g001
Figure 2. The study approach for the data quality control and quantitative assessment.
Solar 02 00021 g002
Figure 3. The daily rMBE of estimated GHI datasets in all-sky conditions.
Solar 02 00021 g003
Figure 4. The daily rRMSE of the derived GHI datasets under all-sky conditions.
Solar 02 00021 g004
Figure 5. The daily rMAE of the estimated GHI datasets under all-sky conditions.
Solar 02 00021 g005
Figure 6. The daily rMBE of the estimated GHI datasets under clear skies.
Solar 02 00021 g006
Figure 7. The daily rRMSE of the calculated GHI datasets under clear skies.
Solar 02 00021 g007
Figure 8. The daily rMAE of the estimated GHI datasets under clear-sky conditions.
Solar 02 00021 g008
Figure 9. The daily rMBE of the estimated GHI datasets under overcast-sky conditions.
Solar 02 00021 g009
Figure 10. The daily rRMSE of the estimated GHI datasets under overcast-sky conditions.
Solar 02 00021 g010
Figure 11. The daily rMAE of the estimated GHI datasets under overcast-sky conditions.
Solar 02 00021 g011
Figure 12. (a) The hourly clear sky conditions (cloud information detected by CLAAS-2 satellite-based dataset. (b) The hourly overcast sky conditions (cloud information detected by CLAAS-2 satellite-based dataset).
Solar 02 00021 g012
Figure 13. The daily rRMSE of the estimated GHI datasets for overcast-sky minus clear-sky conditions.
Solar 02 00021 g013
Figure 14. The daily rRMSE of the estimated GHI datasets for overcast sky minus all-sky conditions.
Solar 02 00021 g014
Figure 15. The daily rRMSE of the estimated GHI datasets for all-sky minus clear-sky conditions.
Solar 02 00021 g015
Table 1. Study locations: Latitude, longitude, altitude, and GHI observation period.
StationLatitude
(°)
Longitude
(°)
Altitude
(m)
GHI Observation
Period
Upington−28.4821.268481 February 2014 to 30 November 2019
DeAar−30.6723.9912841 May 2014 to 31 December 2019
Irene−25.9128.2115241 March 2014 to 31 December 2019
Polokwane−23.8629.4512331 March 2015 to 31 December 2019
Thohoyandou−23.0830.466191 March 2015 to 31 October 2017
Mthatha−31.5528.677441 August 2014 to 31 December 2019
Durban−29.6131.11911 March 2015 to 31 December 2019
George−34.0122.381921 January 2015 to 31 December 2019
Table 2. The resulting ranges for each metric and class. Green represents excellent performance, blue represents good performance, and yellow represents poor performance.
SkillrMBErRMSErMAER2
Poor rMBE > | ± 5 | % rRMSE > 15 % rMAE > 10 % R 2 < 0.925
Good | ± 3 | % < rMBE | ± 5 | % 5 % < rRMSE 15 % 5 % < rMAE 10 % 0.975 R 2 0.925
Excellent rMBE | ± 3 | % rRMSE 5 % rMAE 5 % R 2 > 0.975
Table 3. The daily average observed GHI (W/m2) and the correlation (R2) between the estimated datasets and the observed GHI in all-sky conditions. Green is the best (R2 > 0.975), blue is the intermediate ( 0.925 R 2 0.975 ), and yellow is the poor relationship ( R 2 < 0.925 ) .
StationMEANCAMSCMSAFSOLCASTNASAÅngström–Prescott
Upington260.810.9850.9870.9910.9790.930
DeAar246.150.9880.9900.9940.9720.930
Irene230.790.9640.9680.9610.9250.912
Polokwane230.300.9440.9480.9480.9000.91
Thohoyandou200.190.9670.9680.9750.9260.937
Mthatha193.860.9850.9900.9840.9530.951
Durban184.770.9770.9870.9760.9430.915
George193.870.9770.9900.9830.8960.948
Table 4. Best estimated dataset per daily benchmark, most feasible dataset, and level of performance. Colors are used to show the best performing dataset each site based on daily benchmarks and the most feasible dataset per site based on degree of ranking out of 4 (total number benchmarks used). Green represents SOLCAST, magenta NASA SSE, blue CMSAF, and yellow AP.
DailyMinimum
rMBE
Minimum
rRMSE
Minimum
rMAE
Maximum
R2
Most
Feasible
Rating
UpingtonSOLCASTSOLCASTSOLCASTSOLCASTSOLCAST4/4
De AarSOLCASTSOLCASTSOLCASTSOLCASTSOLCAST4/4
IreneNASA SSEAPCMSAFCMSAFCMSAF2/4
PolokwaneAPAPCMSAFCMSAFAP/CMSAF2/4
ThohoyandouAPAPSOLCASTSOLCASTAP/SOLCAST2/4
MthathaAPCMSAFCMSAFCMSAFCMSAF3/4
DurbanAPCMSAFCMSAFCMSAFCMSAF3/4
GeorgeAPCMSAFCMSAFCMSAFCMSAF3/4
Table 5. The daily average observed GHI (W/m2) and the correlation (R2) between the estimated datasets and observed GHI in clear-sky conditions. Green is the best ( 0.925 R 2 0.975 ), (R2 > 0.975), blue is the intermediate ( R 2 > 0.975 ).
StationMEANCAMSCMSAFSOLCASTNASAÅngström–Prescott
Upington276.470.9980.9970.9990.9970.994
DeAar263.950.9980.9960.9990.9980.997
Irene221.130.9940.9930.9960.9920.976
Polokwane260.670.9960.9890.9960.9850.990
Thohoyandou228.770.990.9790.9930.980.974
Mthatha212.050.9980.9970.9980.9960.994
Durban205.650.9940.9950.9970.9940.995
George221.840.9980.9990.9980.9950.998
Table 6. The daily average observed GHI (W/m2) and correlation (R2) of the estimated datasets against observed GHI under overcast-sky conditions. Green indicates the best ( R 2 > 0.975 ), blue indicates the intermediate ( 0.925 R 2 0.975 ), and yellow indicates the poor relationship ( R 2 < 0.925 ) .
StationMEANCAMSCMSAFSOLCASTNASAÅngström–Prescott
Upington160.290.9430.9880.9820.9420.912
DeAar143.830.9080.9590.9830.8020.878
Irene137.530.9350.9810.9360.8630.871
Polokwane139.510.9070.9620.9130.7370.896
Thohoyandou121.550.9290.9420.9570.8350.812
Mthatha110.280.9440.9790.9340.8230.894
Durban99.90.9230.9760.9250.8540.847
George107.720.9360.9680.9180.7480.908
Table 7. Overall validation results under all-sky conditions. Green (1/5), yellow-low (2/5), blue (3/5), orange (4/5), and magenta (5/5) are used to describe the general performance ranking of the five datasets.
DatasetrMBErRMSErMAER2
SOLCAST−2% to 4%4% to 10%2% to 7%0.948 to 0.995
CAMS−3% to 6%5% to 12%3% to 8%0.944 to 0.990
CMSAF−2% to 6%5% to 12%4% to 8%0.948 to 0.990
Ångström–Prescott (AP)−1% to 4%5% to 11%4% to 9%0.910 to 0.951
NASA SSE−4% to 6%8% to 18%5% to 15%0.896 to 0.979
Publisher’s Note: MDPI stays neutral with regard to jurisdictional claims in published maps and institutional affiliations.