1. Introduction
The application of hybrid systems has led to lifestyle improvement, primarily in remote places (such as islands), where electricity is necessary and there are frequent electricity shortages [
1]. These systems are typically powered by non-renewable energy sources via diesel generators (DGs), which tend to be too costly to operate due to high fossil fuel costs (especially because of costly transport to the remote locations) along with the logistical difficulties at the time of fuel supply and equipment maintenance [
2,
3].
The use of renewable energies (such as solar or wind) presents a huge benefit compared to conventional energy resources, as they are not pollutive [
4,
5,
6]. The supply of energy using autonomous generation systems based on renewable sources constitutes a viable alternative, and they are called hybrid energy generation systems [
7]. There are several aspects to consider when working with these systems, such as reliability, cost, and the technical, economic, and environmental aspects [
8].
Off-grid systems have become a compelling model to implement on islands and other hard-to-reach areas, as centralized grid expansion for these distributed loads is often not cost-effective, where, typically, only diesel DGs are the source of electrical energy for these areas [
9,
10]. However, previous research has shown that by hybridizing an isolated system by introducing solar photovoltaic (PV) panels and batteries (BAT), total costs and CO
2 emissions can be reduced [
11].
The Galapagos Islands are an archipelago of volcanic islands located in the Pacific Ocean, about 1000 km off the coast of Ecuador in South America [
12]. The Galapagos Islands have a delicate ecosystem that is particularly vulnerable to the negative effects of climate change, including rising sea levels and increasing temperatures. The islands also face challenges related to energy access and security, as they rely on imported diesel fuel to power their electricity grids. By transitioning to renewable energy sources, the Galapagos Islands can reduce their dependence on fossil fuels and mitigate the negative effects of climate change. Renewable energy sources like solar, wind, and geothermal power are abundant in the Galapagos, and using them can reduce the islands’ greenhouse gas emissions and help protect the unique wild life and ecosystems that depend on a stable climate [
12]. The Galapagos Islands were chosen for this study as they are an iconic natural patrimony for humanity where unique species can only be found there. As these islands are located far from the mainland, typical solutions are to use non-renewable sources which can affect their ecosystem; thus, this case study is ideal in order to show how an optimal hybridization of a system can take place to further improve the economic, environmental, and electrical properties. Furthermore, we aimed for our research to be considered by the government authorities to apply favorable policies in these islands for further introduction of renewable energy systems.
Renewable energy can also help improve energy access and security on the islands. Solar panels and wind turbines can be installed in remote areas that are difficult to reach with traditional power infrastructure, providing electricity to isolated communities and reducing their reliance on diesel generators. Renewable energy sources can also be more cost-effective in the long run, reducing energy costs and providing economic benefits to the local communities [
13,
14]. A challenge in this context is to optimize the distribution of energy from different sources to meet the islands’ electricity demands while ensuring a stable and reliable energy supply. A hybrid renewable energy system typically includes multiple sources of power, such as solar, wind, and diesel generators, which are integrated and controlled to provide electricity to the grid, and their design can be further optimized to achieve the best results [
15,
16,
17]. The challenge lies in balancing the contribution of each energy source to meet the islands’ energy demand while ensuring a stable and reliable supply of electricity. Furthermore, the hybrid system needs to be optimized in order to find the best cost-effective solution to avoid under- or over-sizing the system, which will affect the economic, environmental, and electrical results. When performing these optimization designs, it can be challenging to obtain the required input data in order to run the whole simulation accurately, as extra assumptions will further increase the overall simulation error.
Given the above, this paper contributes to the literature through an optimal design of the implementation focused on the Galapagos Islands reality. Here, we analyze the system and weather properties as well as the characteristics of the solar panels, batteries, and diesel generators. An optimization algorithm is then applied to find the best design. The rest of the paper is structured as follows:
Section 2 provides a mathematical description of the performance and costs associated with diesel generators, solar panels, and batteries;
Section 3 formulates the optimization problem to be solved;
Section 4 describes the algorithm used to solve the optimization problem.
Section 5 presents the model used in this study. The results and discussion are presented in
Section 6. Finally, the conclusions are presented in
Section 7.
2. Hybrid System Mathematical Model
As an initial condition, the study incorporates a power system with diesel generators that are placed at a distance far enough from the inhabitants to avoid noise pollution and gas emissions (which is the case on many islands around the world).
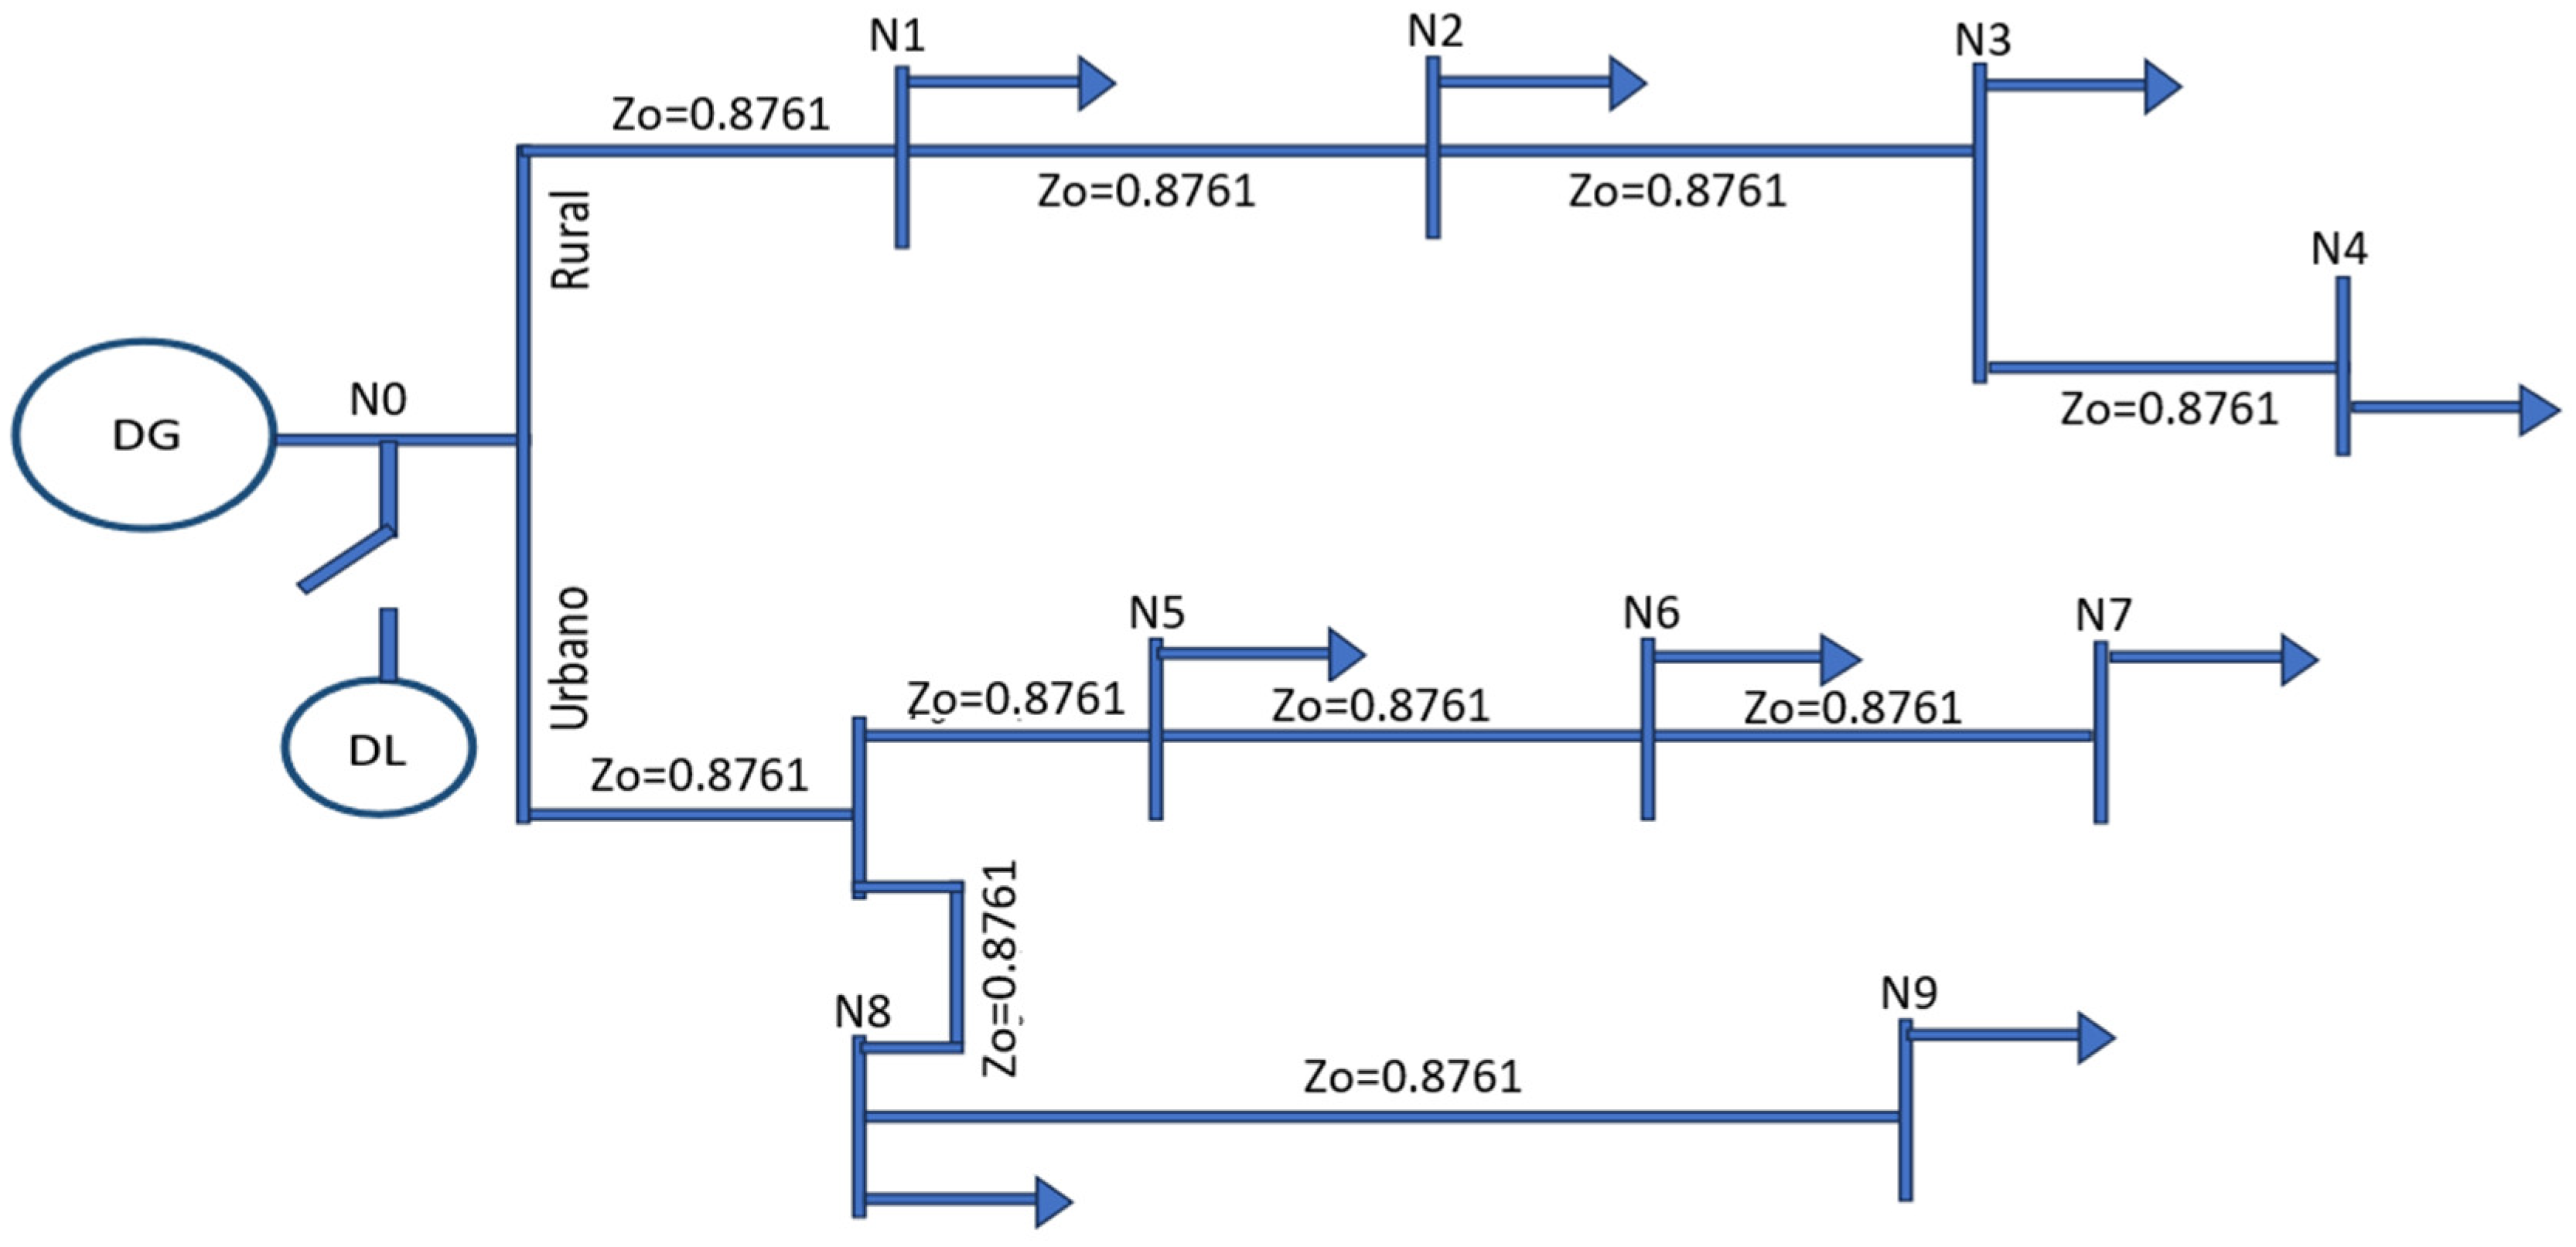
Figure 1 shows the single-line diagram of the Isabela Island distribution system, where the main AC network is energized by the diesel generator and is composed of 9 nodes, considering the impedance of the network (Z). The number of solar panels and batteries installed will be optimized at each location. These nodes also present load demand (L). The energy produced by PV is transferred to the loads through the inverters that control the maximum operating point of the solar panels. Likewise, the inverters in both directions are used to charge and discharge the batteries from/to the grid. The DG is installed on the first node, N0, to avoid the noise and emissions problems. The dump load (DL) is, likewise, in this node to consume any surplus energy in the network produced by the solar panels.
The simulations take place by discretizing time based on a fixed time step interval , , where represents the total number of time steps of the simulation. The time range of each time step, , is 1 h.
The novelty of the proposed modeling is based on the fact that instead of considering a central installation, we are considering a distributed one where the solar panels and batteries are split in the different nodes to be optimized. Furthermore, the diesel generator is assumed to be installed from the beginning, and, thus, it does not requires an investment cost. Regarding the batteries, the usual approach is to assign them a fixed lifetime, which is further estimated with a more accurate approach by considering the charging and discharging battery power.
2.1. Diesel Generator Model
The variable
, expressed in USD, represents the the cost of acquisition and installation of the diesel generator, which can be calculated using the following expression:
where
defines the number of replacements required for DGs during the grid’s lifetime
[years] expressed in years;
[USD/kW] is the cost per power rated for the
th replacement; and
[kW] is the rated power of the DGs expressed in kW.
Another important aspect to consider within the model is the diesel cost
[USD]. Such cost is a mathematical function that mainly depends on the diesel liters used in an interval time
, considered during the DG operation. This variable can be expressed as follows:
where
can be interpreted as the operational state of the
th DG at time
(i.e.,
if the DG is off; otherwise, it will take a value of 1); the coefficients
and
(both given in liters/kWh) determine the efficiency of the DGs that is related to the diesel consumption. In addition, the cost model to also consider is the cost of operation and maintenance of every DG
, which can be quantified as follows:
To guarantee the flow of power to the main network and extend the useful life of the generator, an operating range limited by a maximum
and minimum
value must be maintained, that is:
2.2. Photovoltaic Panel Model
The cost associated with solar panels (includes the cost of acquisition and installation) is described by
where
is the number of solar panels installed with power rating
for PV system
;
corresponds to the cost of the PV panels per kilowatt. The model also incorporates the cost of operation and maintenance that mainly depends on the solar irradiance
and efficiency of the PV panels
, which is mathematically represented in (6). The model considers a lifetime of 25 years for PV panels.
The amount of power generated for the solar panels during the time interval
is defined as
where
[W/m
2] is the solar irradiance, and
is the performance ratio of the PV system which accounts for all the losses related to these systems.
2.3. Battery Model
The batteries are associated with the main cost. The first cost is related to the battery acquisition
that depends on the installed number of batteries
, the rated power battery capacity
, and the price in USD per kilowatt-hour of battery
(see Equation (8)). The other cost corresponds to the operation and maintenance of every battery given in (8), in which the parameters
and
are the maximum power charge and discharge values, respectively, on battery
.
The useful lifetime of the batteries depends on their charge
and discharge
rate, since, internally, a chemical decomposition is generated. Hence, if these values are exceeded, the battery cells can reach a complete degradation. Therefore, the following restrictions should be considered to avoid progressive degradation:
where
is the total charge power per node of the battery inverters on the AC side in a time interval; likewise,
is the total power per node, but a discharge. In addition, it is relevant to incorporate into the model the concept of the current state of charge of the batteries
, which is quantified as follows:
where
represents the self-discharge value of the battery. The parameters
and
are the charge and discharge efficiencies of the battery, respectively. In order to avoid a reduction in the useful life of the battery and keep it within safe values, the restriction given in (12) is declared, which completes the mathematical model of the battery.
3. Optimization Problem Formulation
In a system initially operated only with DGs whose accumulated cost for diesel consumption is high, an optimized sizing of a hybrid system with PV and BAT is proposed that reduces the cost during the useful life of the system. Therefore, the cost function denoted by
is formulated as presented in (14). Then, the optimization problem focuses on minimizing the total cost of the system based on the optimal number and power of diesel generators, solar panels, and batteries, as indicated in (15). The system constraints are defined by Equations (4), (10), (11), (13), (16), and (17).
Equation (16) assures that the grid voltage is within the defined range, and Equation (17) guarantees that the load demand is always met.
4. Algorithms
Due to the discontinuous operation state of the diesel generators, i.e., ON/OFF, these optimization problems cannot be solved with basic mathematical approaches. As a result, metaheuristic optimization algorithms are applied.
The Particle Swarm Optimization algorithm (PSO) is then applied in this analysis due to the high accuracy and precision of this approach in solving optimization problems of a high complexity [
18].
Due to the high computational requirement to simulate this system during its 25-year lifetime, the time step resolution is 1 h, and the simulation is performed for 1 year. It is assumed that the obtained results are repeated every year as similar profiles for irradiance, temperature, and load demand are expected every year [
9] (see
Section 5).
Particle Swarm Optimization (PSO)
The PSO algorithm is a metaheuristic optimization approach employed to obtain the minimum and maximum global values of an optimization problem [
19] and was inspired by the social behavior of different groups such as birds, insects, and fishes [
20].
Initially, the particle population is defined randomly, where each particle has a particular operational point corresponding to its position for the th iteration. Each particle is then evaluated to find, among these, the best global position as well as the best historical position; each particle speed is estimated to find its new position for the next iteration .
To calculate the particle position for the next iteration, the following equations are employed:
where
and
are random numbers generated per iteration, defined within the ranges of
and
;
,
, and
are parameters representing the inertia with ranges of
,
, and
.
5. Case Study
In order to evaluate the defined modeling and optimization problem, Isabela Island was chosen. This is one of the most prominent islands from the Galapagos located in Ecuador.
For this island, the electrical grid is composed of two main sections, the urban and rural sections, which are composed of five and four nodes, respectively, and the load demand is distributed within this island in the different nodes as shown in
Figure 1.
The full load demand is originally met with five diesel generators with a nominal capacity of 300 kW each, and it is desired to optimize the number of solar panels and batteries to be installed in order to reduce the system’s overall costs for the next 25 years.
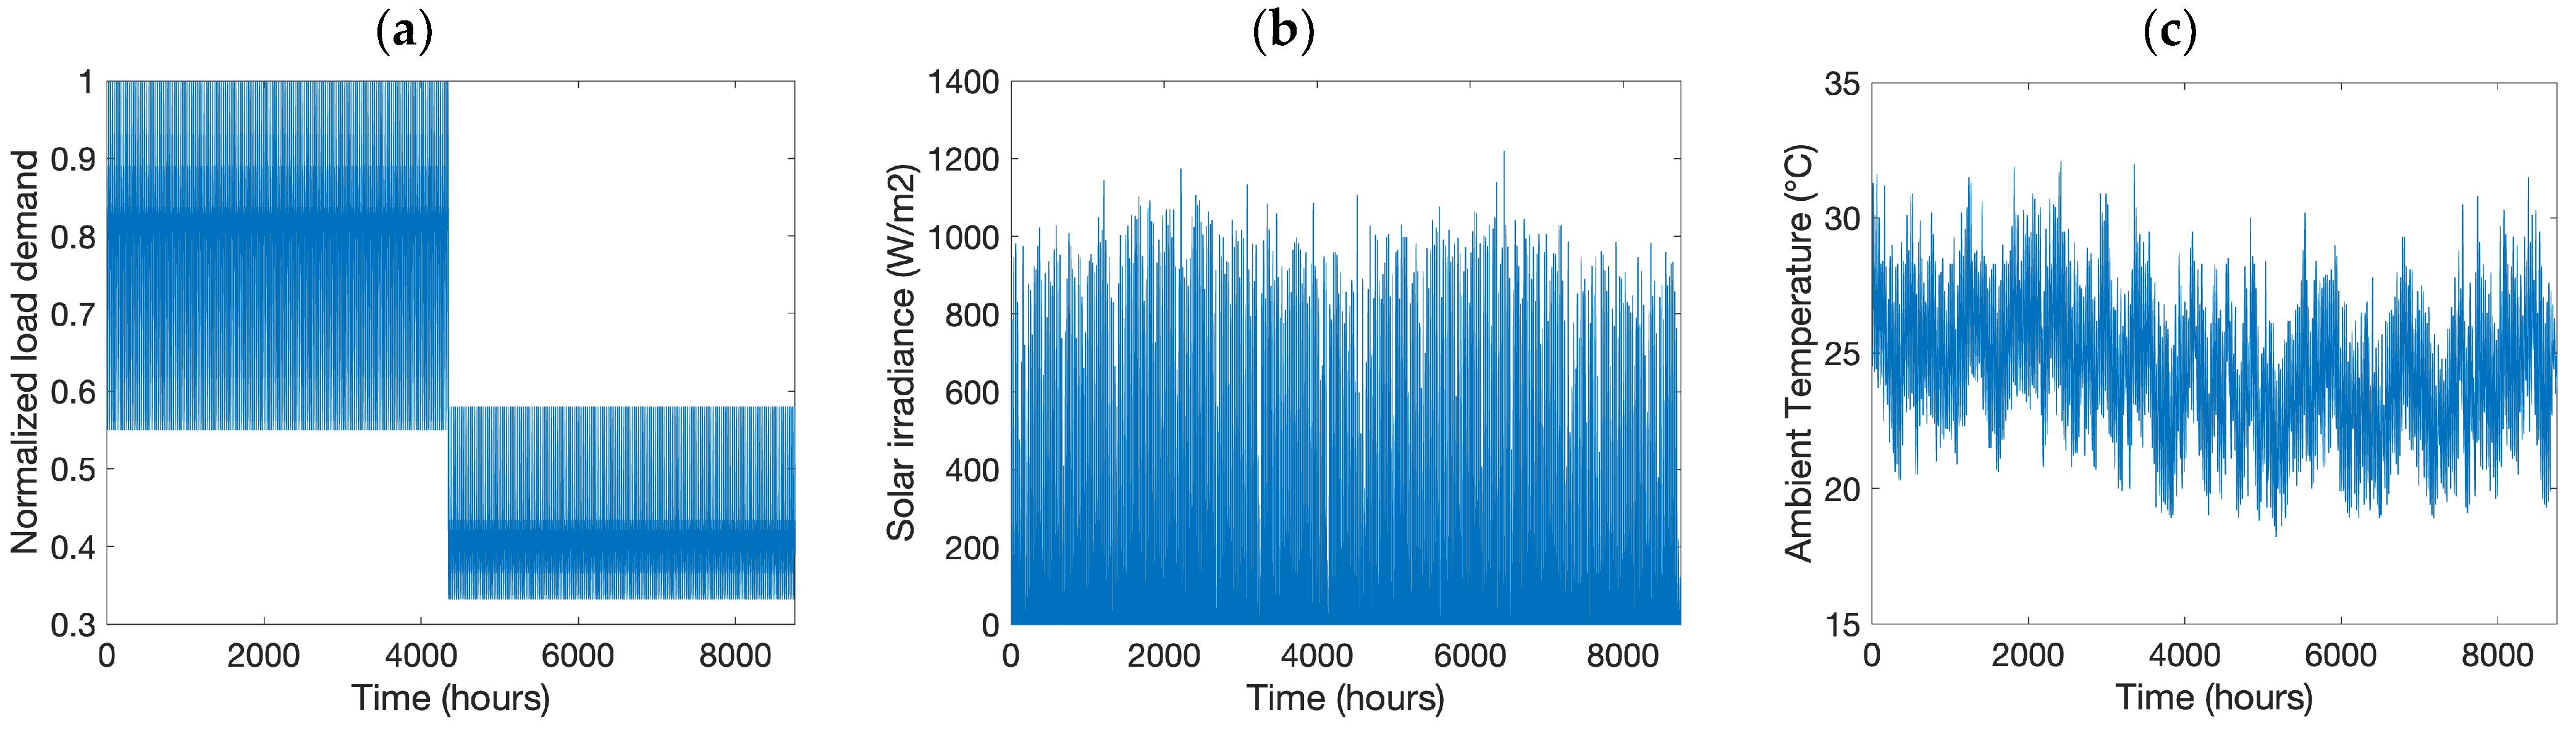
The total load demand from year 2021 and its normalized profile are presented in
Figure 2a. This profile is employed as the reference with a peak demand of 1234 kW during the January–June period, which are the months with the highest electrical consumption due to the heat season and the higher flux of tourists which result in a higher use of the air conditioners and other electrical equipment. On the other hand, the remaining months are within the cold season [
21], which is the result of the ocean currents, such as the Humboldt cold current and the Niño warm current [
22].
The typical meteorological year (TMY) of the solar irradiance and ambient temperature for this island was calculated based on its historical data. The TMY values were then applied to the simulations. These values were obtained via the Global Solar Atlas for the Isabela Island (latitude of −0.946783° and longitude of −90.95847°, assuming solar panels with 10° tilt facing North). These profiles are presented in
Figure 2b,c, respectively, and were used for this case study.
According to the new regulations from the government agency in charge of local diesel prices, Petroecuador, the price of diesel was at USD 0.462 per liter. In addition, the parameters of the different equipment connected to the grid are provided in
Table 1.
6. Results
This section analyzes the different scenarios: at first, a system fully energized by diesel generators was considered; then, it was hybridized with PV panels; and finally, it was also further hybridized with batteries to form a DG-PV-BAT hybrid system. All the results were simulated in a computer with a Core I7-7500U 2.7 GHz, 16 GB RAM, and a dedicated card—AMD Radeon R7 M440 4 GB—obtaining a response time of around 0.265 ms per iteration. In order to achieve this fast simulation speed, the algorithm was improved by finding better processes to achieve the results and optimizing the number of particles to become small enough to have a high simulation speed but large enough to ensure that the solution space could be properly investigated.
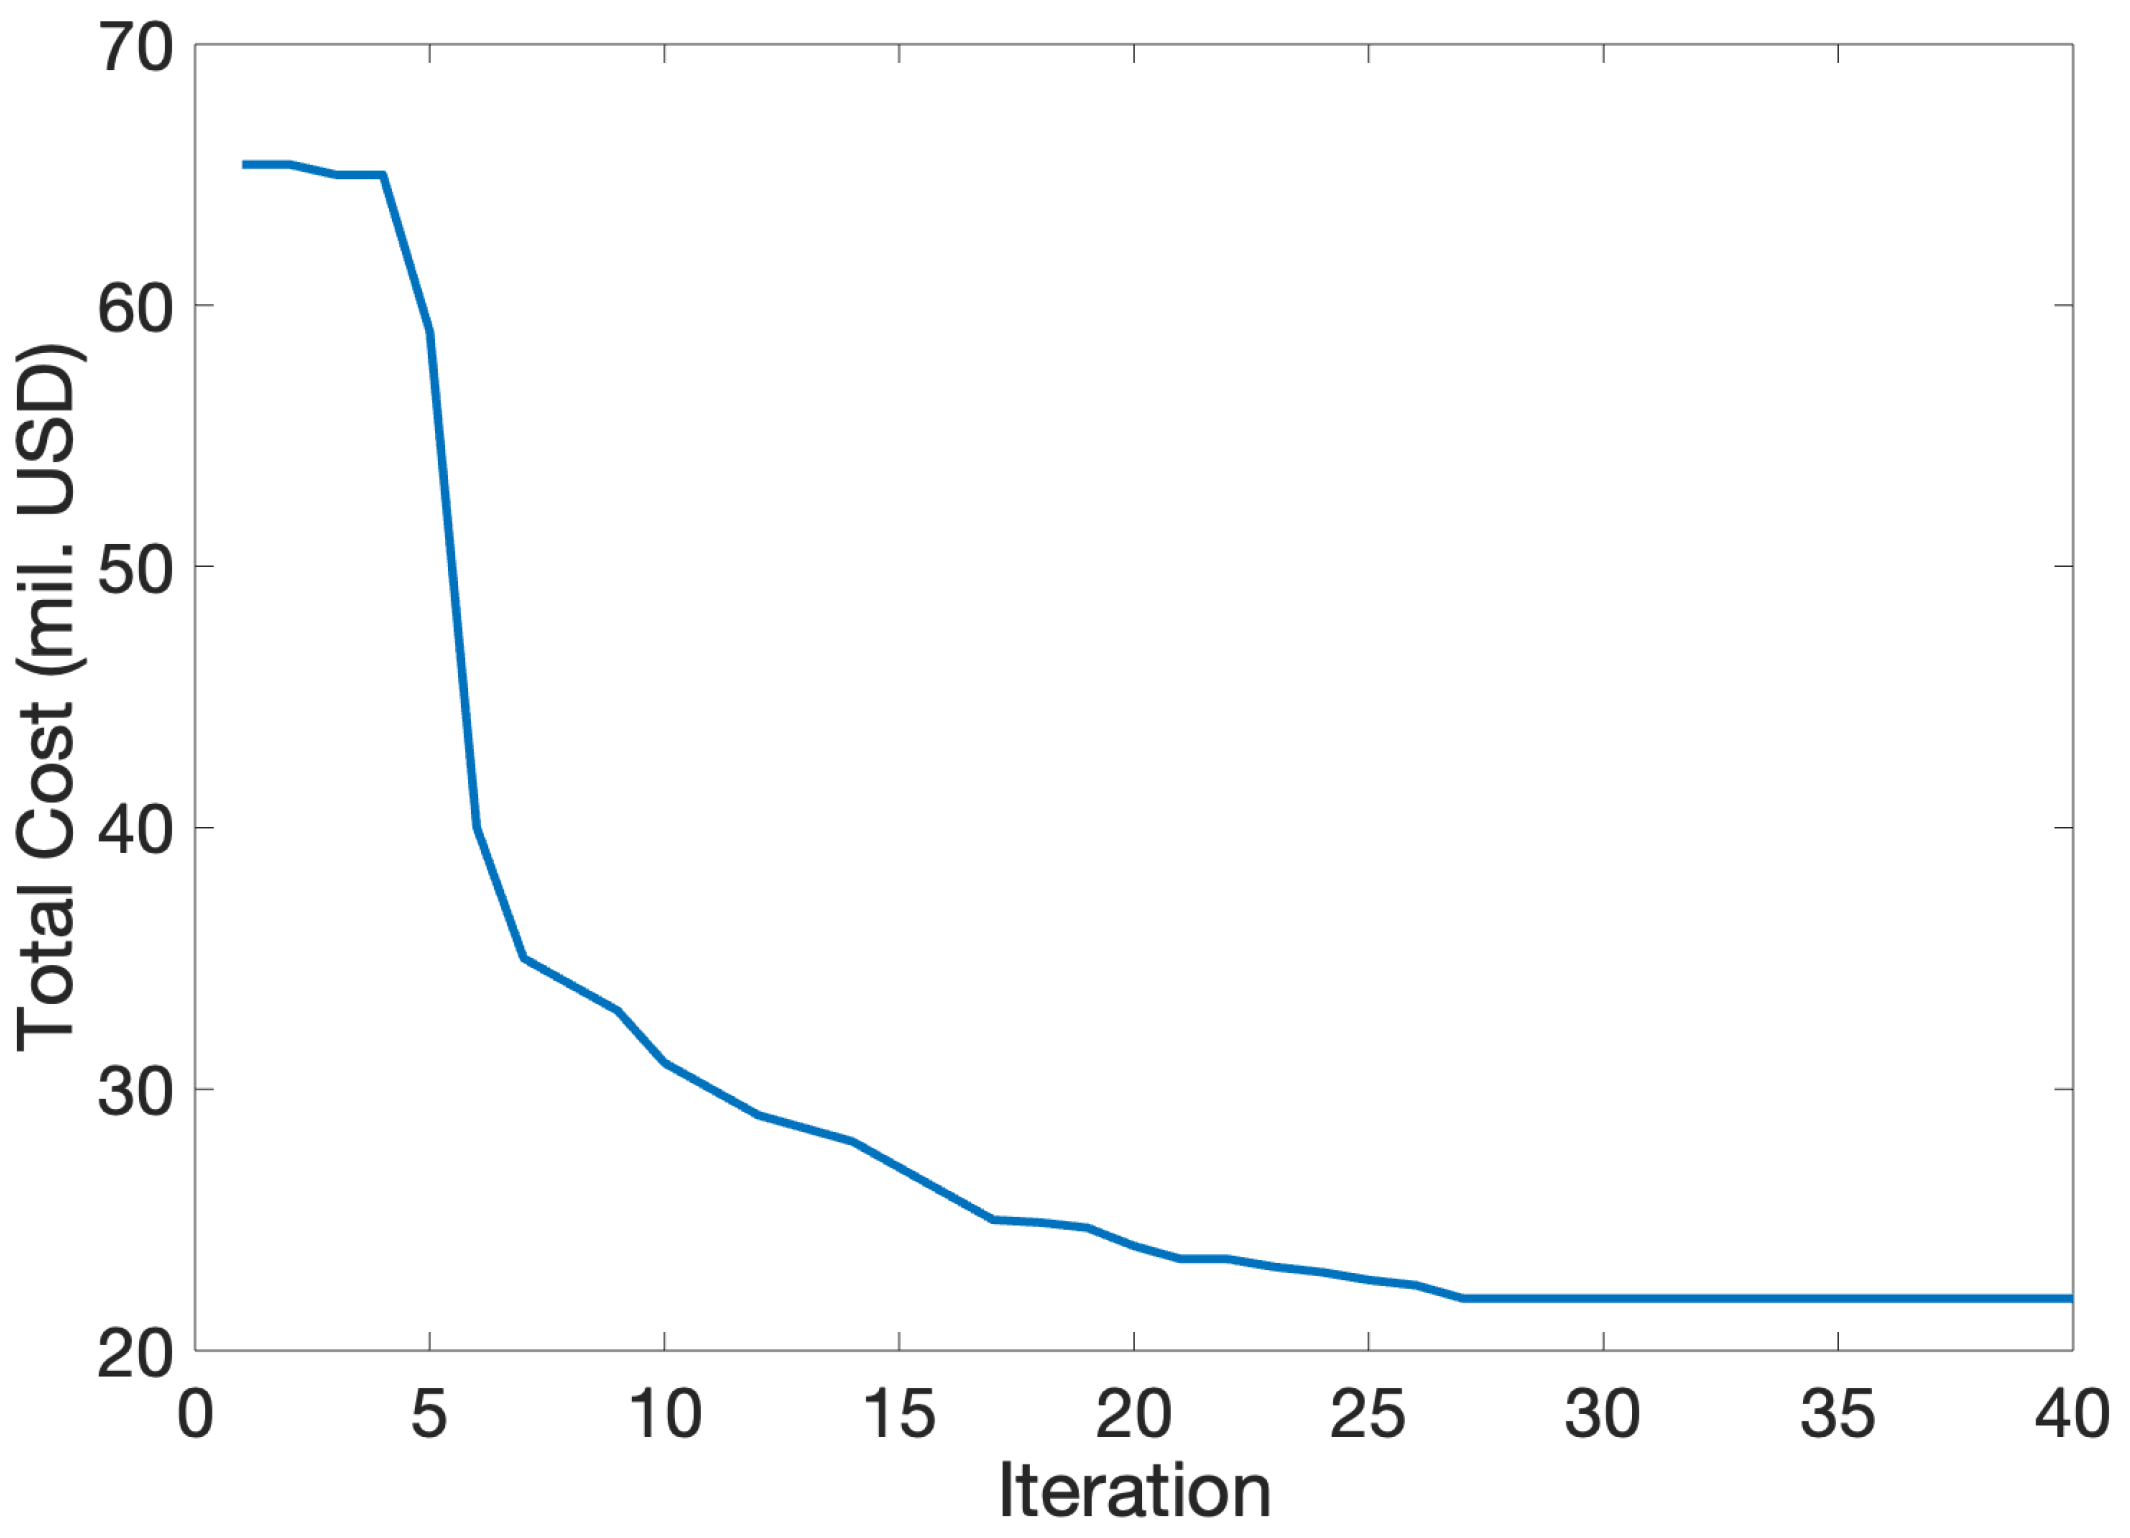
Figure 3 presents the evolution of the PSO algorithm after each iteration with respect to the optimal reduction in the overall DG-PV-BAT hybrid system’s cost. It can be observed that after the 25th iteration, it converges to a total system cost value of USD 21 million. This highlights that the PSO algorithm does not require an infinite number of iterations to achieve the optimal solution, subject to system complexity. This was achieved owing to the constants defined in the optimization algorithm as well as the defined population size. It is also advisable to modify the population size and maximum iteration number by performing extra simulations in order to have a stronger level of confidence on the obtained results.
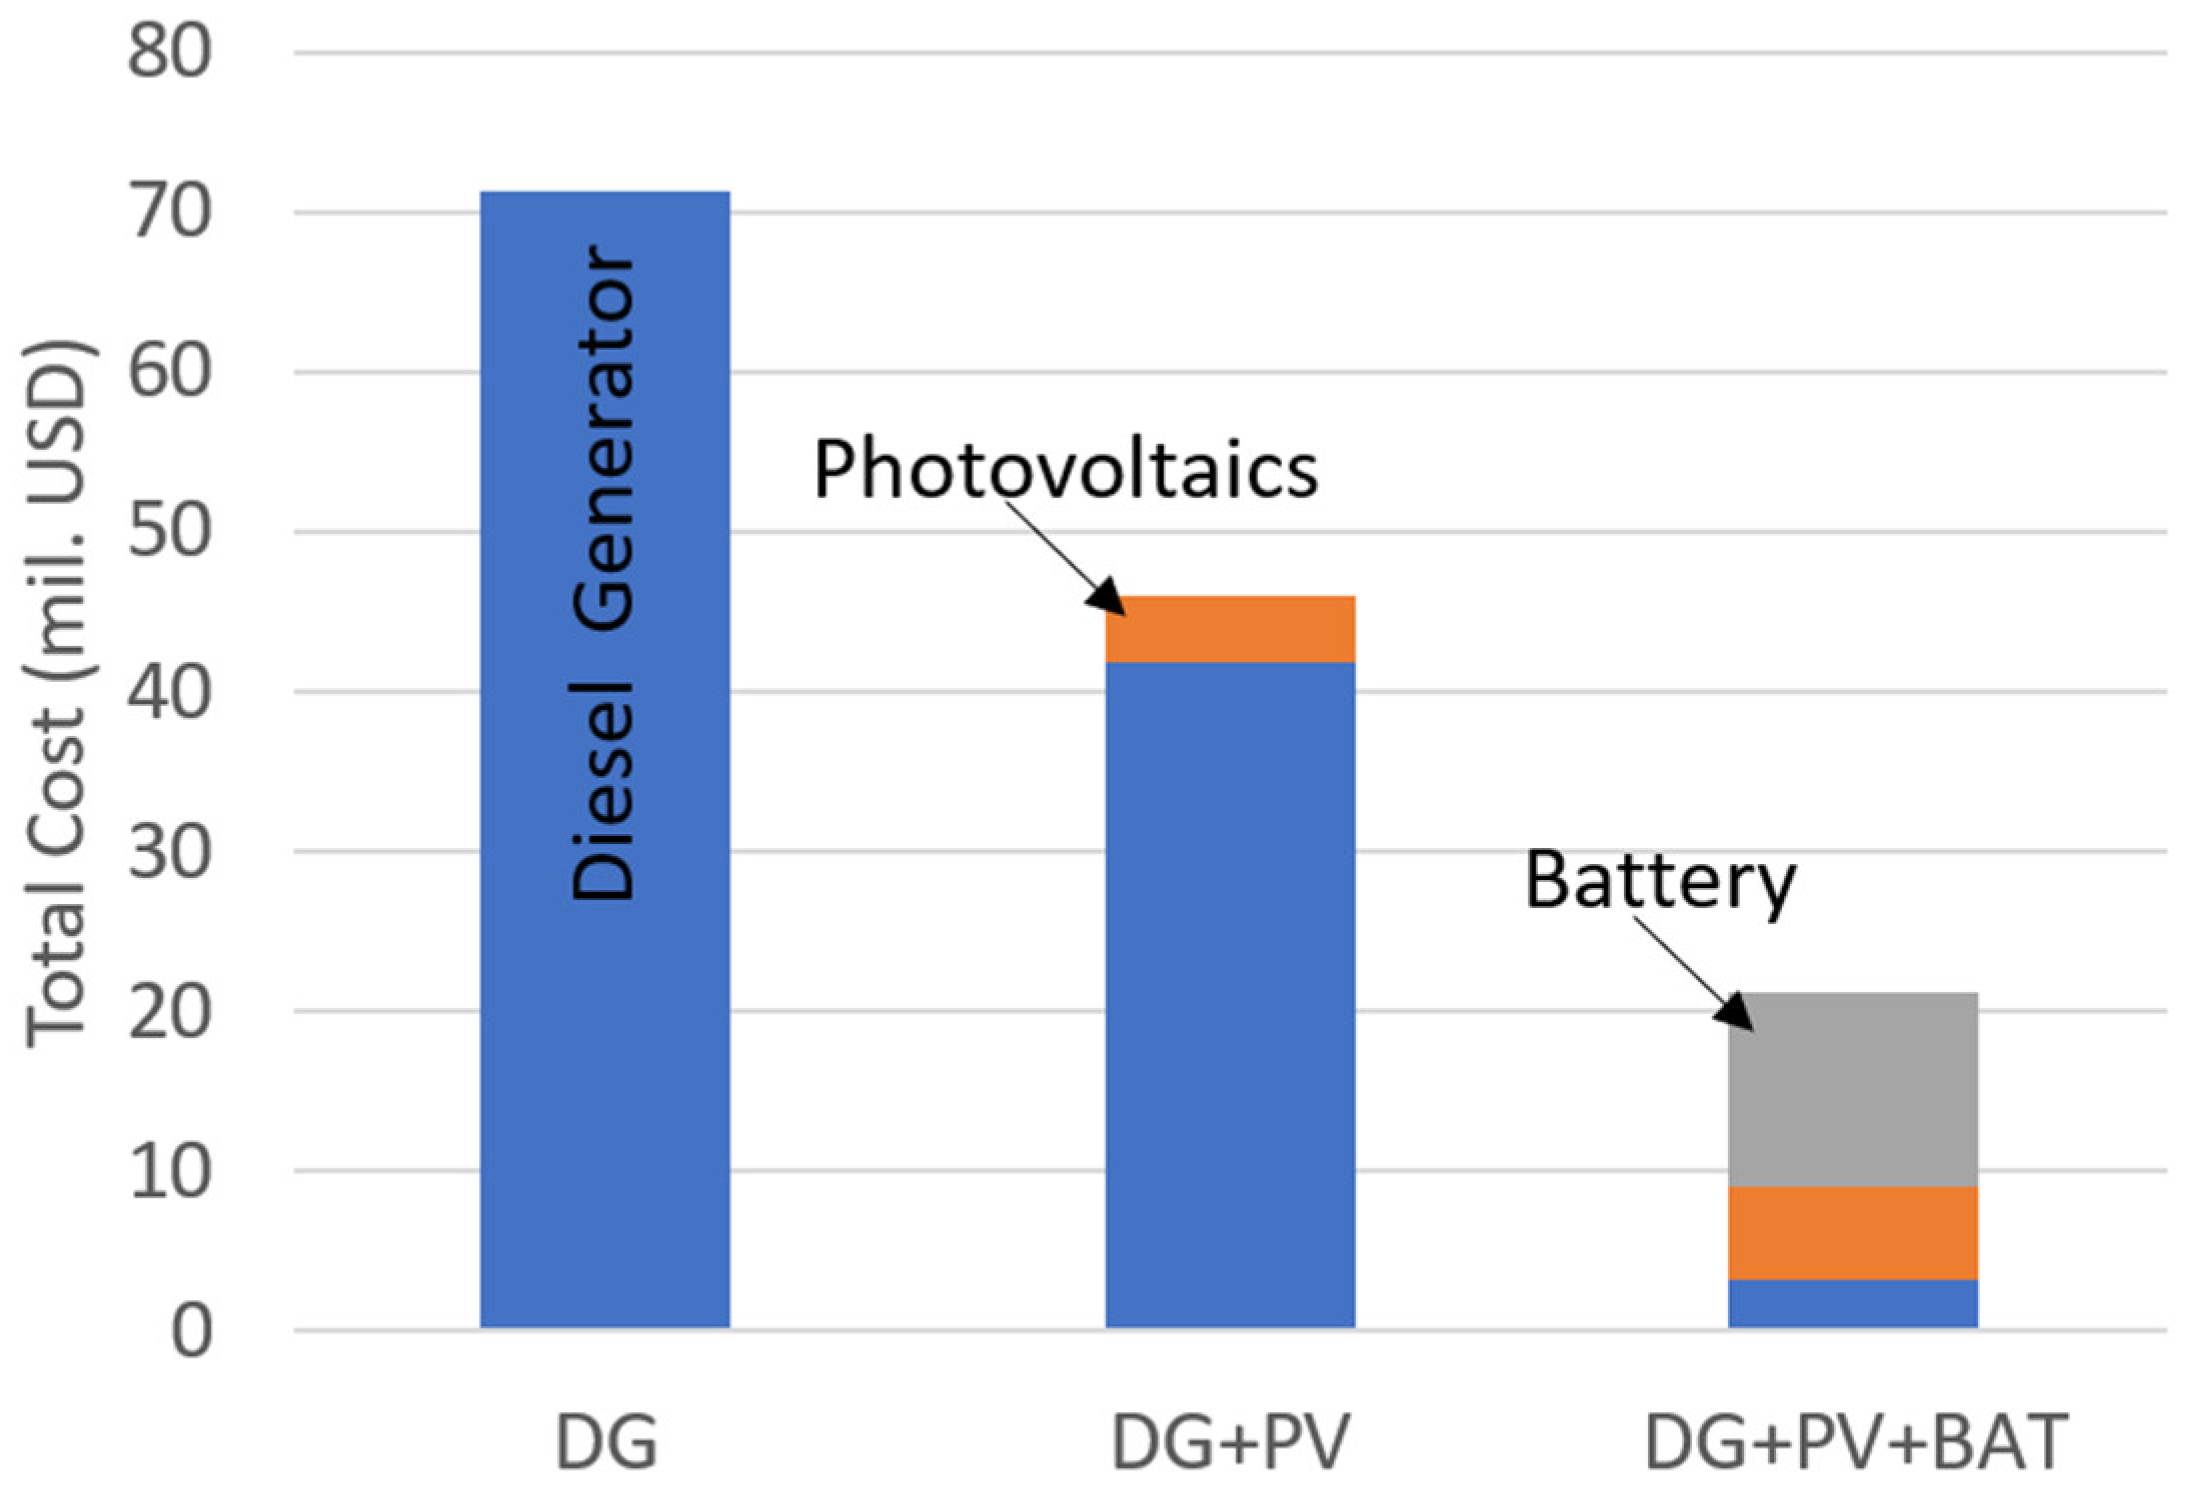
The total costs for each of the analyzed systems is provided in
Figure 4. Here, it can be seen that for the DG-PV system, DG-related costs comprise 90% of the total cost while PV-related ones comprise only 10%. For the DG-PV-BAT system, the costs are composed of 16% DG-related costs, 28% PV-related costs, and 56% battery-related costs.
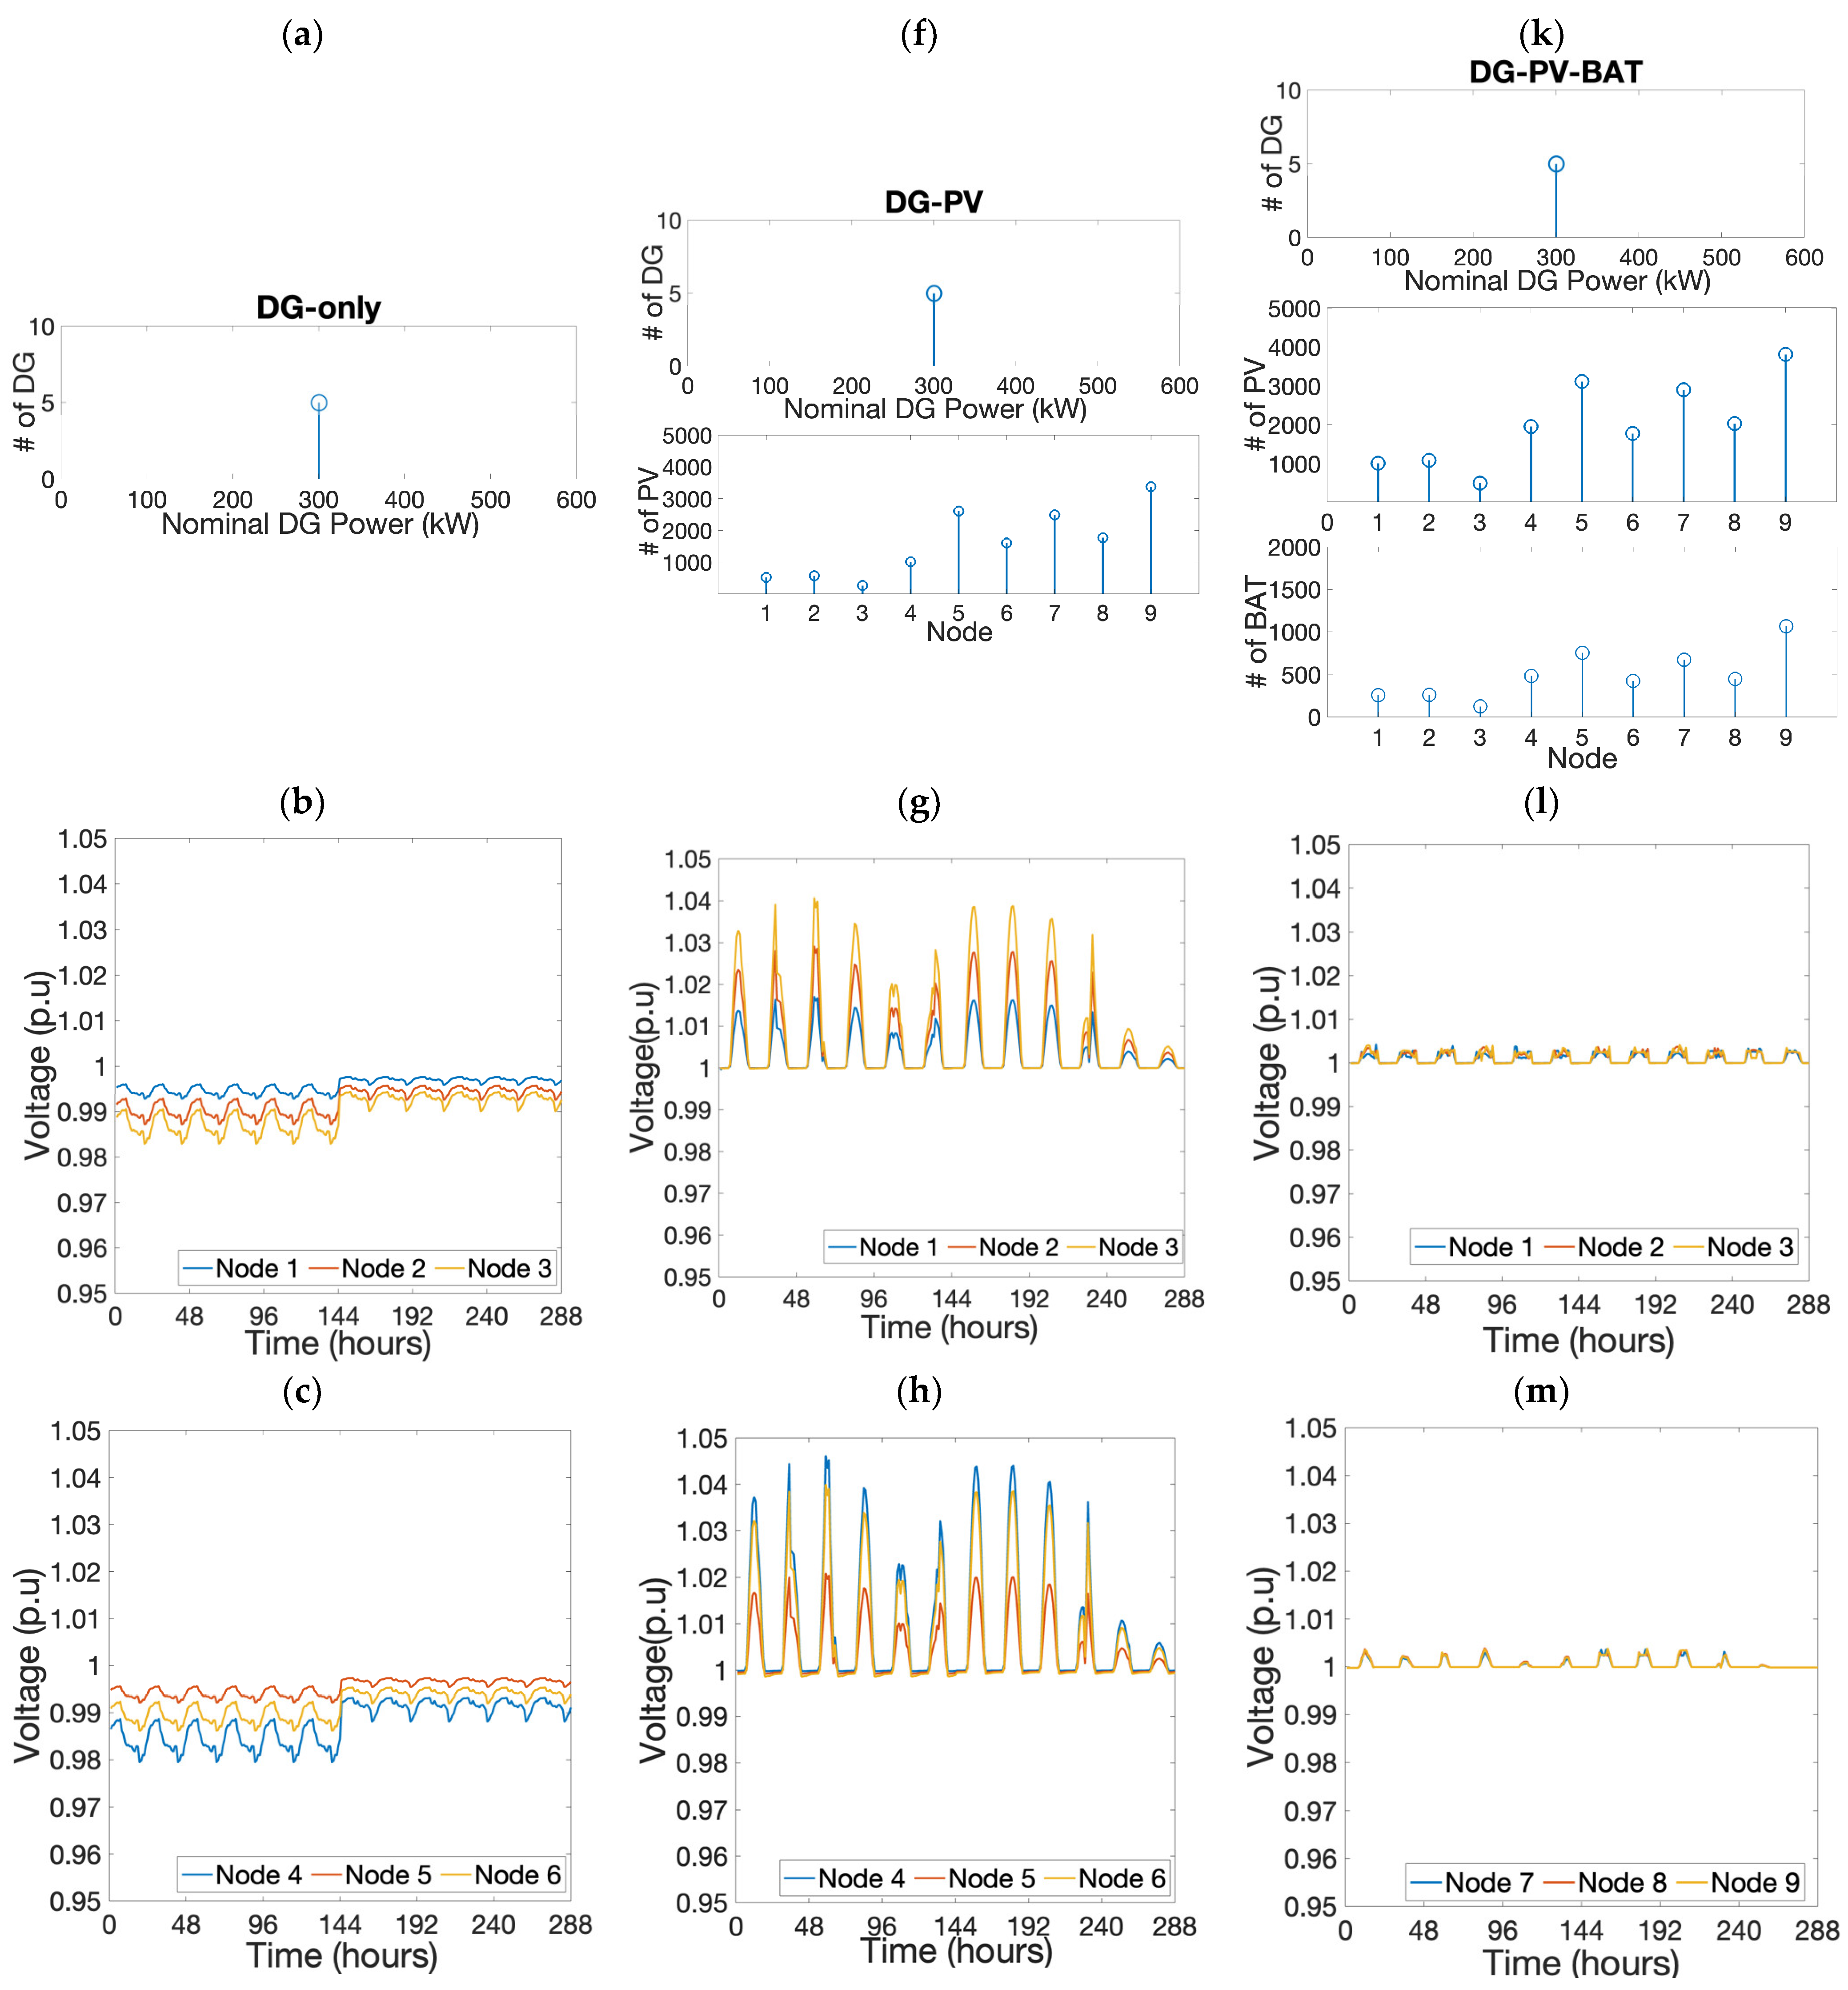
6.1. DG Only
Figure 5a presents the results of the system composed of only DGs, with a total nominal power of 1500 kW, to guarantee that the load demand is always met.
Figure 5b shows the voltage profile for each node for a DG-only system considering a day of 24 h per month as there were only two load demands assumed in this study: high and low, as mentioned in
Section 5. The voltage variations depend on the load demand: during the hours when the load demand is high, the grid voltage reduces to below 1 p.u.
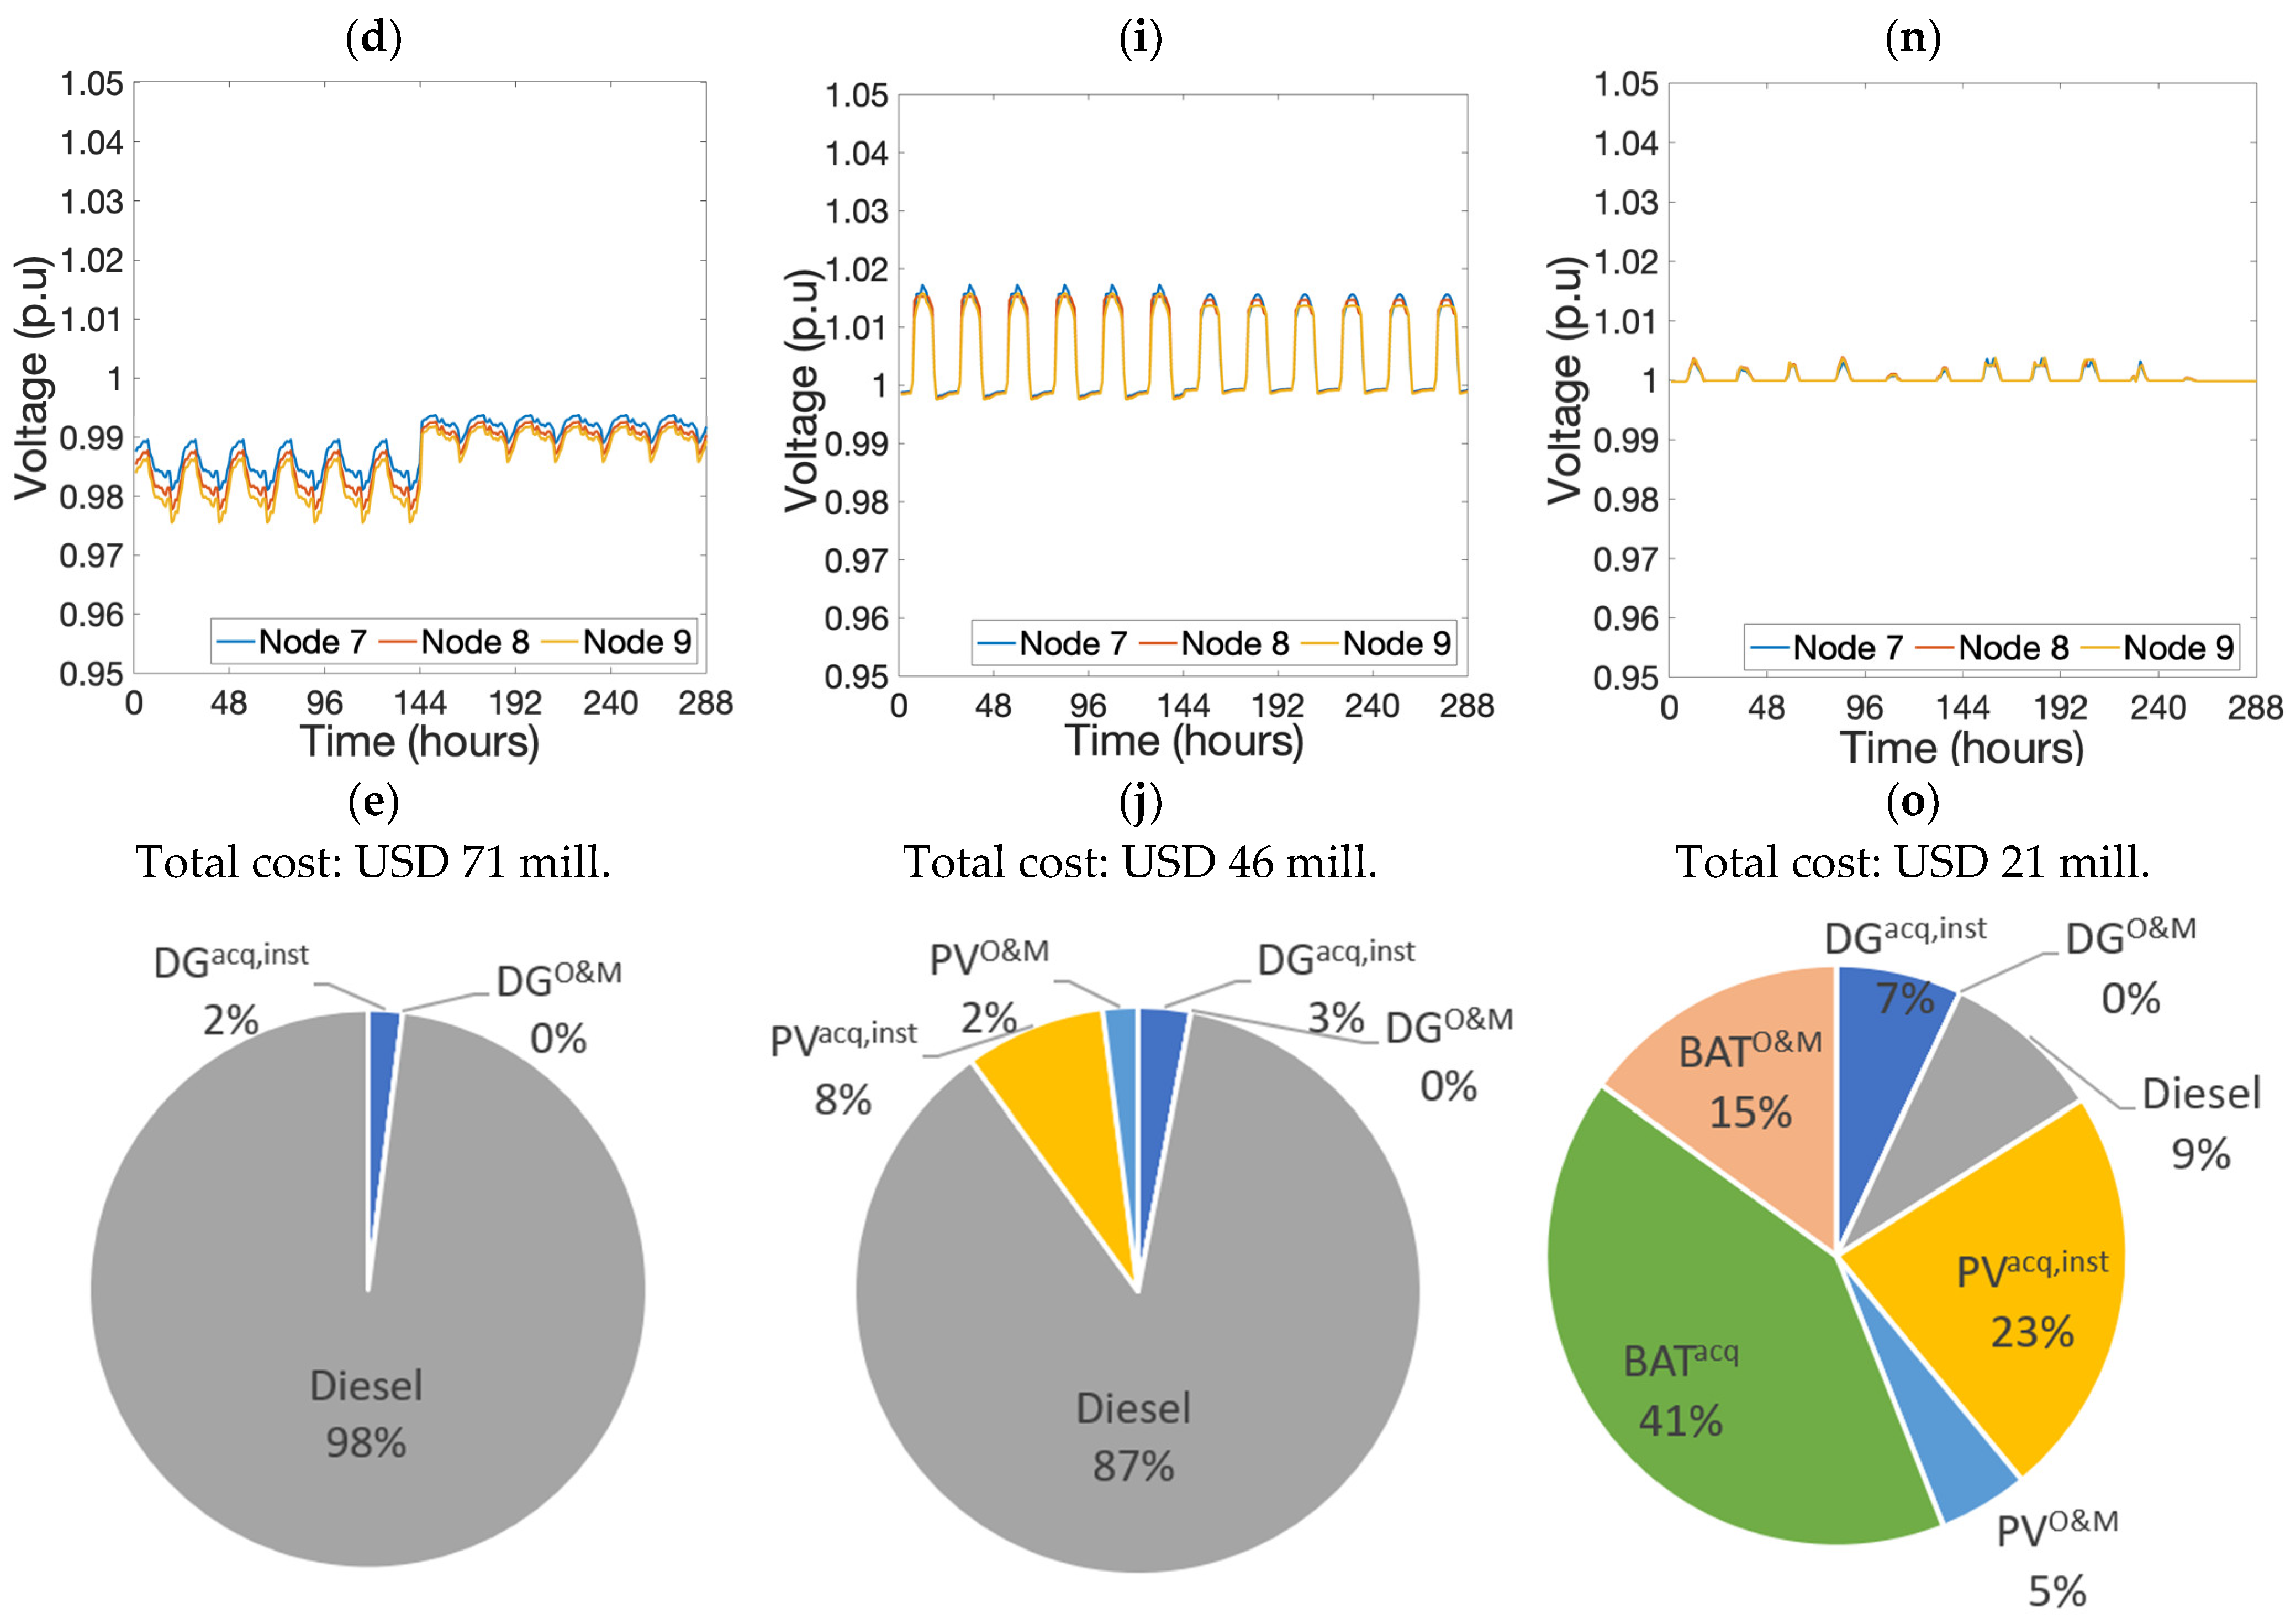
The total cost of this system during its 25-year lifetime is USD 71 million, and its cost distribution is presented in
Figure 5e. This figure shows that 98% of the overall cost is due to the diesel consumption while the remaining percentage is due to the acquisition, installation, and O&M costs.
6.2. DG-PV
This configuration includes DGs and PV panels and is shown in
Figure 5d. The numbers of diesel generators and solar panels were selected to reduce the diesel consumption in comparison to the previous system. As a result, a total of 14,199 panels are ideally required to optimize this system design among the nine nodes to generate an installation capacity of 4.615 MWp. As it was assumed that each solar panel covered an area of 1.7 m
2, this results in a total required area of 2.4 hectares for the PV panels.
The voltage for each node is provided in
Figure 5g–i. Here, it is observed that during the hours without solar irradiance, especially during the nighttime, the grid voltage is reduced to values close to 1 p.u. This is because the DG-PV system matches the voltage profile of the DG-only system during the nighttime. During the daytime, the solar panels provide power to the grid, resulting in an increase in the grid voltage values, which do not go beyond 1.01 p.u. and are within acceptable limits.
For this system, as indicated in
Figure 5j, its total cost is USD 46 million, which is mostly split as follows: the diesel consumption accounts for 87% of total costs, and the rest accounts for the acquisition, installation, and O&M costs for the solar panels and diesel generators.
6.3. DG-PV-BAT
The optimization result for the DG-PV-BAT system is provided in
Figure 5k. The same number of DGs are kept operating together with a total of 18,171 solar panels (5.905 MWp installation capacity) occupying an area of around 3.09 hectares, with 4477 batteries (17.191 MWh installation capacity) located among the different nodes.
Unlike the DG-PV system, more solar panels are required for the DG-PV-BAT configuration, as the batteries are able to store the extra energy produced by the solar panels, which can then be used when these panels do not produce enough electrical power due to low irradiance. As a consequence, the voltage at each node does not experience high variations, as seen in
Figure 5l–n.
The total cost for this system confirms that this is the best configuration with respect to the previous systems, as it achieves the lowest overall cost of USD 21 million. Its cost distribution is presented in
Figure 5o. The diesel cost represents 9% of the overall costs while the solar panels take 28% of the costs. The batteries have the highest cost percentage of 56%; the largest component is the battery acquisition cost of 41%. This system further confirms that the investment cost of the batteries is higher than that of diesel, as it is more economical to generate electricity via batteries than via DGs.
The optimal designs for each system are provided in
Table 2.
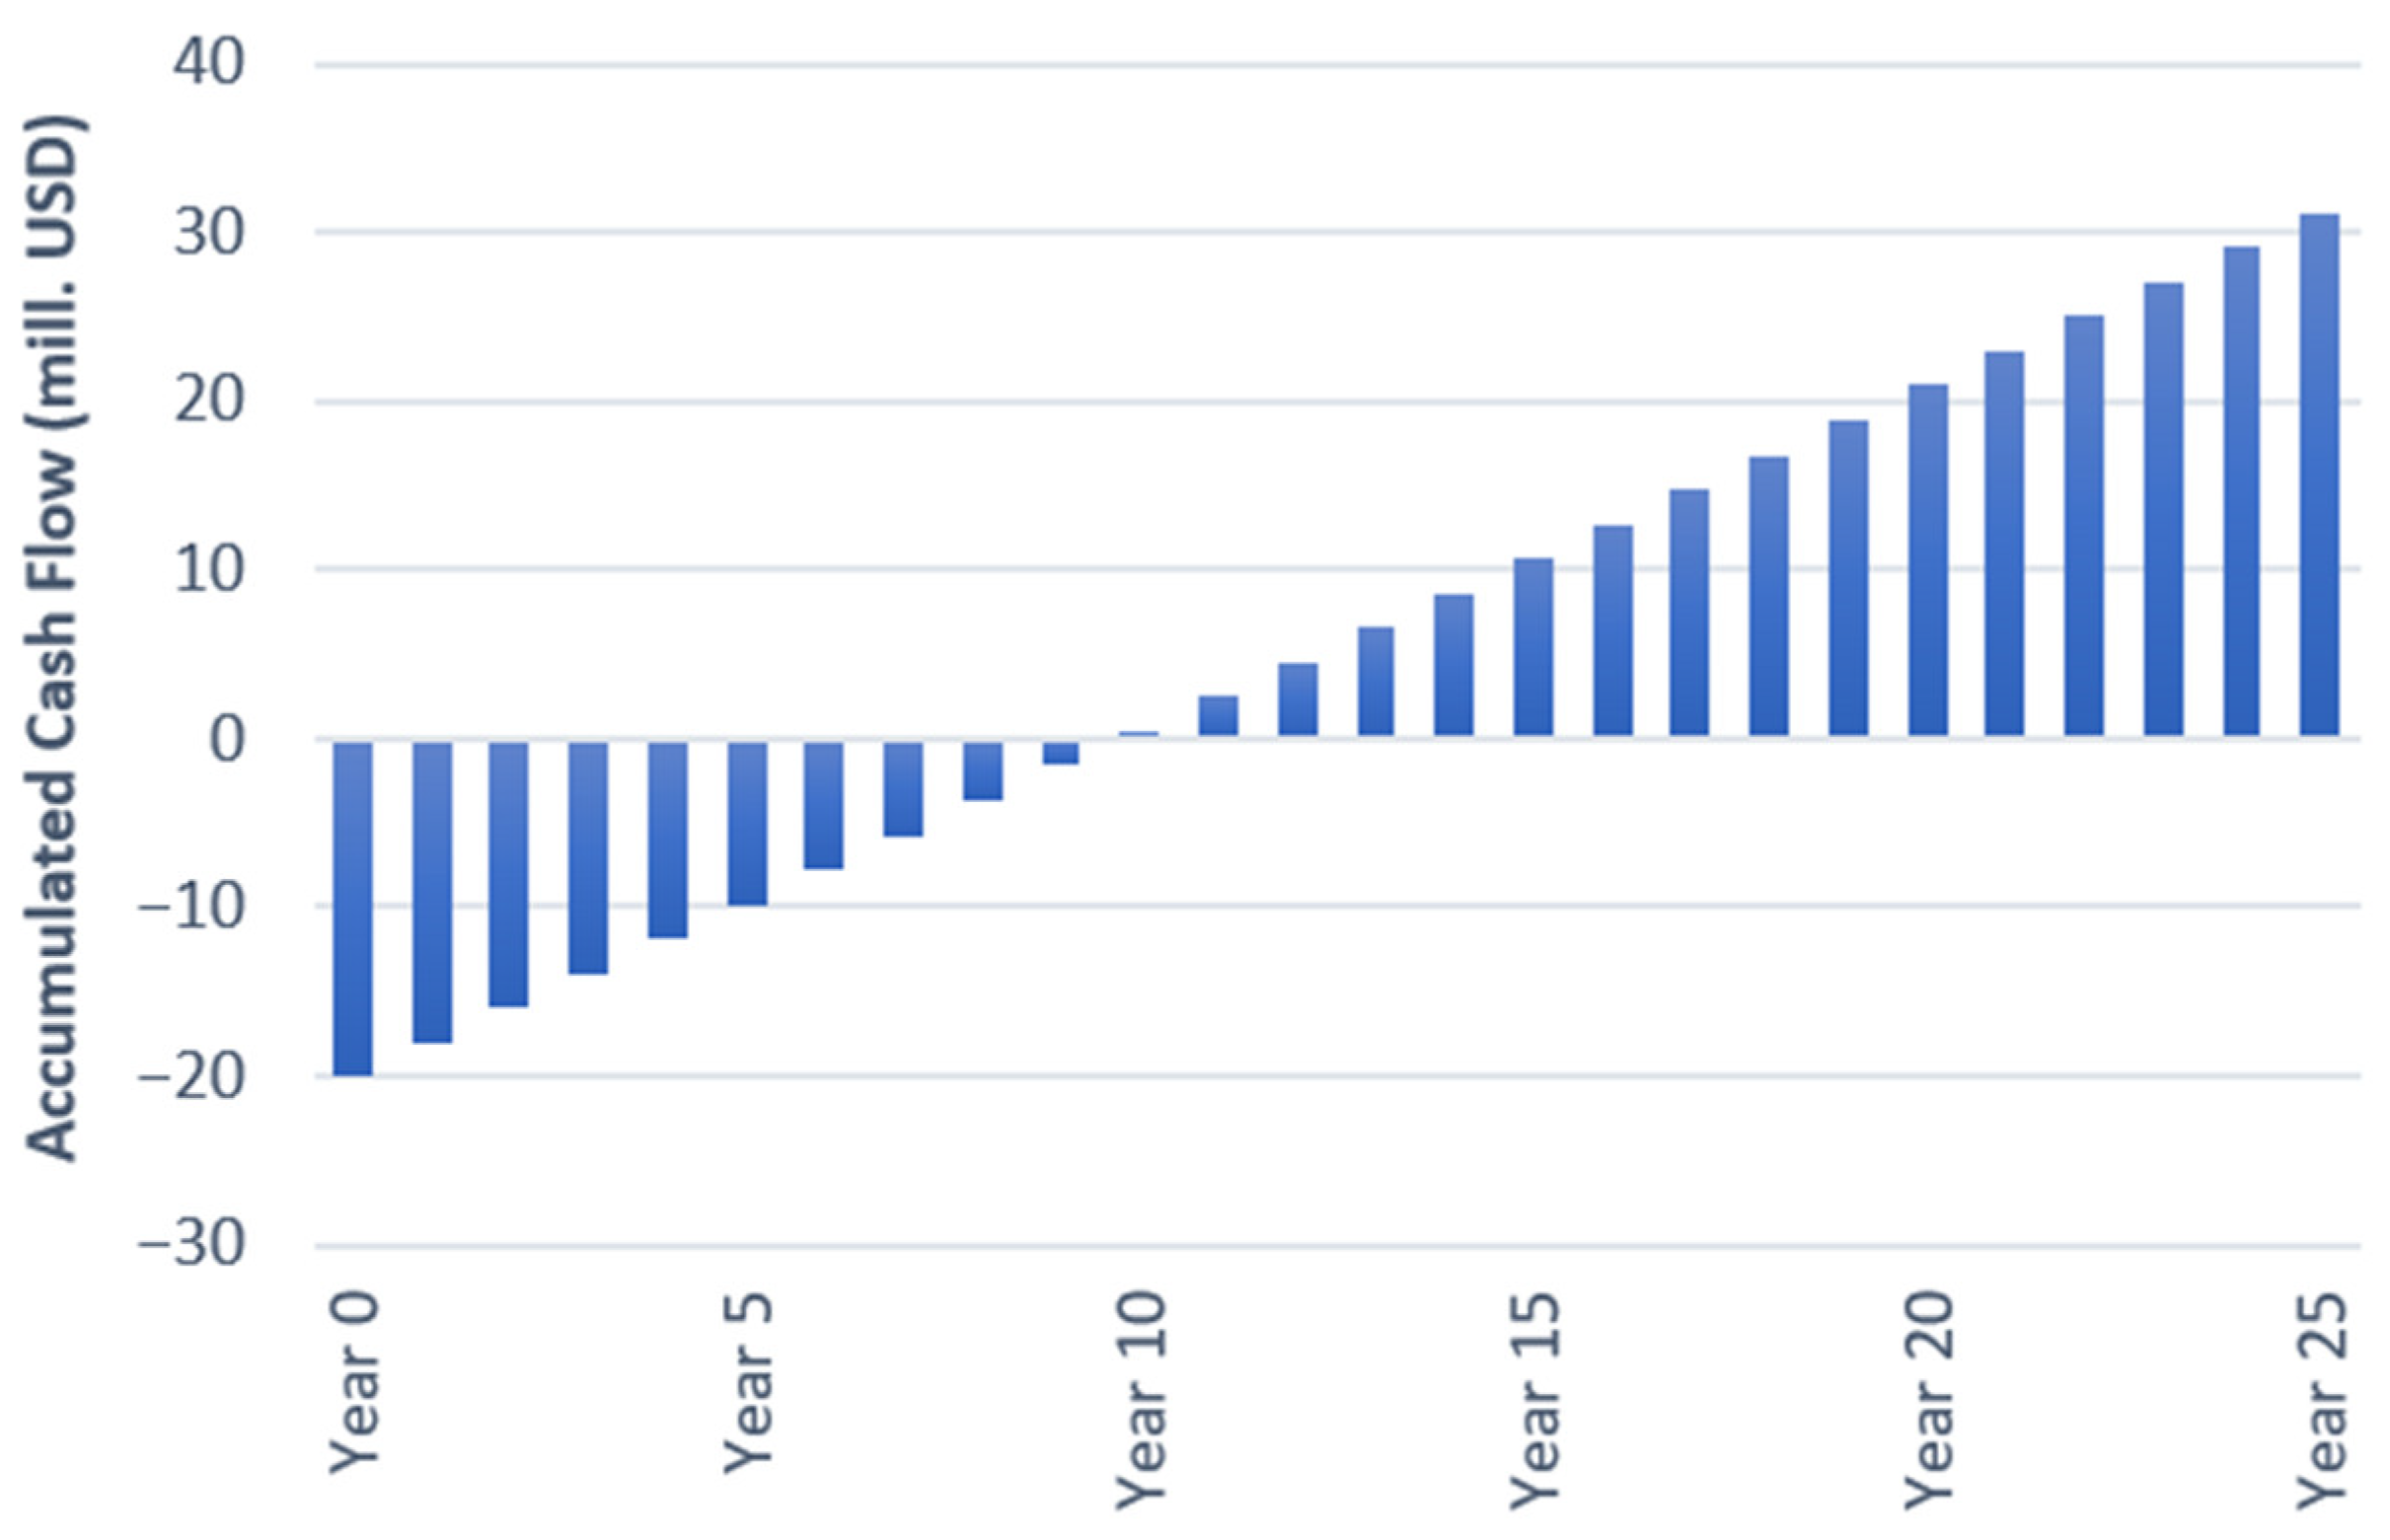
Figure 6 presents the accumulated cash flow for the DG-PV-BAT system. Although this system requires an initial investment of USD 21 million, this will be paid back after 10 years of operation in comparison to the original DG-only system. Then, for the following years, the hybrid system will produce financial profits and will accumulate a total of USD 31 million profits after 25 years of operation.
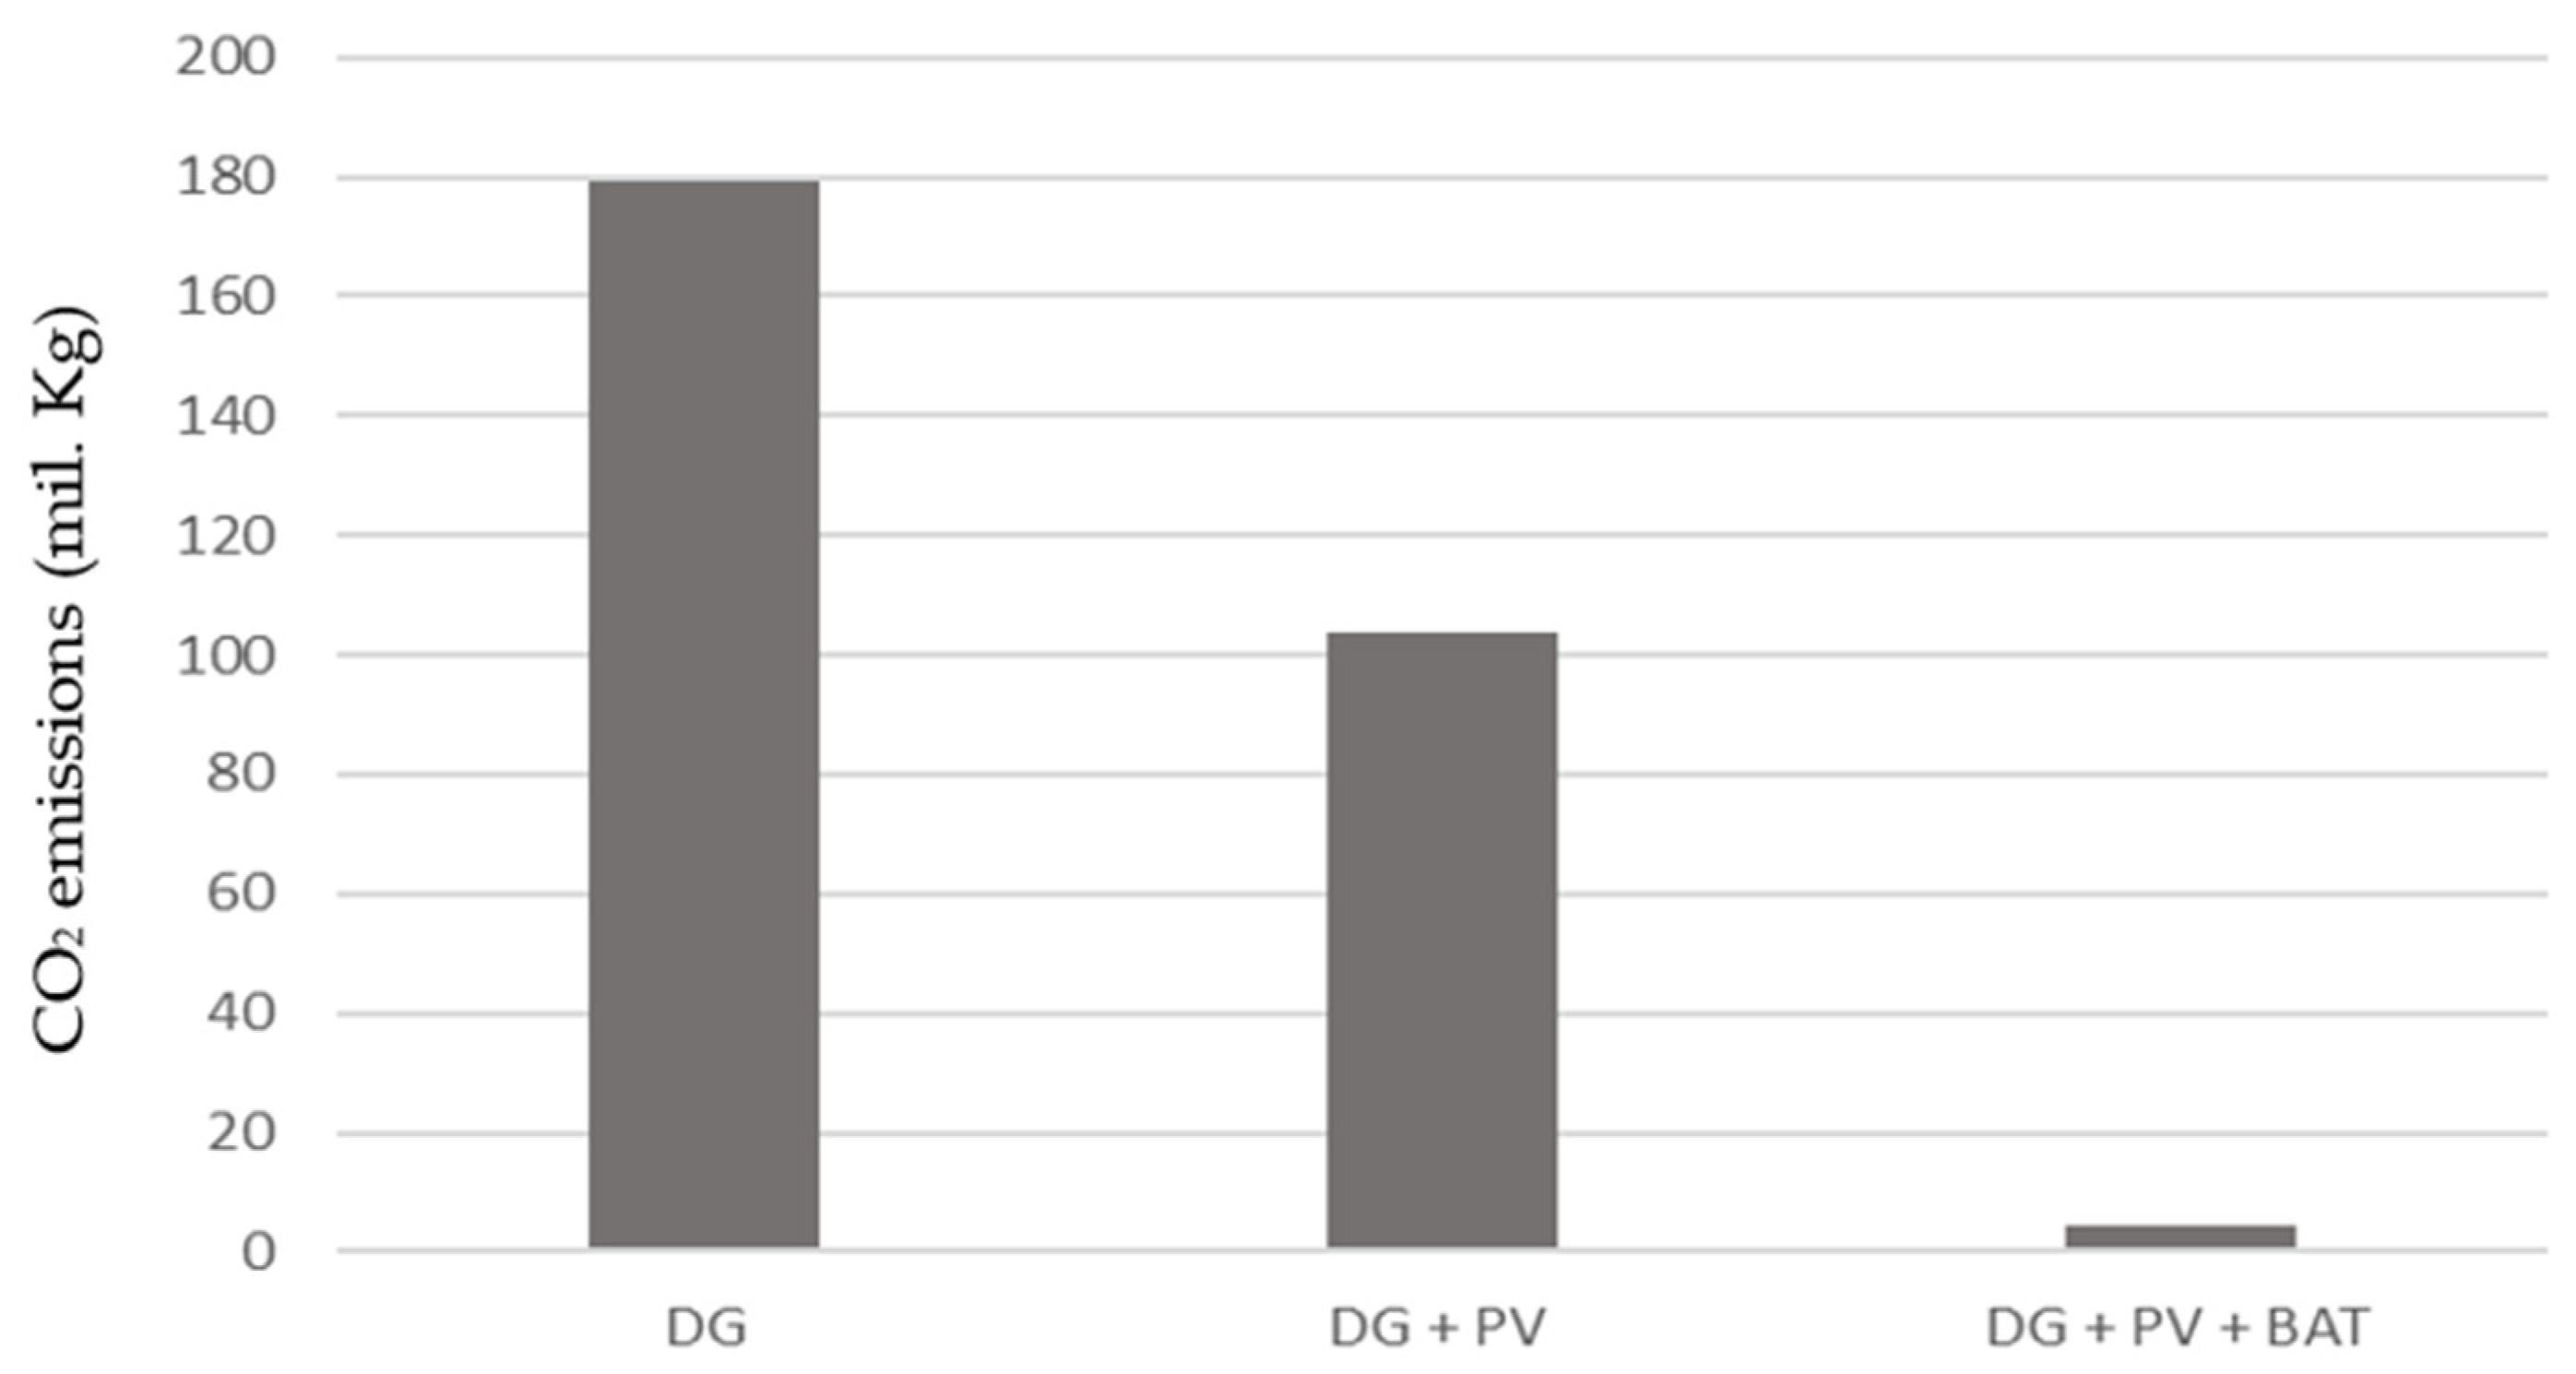
Figure 7 then provides the overall CO
2 emissions during the system’s lifetime for the different configurations due to the diesel consumption. It is assumed that 2.67 kg of CO
2 is produced per liter of diesel consumed [
23]. This figure shows that by increasing the degree of hybridization by adding other energy sources besides diesel, these emissions can be considerably reduced, thus becoming more environmentally friendly.
This study shows that the main parameters which affect the energy production of the PV system are the irradiance and module efficiency. Furthermore, the main PV cost factor is the cost of the solar panels (as seen in
Table 1). Yet, by adding batteries, this cost can be significantly reduced as seen in
Figure 5o.
7. Conclusions
By applying a metaheuristic optimization algorithm such as PSO, the lowest system cost was obtained for the three defined scenarios in this study: the first consists only of diesel generators and reaches a total cost of USD 71 million; the second scenario combines diesel generators and solar panels and achieves an overall cost of USD 46 million; and finally, the third scenario with a DG-PV-BAT hybrid system incurs the lowest cost of USD 21 million throughout its 25-year lifetime. This translates to a cost reduction of 71% and 56% of the third scenario with respect to the first and second one, respectively. Not only economic savings are achieved by hybridizing the system but also a reduction in the environmental impact as the CO2 emissions are reduced by 98% and 96% with respect to the first and second scenario, respectively. The electrical grid quality is also improved after hybridizing the system with the addition of solar panels and batteries, as extra electrical energy can be produced closer to the load demand.
Although this research shows advantages by hybridizing standard DG-only systems, further studies are still required. Future research should be conducted to add more constraints and more accurate mathematical models for the equipment and electrical system. In addition, a more detailed economic study is needed to optimize the system design based on the progressive addition of solar panels and batteries with time. Another point to consider is to study the outcome based on different PV technologies such as perovskite and dye-sensitized solar cells, among others [
24].


 ,
, 


