Abstract
The inverse Ising model is used in computational neuroscience to infer probability distributions of the synchronous activity of large neuronal populations. This method allows for finding the Boltzmann distribution with single neuron biases and pairwise interactions that maximize the entropy and reproduce the empirical statistics of the recorded neuronal activity. Here, we apply this strategy to large populations of retinal output neurons (ganglion cells) of different types, stimulated by multiple visual stimuli with their own statistics. The activity of retinal output neurons is driven by both the inputs from upstream neurons, which encode the visual information and reflect stimulus statistics, and the recurrent connections, which induce network effects. We first apply the standard inverse Ising model approach and show that it accounts well for the system’s collective behavior when the input visual stimulus has short-ranged spatial correlations but fails for long-ranged ones. This happens because stimuli with long-ranged spatial correlations synchronize the activity of neurons over long distances. This effect cannot be accounted for by pairwise interactions, and so by the pairwise Ising model. To solve this issue, we apply a previously proposed framework that includes a temporal dependence in the single neurons biases to model how neurons are driven in time by the stimulus. Thanks to this addition, the stimulus effects are taken into account by the biases, and the pairwise interactions allow for the characterization of the network effect in the population activity and for reproducing the structure of the recurrent functional connections in the retinal architecture. In particular, the inferred interactions are strong and positive only for nearby neurons of the same type. Inter-type connections are instead small and slightly negative. Therefore, the retinal architecture splits into weakly interacting subpopulations composed of strongly interacting neurons. Overall, this temporal framework fixes the problems of the standard, static, inverse Ising model and accounts for the system’s collective behavior, for stimuli with either short or long-range correlations.
The inverse Ising model (IM) is a modeling strategy to infer Boltzmann distribution with pairwise interactions from data. In systems biology, it has been applied to model the behavior of large systems with many units that interact one with another, ranging from neuronal ensembles in both early sensory systems [1,2,3,4], to cortex [5,6,7,8,9,10] and neuronal cultures [1,11], proteins [12,13,14,15], antibodies [16] and even flocks of birds [17]. To better understand the effectiveness of the inverse IM in modeling biological data, empirical benchmarks [18] and several theoretical investigations [19,20,21,22] have also been performed.
The inverse IM approach neglects any temporal evolution of the system and assumes that its activity can be described as a stationary state [1]. Although this simplification works well in many practical applications, it cannot lead to a satisfying model when the system is strongly driven by external stimuli [4,10,23,24]. In this study, we consider the activity of retinal output neurons in response to visual stimuli with different statistics and show that the inverse IM approach fails in accounting for the empirical statistics when the stimulus has strong and long-ranging correlations. To solve this issue, the inverse IM framework has been extended to include the effects of time-varying external stimuli into the activity of the retinal output neurons [23]. More recently [4,25], this time-dependent framework has been empowered by focusing on a population of retinal neurons of the same type. Here, we perform a step further and consider the case of a population of neurons of two different types, subject to two external stimuli with very different statistics. Then, in accordance with previous results [4], we show that the temporal framework also provides a very effective model when the visual stimulus has strong and long-ranged correlations.
We conclude our work by analyzing the properties of the inferred functional interactions between retinal neurons. Neurons of the same type are evenly spaced over a two-dimensional triangular lattice, forming regular mosaics [26]. The inferred interactions are strong and positive only for nearby neurons of the same type, whereas distant neurons do not interact directly. Connections between neurons of a different type are instead small (or sometimes slightly negative), as they are for nearby cells . Therefore, the retinal architecture splits into weakly interacting subpopulations of strongly interacting neurons.
1. Recording of Retinal Ganglion Cells
We focus on the activity of two populations of 18 ON and 25 OFF rat retinal output neurons (known as ganglion cells) [27], recorded during one ex-vivo multi-electrode array experiment [28]. These experiments allow one to measure the times at which each neuron emits a spike in response to an ongoing visual stimulation. ON and OFF neurons have opposite polarities, meaning that they respond preferentially to, respectively, an increase or decrease of light intensity [26]. Additionally, thanks to standard techniques [28], it is possible to locate the position of each neuron within the two-dimensional retinal output layer (Figure 1A). To validate our results, we also consider a second experiment where 21 ON and 32 OFF retinal output neurons were stimulated with the same videos.
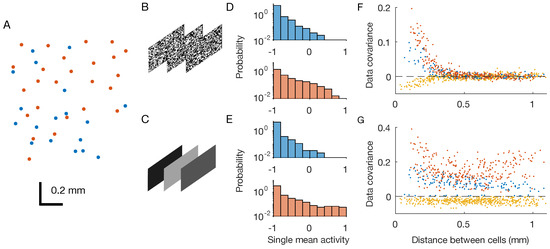
Figure 1.
Retinal multi-electrode array experiments. OFF neurons and OFF–OFF pairs are in red, ON and ON–ON pairs are in blue, and OFF–ON pairs in yellow. (A) Physical positions of the recorded neurons within the two-dimensional retinal output layer. Each dot correspond to a neuron. (B,C) Two considered stimuli are checkerboard and full-field flicker. (D,E) Distribution of single neuron mean activities. (F,G) Pairwise covariances as a function of the physical distance between the neurons.
During the experiments, the retina was stimulated by two different black-and-white videos repeated multiple times (Figure 1B,C): a white-noise checkerboard stimulus with strong but short-ranged spatial correlations, and a full-field video whose luminosity flickers over different grey values, i.e., with strong spatial correlations that extend over the entire scene.
After binning the spiking activity with small windows of t = 20 ms, we can associate to each neuron i in each time-bin t during repetition r a binary variable equal to if the neuron spiked in the time-bin or if not. Thanks to this preprocessing, we end up with a sequence of snapshots of neuronal activity , which can be seen as observations of system configurations. At first, we estimated each neuron’s mean activity, that is, the average of over the recordings. Mean activities in response to the two stimuli were very similar (Figure 1D,E), for both type of neurons. However, covariances were different across stimuli: the checkerboard induced strong, short-ranged correlations, whereas the full field induced strong correlations over longer distances (Figure 1F,G).
2. Inverse Disordered Ising Model
In order to analyze the retinal spiking activity, Schneidman et al. [1] has proposed to consider the probability distribution of observing a given activity snapshot , regardless of the time at which it has been observed. As shown before (Figure 1F,G), neuronal activities show strong correlations, suggesting that neurons are not independent. Therefore, cannot be modelled as a collection of independent distributions; it requires an interacting model. For this scope, the principle of maximum entropy suggests it is necessary to consider all of the probability distributions reproducing the empirical mean of all of the single variable terms () and their pairwise products (), the covariances, to then select the one with the largest entropy. This leads to the construction of the well known pairwise disordered Ising model (IM) [1,29]:
with yet unknown biases h and couplings J, which have to be inferred from data. To estimate these parameters, we can compute the model (log-)likelihood over the dataset and search for the set of parameters that maximises it [29]. Additionally, in order to limit the noise effects, we added an regularization over the biases h and an regularization over the couplings J [29]. Finally, because the considered systems are too large for performing an exact inference, we used a pseudo-Newton Markov-chain Monte-Carlo algorithm [30].
As expected by model construction [29], the inferred distributions were able to reproduce the neurons’ mean activities and covariances (Figure 2A,B), showing that we solved the inference problem for both stimuli with high accuracy. Both biases (Figure 2C,D) and couplings (Figure 2E,F) inferred from the response to the two stimuli are different. In particular, for the checkerboard stimulus, which has short-ranged stimulus correlations, we observe strong positive or negative couplings only between nearby neurons, while couplings between distant ones are very small. For the full-field video, which instead has long-ranged stimulus correlations, we observe strong couplings, even at large distances. Overall, these results show that the inferred couplings depend on the correlation structure of the stimulus: by acting as correlated input to the neurons, the stimulus induces strong correlations among certain pairs of neurons and consequently strong couplings among them [4].
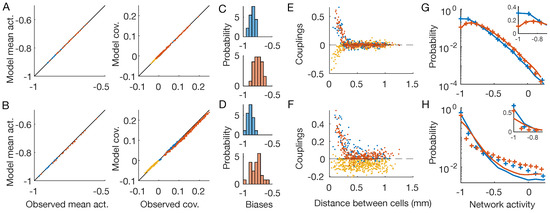
Figure 2.
Inverse disordered Ising model. OFF neurons and OFF–OFF pairs are in red, ON and ON–ON in blue, OFF–ON pairs in yellow. The first line shows the results for the checkerboard stimulus, the second for the full-field one (Figure 1B,C). (A,B) Inferred IM reproduces the neurons’ mean activities and covariances with high precision. (C,D) Distribution of the inferred biases h. (E,F) Inferred pairwise couplings J as a function of the physical distance between the neurons. (G,H) Empirical (plus signs) and model-predicted (lines) probability distributions of the network activity of the two neuronal populations. Inset: zoom in linear scale.
Lastly, we notice how the inferred inverse disordered IM is capable of predicting the empirical probability distribution of the network activity () for the checkerboard stimulus, but it fails to do so for the full-field flicker (Figure 2F,G). This distribution reflects the collective behavior of the whole system and therefore depends on the high-order statistics of the neuronal activities. As such, the pairwise structure of the checkerboard video, due to the short-ranged correlations, can be accounted for by a model with pairwise couplings. However, for the full-field flicker, the stimulus synchronizes the whole neuronal population altogether. As a consequence, the correlation’s structure is not pairwise and the pairwise inverse IM struggles to reproduce such higher-order neuronal statistics. A similar effect has been reported previously for the activity of cortical neurons during slow-wave sleep [10].
3. Time-Dependent Model
Instead of constructing a single probability distribution for the whole recording, in the time-dependent Ising model framework [4,23], we build a collection of probability distributions , one for each time-bin. Following the maximum entropy principle, we search for the probability distribution that has the maximum entropy among those that reproduce the mean single neuron activities in each time-bin , where r runs over the R repetitions of the stimulus. We also require that the model reproduces the total pairwise correlations computed over both time and repetitions, the same observables imposed for the inverse IM (Equation (1)). This leads us to the following model:
In model (2), the biases carry the temporal dependence that accounts for the time-evolution of the stimulus drive. However, because we have not asked the model to reproduce the pairwise correlations in each temporal window but only the averaged one, the couplings J are constant in time. This choice is biologically motivated: the couplings reflect the internal connections between neurons within the retinal architecture and therefore should be independent of the stimulus [4]. Additionally, this also limits the number of parameters avoiding the risk of overfitting. As in the inverse IM, we include an regularization on the biases and an on the couplings with the same strength.
As expected by model construction, the inferred time-dependent distributions reproduce the empirical mean activities and covariances (Figure 3A,B), showing that we solved the inference problem for both stimuli with high accuracy. As before (Figure 2C,D), the inferred biases show different distributions for the two stimuli (Figure 2C,D). The inferred couplings instead have much more similar behavior (Figure 3E,F), showing a fast decay with the distance between the neuron pairs, for both the checkerboard and the full-field stimulus. In particular, those between neurons of different types are zero or slightly negative, whereas those between nearby neurons of the same type are large and positive. Lastly, in the case of the time-dependent IM, the inferred model is capable of predicting the empirical probability distribution of the network activity for both stimuli with high accuracy (Figure 3G,H). Consistently with previous findings [4], these results show that by using time-dependent IM we are capable of disentangling the collective behaviors that arise because neurons receive correlated inputs, from those that are instead due to network effects.
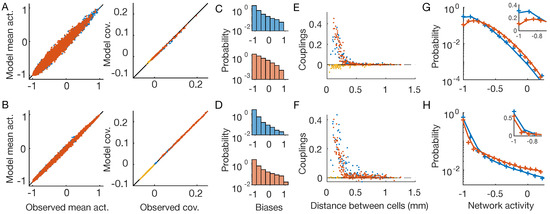
Figure 3.
Time-dependent Ising model. OFF neurons and OFF–OFF pairs are in red, ON and ON–ON in blue, and OFF–ON pairs in yellow. The first line show results for the checkerboard stimulus, the second for the full-field one (Figure 1B,C). (A,B) Inferred time-dependent IM reproduces the neurons’ mean activities and covariances with high precision. (C,D) Distribution of the inferred biases . (E,F) Inferred pairwise couplings J as a function of the physical distance between the neurons. (G,H) Empirical (plus signs) and model-predicted (lines) probability distributions of the network activity of the two neuron populations. Inset: zoom in linear scale.
4. The Geometry of the Functional Connectivity
The behavior of the inferred couplings with the distance from the response to the full-field stimulus (Figure 2F and Figure 3F) are very different. In the case of the inverse IM, the couplings are also strong for distant pairs and seem to reflect the correlation structure of the stimulus. In the case of the time-dependent IM, instead, interactions decrease fast with distance and seem not to reflect the correlation structure of the stimulus. To test for this, we compare the couplings inferred from the two stimuli (Figure 4A,B). In the case of the time-dependent IM, the couplings are indeed much more similar (Pearson correlation = 0.935, against = 0.699 for the inverse IM). We conclude that the inferred couplings of the time-dependent IM only reflect the functional connectivity between retinal output neurons.
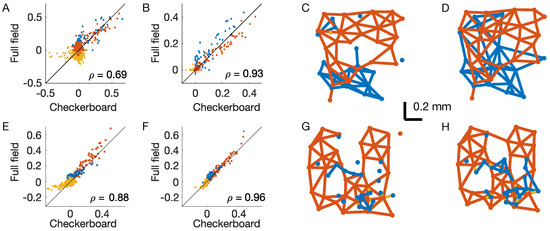
Figure 4.
Structure of the inferred couplings. OFF–OFF couplings are in red, ON–ON in blue, and OFF–ON in yellow. (A) Scatterplot of the inferred couplings for the two stimuli in the inverse IM. (B) As (A), but for the time-dependent IM. is the Pearson correlation. (C,D) Interaction lattice after thresholding the inferred couplings of the time-dependent IM for the checkerboard (C) and full-field stimuli (D). (E–H) the same as (A–D), but for a second example experiment where retinal neurons responded to the same visual stimulations.
Retinal output neurons lie on a two-dimensional layer, and their positions can easily be determined by standard methods as their receptive field centres [28] (Figure 1A). In order to better visualize the structure of the inferred couplings of the time-dependent IM, we can introduce an arbitrary but robust small threshold, set to zero for all the smaller couplings ( < 0.05), and draw an interaction lattice (Figure 4C,D). After thresholding, the lattice splits into two subcomponents, one for each type, with mostly nearest-neighbour interactions. Unfortunately, during these experiments, it is difficult to detect all of the neurons of a given type within the recorded retinal patch. Therefore, some neurons are missing, and this prevents a solid study of the lattice connectivity. However, given the well-known results on the retinal mosaics of the literature [26], and by looking at the most complete region of (Figure 4C,D), we expect that if we were able to record all of the neurons, the resulting lattice would be an irregular honeycomb, with connectivity equal to six. Inferred interactions are strong and positive only for nearby neurons of the same type (Figure 3E,F). Consequently, only couplings between nearby neurons are above the threshold, and the functional connectivity lattice shows the nearest neighbour interactions. Additionally, because inter-type connections are very small or slightly negative, the retinal architecture splits into weakly interacting subpopulations—each composed of strongly interacting neurons.
In order to corroborate these results, we have performed the same analysis on a second example dataset where retinal neurons were stimulated with the same visual stimulations (both checkerboard and full-field). The results are fully consistent and very similar to those of the first experiment (Figure 4E–H).
5. Conclusions
In this work, we focused on modeling the activity of two large populations of retinal output neurons of different types. We inferred two different models: the widely used disordered IM [1], and its more recent development, the time-dependent IM [4,23,25]. For each model, we compared the inferred parameters obtained from the retinal response to two very different visual stimulations: the checkerboard, with short spatial correlations, and the full-field with long ones. In particular, we showed that the inferred couplings of the disordered IM, but not those of the time-dependent IM, depend strongly on the stimulus statistics (Figure 4A,E against Figure 4B,F). Consistently, the inferred couplings of the second model are very similar across visual stimulations (Figure 4B,F). The time-dependent model is therefore capable of disentangling the collective behaviors induced by the correlated inputs to the retinal output neurons, from those arising from network effects [4]. As a consequence, we can interpret the inferred couplings as functional connections and characterize the structure of the retinal output-layer architecture. The inferred interactions are strong and positive only for nearby neurons of the same type, whereas distant neurons do not interact directly. Connections between neurons of different types are instead small (or slightly negative), as they are for nearby cells. Therefore, the retinal architecture splits into weakly interacting subpopulations composed of strongly interacting neurons.
In principle, functional connectivity could also be obtained from the disordered IM inferred from spontaneous activity where a constant, full-field stimulus is played. In this case, the stimulus has no spatial correlations and the inferred couplings will only reflect the structure of the retinal connectivity. However, in wild-type retinas, spontaneous activity is usually very weak (few Hz) compared to stimulated activity (up to 50–60 Hz in our case). As a consequence, in order to have the same empirical statistics, one would need a much longer recording, which, however, is very difficult to obtain because of experimental instabilities and limitations.
The inferred functional connectivity matches with the known properties of biological networks. Depending on the type, output retinal neurons can be connected by the direct gap-junction between nearby pairs, or by an indirect connection through multiple gap-junctions passing through amacrine cells [31]. In both cases, only nearby neurons are strongly interacting, and this is nicely reproduced by the functional connections inferred from the time-dependent model. Network effects can also arise from shared noise coming from presynaptic neurons in the retina, mostly photoreceptors noise. This effect can explain the negative correlations between neurons of different types (and polarities) [32], and in turn the slightly negative couplings inferred for nearby neurons.
The time-dependent IM takes into account the stimulus effects with the temporal dependence of the single neuron biases . Instead of modeling the stimulus processing performed by the retina directly, it only reproduces the response behavior in time. Consistently, in order to infer the model, we only used the response to repeated stimulations, without the need of the actual videos. As a consequence, the time-dependent IM cannot generalize to new unseen (during training) stimuli, and this might limit its possible applications. To overcome these limitations, the time-dependent IM has been extended to its stimulus-dependent generalization [4,23], where the biases become actual functions of the stimulus. This allows one to infer deep convolutional neural networks [27,33,34,35] to predict the mean response to stimulus, combined with IM couplings to account for network effects.
Lastly, we could have excluded couplings between distant neurons directly from the inference and constructed a model without long-range interactions. This approach might have reduced the number of parameters from to and could have provided an even simpler framework to account for the network effects .
Author Contributions
Conceptualization, U.F.; methodology, G.D. and U.F.; software, G.D. and U.F.; validation, G.D. and U.F.; formal analysis, G.D. and U.F.; investigation, G.D. and U.F.; resources, U.F.; data curation, G.D. and U.F.; writing—original draft preparation, U.F.; writing—review and editing, G.D. and U.F.; visualization, G.D.; supervision, U.F.; project administration, U.F.; funding acquisition, U.F. All authors have read and agreed to the published version of the manuscript.
Funding
This research was funded by the Agence Nationale de la Recherche (ANR-21-CE37-0024 NatNetNoise), by LabEx LIFESENSES (ANR-10-LABX-65), by IHU FOReSIGHT (ANR-18-IAHU-01, IHU-AIDE-UF), by Sorbonne Université with the Emergence program (CrInforNet) and by a grant from AVIESAN-UNADEV (AIDE).
Institutional Review Board Statement
Not applicable.
Informed Consent Statement
Not applicable.
Data Availability Statement
All data files are available from https://zenodo.org/record/4310029#.X86mmhNKjOQ (10.5281/zenodo.4310029). Inference codes are available upon request.
Acknowledgments
We thank O. Marre and S. Deny for sharing the retinal data.
Conflicts of Interest
The authors declare no conflict of interest.
References
- Schneidman, E.; Berry, M.; Segev, R.; Bialek, W. Weak pairwise correlations imply strongly correlated network states in a population. Nature 2006, 440, 1007. [Google Scholar] [CrossRef] [PubMed]
- Shlens, J.; Field, G.D.; Gauthier, J.L.; Grivich, M.I.; Petrusca, D.; Sher, A.; Litke, A.M.; Chichilnisky, E. The structure of multi-neuron firing patterns in primate retina. J. Neurosci. 2006, 26, 8254–8266. [Google Scholar] [CrossRef] [PubMed]
- Tkacik, G.; Marre, O.; Amodei, D.; Schneidman, E.; Bialek, W.; Berry, M.J., II. Searching for collective behavior in a network of real neurons. PLoS Comput. Biol. 2014, 10, e1003408. [Google Scholar] [CrossRef] [PubMed]
- Ferrari, U.; Deny, S.; Chalk, M.; Tkačik, G.; Marre, O.; Mora, T. Separating intrinsic interactions from extrinsic correlations in a network of sensory neurons. Phys. Rev. E 2018, 98, 042410. [Google Scholar] [CrossRef]
- Marre, O.; El Boustani, S.; Frégnac, Y.; Destexhe, A. Prediction of Spatiotemporal Patterns of Neural Activity from Pairwise Correlations. Phys. Rev. Lett. 2009, 102, 138101. [Google Scholar] [CrossRef] [PubMed]
- Hamilton, L.S.; Sohl-Dickstein, J.; Huth, A.G.; Carels, V.M.; Deisseroth, K.; Bao, S. Optogenetic Activation of an Inhibitory Network Enhances Feedforward Functional Connectivity in Auditory Cortex. Neuron 2013, 80, 1066–1076. [Google Scholar] [CrossRef]
- Tavoni, G.; Ferrari, U.; Battaglia, F.; Cocco, S.; Monasson, R. Functional Coupling Networks Inferred from Prefrontal Cortex Activity Show Experience-Related Effective Plasticity. Netw. Neurosci. 2017, 1, 275–301. [Google Scholar] [CrossRef]
- Meshulam, L.; Gauthier, J.L.; Brody, C.D.; Tank, D.W.; Bialek, W. Collective behavior of place and non-place neurons in the hippocampal network. Neuron 2017, 96, 1178–1191. [Google Scholar] [CrossRef]
- Donner, C.; Obermayer, K.; Shimazaki, H. Approximate inference for time-varying interactions and macroscopic dynamics of neural populations. PLoS Comput. Biol. 2017, 13, e1005309. [Google Scholar] [CrossRef]
- Nghiem, T.A.; Telenczuk, B.; Marre, O.; Destexhe, A.; Ferrari, U. Maximum-entropy models reveal the excitatory and inhibitory correlation structures in cortical neuronal activity. Phys. Rev. E 2018, 98, 012402. [Google Scholar] [CrossRef]
- Shimazaki, H.; Sadeghi, K.; Ishikawa, T.; Ikegaya, Y.; Toyoizumi, T. Simultaneous silence organizes structured higher-order interactions in neural populations. Sci. Rep. 2015, 5, 9821. [Google Scholar] [CrossRef] [PubMed]
- Weigt, M.; White, R.; Szurmant, H.; Hoch, J.; Hwa, T. Identification of direct residue contacts in protein–protein interaction by message passing. Proc. Natl. Acad. Sci. USA 2009, 106, 67–72. [Google Scholar] [CrossRef] [PubMed]
- Santolini, M.; Mora, T.; Hakim, V. A General Pairwise Interaction Model Provides an Accurate Description of In Vivo Transcription Factor Binding Sites. PLoS Comput. Biol. 2014, 9, E99015. [Google Scholar] [CrossRef] [PubMed]
- De Leonardis, E.; Lutz, B.; Ratz, S.; Cocco, S.; Monasson, R.; Schug, A.; Weigt, M. Direct-Coupling Analysis of nucleotide coevolution facilitates RNA secondary and tertiary structure prediction. Nucleic Acids Res. 2015, 43, 10444–10455. [Google Scholar] [CrossRef] [PubMed]
- Figliuzzi, M.; Jacquier, H.; Schug, A.; Tenaillon, O.; Weigt, M. Coevolutionary landscape inference and the context-dependence of mutations in beta-lactamase tem-1. Mol. Biol. Evol. 2016, 33, 268–280. [Google Scholar] [CrossRef] [PubMed]
- Mora, T.; Walczak, A.M.; Bialek, W.; Callan, C.G. Maximum entropy models for antibody diversity. Proc. Natl. Acad. Sci. USA 2010, 107, 5405–5410. [Google Scholar] [CrossRef]
- Bialek, W.; Cavagna, A.; Giardina, I.; Mora, T.; Silvestri, E.; Viale, M.; Walczak, A.M. Statistical mechanics for natural flocks of birds. Proc. Natl. Acad. Sci. USA 2012, 109, 4786–4791. [Google Scholar] [CrossRef]
- Ferrari, U.; Obuchi, T.; Mora, T. Random versus maximum entropy models of neural population activity. Phys. Rev. E 2017, 95, 042321. [Google Scholar] [CrossRef]
- Roudi, Y.; Nirenberg, S.; Latham, P.E. Pairwise maximum entropy models for studying large biological systems: when they can work and when they can’t. PLoS Comput. Biol. 2009, 5, e1000380. [Google Scholar] [CrossRef]
- Obuchi, T.; Cocco, S.; Monasson, R. Learning probabilities from random observables in high dimensions: The maximum entropy distribution and others. J. Stat. Phys. 2015, 161, 598–632. [Google Scholar] [CrossRef]
- Obuchi, T.; Monasson, R. Learning probability distributions from smooth observables and the maximum entropy principle: Some remarks. J. Phys. Conf. Ser. Iop Publ. Iop Publ. 2015, 638, 012018. [Google Scholar] [CrossRef]
- Merchan, L.; Nemenman, I. On the Sufficiency of Pairwise Interactions in Maximum Entropy Models of Networks. J. Stat. Phys. 2016, 162, 1294–1308. [Google Scholar] [CrossRef]
- Granot-Atedgi, E.; Tkacik, G.; Segev, R.; Schneidman, E. Stimulus-dependent Maximum Entropy Models of Neural Population Codes. PLoS Comput. Biol. 2013, 9, 1–14. [Google Scholar] [CrossRef] [PubMed]
- Priesemann, V.; Shriki, O. Can a time varying external drive give rise to apparent criticality in neural systems? PLoS Comput. Biol. 2018, 14, e1006081. [Google Scholar] [CrossRef]
- Sorochynskyi, O.; Deny, S.; Marre, O.; Ferrari, U. Predicting synchronous firing of large neural populations from sequential recordings. PLoS Comput. Biol. 2021, 17, e1008501. [Google Scholar] [CrossRef]
- Wässle, H. Parallel processing in the mammalian retina. Nat. Rev. Neurosci. 2004, 5, 747–757. [Google Scholar] [CrossRef]
- Deny, S.; Ferrari, U.; Mace, E.; Yger, P.; Caplette, R.; Picaud, S.; Tkačik, G.; Marre, O. Multiplexed computations in retinal ganglion cells of a single type. Nat. Commun. 2017, 8, 1964. [Google Scholar] [CrossRef]
- Marre, O.; Amodei, D.; Deshmukh, N.; Sadeghi, K.; Soo, F.; Holy, T.; Berry, M. Recording of a large and complete population in the retina. J. Neurosci. 2012, 32, 1485973. [Google Scholar] [CrossRef]
- Cocco, S.; Monasson, R. Adaptive cluster expansion for inferring Boltzmann machines with noisy data. Phys. Rev. Lett. 2011, 106, 090601. [Google Scholar] [CrossRef]
- Ferrari, U. Learning maximum entropy models from finite-size data sets: A fast data-driven algorithm allows sampling from the posterior distribution. Phys. Rev. E 2016, 94, 023301. [Google Scholar] [CrossRef]
- Brivanlou, I.; Warland, D.; Meister, M. Mechanisms of Concerted Firing among Retinal Ganglion Cells. Neuron 1998, 20, 527–539. [Google Scholar] [CrossRef] [PubMed]
- Völgyi, B.; Chheda, S.; Bloomfield, S. Tracer Coupling Patterns of the Ganglion Cell Subtypes in the Mouse Retina. J. Comp. Neurol. 2009, 512, 664–687. [Google Scholar] [CrossRef] [PubMed]
- McIntosh, L.; Maheswaranathan, N.; Nayebi, A.; Ganguli, S.; Baccus, S. Deep learning models of the retinal response to natural scenes. Adv. Neural Inf. Process. Syst. 2016, 29, 1369–1377. [Google Scholar] [PubMed]
- Mahuas, G.; Isacchini, G.; Marre, O.; Ferrari, U.; Mora, T. A new inference approach for training shallow and deep generalized linear models of noisy interacting neurons. Adv. Neural Inf. Process. Syst. 2020, 33, 5070–5080. [Google Scholar]
- Goldin, M.A.; Lefebvre, B.; Virgili, S.; Ecker, A.; Mora, T.; Ferrari, U.; Marre, O. Context-dependent selectivity to natural scenes in the retina. Nat. Commun. 2021, 13, 5556. [Google Scholar] [CrossRef]


Publisher’s Note: MDPI stays neutral with regard to jurisdictional claims in published maps and institutional affiliations. |
© 2022 by the authors. Licensee MDPI, Basel, Switzerland. This article is an open access article distributed under the terms and conditions of the Creative Commons Attribution (CC BY) license (https://creativecommons.org/licenses/by/4.0/).