Proceeding Paper

Overview of Air Quality in Konya during COVID-19 Lockdown Periods †

by
İlker Balcılar
Department of Environmental Engineering, Eskisehir Technical University, Eskisehir 26555, Turkey
Presented at the 3rd International Electronic Conference on Environmental Research and Public Health—Public Health Issues in the Context of the COVID-19 Pandemic, 11–25 January 2021; Available online: https://ecerph-3.sciforum.net/.
Med. Sci. Forum 2021, 4(1), 28; https://doi.org/10.3390/ECERPH-3-09083
Published: 11 January 2021

Abstract

:
Turkey confirmed its first COVID-19 case on 11 March 2020 and confirmed COVID-19 cases surpassed >10,000 within two weeks. The Turkish government implemented restrictions including closure of businesses, travel restrictions, and age-based lockdowns as of late March 2020. To battle the ongoing surge in cases, full weekend lockdowns were introduced at metropolitan cities between 11 April and 3 May 2020. As a result of these measures, community mobility in Turkey decreased more than 75%. In this study, air quality in the metropolitan city of Konya was assessed for PM10 and NO2 for 4-week periods from 6 April to 3 May in 2018–2020. Hourly concentrations of PM10 and NO2 were obtained from a National Air Quality Monitoring Network station, and concentrations of these pollutants for the 2020 period were compared with those for the same periods of 2018–2019. Significant declines were observed for PM10 and NO2 in the 2020 period compared with the 2018–2019 periods. The PM10 concentration declined by 55.7% in 2020, with an absolute decrease of 24.2 µg/m3. NO2 also declined significantly, with a 37.7% reduction and an absolute decrease of 11.1 µg/m3. Measures taken to battle the COVID-19 virus have decreased the airborne pollutant levels in many parts of the world. Control measures that can keep the air pollution at a sustainable low level need to be taken.
Keywords:
air quality; NO2; PM10; Turkey

1. Introduction

According to the WHO, 91% of the world’s population lives in places where the level of air pollutants exceeds the limits, and 7.2 million people die prematurely every year due to air pollution [1]. Particulate matter (PM) and nitrogen dioxide (NO2) are listed as criteria pollutants by the US EPA due their effects on human health [2]. Prolonged and high-level exposures to PM and NO2 cause a wide range of effects, from impairing the respiratory system to premature death [3].
In response to the COVID-19 pandemic, countries imposed lockdowns; business, school, shopping mall, market, and restaurant closures; and public transportation limitations. As a result of the imposed restrictions, air quality has improved significantly in many parts of the world, especially in Europe and the USA. In Europe, NO2, a pollutant mainly emitted from traffic, has decreased by up to 50%, especially in cities with dense population and industrial areas [4]. PM10 has also decreased up to 31% overall in India during lockdown periods [5].
Turkish authorities confirmed the first COVID-19 case on 11 March 2020. Active COVID-19 cases rapidly increased, and >10,000 total cases and 168 deaths were reported as of 30 March 2020. The Turkish government implemented restrictions including closure of businesses, travel restrictions, and age-based lockdowns as of late March 2020. To battle the ongoing surge in cases, full weekend lockdowns were introduced at metropolitan cities between 11 April and 3 May.
This paper investigates air quality in Konya, which is the seventh biggest city in Turkey, with a population of 2.2 million, during the full weekend lockdown periods of 6 April to 3 May. For this purpose, daily average concentrations of PM10 and NO2 in lockdown periods for 2020 were compared with those in the same periods of 2018–2019.

2. Materials and Methods

The Turkish government implemented restrictions including closure of businesses, travel restrictions, and age-based lockdowns as of late March 2020. Four full weekend and holiday lockdowns were introduced at metropolitan cities between 11 April and 3 May 2020. During this period, people were instructed to stay at home for a total of 11 days out of 28 days.
Turkey has 355 active monitoring stations operated under the National Air Quality Monitoring Network. Stations are located in urban and rural areas to measure emissions emitted from vehicles, industries, and residential areas. The station used in study is located in Konya city center (32°30′58.68″ N, 37°52′5.16″ E). Hourly measurements of PM10 and NO2 for 6 April to 3 May in 2018–2020 were downloaded through the web portal of the national network. The data obtained for Konya station were classified into two groups as current (2020) and historical (2018–2019).

3. Results and Discussion

Daily average concentrations of PM10 and NO2 and differences in historical and current means are presented in Table 1. During the COVID-19 lockdown periods, the PM10 concentration declined by 55.7% in 2020, with an absolute decrease of 24.2 µg/m3. NO2 also declined significantly, with a 37.7% reduction and an absolute decrease of 11.1 µg/m3.
The findings of this study evidence that the measured concentrations of PM10 and NO2 declined during the lockdown periods of COVID-19. NO2 declined significantly, with a 37.7% reduction in 2020 compared to the 2018–2019 periods. This reduction is larger than that in some cities in the USA (25.5% overall) [6], but less than European cities such as Barcelona, Milan, Madrid, and Lisbon [4]. The highest reduction in Konya’s atmosphere was observed in the PM10 concentration. The PM10 concentration declined by 55.7% in 2020 compared to the 2018–2019 periods. The reduction observed for PM10 in Konya is larger than that in Baghdad (15%) [7], but less than that in Morocco (75%) [8].
Figure 1 provides time-series plots of daily average concentrations of PM10 and NO2 for 6 April to 3 May 2020, in relation to the daily average concentrations for 6 April to 3 May 2018–2019. As can be seen from the figure, NO2 levels were reduced much less than those of PM10. As mentioned earlier, the main source of NO2 is traffic in urban areas. Sharp increases in concentrations of NO2 were observed during weekdays after the full weekend lockdowns. PM in urban areas has sources other than traffic such as industry, and fossil fuel combustion. Even after the weekend and holiday lockdowns, industries and businesses remained closed. This may be responsible for the higher reduction in PM10 compared to NO2.

4. Conclusions

Measures taken to battle the COVID-19 virus have decreased the airborne pollutant levels in many parts of the world. In this study, it was shown that PM10 and NO2 concentrations decreased significantly during lockdown periods compared to the previous years. It can be concluded that the reductions in concentrations of pollutants are due to the measures taken to battle the COVID-19 pandemic. Air pollution is a common problem for the whole world, but it is known that the measures taken to solve it are still insufficient. It is clearly observed that the human activities have a great impact on air pollution. Control measures that can keep the air pollution at a sustainable low level need to be taken.

Funding

This research received no external funding.

Institutional Review Board Statement

Not applicable.

Informed Consent Statement

Not applicable.

Data Availability Statement

Publicly available datasets were analyzed in this study. This data can be found here: https://sim.csb.gov.tr/Services/AirQuality.

Acknowledgments

The author acknowledges the Turkish Republic Ministry of Environment, Urbanization and Climate Change for the free use of the National Air Quality Monitoring Network data.

Conflicts of Interest

The authors declare no conflict of interest.

References

  1. World Health Organization. Air Pollution. Available online: https://www.who.int/health-topics/air-pollution#tab=tab_2 (accessed on 3 January 2021).
  2. United States Environmental Protection Agency. Criteria Air Pollutants. Available online: https://www.epa.gov/criteria-air-pollutants (accessed on 3 January 2021).
  3. European Environment Agency. Air Pollution. Available online: https://www.eea.europa.eu/tr/themes/air/intro (accessed on 2 January 2021).
  4. European Environment Agency. Air Pollution Goes down as Europe Takes Hard Measures to Combat Coronavirus. Available online: https://www.eea.europa.eu/highlights/air-pollution-goes-down-as (accessed on 4 January 2021).
  5. Sharma, S.; Zhang, M.; Gao, J.; Zhang, H.; Kota, S.H. Effect of restricted emissions during COVID-19 on air quality in India. Sci. Total Environ. 2020, 728, 138878. [Google Scholar] [CrossRef] [PubMed]
  6. Berman, J.D.; Ebisu, K. Changes in US air pollution during the COVID-19 pandemic. Sci. Total Environ. 2020, 739, 139864. [Google Scholar] [CrossRef] [PubMed]
  7. Hashim, B.M.; Al-Naseri, S.K.; Al-Maliki, A.; Al-Ansari, N. Impact of COVID-19 lockdown on NO2, O3, PM2.5 and PM10 concentrations and assessing air quality changes in Baghdad, Iraq. Sci. Total Environ. 2020, 754, 141978. [Google Scholar] [CrossRef] [PubMed]
  8. Otmani, A.; Benchrif, A.; Tahri, M.; Bounakhla, M.; El Bouch, M.; Krombi, M.H. Impact of COVID-19 lockdown on PM10, SO2 and NO2 concentrations in Salé City (Morocco). Sci. Total Environ. 2020, 735, 139541. [Google Scholar] [CrossRef] [PubMed]
Figure 1. Time-series plots of measured daily average PM10 (a) and NO2 (b) concentrations for 6 April to 3 May 2020, in relation to the daily average concentrations for 6 April to 3 May 2018–2019.
Msf 04 00028 g001
Table 1. Daily average concentrations of PM10 and NO2.
MeanSTDDifference in Historical and Current Means (% Change)
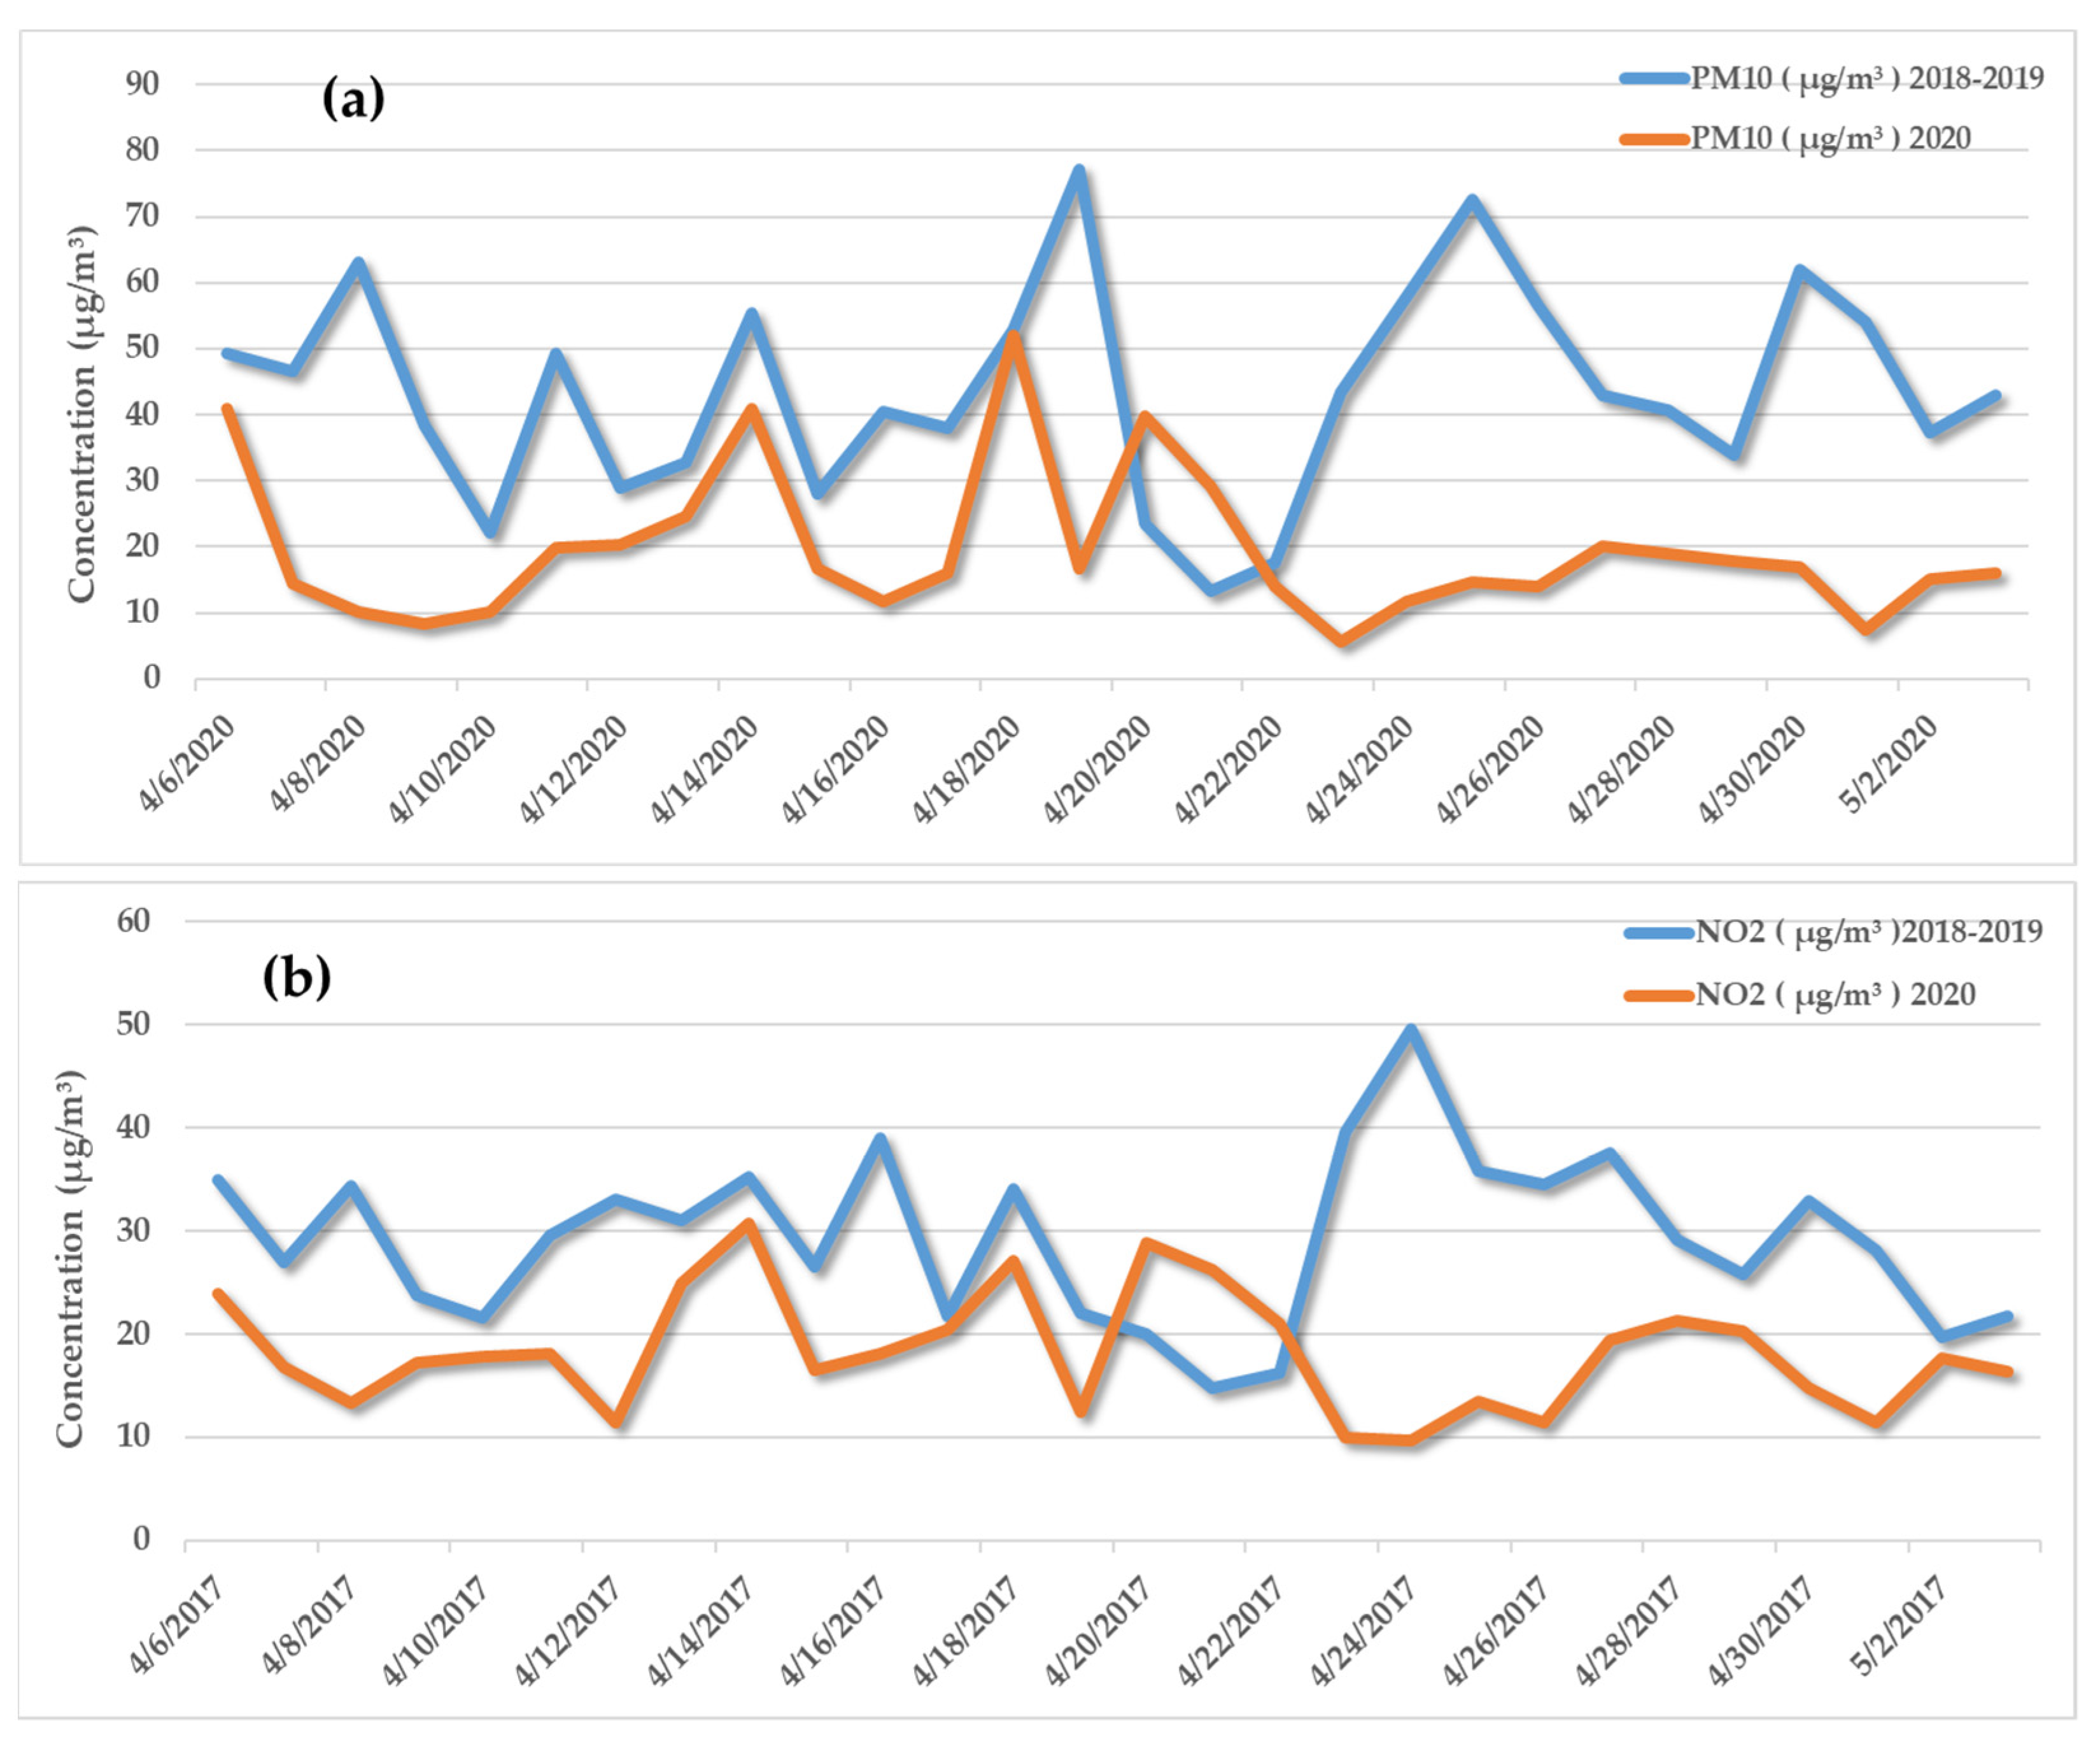
PM10 (µg/m³)
Historical (2018–2019)43.615.1−24.2 (−55.7%)
Current (2020)19.411.1
NO2 (µg/m³)
Historical (2018–2019)29.37.9−11.1 (−37.7%)
Current (2020)18.25.7
Publisher’s Note: MDPI stays neutral with regard to jurisdictional claims in published maps and institutional affiliations.

