
Comparison between Bioelectrical Impedance Analysis and Body Mass Index Methods in Determination of Obesity Prevalence of Chinese Preschoolers †

Abstract
:1. Introduction
2. Subjects and Methods
2.1. Subjects
2.2. Methods
3. Results
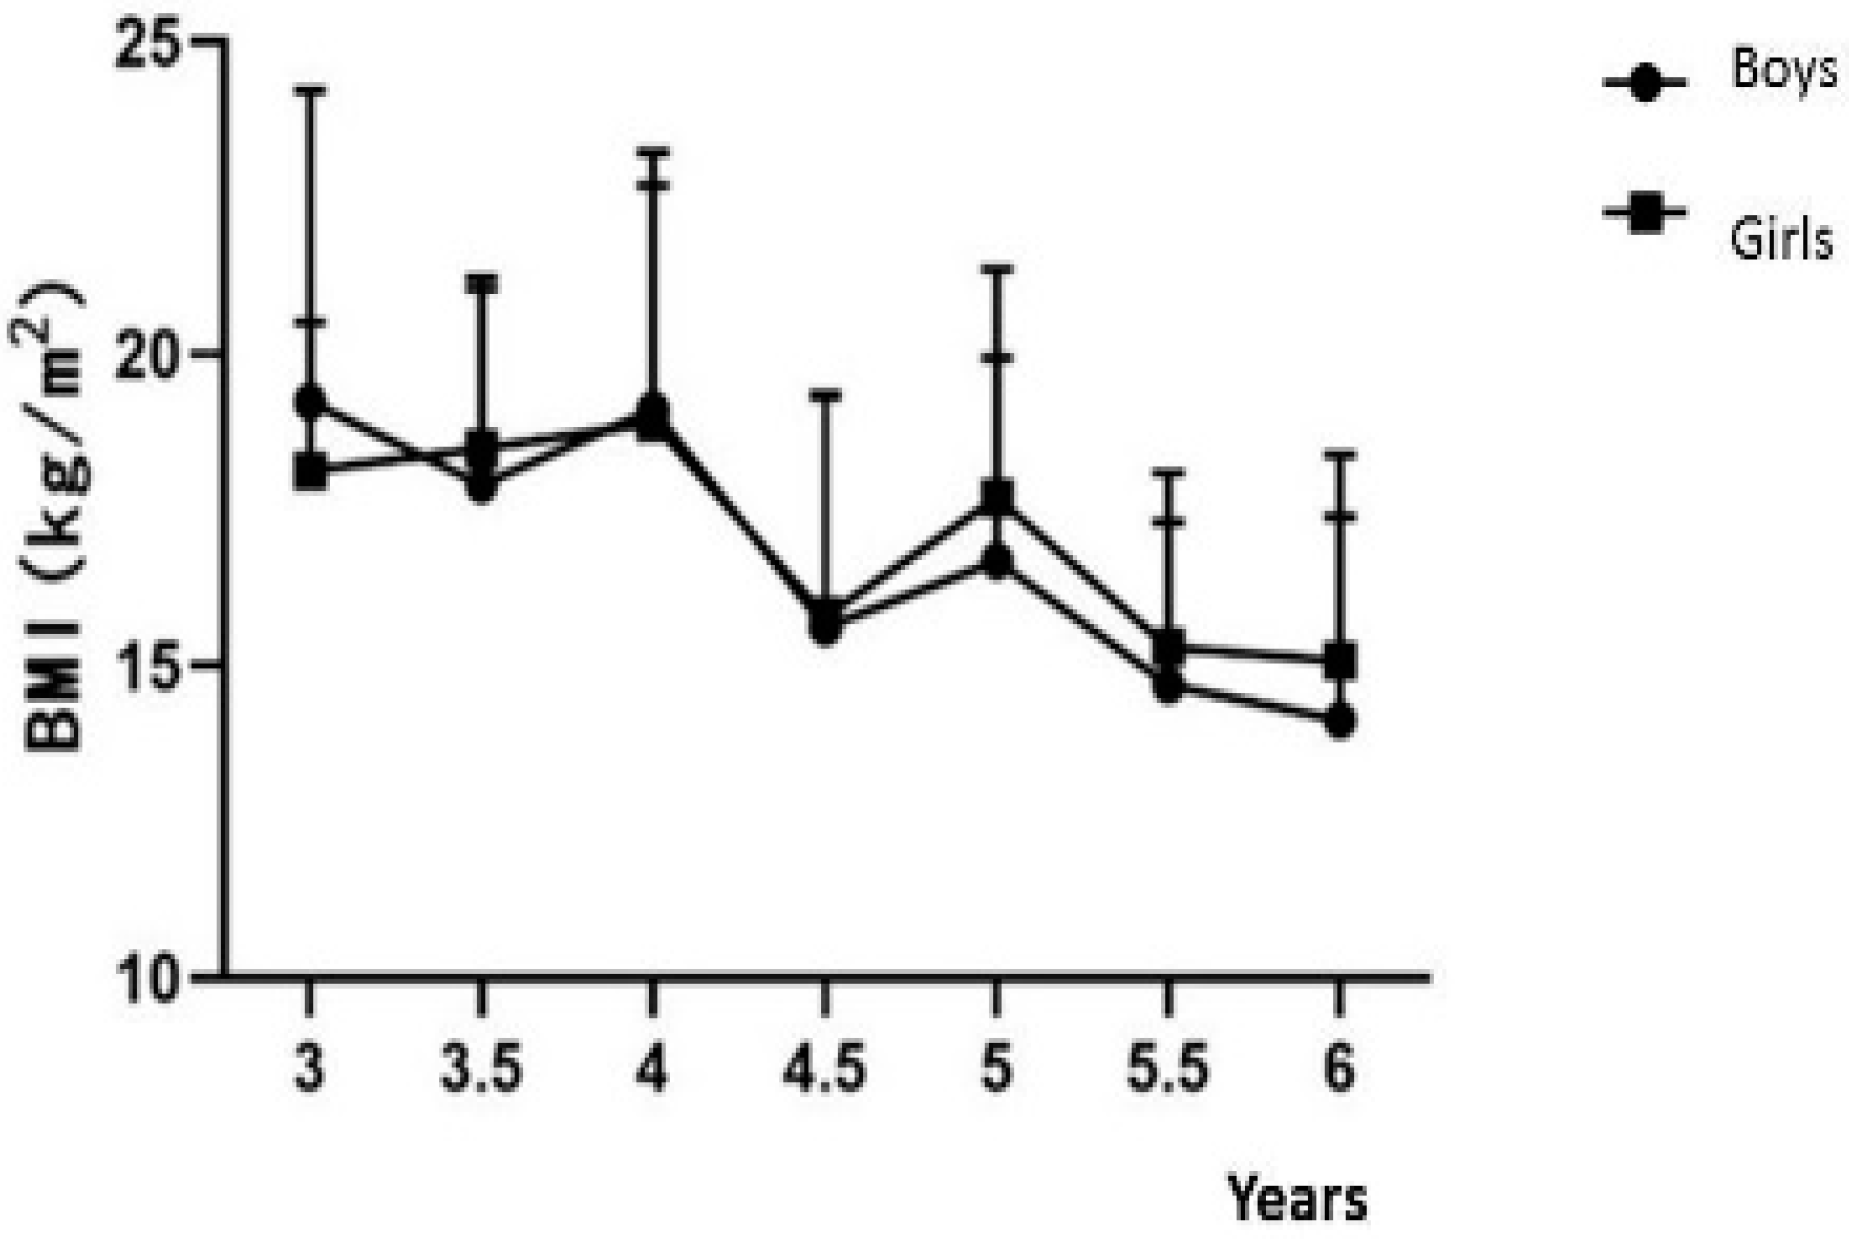
3.1. The Height, Body Weight and BMI of the Subjects
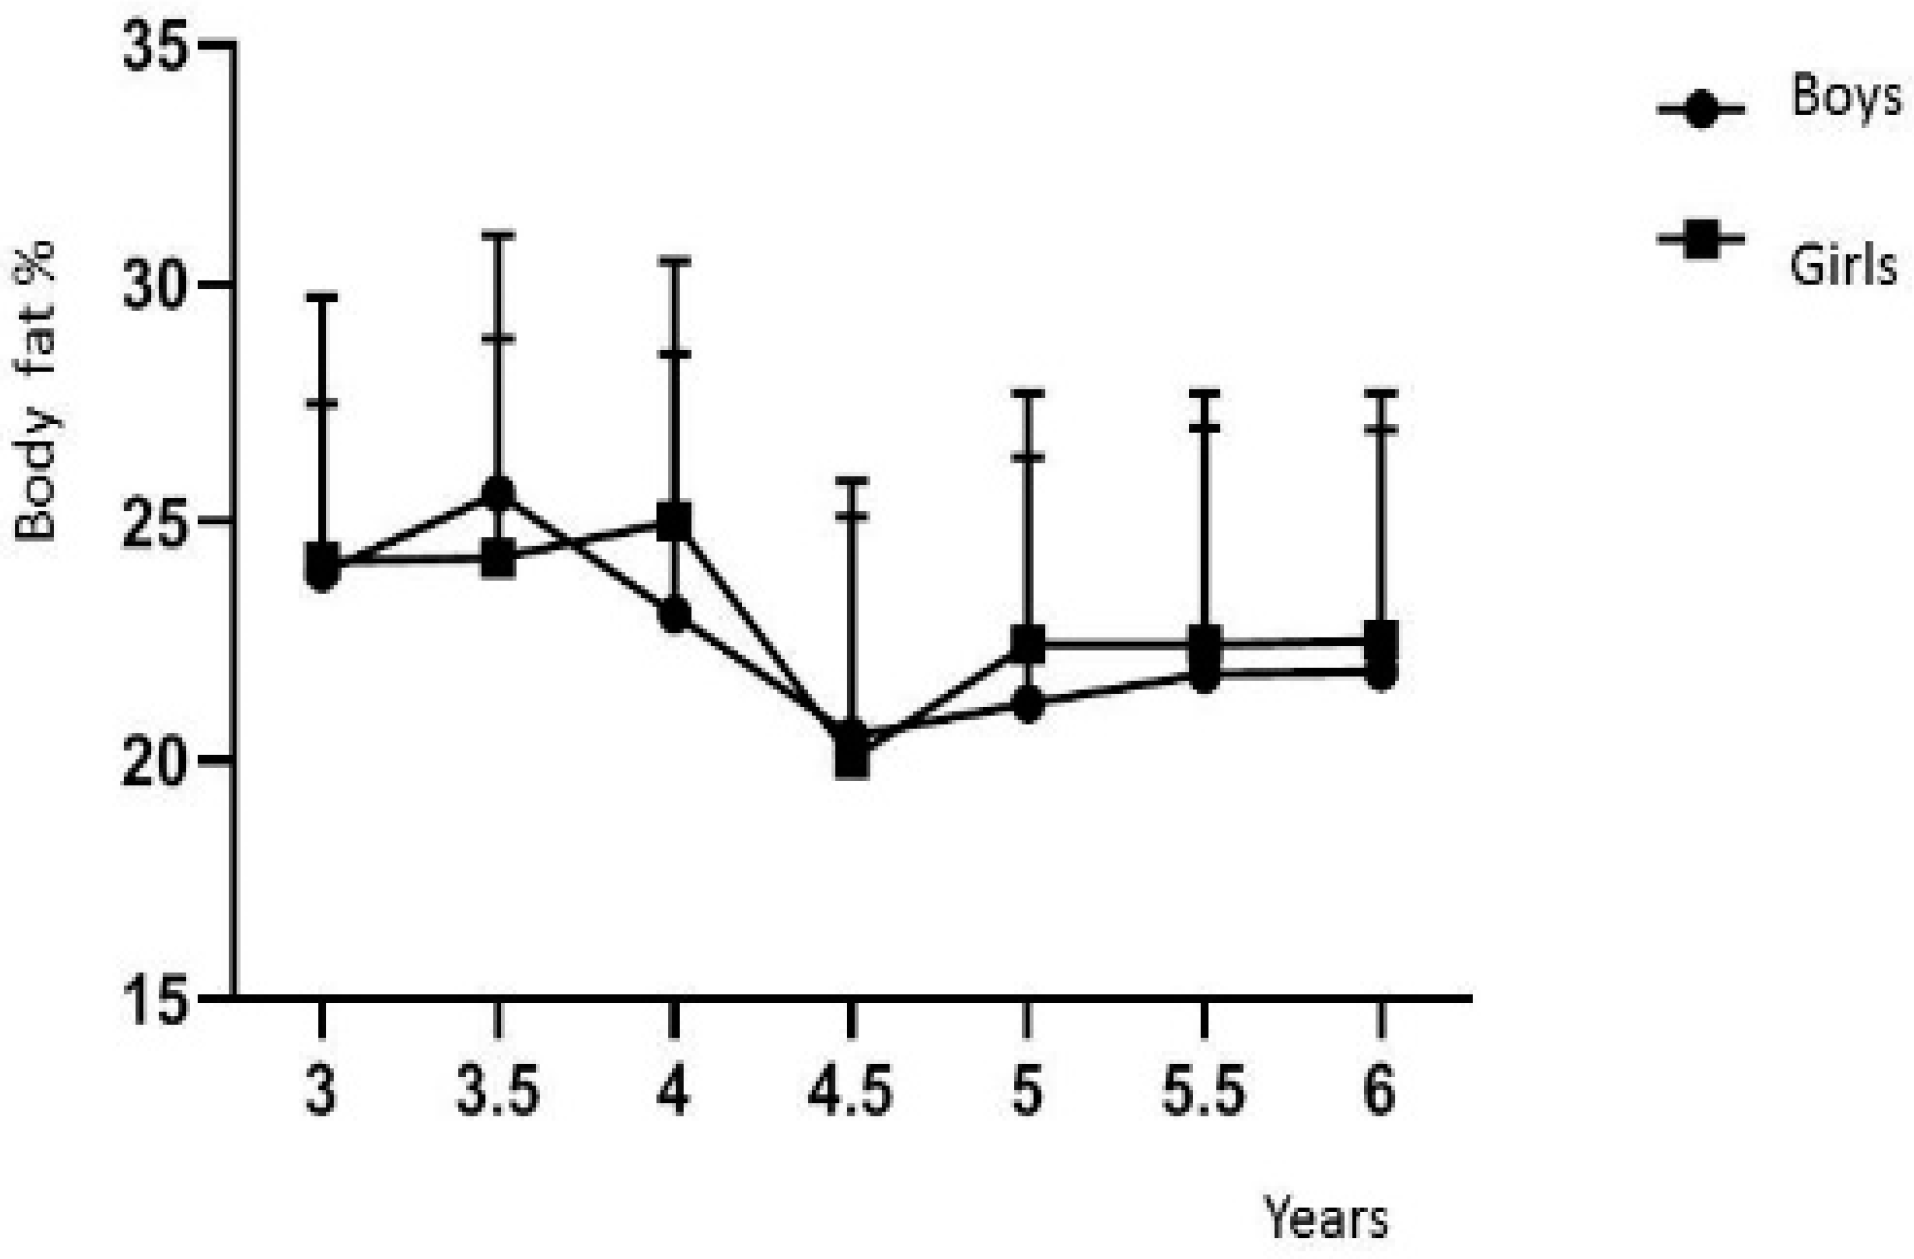
3.2. Analysis of Body Composition of Children Aged 3~6
3.3. Kappa Coefficient Consistency Test
4. Discussion
Author Contributions
Funding
Institutional Review Board Statement
Informed Consent Statement
Data Availability Statement
Conflicts of Interest
References
- Lim, H.J.; Xue, H.; Wang, Y. Handbook of Eating and Drinking: Interdisciplinary Perspectives. Global Trends Obes. 2020, 1217–1235. [Google Scholar]
- Shah, N.R.; Braverman, E.R. Measuring adiposity in patients: The utility of body mass index (BMI), percent body fat, and leptin. PLoS ONE 2012, 7, e33308. [Google Scholar] [CrossRef]
- Carpenter, C.L.; Yan, E.; Chen, S.; Hong, K.; Arechiga, A.; Kim, W.S.; Heber, D. Body fat and body-mass index among a multiethnic sample of college-age men and women. J. Obes. 2013, 2013, 790654. [Google Scholar] [CrossRef] [PubMed]
- Zhao, D.; Zhang, Y. Body mass index (BMI) predicts percent body fat better than body adiposity index (BAI) in school children. Anthropol. Anz. 2015, 72, 257–262. [Google Scholar] [CrossRef] [PubMed]
- Maynard, L.M.; Wisemandle, W.; Roche, A.F.; Chumlea, W.C.; Guo, S.S.; Siervogel, R.M. Childhood body composition in relation to body mass index. Pediatrics 2001, 107, 344–350. [Google Scholar] [CrossRef] [PubMed]
- Hung, S.P.; Chen, C.Y.; Guo, F.R.; Chang, C.I.; Jan, C.F. Combine body mass index and body fat percentage measures to improve the accuracy of obesity screening in young adults. Obes. Res. Clin. Pract. 2017, 11, 11–18. [Google Scholar] [CrossRef] [PubMed]

| Years | Boys | Girls | Total |
|---|---|---|---|
| 3 | 17 | 20 | 37 |
| 3.5 | 39 | 20 | 59 |
| 4 | 37 | 31 | 68 |
| 4.5 | 74 | 51 | 125 |
| 5 | 68 | 58 | 126 |
| 5.5 | 68 | 53 | 121 |
| 6 | 89 | 76 | 165 |
| Total | 392 | 309 | 701 |
| Years | Boys | Girls | t | p |
|---|---|---|---|---|
| 3 | 98.5 ± 0.1 | 97.5 ± 0.1 | −1.41 | 0.17 |
| 3.5 | 102.2 ± 0.1 | 101.2 ± 0.1 | −0.82 | 0.42 |
| 4 | 105.0 ± 0.1 | 106.3 ± 0.1 | 1.14 | 0.26 |
| 4.5 | 109.4 ± 0.1 | 107.9 ± 0.1 | −1.93 | 0.06 |
| 5 | 113.4 ± 0.1 | 110.4 ± 0.1 | −4.17 | 0.00 |
| 5.5 | 116.6 ± 0.1 | 114.9 ± 0.1 | −2.00 | 0.04 |
| 6 | 119.6 ± 0.1 | 118.6 ± 0.1 | −1.28 | 0.20 |
| Total | 112.0 ± 0.1 | 110.9 ± 0.1 | −2.00 | 0.04 |
| Years | Boys | Girls | t | p |
|---|---|---|---|---|
| 3 | 18.3 ± 2.7 | 17.2 ± 2.2 | −1.3 | 0.20 |
| 3.5 | 18.6 ± 3.1 | 18.9 ± 3.0 | 0.34 | 0.74 |
| 4 | 21.1 ± 4.2 | 21.3 ± 4.7 | 0.18 | 0.86 |
| 4.5 | 18.6 ± 4.2 | 18.3 ± 3.6 | −0.46 | 0.65 |
| 5 | 21.4 ± 4.0 | 21.5 ± 4.2 | 0.09 | 0.93 |
| 5.5 | 19.9 ± 3.3 | 20.1 ± 3.4 | 0.29 | 0.77 |
| 6 | 20.1 ± 4.4 | 21.1 ± 4.1 | 1.50 | 0.14 |
| Total | 19.9 ± 4.0 | 20.2 ± 4.0 | 0.90 | 0.37 |
| Years | Boys | Girls | t | p |
|---|---|---|---|---|
| 3 | 19.2 ± 2.9 | 18.1 ± 2.4 | −0.88 | 0.39 |
| 3.5 | 17.9 ± 3.1 | 18.5 ± 2.7 | 0.69 | 0.49 |
| 4 | 19.1 ± 3.6 | 18.9 ± 4.3 | −0.22 | 0.83 |
| 4.5 | 15.6 ± 3.7 | 15.8 ± 3.5 | 0.26 | 0.80 |
| 5 | 16.7 ± 3.3 | 17.7 ± 3.7 | 1.63 | 0.11 |
| 5.5 | 14.7 ± 2.6 | 15.3 ± 2.8 | 1.17 | 0.25 |
| 6 | 14.1 ± 3.3 | 15.1 ± 3.3 | 1.86 | 0.01 |
| Total | 16.0 ± 3.8 | 16.5 ± 3.6 | 1.78 | 0.08 |
| Year | 3 | 3.5 | 4 | 4.5 | 5 | 5.5 | 6 |
|---|---|---|---|---|---|---|---|
| Body fat (kg) | 4.5 ± 1.7 | 4.9 ± 1.7 | 5.1 ± 2.7 | 4.0 ± 2.3 | 4.7 ± 2.4 | 4.5 ± 2.0 | 4.6 ± 2.5 |
| Fat free (kg) | 13.8 ± 1.0 | 13.8 ± 1.8 | 16.0 ± 2.2 | 14.6 ± 2.6 | 16.7 ± 2.5 | 15.5 ± 2.1 | 15.5 ± 2.6 |
| Muscles (kg) | 6.4 ± 0.6 | 6.4 ± 1.1 | 7.7 ± 1.4 | 6.7 ± 1.6 | 8.1 ± 1.7 | 7.3 ± 1.5 | 7.4 ± 1.7 |
| Minerals (kg) | 0.7 ± 0.1 | 0.6 ± 0.1 | 0.8 ± 0.1 | 0.7 ± 0.2 | 0.9 ± 0.2 | 0.8 ± 0.2 | 0.8 ± 0.2 |
| Intracellular fluid (L) | 6.4 ± 0.5 | 6.5 ± 0.9 | 7.4 ± 1.1 | 6.9 ± 1.2 | 7.7 ± 1.3 | 7.2 ± 1.2 | 7.2 ± 1.3 |
| Extracellular fluid (L) | 3.9 ± 0.3 | 3.9 ± 0.5 | 4.5 ± 0.6 | 4.1 ± 0.7 | 4.7 ± 0.8 | 4.4 ± 0.6 | 4.4 ± 0.8 |
| Body water (L) | 10.3 ± 0.7 | 10.4 ± 1.4 | 12.0 ± 1.7 | 11.0 ± 1.9 | 12.5 ± 2.1 | 11.5 ± 1.8 | 11.6 ± 2.0 |
| Protein (kg) | 2.8 ± 0.2 | 2.8 ± 0.4 | 3.2 ± 0.5 | 3.0 ± 0.5 | 3.3 ± 0.6 | 3.1 ± 0.5 | 3.1 ± 0.6 |
| Year | 3 | 3.5 | 4 | 4.5 | 5 | 5.5 | 6 |
|---|---|---|---|---|---|---|---|
| Body fat (kg) | 4.2 ± 1.0 | 4.7 ± 1.6 | 5.6 ± 3.2 | 3.8 ± 1.7 | 5.0 ± 2. 5 | 4.7 ± 2.1 | 4.9 ± 2.5 |
| Fat free (kg) | 13.0 ± 1.5 | 14.2 ± 1.7 | 15.7 ± 2.1 | 14.5 ± 2.5 | 16.5 ± 2.6 | 15.4 ± 2.1 | 16.2 ± 2.5 |
| Muscles (kg) | 6.0 ± 0.9 | 6.7 ± 1.0 | 7.5 ± 1.4 | 6.9 ± 1.6 | 8.0 ± 1.6 | 7.4 ± 1.3 | 7.9 ± 1.6 |
| Minerals (kg) | 0.6 ± 0.1 | 0.7 ± 0.1 | 0.8 ± 0.2 | 0.7 ± 2.0 | 0.8 ± 0.2 | 0.8 ± 0.1 | 0.8 ± 0.2 |
| Intracellular fluid (L) | 6.1 ± 0.7 | 6.7 ± 0.8 | 7.3 ± 1.1 | 6.8 ± 1.2 | 7.7 ± 1.2 | 7.2 ± 1.0 | 7.6 ± 1.2 |
| Extracellular fluid (L) | 3.7 ± 0.4 | 4.0 ± 0.5 | 4.4 ± 0.6 | 4.1 ± 0.7 | 4.7 ± 0.7 | 4.4 ± 0.6 | 4.6 ± 0.7 |
| Body water (L) | 9.8 ± 1.1 | 10.7 ± 1.2 | 11.7 ± 1.7 | 10.9 ± 1.8 | 12.4 ± 2.0 | 11.6 ± 1.6 | 12.1 ± 1.9 |
| Protein (kg) | 2.6 ± 0.3 | 2.9 ± 0.3 | 3.1 ± 0.5 | 2.9 ± 0.5 | 3.3 ± 0.6 | 3.1 ± 0.4 | 3.3 ± 0.5 |
| Years | Boys | Girls | t | p |
|---|---|---|---|---|
| 3 | 24.0 ± 5.8 | 24.2 ± 3.3 | 0.14 | 0.89 |
| 3.5 | 25.6 ± 5.4 | 24.3 ± 4.6 | −0.96 | 0.34 |
| 4 | 23.1 ± 7.5 | 25.0 ± 8.5 | 1.00 | 0.32 |
| 4.5 | 20.5 ± 7.3 | 20.1 ± 7.1 | −0.37 | 0.71 |
| 5 | 21.2 ± 7.2 | 22.5 ± 7.3 | 0.96 | 0.34 |
| 5.5 | 21.8 ± 7.0 | 22.7 ± 7.1 | 0.68 | 0.49 |
| 6 | 21.9 ± 7.1 | 22.5 ± 7.2 | 0.58 | 0.56 |
| Total | 22.1 ± 7.1 | 22.6 ± 7.1 | 0.98 | 0.76 |
| Value | Asymptotic Standard Error | Approximation | p | |
|---|---|---|---|---|
| Kappa | 0.339 | 0.042 | 11.108 | 0.00 |
| n | 701 |
Disclaimer/Publisher’s Note: The statements, opinions and data contained in all publications are solely those of the individual author(s) and contributor(s) and not of MDPI and/or the editor(s). MDPI and/or the editor(s) disclaim responsibility for any injury to people or property resulting from any ideas, methods, instructions or products referred to in the content. |
© 2022 by the authors. Licensee MDPI, Basel, Switzerland. This article is an open access article distributed under the terms and conditions of the Creative Commons Attribution (CC BY) license (https://creativecommons.org/licenses/by/4.0/).
Share and Cite
Chen, Q.; Xie, Z.; Ma, S.; Chen, M. Comparison between Bioelectrical Impedance Analysis and Body Mass Index Methods in Determination of Obesity Prevalence of Chinese Preschoolers. Med. Sci. Forum 2021, 4, 29. https://doi.org/10.3390/ECERPH-3-09057
Chen Q, Xie Z, Ma S, Chen M. Comparison between Bioelectrical Impedance Analysis and Body Mass Index Methods in Determination of Obesity Prevalence of Chinese Preschoolers. Medical Sciences Forum. 2021; 4(1):29. https://doi.org/10.3390/ECERPH-3-09057
Chicago/Turabian StyleChen, Qian, Zhiling Xie, Shen Ma, and Minxiong Chen. 2021. "Comparison between Bioelectrical Impedance Analysis and Body Mass Index Methods in Determination of Obesity Prevalence of Chinese Preschoolers" Medical Sciences Forum 4, no. 1: 29. https://doi.org/10.3390/ECERPH-3-09057
APA StyleChen, Q., Xie, Z., Ma, S., & Chen, M. (2021). Comparison between Bioelectrical Impedance Analysis and Body Mass Index Methods in Determination of Obesity Prevalence of Chinese Preschoolers. Medical Sciences Forum, 4(1), 29. https://doi.org/10.3390/ECERPH-3-09057