Proceeding Paper

COVID-19 Pandemic in Brazil: Clinical Manifestation and Effect of Comorbidities on Outcomes of Hospitalized SARI Cases †

Department of Biostatistics, Epidemiology and Environmental Sciences, Jiann Ping-Hsu College of Public Health, Georgia Southern University, 501 Forest Drive, Statesboro, GA 30458, USA
*
Author to whom correspondence should be addressed.
Presented at the 3rd International Electronic Conference on Environmental Research and Public Health—Public Health Issues in the Context of the COVID-19 Pandemic, 11–25 January 2021; Available online: https://ecerph-3.sciforum.net/.
Med. Sci. Forum 2021, 4(1), 37; https://doi.org/10.3390/ECERPH-3-09070
Published: 11 January 2021

Abstract

:
Hospitalized SARI cases of 2020 reported to the Ministry of Health of Brazil through the SIVEP Gripe system are subject to our analysis. They are classified as COVID-19 and non-COVID-19 and clinical manifestations and comorbidities are reported for each group. The time trend in the number of cases reported in 2020 is compared to the previous year and the performance of the PCR test is explored in each group. The proportion of death is reported among different subgroups of the patients by epidemiological week. Logistic and Poisson regression models are used to check the effect of comorbidities on clinical outcomes.

1. Introduction

COVID-19 refers to the Severe Acute Respiratory Syndrome Coronavirus 2 (SARS–CoV-2), which causes Severe Acute Respiratory Infection [1]. It emerged in Wuhan, China in early December 2019 and later was classified as a pandemic by the World Health Organization [1]. Its most common clinical manifestations include fever, cough, dyspnea, expectoration, headache, and myalgia or fatigue, whereas diarrhea, hemoptysis, and shortness of breath are less common [2]. Research shows that the presence of comorbidities, such as high blood pressure and diabetes are associated with a worse prognosis, especially in older patients [2]. Molecular diagnostic technology is crucial for the control of the virus spread [3], and it is accompanied by great challenges as well as opportunities for fast adaptations [4].
Brazil is one of the hardest-hit countries and is considered a global hotspot for the virus [5]. In this study, we present findings from the analysis of hospitalized Severe Acute respiratory Infection (SARI) cases in Brazil with a focus on obtaining a view of the clinical manifestations, outcomes such as admission to ICU, the use of non-invasive ventilatory support (non-IVS) and invasive ventilatory support (IVS), length of hospitalization and ICU stay, and the effect of comorbidities on outcomes. We are also interested in whether there is an improvement over time in the proportion of SARI patients who are cured. Lastly, we have investigated the time trend of reported SARI cases and explored how it can be related to criteria for case classification and the role of PCR test performance.

2. Materials and Methods

2.1. Data Source and Preparation

The data used for this analysis are publicly available from IVIS Platform (Plataforma Integrada de Vigilância em Saúde) under the Ministry of Health of Brazil were last updated on 13 October 2020 [6]. More specifically, it consists of hospitalized SARI patients reported in SIVEP Gripe (Sistema de Informação de Vigilância Epidemiológica da Gripe) surveillance system, which is used to report individuals of any age hospitalized with fever and cough or throat pain and who have dyspnea or O2 blood saturation <95% or respiratory discomfort [7]. Additionally, there are reported cases of death caused by SARI independent of hospitalization status [7]. For the purposes of our analysis, we used the dataset of SARI cases reported in 2020, which is the main focus; in addition, the 2019 dataset is used to compare the time trends of cases.
The dataset of the year 2020 was downloaded, and observations for whom the final classification of the etiologic agent was missing and those who had biologically nonplausible observations were deleted first. In the end, there were 617,020 observations for analysis. Based on whether SARS-CoV-2 was the etiologic agent in the final case classification, two groups were created: COVID-19 and non-COVID-19 (etiologic agent different from SARS-CoV-2). Taking into consideration the fact that the record sheet instructs reporting the presence of any specific comorbidity with X [7], it was assumed that, where nothing was specified, the comorbidity was not present. Duration of hospitalization (and ICU stay) was calculated as the difference in days between the reported date of start and end of hospitalization (ICU stay). The classification of severity was based on signs and symptoms following National Institutes of Health (NIH) [8], (Table A1 in Appendix A). The results of PCR test or other tests of molecular biology were reported in one single variable and here are referred to as PCR.

2.2. Methods

Data were imported in SAS/STAT software, version 9.4, SAS Institute Inc., Cary, NC and appropriate procedures were used to generate descriptive analysis results, including proportions, means, crosstabulations, and chi square test. R software, version 4.0.3, R Foundation for Statistical Computing, Vienna, Austria was used to generate appropriate graphs.
Full logistic regression models were used to estimate the effect predictors on ICU admission, type of Ventilatory Support (VS), and final case evolution following the methodology of Agresti [9]. The methodology of the same author was implemented to run full Poisson regression models to estimate the effect of predictors on length of hospitalization and ICU stay [10].

3. Results

3.1. Demographic Characteristics of the Patients

Of 617,020 observations, 364,904 (59.1%) are COVID-19 cases. Table 1 shows that the distributions of sex, race, and education in both groups (COVID-19 and non-COVID-19) are comparable; also, education is missing for a great proportion of the cases. The mean age is 52.8 in non-COVID-19 cases and 59.7 in COVID cases.

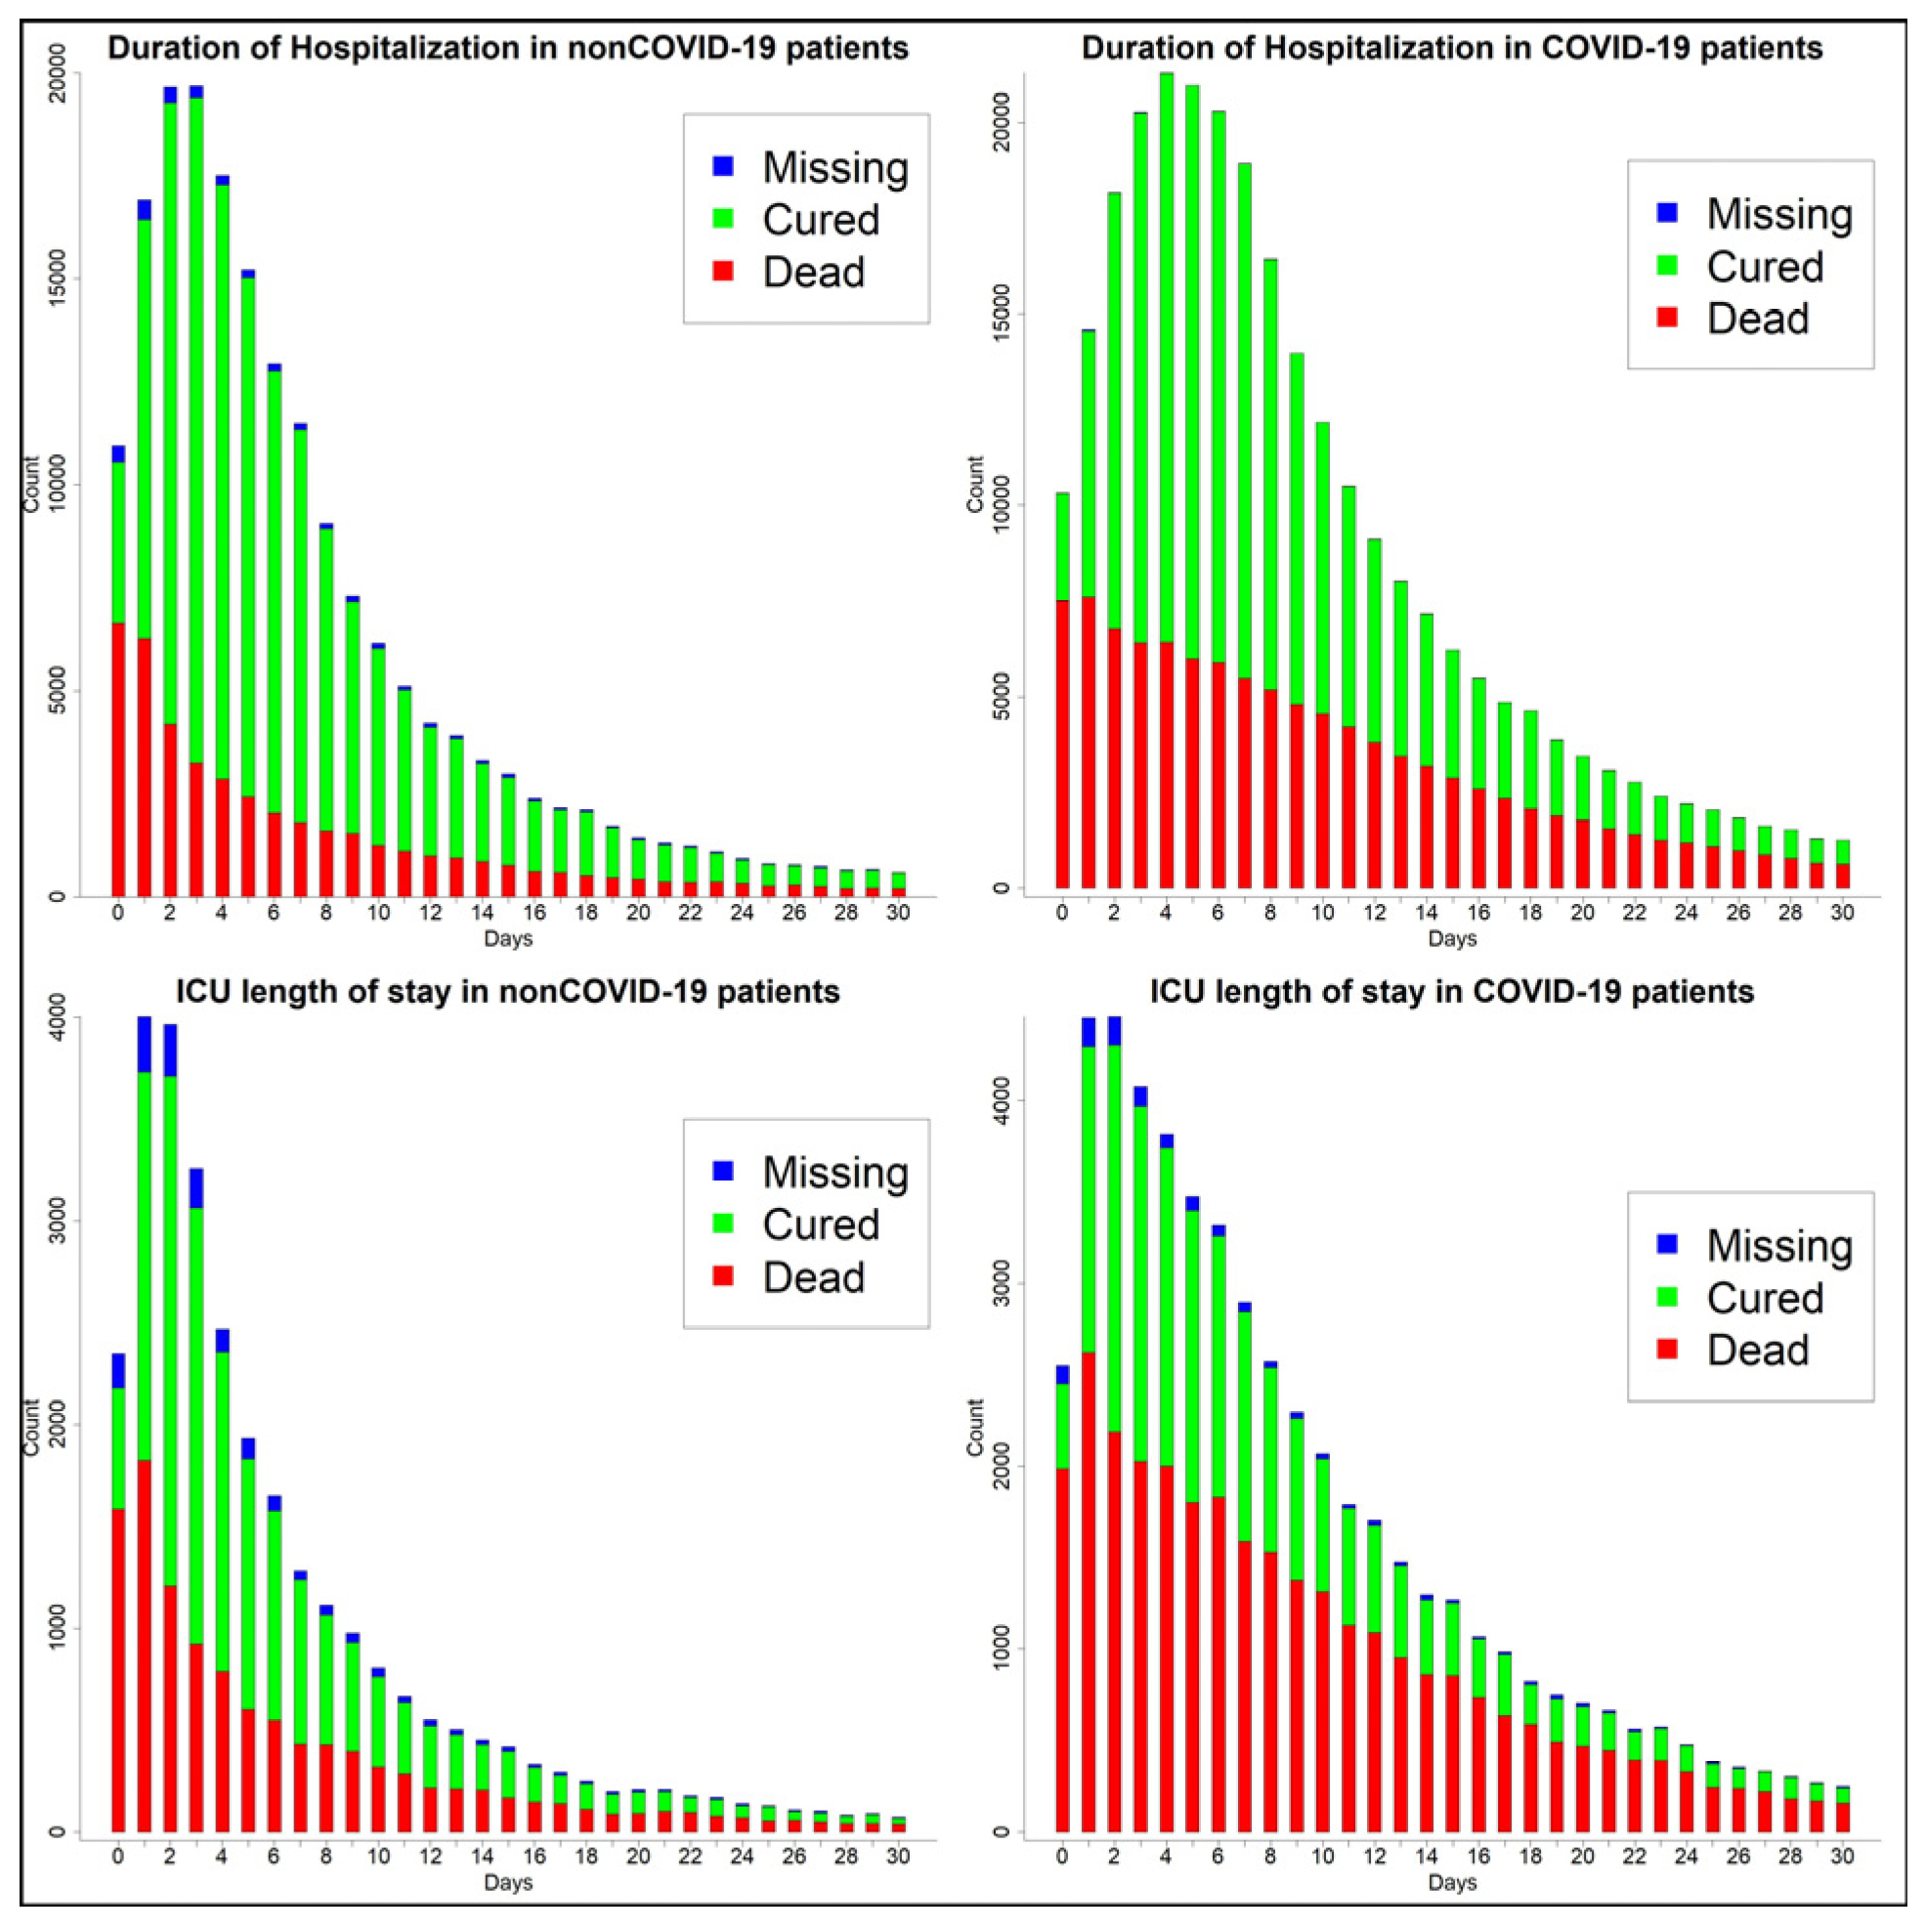
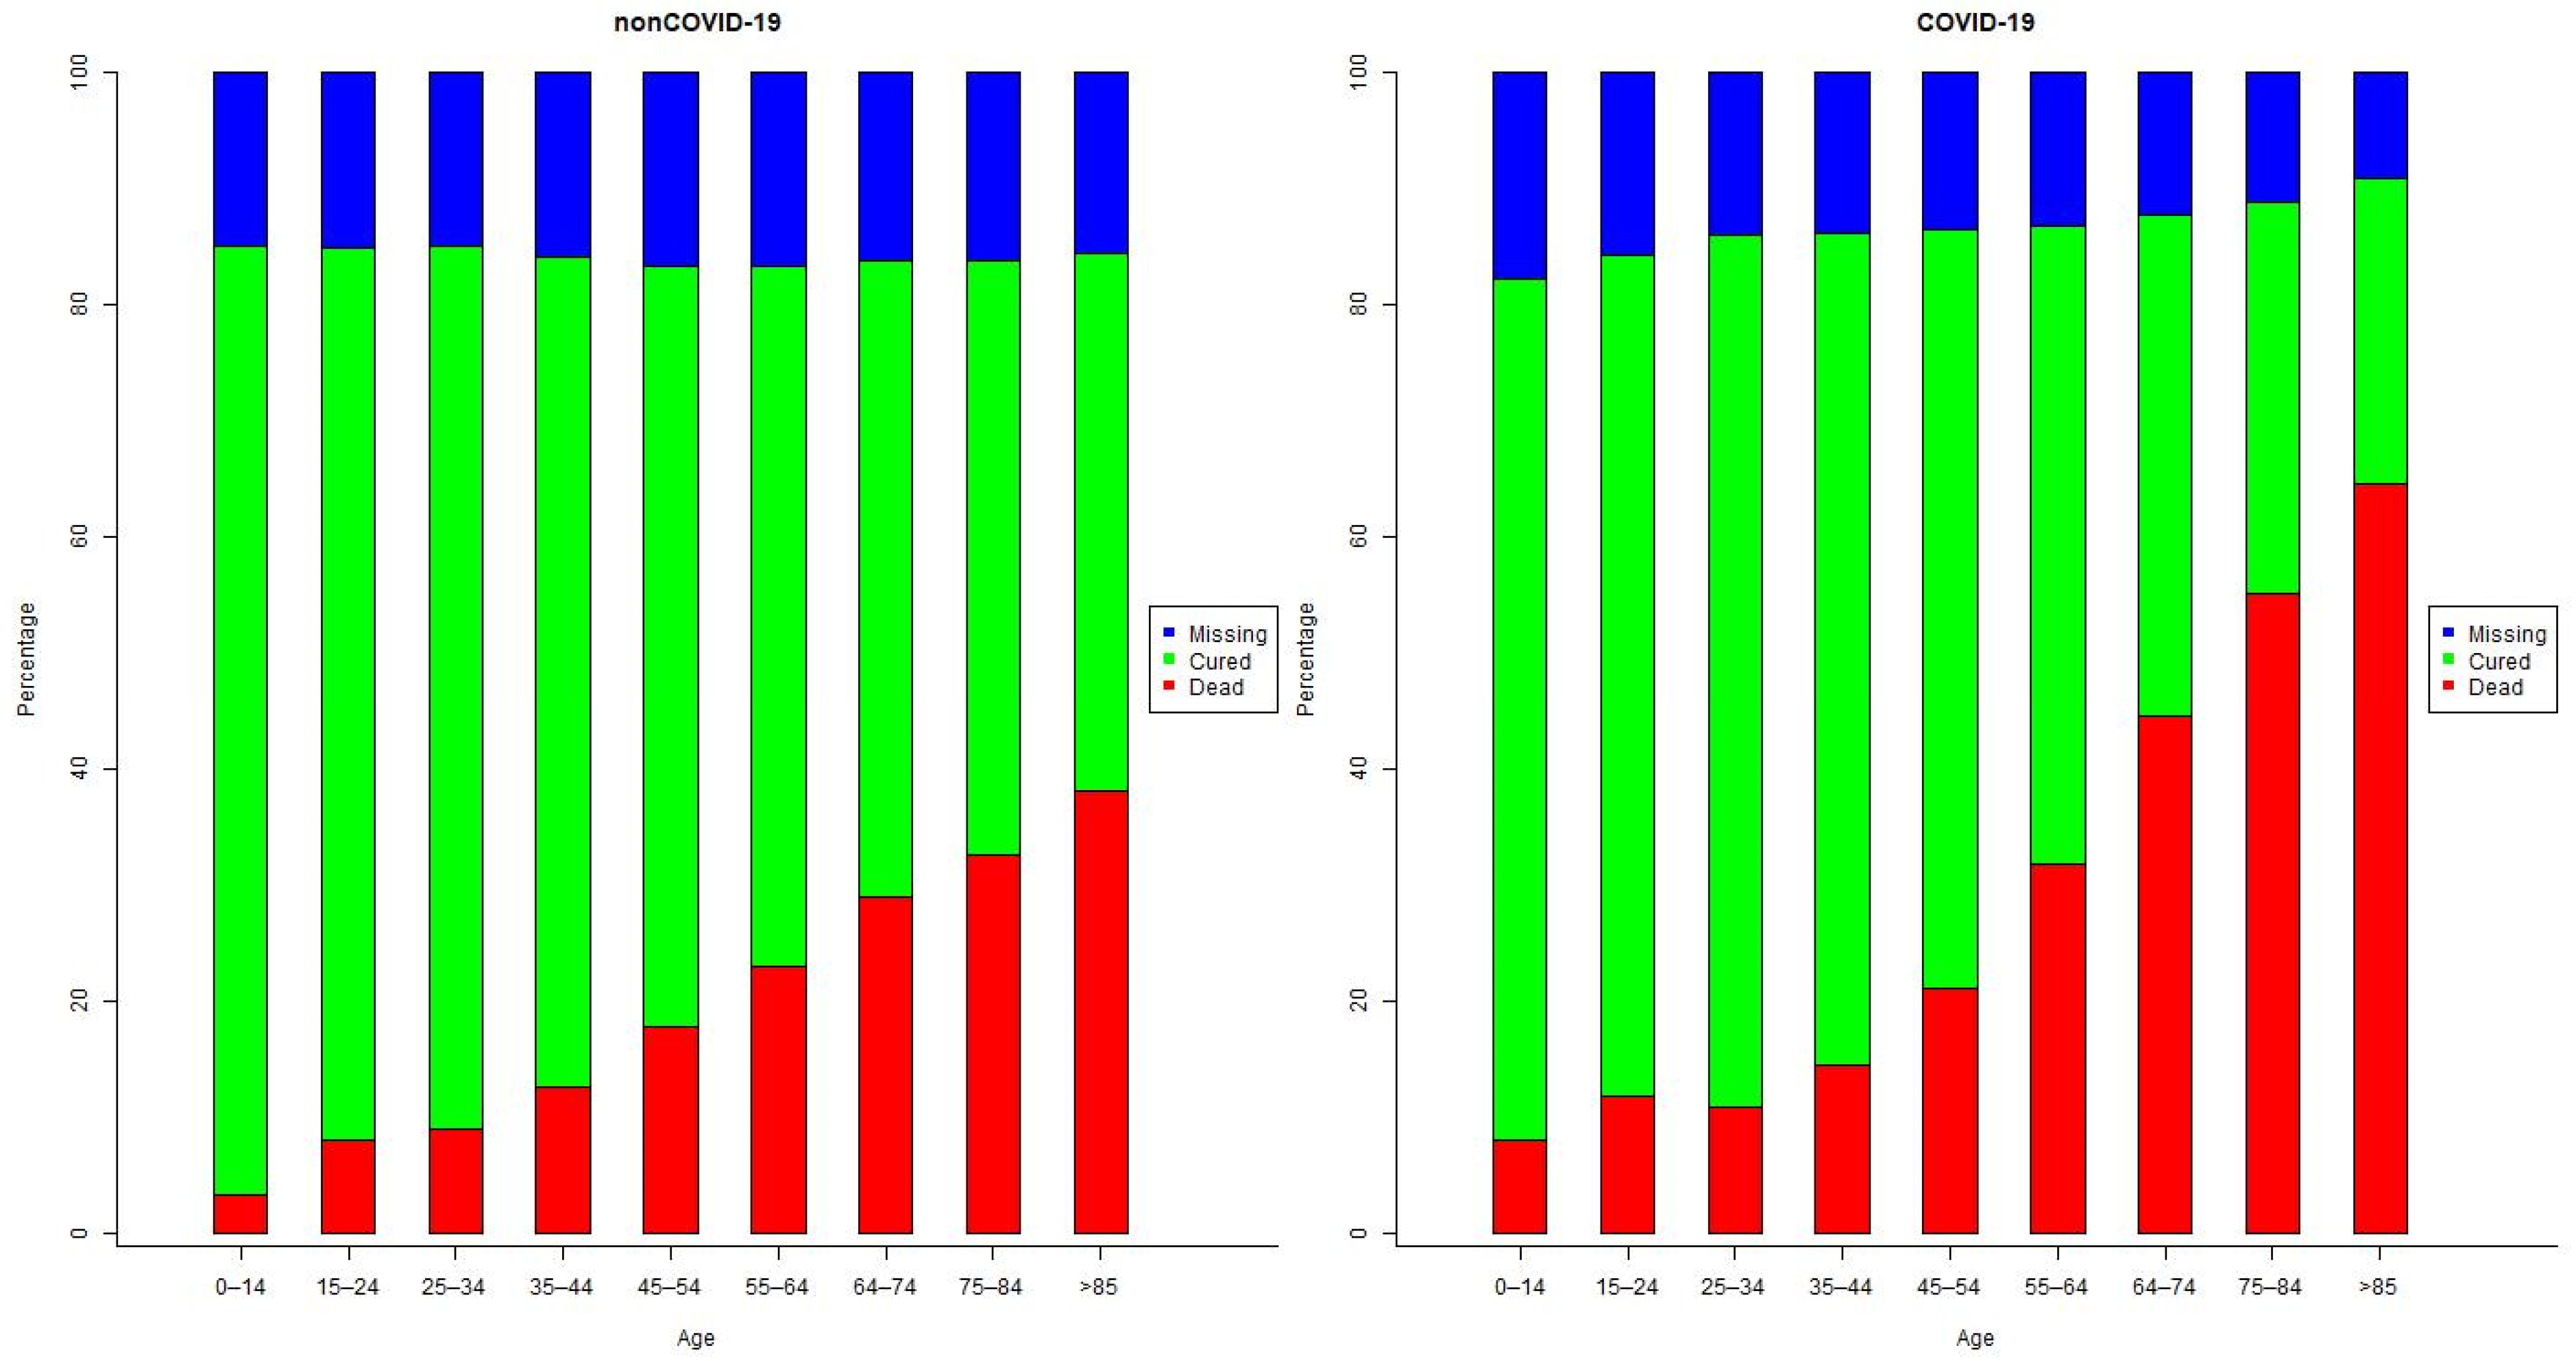
3.2. Clinical Manifestations and Outcomes by Group

Among the reported signs and symptoms in COVID-19 and non-COVID-19 groups, cough (80.6% and 74.2%), dyspnea (79.8% and 77.3%), fever (73.8% and 62.3%), respiratory discomfort (70.0% and 69.9%), O2 blood saturation <95% (69.3% and 63.5%), and abnormal Chest X-ray readings (93.8% and 85.6%) are the most common. Throat pain (25.0% and 20.6%), diarrhea (18.3% and 13.2%), and vomiting (11.1% and 13.2%) are less common. When considering the three levels of severity (asymptomatic, mild, and severe), among the COVID-19 group, the frequency is 0.05%, 8.22%, and 91.73%. Among non-COVID-19 patients, respective frequencies are 0.14%, 9.02%, and 90.8% in those patients for whom severity could be determined from the reported signs and symptoms.
Among patients for whom the case evolution is known, the proportion of death is higher in COVID-19 (40.0% vs. 25.2%). This group has a higher proportion of ICU admission (36.6% vs. 29.8%), use of non-IVS (50.4% vs. 46.4%), and use of IVS (21.2% vs. 16.8%). Considering case evolution by the epidemiological week in different subsets of the patients (Figure A1 in Appendix A), it can be observed that the death proportion is consistently higher in COVID-19 across all the subsets. In this group, the proportion of death is as high as 40% for all of them, 35% in those receiving non-IVS, 60% in those admitted to ICU, and 75–80% in those receiving IVS. Furthermore, the mean of hospitalization length (10.8 vs. 8.6 days) and ICU stay (10.2 vs. 7.3 days) is higher in the COVID-19 group. Figure A1a in Appendix A shows that the distribution of length of hospitalization and ICU stay is similar to a Poisson distribution; furthermore, the distribution in the COVID-19 group is more shifted to the right.

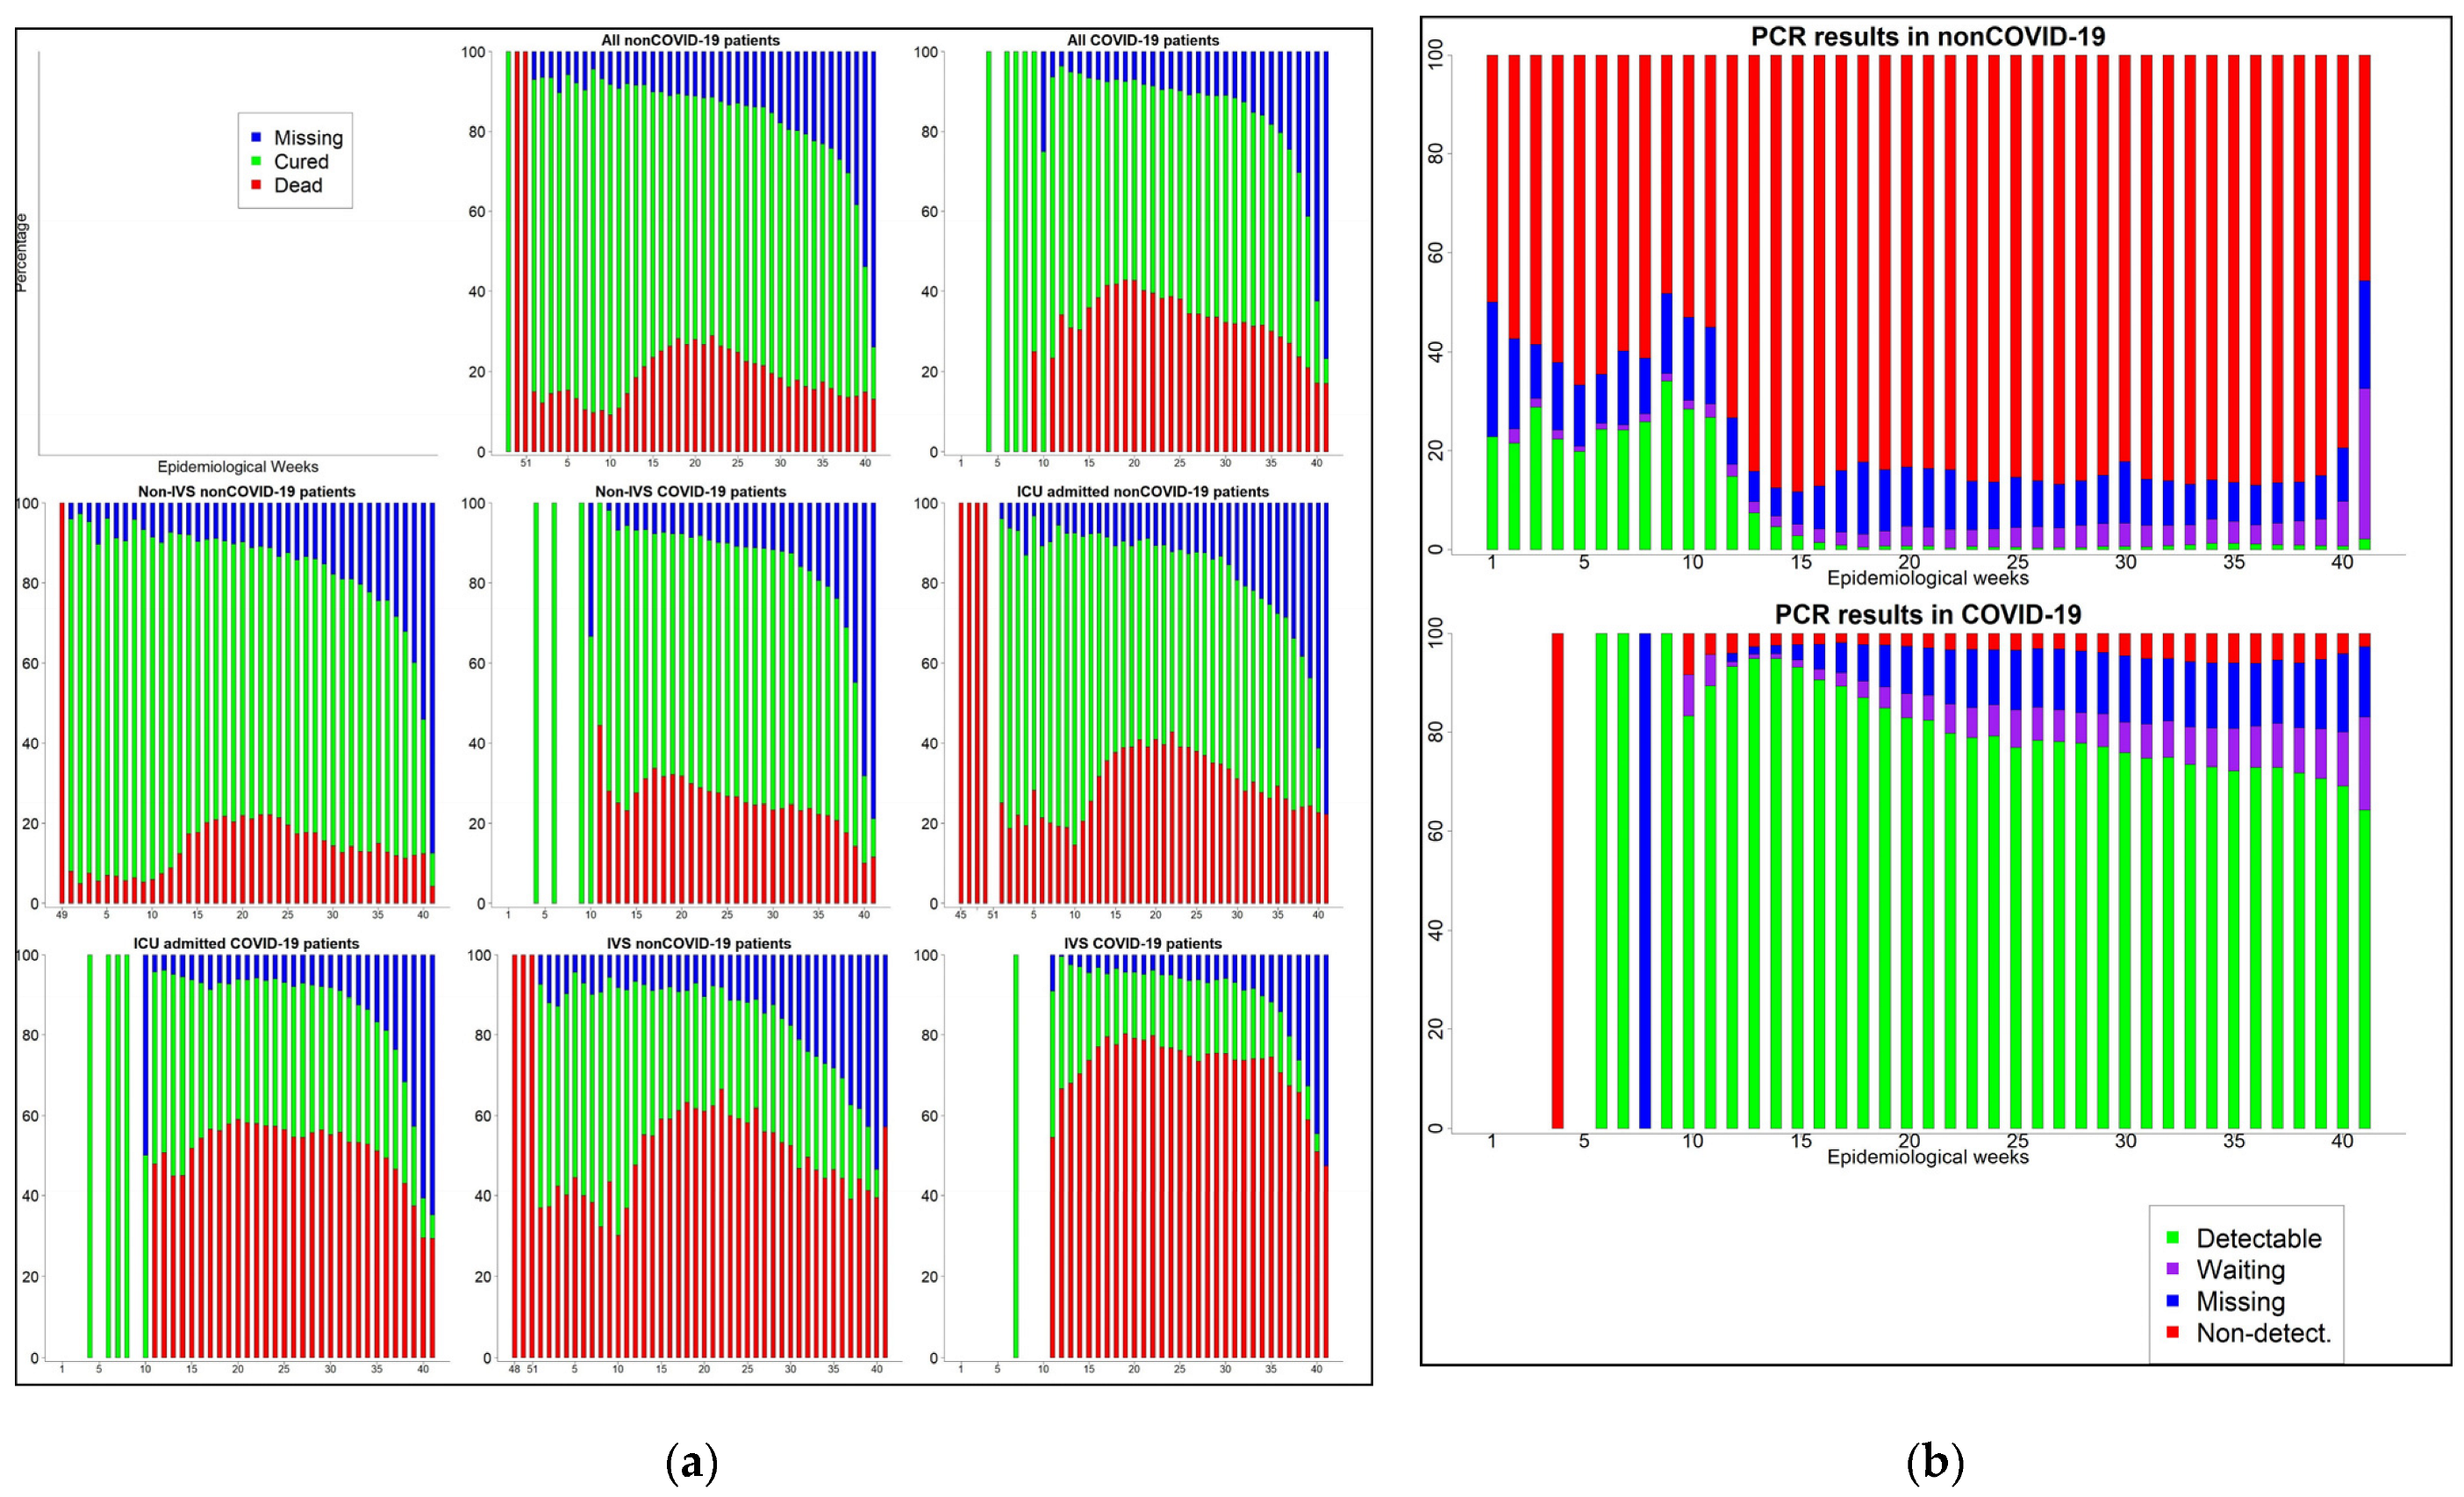
3.3. Time Trend of SARI Cases and the Performance of PCR Tests

For the same time period, non-COVID-19 case reporting has increased significantly (Figure 1) compared to the previous year (2019), raising the question of whether there is a real increase in non-COVID-19 cases or in the misdiagnosis of true COVID-19 cases. Table 2 indicates that, among non-COVID-19 patients on whom laboratory data are used for case confirmation, the proportion of PCR or other molecular biology test being nondetectable/inconclusive is high (91.9%), which is in high contrast to the COVID-19 group (2.6%). Guidelines for case classification prioritize the laboratory results, whereas clinical and epidemiological linking (E. linking) criteria should be used when those are inconclusive/not available [11]. PCR result being nondetectable/inconclusive in non-COVID-19 suggests the presence of misdiagnosis due to the impossibility of detecting the etiologic agent.
We considered checking whether there is a difference over time in the proportion of PCR and molecular biology tests being nondetectable/inconclusive. Figure A1b in the Appendix A shows that there is not a noticeable difference in the proportion of test results being Detectable and Inconclusive/nondetectable among both COVID-19 and non-COVID-19 groups. Furthermore, the contrast of the proportion of tests that are inconclusive/nondetectable between the COVID-19 and non-COVID-19 groups remains high during the entire time period, with the proportion of inconclusive/nondetectable test results being considerably high in non-COVID-19.
Trying to explore the factors that may be affecting the result of PCR test, we ran a logistic regression model with education as a predictor, adjusting for age and sex. The odds of having a nondetectable/inconclusive result vs. detectable are 2.89 times higher [2.77, 3.01] in no education category, 2.32 times higher [2.24, 2.40] in fundamental 1st cycle, 1.67 times higher [1.61, 1.73] in fundamental 2nd cycle, and 1.25 times higher [1.21, 1.29] in high school as compared to university (reference). Similar effect sizes were observed when repeating the same model, including race. It is important to note that, for a considerable proportion of patients, education is missing. However, findings are consistent with another analysis applying a different methodology to an earlier data release and showing a positive relationship between higher income and COVID-19 diagnosis [11]. This suggests that patients with lower socioeconomic status have higher chances of not having an adequate diagnosis, which would mean that the burden of the disease would be higher for them.
Although it has been stated that molecular diagnostic technology has been considered crucial in the prevention of the virus [3], we were also interested in the effect it could have on the case evolution. We ran a logistic regression model to estimate the effect of PCR result on dying from SARI while adjusting for the effect of age, sex, and severity. In the COVID-19 group, the odds of dying were 5% lower (CI [−9%, −1%]) in nondetectable/inconclusive and 5% higher in waiting (CI [1%, 8%]) as compared to the reference category of detectable result. Meanwhile, in the non-COVID-19 group, the odds of death were 28% higher (CI [16%, 41%]) in nondetectable/inconclusive and 65% higher (CI [47%, 85%]) in waiting as compared to PCR test being detectable. This suggests that the patients who have nondetectable/inconclusive and waiting PCR results and are classified as non-COVID-19 have increased odds of death, suggesting that the level of care and attention they receive is not adequate.

3.4. Comorbidities and Their Effect on Outcomes

In the COVID-19 group, there is a higher proportion of heart disease (33.4% vs. 29.4%), diabetes (25.2% vs. 18.9%), and obesity (4.7% vs. 22.6%); there is a lower proportion of lung disease (3.6% vs. 7.4%), asthma (2.6% vs. 5.7%), and immunosuppression (2.6% vs. 4.5%). Renal disease and liver disease are present in 4% and 1% of the cases in both groups. Overall, 51.6% of COVID-19 cases and 49.7% of non-COVID-19 cases have at least one comorbidity.
We checked the presence of comorbidities and the case severity among patients classified as COVID-19, and the results are presented in Table 3. Chronic heart diseases are present in 32.9% of the asymptomatic, 21.19% of mild, and 33.31% of severe cases. Diabetes is the next most common comorbidity, with a presence of 17.29%, 16.37%, and 23.59% in each group. Chronic lung diseases were present in 1.3%, 1.76%, and 5.62% of each case severity group, respectively. The rest of the comorbidities have a relatively lower frequency of presence in each of the severity categories considered.
Figure A3 shows that older age groups have a higher proportion of having death as case evolution, with the COVID-19 group having a higher death proportion consistently across all the age groups. In the non-COVID-19 group, the proportion of deaths is 3.2% in age group 0–14 and is 38.1% in age group >85 years old. Meanwhile, in COVID-19, the proportion of death as case outcome is 8.0% for age group 0–14 and 64.6% in patients aged >85 years old. Table A1 shows that case evolution by sex and group. The proportion of males who had death as case evolution is 54.6% in non-COVID-19, showing a balance between gender. However, when considering deaths among COVID-19 group, the proportion of males is 58.0%.
Table 4 displays the results of binary logistic regression for the effect of presence of COVID-19, case severity, and comorbidities on outcomes. The models show that COVID-19 and severe SARI cases have increased odds of worse outcomes (being admitted to ICU, needing non-IVS and IVS, and dying. The frequency of asymptomatic cases is very low, and this could be a reason for the increased odds of worse outcomes in them.
Heart disease, lung disease, immunosuppression, renal disease, liver disease, diabetes, and obesity also have higher odds of worse outcomes. Patients suffering from asthma and females have lower odds of bad outcomes. With the increase in age, the odds of bad outcomes increase. There are no differences when considering race; however, it is worth noting that the odds of dying are 30% lower in White people compared to Black people. Poisson regression showed that there is a significant increase in the length of hospitalization and ICU stay of 30% and 40% in COVID-19 patients and a decrease by 10% and 7% in asthma patients; the effects of other variables were not clinically significant. The analysis suggests that asthma plays a protective role, which research shows to be biologically plausible [12].

4. Discussion

This is an observational study utilizing data generated from surveillance which are subject to errors. For example, the record sheet requires the reporting of chronic diseases, but some observations report congenital heart disease as chronic heart disease; this may explain some of the reported effect sizes. Missing data is another issue present in the dataset.

5. Conclusions

It is important to obtain insights and characterize the development and nature of the pandemic in Brazil, as the analysis suggests the presence of misdiagnosis of COVID-19, with proportion of inconclusive tests being high during the time under consideration. Correct diagnosis is important in the mitigation of the pandemic as well as disease outcomes for the patients. Our analysis and other research works suggest that patients who have lower socioeconomic status are less likely to be properly diagnosed, which suggests that the burden of the disease is higher for them. Lastly, our analysis sheds light on the effect of comorbidities (such as chronic heart and lung diseases, diabetes, and obesity) and supports the protective effect of asthma, whose biologic mechanism is established by other research works [12].

Author Contributions

K.E.P. contributed to the conceptualization, methodology, supervision, project administration, writing—review and editing. M.K. contributed to data curation, investigation, software, validation, formal analysis, visualization, and writing—original draft preparation. All authors have read and agreed to the published version of the manuscript.

Funding

This research received no external funding.

Institutional Review Board Statement

AN IRB approval was not relevant for our study since we are utilizing a publicly available dataset which does not contain privileged information.

Informed Consent Statement

We are not the primary data collectors and we have no responsibility regarding patient assessment and/or care, data reporting and entry.

Data Availability Statement

The data used for this research work were publicly available and accessed from http://plataforma.saude.gov.br/coronavirus/dados-abertos/.

Acknowledgments

The authors would like to thank Aurela Nikaj for proofreading the draft of the manuscript.

Conflicts of Interest

The authors declare no conflict of interest.

Appendix A

Figure A1. (a) Case evolution by epidemiological week and groups (b) PCR test results by epidemiological week and groups.
Msf 04 00037 g0a1
Table A1. Severity determination.
None of BelowAt Least One of BelowSeverity
a, b, c, d, e, f, g, h, i-Asymptomatic
f, g, h, ia, b, c, d, eMild
f, g, h, iSevere
a: Fever; b: Cough; c: Throat pain; d: Diarrhea; e: Vomitting; f: Dyspnea; g: Resp. discomfort.; h: O2 Sat. <95%; i: Abnormal chest X-ray.
Figure A2. Hospitalization and ICU stay length.
Msf 04 00037 g0a2
Table A2. Case evolution by sex.
Non-COVID-19COVID-19
Dead (%)Cured (%)Missing (%)Dead (%)Cured (%)Missing (%)
Male29,102 (54.58)82,240 (51.85)21,441 (53.35)73,964 (58.04)106,905 (55.89)25,967 (56.21)
Female24,200 (45.39)76,290 (48.1)18,729 (46.6)53,440 (41.94)84,326 (44.09)20,218 (43.76)
Missing14 (0.03)80 (0.05)20 (0.05)26 (0.02)46 (0.02)12 (0.03)
Total53,316158,61040,190127,430191,27746,197
Figure A3. Case Evolution by age group.
Msf 04 00037 g0a3

References

  1. Gorbalenya, A.E.; Baker, S.C.; Baric, R.S.; de Groot, R.J.; Drosten, C.; Gulyaeva, A.A.; Haagmans, B.L.; Lauber, C.; Leontovich, A.M.; Neuman, B.W.; et al. The species Severe acute respiratory syndrome-related coronavirus: Classifying 2019-nCoV and naming it SARS-CoV-2. Nat. Microbiol. 2020, 5, 536–544. [Google Scholar] [CrossRef] [Green Version]
  2. Dhama, K.; Khan, S.; Tiwari, R.; Sircar, S.; Bhat, S.; Malik, Y.S.; Singh, K.P.; Chaicumpa, W.; Bonilla-Aldana, D.K.; Rodriguez-Morales, A.J. Coronavirus Disease 2019-COVID-19. Clin. Microbiol. Rev. 2020, 33. [Google Scholar] [CrossRef] [PubMed]
  3. Li, N.; Wang, P.; Wang, X.; Geng, C.; Chen, J.; Gong, Y. Molecular diagnosis of COVID-19: Current situation and trend in China (Review). Exp. Ther. Med. 2020, 20, 13. [Google Scholar] [CrossRef] [PubMed]
  4. Guglielmi, G. The explosion of new coronavirus tests that could help to end the pandemic. Nature 2020, 583, 506–509. [Google Scholar] [CrossRef] [PubMed]
  5. Hallal, P.C.; Hartwig, F.P.; Horta, B.L.; Silveira, M.F.; Struchiner, C.J.; Vidaletti, L.P.; Neumann, N.A.; Pellanda, L.C.; Dellagostin, O.A.; Burattini, M.N.; et al. SARS-CoV-2 antibody prevalence in Brazil: Results from two successive nationwide serological household surveys. Lancet Glob. Health 2020, 8, e1390–e1398. [Google Scholar] [CrossRef]
  6. Coronavirus. Available online: http://plataforma.saude.gov.br/coronavirus/dados-abertos/ (accessed on 12 November 2020).
  7. Ficha de Registro Individual-Casos de Síndrome Respiratória Aguda Grave Hospitalizado. Available online: http://plataforma.saude.gov.br/coronavirus/dados-abertos/sivep-gripe/ficha-SIVEP-GRIPE-SRAG-hospital-Sivepgripe.pdf (accessed on 12 November 2020).
  8. Clinical Spectrum of SARS-CoV-2 Infection. Available online: https://www.covid19treatmentguidelines.nih.gov/overview/clinical-spectrum/ (accessed on 12 November 2020).
  9. Agresti, A. Logistic Regression. In An Introduction to Categorical Data Analysis; Wiley: Hoboken, NJ, USA, 2007; pp. 106–109. [Google Scholar]
  10. Agresti, A. Generalized Linear Models for Count Data. In An Introduction to Categorical data Analysis, 2nd ed.; Wiley: Hoboken, NJ, USA, 2007; pp. 74–83. [Google Scholar]
  11. de Souza, W.M.; Buss, L.F.; Candido, D.d.S.; Carrera, J.-P.; Li, S.; Zarebski, A.E.; Pereira, R.H.M.; Prete, C.A.; de Souza-Santos, A.A.; Parag, K.V.; et al. Epidemiological and clinical characteristics of the COVID-19 epidemic in Brazil. Nat. Hum. Behav. 2020, 4, 856–865. [Google Scholar] [CrossRef] [PubMed]
  12. Carli, G.; Cecchi, L.; Stebbing, J.; Parronchi, P.; Farsi, A. Is asthma protective against COVID-19? Allergy 2021, 76, 866–868. [Google Scholar] [CrossRef] [PubMed]
Figure 1. SARI cases reported on SIVEP Gripe by epidemiological week
Msf 04 00037 g001
Table 1. Demographic characteristics.
VariableCategoriesCOVID-19 (%)Non-COVID-19 (%)
SexMale206,836 (56.7)132,783 (52.7)
Female157,984 (43.3)119,219 (47.3)
Missing84114
RaceWhite17,771 (6.5)13,024 (6.6)
Black124,863 (45.8)98,909 (50.3)
Other129,858 (47.7)84,559 (43.0)
Missing92,41255,624
EducationNo education10,194 (8.1)10,203 (12.1)
1st cycle35,244 (28.0)28,773 (34.0)
2nd cycle23,557 (18.7)15,649 (18.5)
High school39,030 (31.0)21,615 (25.6)
University18,111 (14.36)8335 (9.86)
Missing238,768167,541
Table 2. Crosstabulation of confirmation criteria and the PCR.
CriteriaDetectableNot Detect/Inconcl.WaitingMissingTotal
COVID-19 Lab.282,206 (83.1)8731 (2.6)17,593 (5.2)31,040 (9.1)339,570 (93.1)
E. Linking178 (7.8)272 (11.8)651 (28.3)1196 (52.1)2297 (0.6)
Clinical407 (5.5)1004 (13.6)1596 (21.6)4398 (59.4)7405 (2.0)
Other162 (2.3)3576 (51.6)1004 (14.5)2185 (31.5)6927 (1.9)
Missing4474 (51.4)432 (5.0)1868 (21.5)1931 (22.2)8705 (2.4)
Non-COVID-19 Lab4771 (2.2)203,640 (91.9)5721 (2.6)7404 (3.3)221,536 (87.9)
E. Linking0 (0.0)498 (20.9)332 (13.9)1553 (65.2)2383 (0.9)
Clinical13 (0.1)2432 (13.6)2025 (11.3)13,452 (75.1)17,922 (7.1)
Other0 (0.0)354 (50.4)77 (11.0)271 (38.6)702 (0.3)
Missing105 (1.1)6082 (63.5)1424 (14.9)1962 (20.5)9573 (3.8)
Table 3. Presence of comorbidities by case severity among COVID-19 patients.
Severity
Asymptomatic (%)Mild (%)Severe (%)Missing
Chronic Heart diseases
Yes177 (32.9)10,756 (21.19)180,798 (33.31)4145 (18.13)
No361 (67.1)40,008 (78.81)362,054 (66.69)18,721 (81.87)
Chronic Lung diseases
Yes7 (1.3)894 (1.76)30,530 (5.62)401 (1.75)
No531 (98.7)49,870 (98.24)512,322 (94.38)22,465 (98.25)
Diabetes
Yes93 (17.29)8311 (16.37)128,058 (23.59)3056 (13.36)
No445 (82.71)42,453 (83.63)414,794 (76.41)19,810 (86.64)
Asthma
Yes8 (1.49)913 (1.8)22,619 (4.17)222 (0.97)
No530 (98.51)49,851 (98.2)520,233 (95.83)22,644 (99.03)
Immunodeficiency
Yes29 (5.39)1905 (3.75)18,308 (3.37)534 (2.34)
No509 (94.61)48,859 (96.25)524,544 (96.63)22,332 (97.66)
Chronic Renal diseases
Yes22 (4.09)1828 (3.6)24,458 (4.51)714 (3.12)
No516 (95.91)48,936 (96.4)518,394 (95.49)22,152 (96.88)
Chronic Liver diseases
Yes8 (1.49)474 (0.93)5,714 (1.05)176 (0.77)
No530 (98.51)50,290 (99.07)53,7138 (98.95)22690 (99.23)
Obesity
Yes11 (2.04)976 (1.92)22,390 (4.12)359 (1.57)
No527 (97.96)49,788 (98.08)520,462 (95.88)22,507 (98.43)
Table 4. Effect of comorbidities, VS, age, race, and sex on outcome variables.
ICU AdmissionNon-IVS vs. No VSIVS vs. No VSDead vs. Cured
βORβORβORβOR
COVID-19 *0.27c1.310.27 c1.310.39 c1.470.62 b1.85
VS * -Non-IVS ------0.37 b1.45
-IVS------2.70 c14.9
Severity §
Asymp.1.06 c2.9−0.060.941.012.76−0.32 c0.74
Severe0.65 c1.911.584.841.846.340.45 c1.56
Heart dise.*0.23 c1.260.26 c1.30.3 c1.35−0.03 b0.97
Lung dise. *0.24 c1.270.28 c1.320.47 c1.610.08 c1.08
Diabetes *0.181.190.14 c1.150.3 c1.360.15 c1.16
Asthma *−0.16 c0.850.26 c1.29−0.040.96−0.33 c0.72
Immunosu. *0.27 c1.31−0.020.980.28 c1.320.77 c2.17
Renal dise. *0.48 c1.62−0.05 a0.950.32 c1.380.47 c1.6
Liver dise. *0.33 c1.4−0.060.940.381.460.68 c1.97
Obesity *0.48 c1.620.33 c1.380.68 c1.980.13 c1.14
Age0.011.010.011.010.02 c1.020.041.05
Female −0.110.89−0.06 c0.94−0.18 c0.83−0.160.85
Race  -White0.08 c1.090.011−0.11 a0.9−0.360.7
-Other0.00110.00110.051.060.061.06
OR: Odds Ratio. Β: coefficient. p-values a: <0.05; b: <0.01; c: <0.001. Ref. cat. *: No; §: Mild; : Male; : Black.
Publisher’s Note: MDPI stays neutral with regard to jurisdictional claims in published maps and institutional affiliations.

