Systematic Review

The Effect of Plant-Based and Mycoprotein-Based Meat Substitute Consumption on Cardiometabolic Risk Factors: A Systematic Review and Meta-Analysis of Controlled Intervention Trials

1
Division of Health Sciences, Warwick Medical School, University of Warwick, Coventry CV4 7LA, UK
2
Department of Politics and International Studies, University of Warwick, Coventry CV4 7LA, UK
*
Author to whom correspondence should be addressed.
Dietetics 2023, 2(1), 104-122; https://doi.org/10.3390/dietetics2010009
Submission received: 30 October 2022 / Revised: 31 January 2023 / Accepted: 28 February 2023 / Published: 8 March 2023

Abstract

:
Background: Climate change is a serious threat to human wellbeing and development. Global reduction of meat intake is key to addressing climate change and other modern sustainability challenges. Plant-based and mycoprotein-based meat substitutes are predicted to play a key role in the reduction of meat intake; however, their impact on human health is unclear. The main objective of this meta-analysis was to assess the short-term effects of meat substitutes on important cardiometabolic biomarkers (total cholesterol, TC; LDL-cholesterol, LDL-C; HDL-cholesterol, HDL-C; triglycerides, TG; systolic blood pressure, SBP; diastolic blood pressure, DBP; fasting blood glucose, FBG; weight) in controlled clinical trials. Methods: Embase and MEDLINE were searched to identify controlled clinical trials with meat substitute interventions and cardiometabolic biomarker outcomes. Standardised mean differences in TC, LDL-C, HDL-C, TG, FBG, SBP, DBP, and weight and 95% confidence intervals were pooled using a random effects model. Risk of bias, heterogeneity, sensitivity, and publication bias were assessed. Of the 934 records identified, 12 studies met the inclusion criteria. In the pooled analyses, the consumption of meat substitutes was associated with significantly lower TC (−0.50 mmol/L [95% CIs −0.70, −0.29]), LDL-C (−0.39 mmol/L [−0.57, −0.21]), and TG (−0.15 mmol/L [−0.29, −0.01]), non-significantly lower FBG (−0.08 [−0.23, 0.08]), SBP (−0.32 [−1.79, 1.41]), and weight (−0.12 [−1.52, 1.27]), and non-significantly higher HDL-C (0.01 [−0.02, 0.05]) and DBP (0.49 [−0.30, 1.28]). There was evidence of publication bias, and some heterogeneity was detected. The certainty of evidence was moderate for the TC and HDL-C results, low for the LDL-C, TG, SBP, DBP, and weight results, and very low for the FBG results. Conclusions: Replacement of some or all meat with plant-based or mycoprotein-based substitutes may lower TC, LDL-C, and TG.

1. Introduction

The consensus that reducing meat and increasing plant consumption is a key component of addressing current and future health and sustainability challenges is ever-growing [1]. Switching to plant-based diets (PBDs) is estimated to reduce diet-related land use by 76% and diet-related greenhouse gas emissions by 49%; however, a plethora of socio-economic barriers prevent people from transitioning to such diets [2]. The largest consumer-perceived barrier preventing people from adopting PBDs is meat appreciation [3]. Plant-based and mycoprotein-based products have been developed to resemble meat and match the taste, structure, and nutritional value preferences of meat eaters in a bid to make the switch less difficult. The composition of plant-based meat substitutes varies greatly, but they are most commonly derived from soy, wheat, or pea protein isolates. Plant-based meat substitute products form a spectrum based on the level of similarity to meat and level of processing. Products that closely imitate meat are often highly processed with products like Beyond Meat’s Beyond Burgers classified as ultra-processed foods [4]. On the other hand, there are minimally processed products, such as textured soy protein (TSP), which mimic the texture and nutritional value of meat in terms of protein content but poorly replicate other aspects of the eating experience, e.g., taste [5]. The development of mycoprotein was not initially motivated by the search for a sustainable meat analogue but instead was triggered by the idea of somehow converting waste starch from the cereal industry into protein for populations suffering famine in Asia [6]. Surplus starch was sprayed on fields which selected for microorganisms that could use starch as a substrate. A fungus, Fusarium venenatum, was identified and it was later discovered that mycoprotein could be derived from the mycelium of the fungi. The sale of mycoprotein products began in 1985 in the UK and in 2001 the FDA recognised mycoprotein as generally safe [6].
It is unclear whether plant-based diets (PBDs) containing large quantities of meat substitutes would have the same beneficial cardiovascular and metabolic effects as PBDs based on unprocessed plant foods. Several clinical trials have been conducted with the aim of assessing the impact of plant-based and mycoprotein-based meat substitutes on cardiometabolic biomarkers; however, their results have never been subject to meta-analysis. For the first time in the literature, we will perform a systematic review and multiple meta-analyses on the effect of meat substitute consumption on total cholesterol (TC), LDL-cholesterol (LDL-C), HDL-cholesterol (HDL-C), triglycerides (TG), fasting blood glucose (FBG), systolic and diastolic BP (SBP and DBP), and weight.

2. Materials and Methods

The Preferred Reporting Items for Systematic reviews and Meta-Analyses guidelines for randomised controlled trials were followed during the production of the present meta-analysis [7].

2.1. Data Sources and Search Strategy

We undertook a computerised systematic search to find studies investigating the effect of meat substitute consumption on cardiometabolic risk factors. On 12 September 2022, we searched the following electronic databases limited to randomised controlled trials (RCTs) or controlled trials published in the English language since the inception of each database: Embase (1947–2021) and MEDLINE (1946–2021). We used broad ‘meat substitute’ terms including plant-based meat, meat alternative, mycoprotein, and textured vegetable protein, to maximise discovery. The electronic search strategy is presented in the supplement (Supplementary Table S1).

2.2. Study Selection

For inclusion, a study had to fulfil the following criteria: first, it must be an original published article; second, the age of the participants must be at least 18 years; third, they must have meat substitution as the intervention, i.e., partial or complete replacement of calories derived from meat with calories from plant-based or mycoprotein based meat alternatives; fourth, they must have cardiometabolic risk factors, e.g., BP, plasma lipids, or FBG, as outcomes; fifth, collection of sufficient data to calculate mean differences in outcomes between participants consuming meat substitutes and those consuming an omnivorous control diet; sixth, they must follow RCT or controlled trial study design.
Studies were excluded if multiple interventions were used, for example, meat substitute consumption in conjunction with exercise; study samples overlapped; an inappropriate control was used, for example, a meatless control diet, or uncontrolled; only meeting abstracts or only unpublished material available. There were no restrictions regarding sex, race, sample size, sample health status, or publication date. In instances where multiple papers were published on data from the same study, we only included the one with the most up-to-date information regarding the relevant outcome.

2.3. Data Extraction and Risk of Bias Assessment

Two reviewers (J.G. and G.L.) independently extracted the data. Disagreements about the inclusion of studies were resolved by arbitration between co-authors. From a total of 934 records, 559 studies were identified after duplicates had been removed (Figure 1). Title and abstract screenings were facilitated by Covidence software. A total of 523 studies were excluded as a result of the screening process. Full-text assessment of 36 studies revealed 15 studies suitable for meta-analysis. Relevant data included data regarding TC concentration, LDL-C concentration, HDL-C concentration, TG concentration, FBG concentration, BP, body weight, and associated variance measures; first authors’ surname, publication year, and country of origin; sample size, design, and duration of study; baseline characteristics of sample including mean age, sex, and BMI; and type of intervention and control diet. Mean values were calculated for baseline participant characteristics. We evaluated the risk of bias coupled with the method of random sequence generation, allocation concealment, blinding, selective reporting, loss to follow up, and completeness of reported outcome data.

2.4. Intervention

Meat substitutes were defined as plant-based or mycoprotein-based products that aim to replicate the texture, taste, appearance, or chemical characteristics of an animal-derived meat. The interventions under investigation involved replacing some or all calories derived from animal meat with calories from meat substitutes. This study includes data from studies using meat substitutes derived from mycoprotein (known commercially as Quorn), pea protein (in the form of Beyond Meat), gluten, soy, and peanut protein.

2.5. Outcomes

After searching the literature, eight cardiometabolic risk factors were identified as suitable for meta-analysis. These included TC, LDL-C, HDL-C, TG, FBG, SBP, DBP, and weight. The outcomes of interest were the differences in these biomarkers between a meat substitute group and an animal meat control group after a period of intervention.

2.6. Data Synthesis and Analysis

The mean differences in the eight identified cardiometabolic risk factors between groups consuming meat substitutes or animal meat were calculated, along with the standard errors (SEs) which were determined algebraically from the reported 95% confidence interval (95% CI) or standard deviation (SD) values. Using a random effects model, the mean differences were pooled. Each study was weighted by the inverse of its variance, and the overall effect sizes and 95% CIs of the change in biomarker levels associated with the consumption of meat substitutes were calculated. The heterogeneity between studies was assessed using the I2-statistic. An I2 ≥ 50% was considered as evidence of substantial heterogeneity. Sensitivity analyses were performed to evaluate the influence of each study on the combined effects. This was achieved by omitting one study at a time from the meta-analyses and recalculating the summary effect estimates. The meta-analyses and one-study-removed analyses were conducted in Review Manager 5 (RevMan5). Random effects meta-regression was performed to determine whether age, sex, baseline body mass index (BMI), study duration, and study sample size were sources of heterogeneity. Publication bias was assessed by visual inspection of contour-enhanced funnel plots and formal testing with Begg’s and Egger’s regression tests (significance at p < 0.10) [8]. If there was evidence of publication bias, we adjusted for funnel plot asymmetry using the Duval and Tweedie trim-and-fill method [9]. The meta-regression and publication bias assessment were conducted using Stata software, version 17 (StataCorp, College Station, TX, USA).

2.7. Certainty of Evidence

The certainty of the meta-analysis findings was assessed using the Grading of Recommendations, Assessment, Development, and Evaluation (GRADE) approach. The evidence was graded as high, moderate, low, or very low certainty. All the findings were initially graded as high certainty by default due to the exclusive inclusion of controlled trials in the analyses. The certainty was then downgraded based on pre-specified criteria including risk of bias, inconsistency, indirectness, imprecision, and publication bias.

3. Results

3.1. Study Selection Process

The search strategy retrieved 934 papers. After discarding duplicates, title and abstract screening detected 36 articles (Figure 1). Twenty-one papers were excluded from the meta-analysis as a result of full text assessment. The remaining 15 papers met the inclusion criteria and were suitable for meta-analysis. Two of the papers were discovered through hand searching. The 15 papers were derived from 12 studies.

3.2. Study Characteristics and Risk of Bias

The 12 studies included in the meta-analyses were published between 1977 and 2022 (Table 1). All the studies were controlled and only one study was not randomised [10]. Three of the RCTs utilised a crossover design whilst the rest used a parallel design [11,12,13]. One of the parallel trials was blinded [14]. Three of the studies had mycoprotein (Quorn) products as the intervention [10,14,15], eight studies had plant-based meat substitute interventions, and one study had a mixture of both types of substitutes [16]. Of the included studies, 92% used random sequence generation methods with low risk of selection bias. 66% of the studies used allocation concealment methods with unclear risk of selection bias. All studies had a high risk of performance bias due to the impossibility of blinding participants to dietary interventions. 50% of the studies had a high risk of detection bias because of the absence of outcome assessor blinding. 92% of the studies showed low risk of attrition bias. 42% had a low risk of reporting bias; however, the remainder had an unclear risk as no pre-study protocols were published. Finally, 33% of the studies had a high risk of funding bias.

3.3. Pooled Effects of Meat Substitutes on Cardiometabolic Risk Factors

3.3.1. Total Cholesterol Concentration

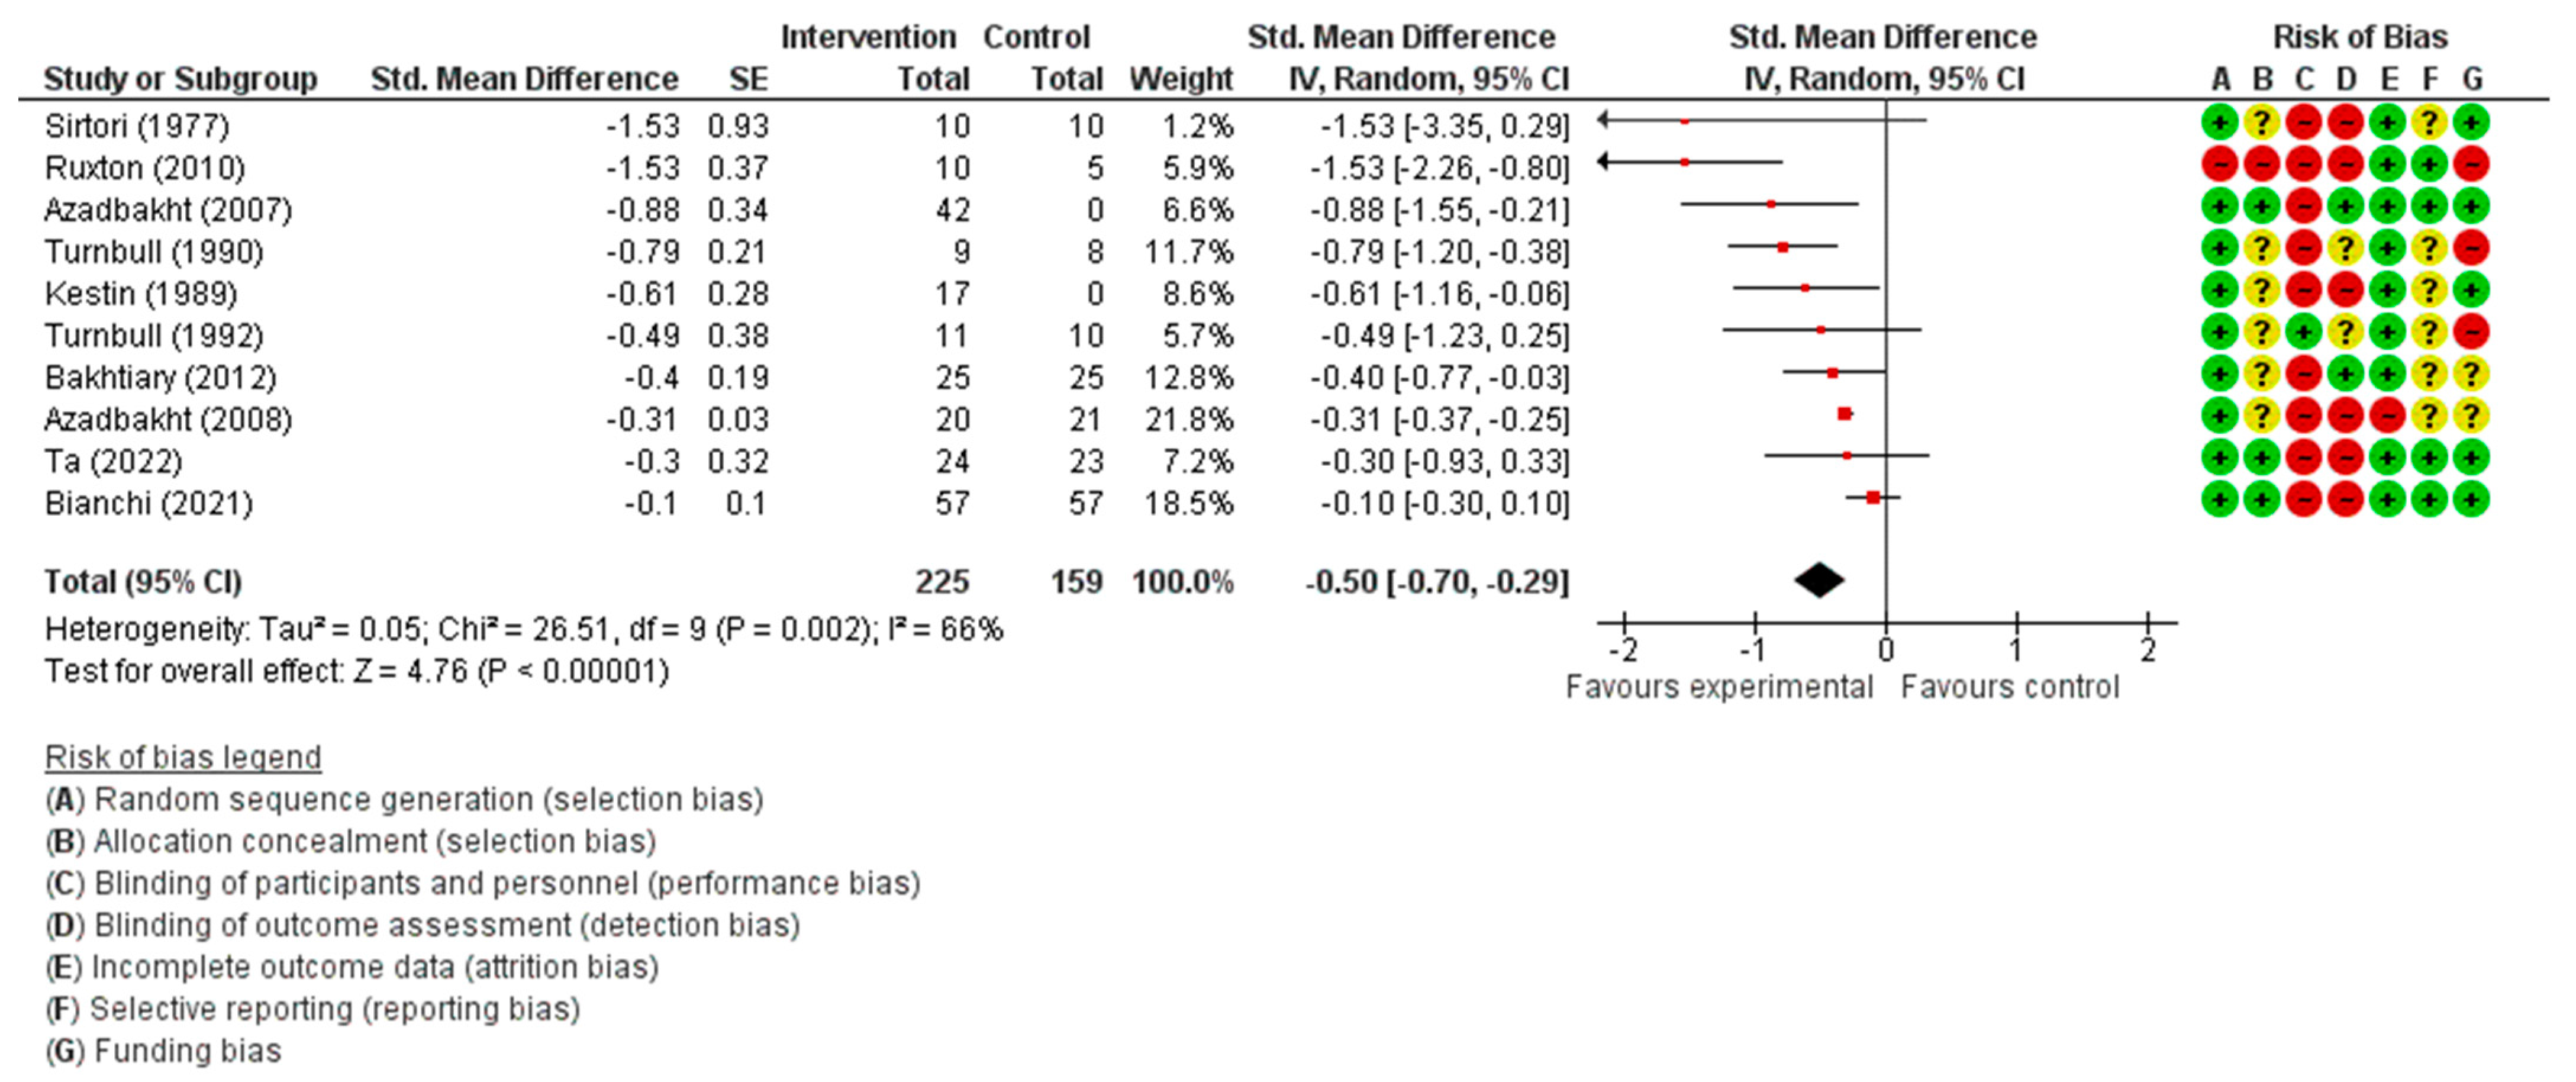
A total of 10 studies were included in this meta-analysis. The total sample size was 384 (225 in the intervention groups and 159 in the control groups; median sample size 31; range 15–114) and the mean age of the participants was 50.9 years. The median duration of the studies was 6 weeks (range 3–208 weeks). In the trials, replacement of meat with mycoprotein or plant-based meat substitutes was associated with a highly significant reduction in TC concentration (−0.50 mmol/L; 95% CI, −0.70 to −0.29; p < 0.00001; I2 = 66%; p = 0.002 for heterogeneity) compared with the consumption of comparator diets (Figure 2). In the one-study-removed sensitivity analysis, TC concentration findings had some diversity, with differences between the intervention and control groups ranging from −0.40 to −0.61 mmol/L (Supplementary Table S2). The removal of three studies [10,15,16] reduced the TC effect heterogeneity from 66 to 0% and changed the mean reduction in TC to −0.32 (−0.38 to −0.26) (Supplementary Table S3). The certainty of this evidence is moderate (Table 2).

3.3.2. LDL Cholesterol Concentration

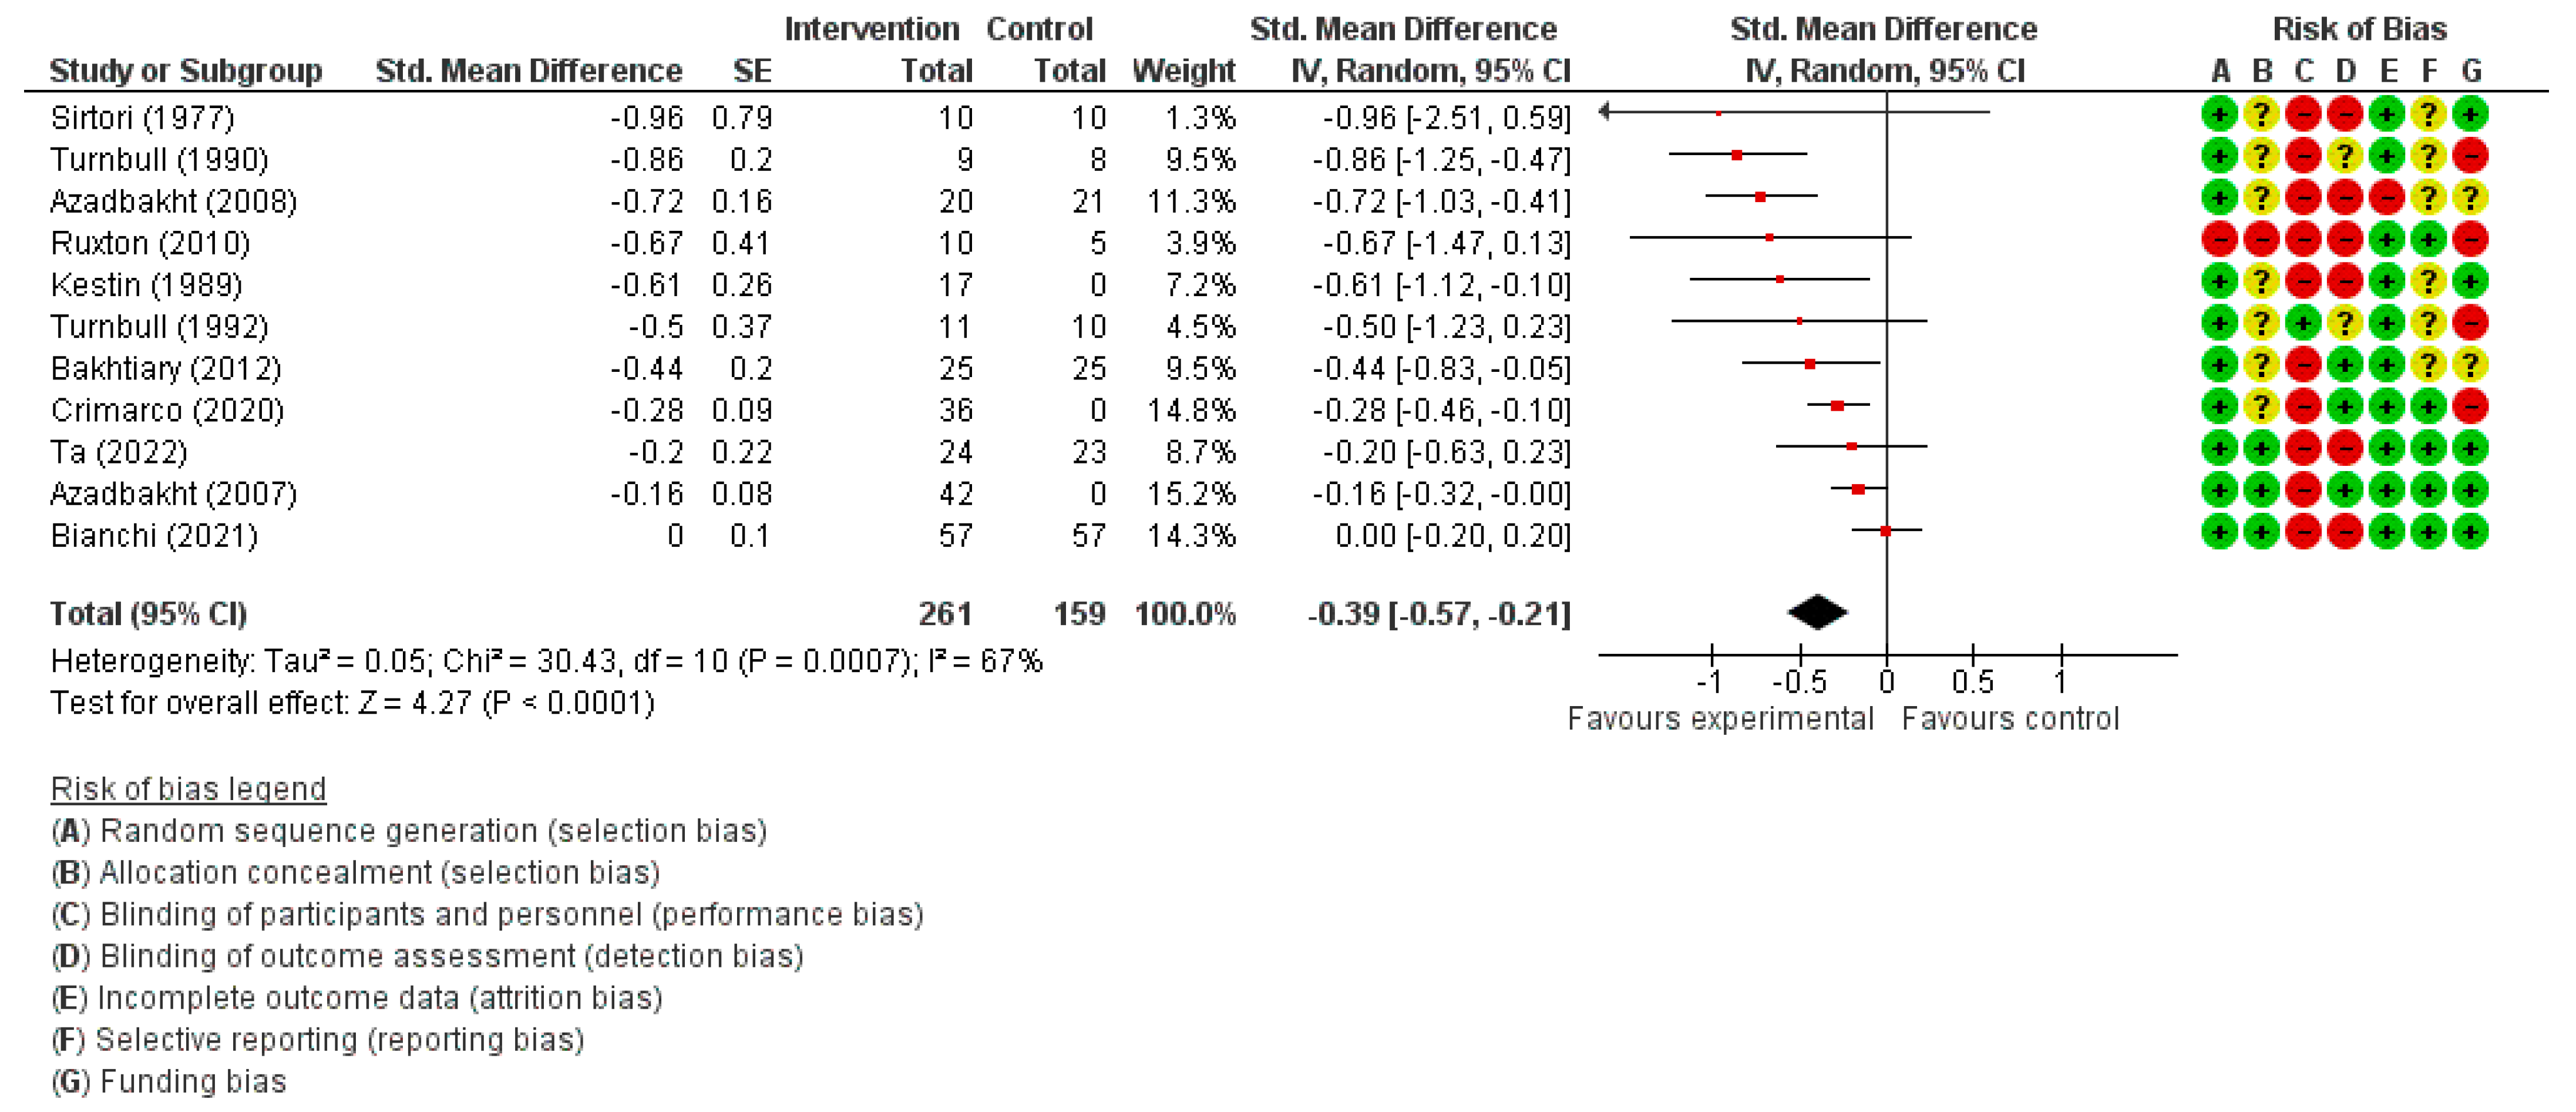
Eleven clinical trials were included in this meta-analysis. The total sample size was 420 (261 in the intervention groups and 159 in the control groups; median sample size 36; range 15–114) and the mean age of the participants was 50.8 years. The median duration of the studies was 6 weeks (range 3–208 weeks). In the trials, replacement of meat with mycoprotein or plant-based meat substitutes was associated with a highly significant reduction in LDL-C concentration (−0.39 mmol/L; 95% CI, −0.57 to −0.21; p < 0.0001; I2 = 67%; p = 0.0007 for heterogeneity) compared with the consumption of comparator diets (Figure 3). In the one-study-removed sensitivity analysis, LDL-C concentration findings had some diversity, with differences between the intervention and control groups ranging from −0.33 to −0.45 mmol/L (Supplementary Table S2). The removal of three studies [11,13,16] reduced the LDL-C effect heterogeneity from 67 to 0% and changed the mean reduction in LDL-C to −0.60 (−0.76 to −0.43) (Supplementary Table S3). The certainty of this evidence is low (Table 2).

3.3.3. HDL Cholesterol Concentration

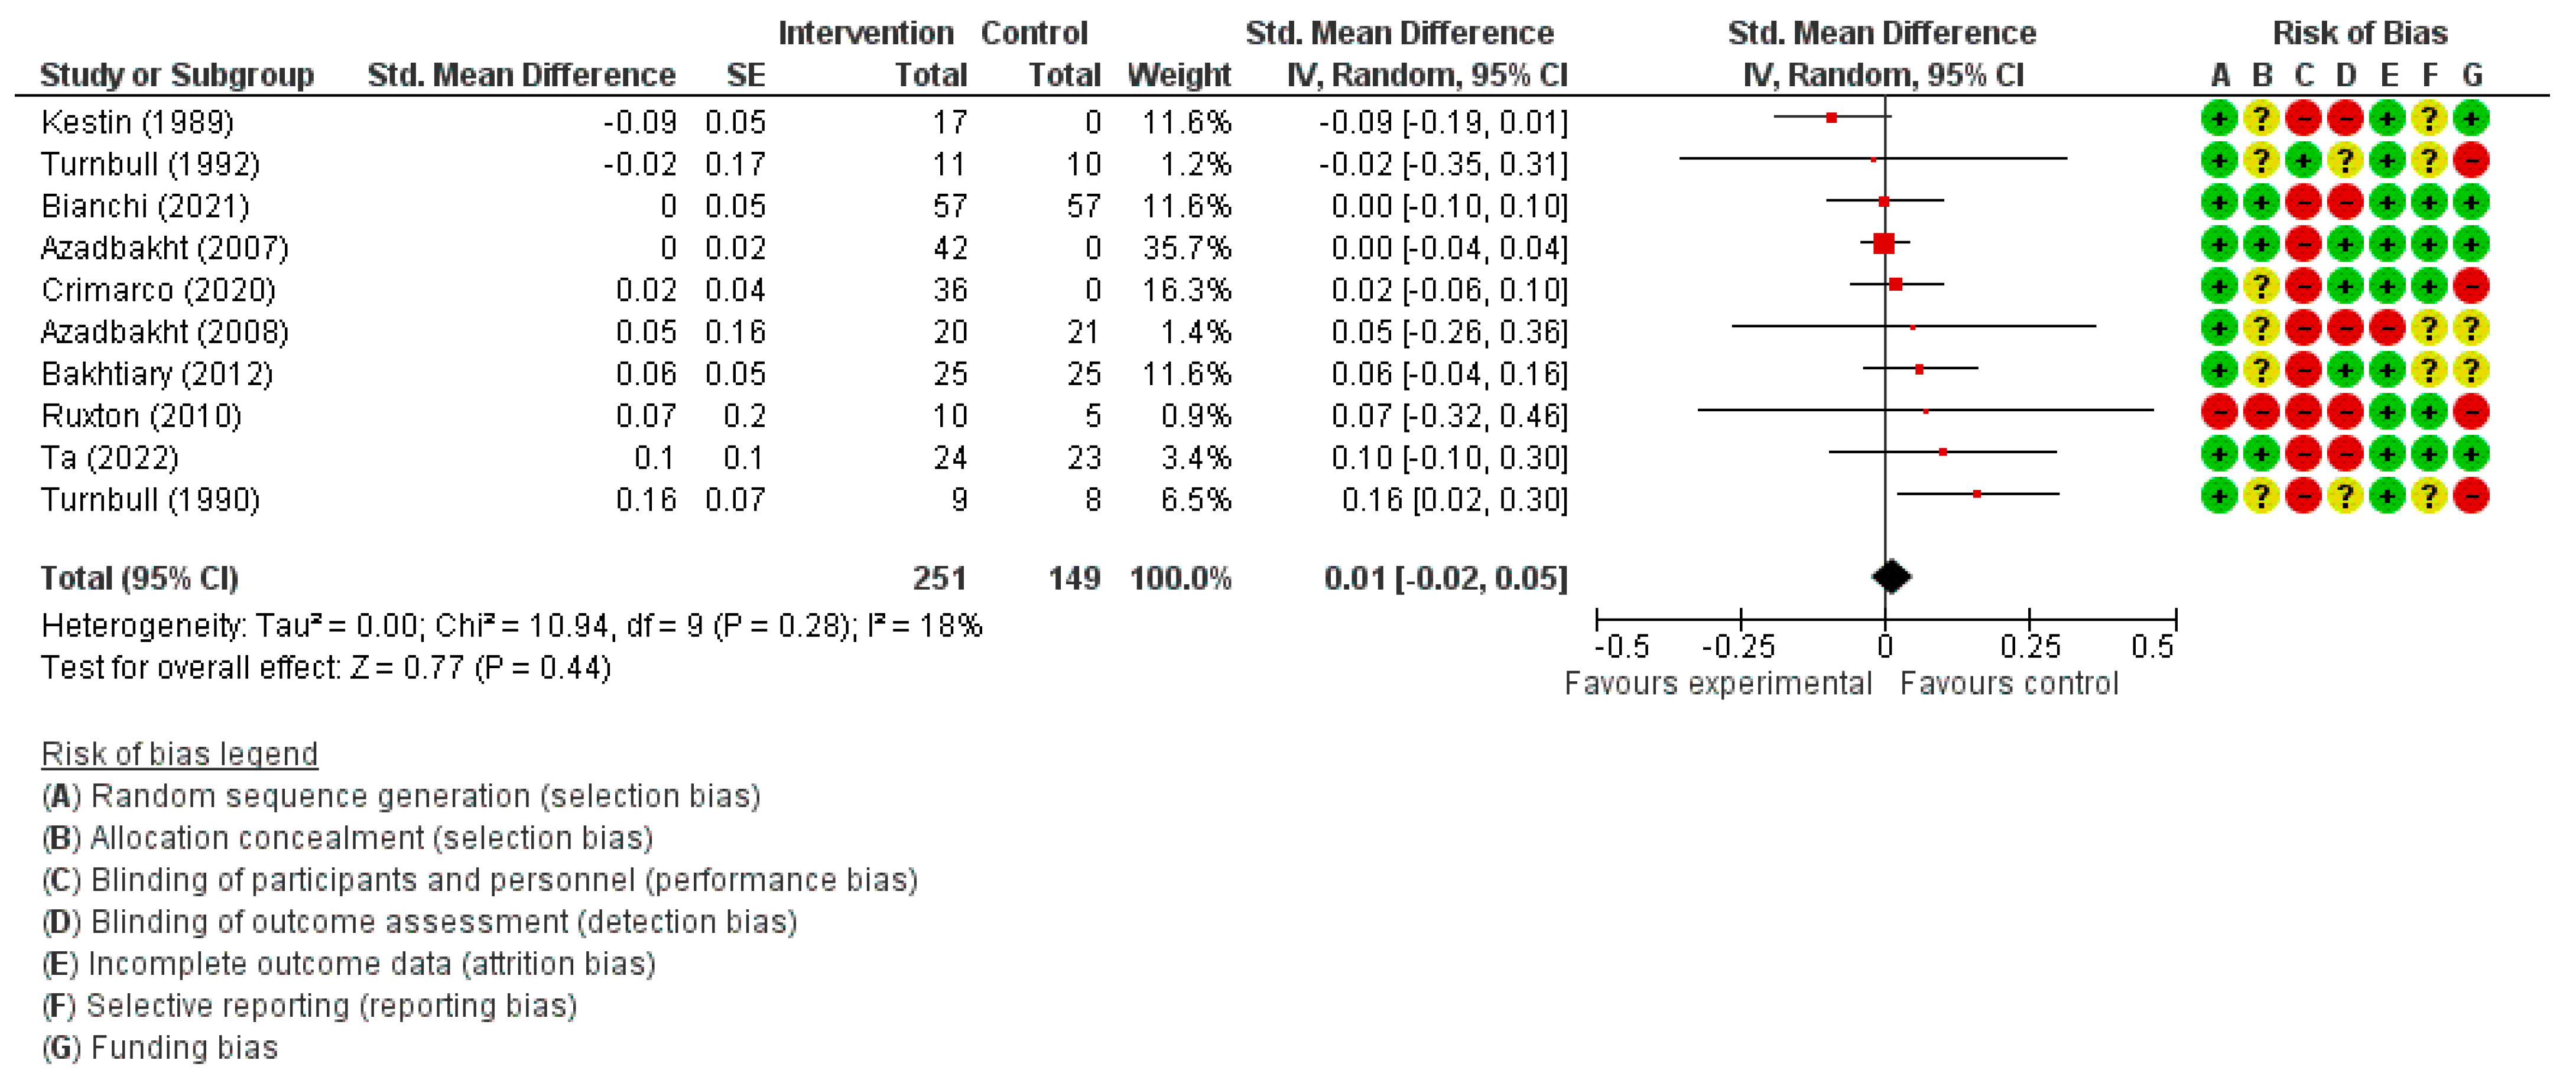
A total of ten clinical trials were included in this meta-analysis. The total sample size was 400 (251 in the intervention groups and 149 in the control groups; median sample size 38.5; range 15–114) and the mean age of the participants was 50.8 years. The median duration of the studies was 7 weeks (range 3–208 weeks). In the trials, replacement of meat with mycoprotein or plant-based meat substitutes was not associated with a significant change in HDL-C concentration (0.01 mmol/L; 95% CI, −0.02 to 0.05; p = 0.44; I2 = 18%; p < 0.28 for heterogeneity) compared with the consumption of comparator diets (Figure 4). In the one-study-removed sensitivity analysis, HDL-C concentration findings were unaffected, with differences between the intervention and control groups ranging from 0.00 to 0.02 mmol/L (Supplementary Table S2). The removal of one study [12] reduced the HDL-C effect heterogeneity from 18 to 0% and changed the mean reduction in HDL-C to 0.02 (−0.01 to 0.05) (Supplementary Table S3). The certainty of this evidence is moderate (Table 2).

3.3.4. Triglyceride Concentration

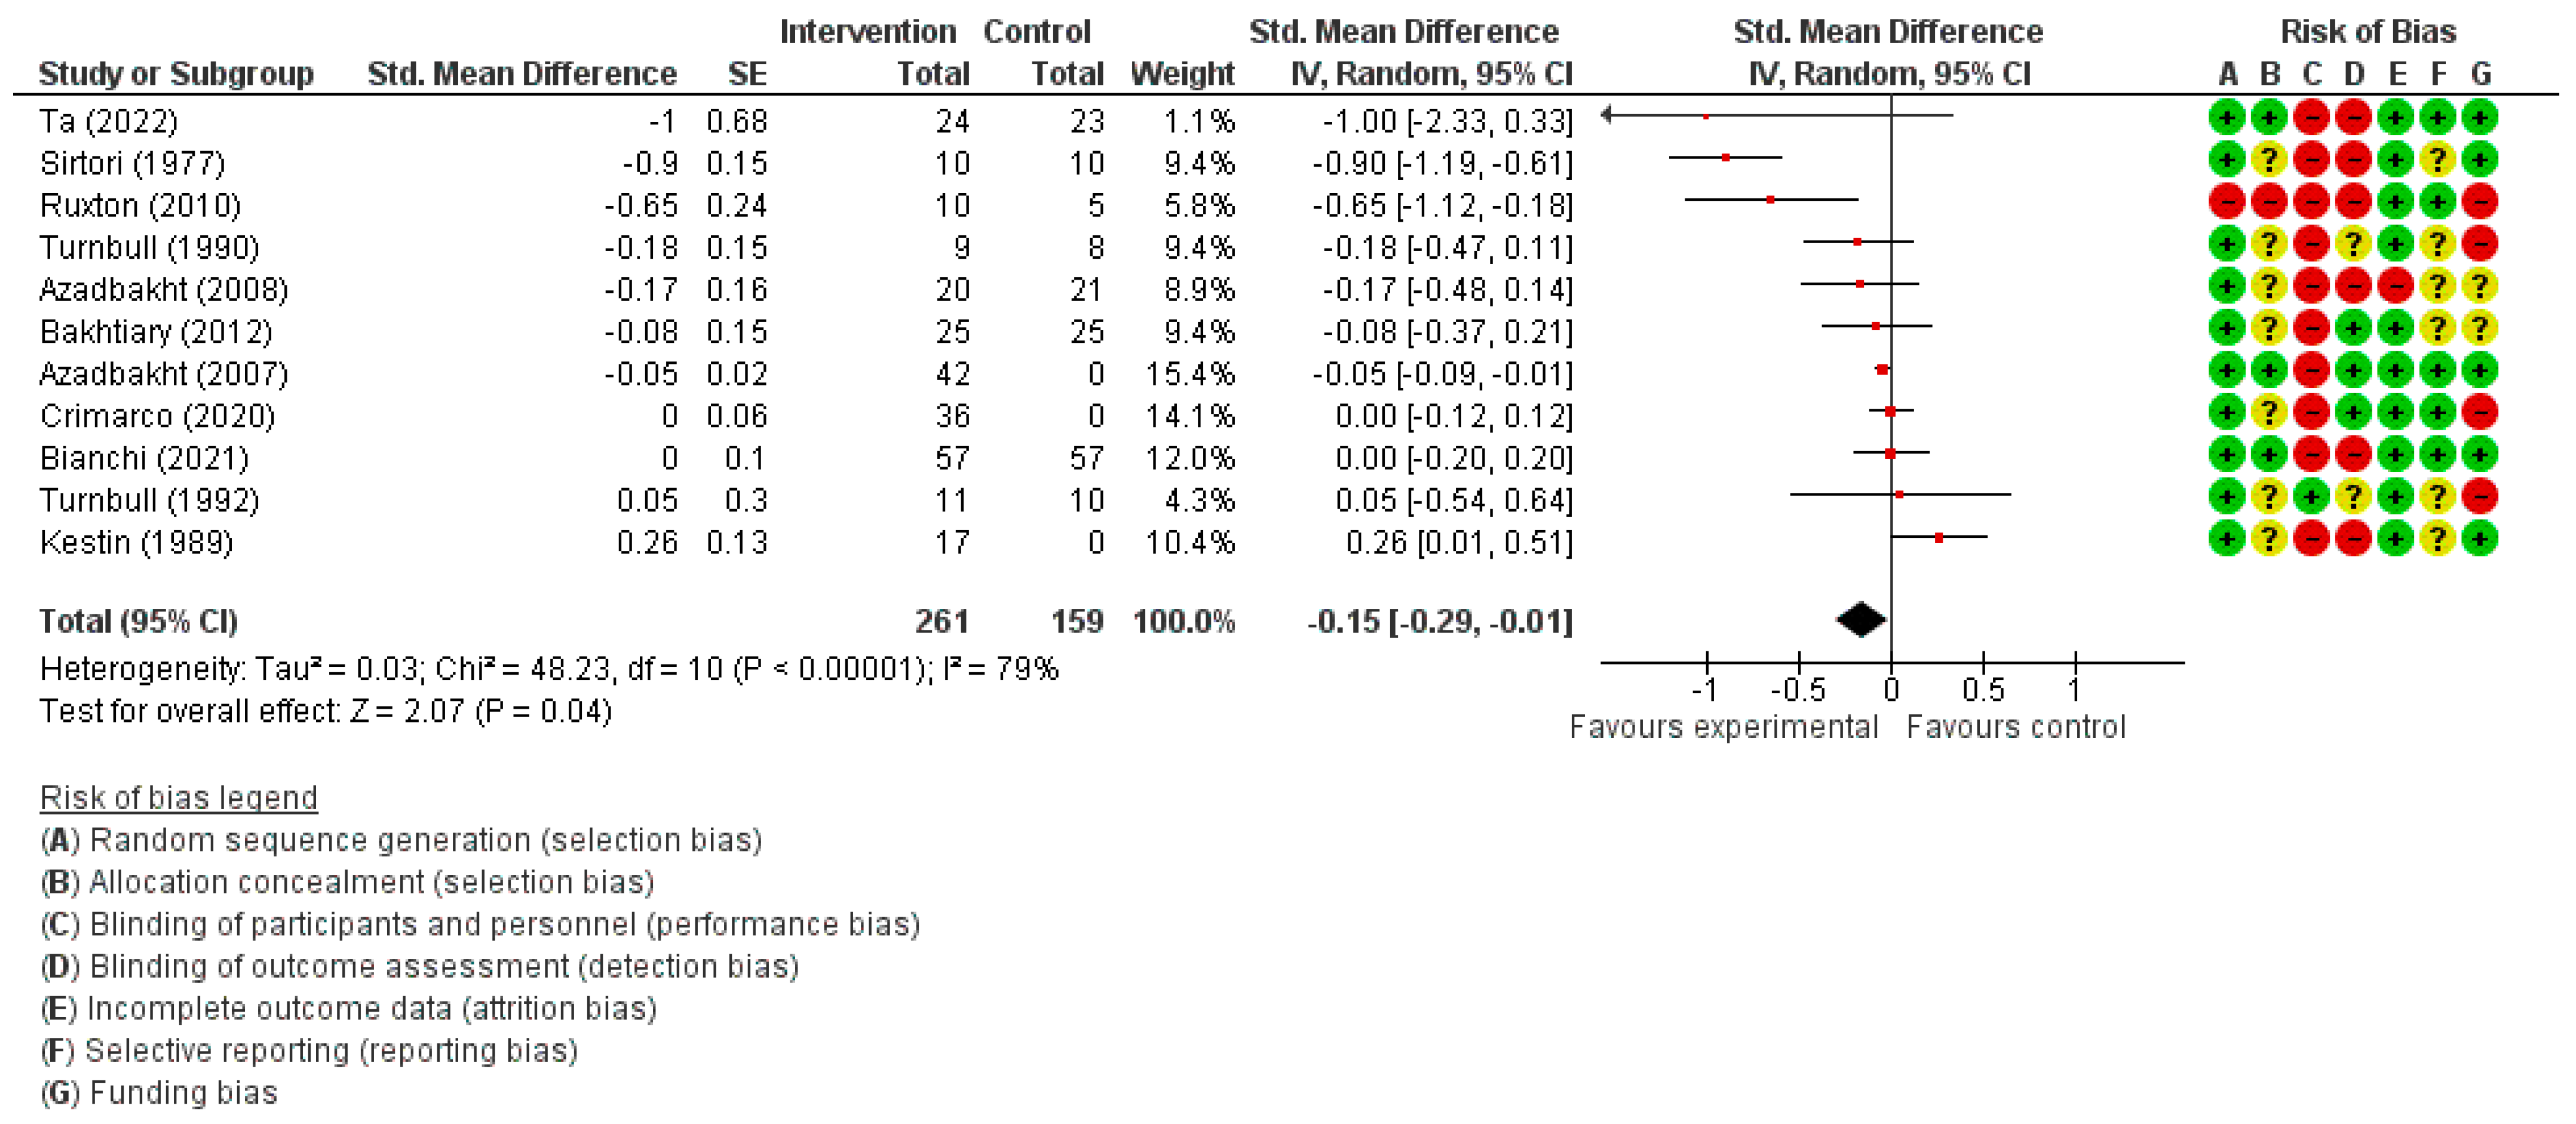
Eleven clinical trials were included in this meta-analysis. The total sample size was 420 (261 in the intervention groups and 159 in the control groups; median sample size 36; range 15–114) and the mean age of the participants was 50.8 years. The median duration of the studies was 6 weeks (range 3–208 weeks). In the trials, replacement of meat with mycoprotein or plant-based meat substitutes was associated with a small reduction in TG concentration (−0.15 mmol/L; 95% CI, −0.29 to −0.01; p = 0.04; I2 = 79%; p < 0.00001 for heterogeneity) compared with the consumption of comparator diets (Figure 5). In the one-study-removed sensitivity analysis, TG concentration findings were slightly affected, with differences between the intervention and control groups ranging from −0.20 to −0.05 mmol/L (Supplementary Table S2). The removal of three studies [10,12,17] reduced the TG effect heterogeneity from 79 to 0% and changed the mean reduction in TG to −0.05 (−0.08 to −0.01) (Supplementary Table S3). The certainty of this evidence is low (Table 2).

3.3.5. Fasting Blood Glucose Concentration

Eleven clinical trials were included in this meta-analysis. The total sample size was 420 (261 in the intervention groups and 159 in the control groups; median sample size 36; range 15–114) and the mean age of the participants was 50.8 years. The median duration of the studies was 6 weeks (range 3–208 weeks). In the trials, replacement of meat with mycoprotein or plant-based meat substitutes was associated with a small reduction in TG concentration (−0.15 mmol/L; 95% CI, −0.29 to −0.01; p = 0.04; I2 = 79%; p < 0.00001 for heterogeneity) compared with the consumption of comparator diets (Figure 6). In the one-study-removed sensitivity analysis, TG concentration findings were slightly affected, with differences between the intervention and control groups ranging from −0.20 to −0.05 mmol/L (Supplementary Table S2). The removal of three studies [10,12,17] reduced the TG effect heterogeneity from 79 to 0% and changed the mean reduction in TG to −0.05 (−0.08 to −0.01) (Supplementary Table S3). The certainty of this evidence is very low (Table 2).

3.3.6. Systolic and Diastolic Blood Pressure

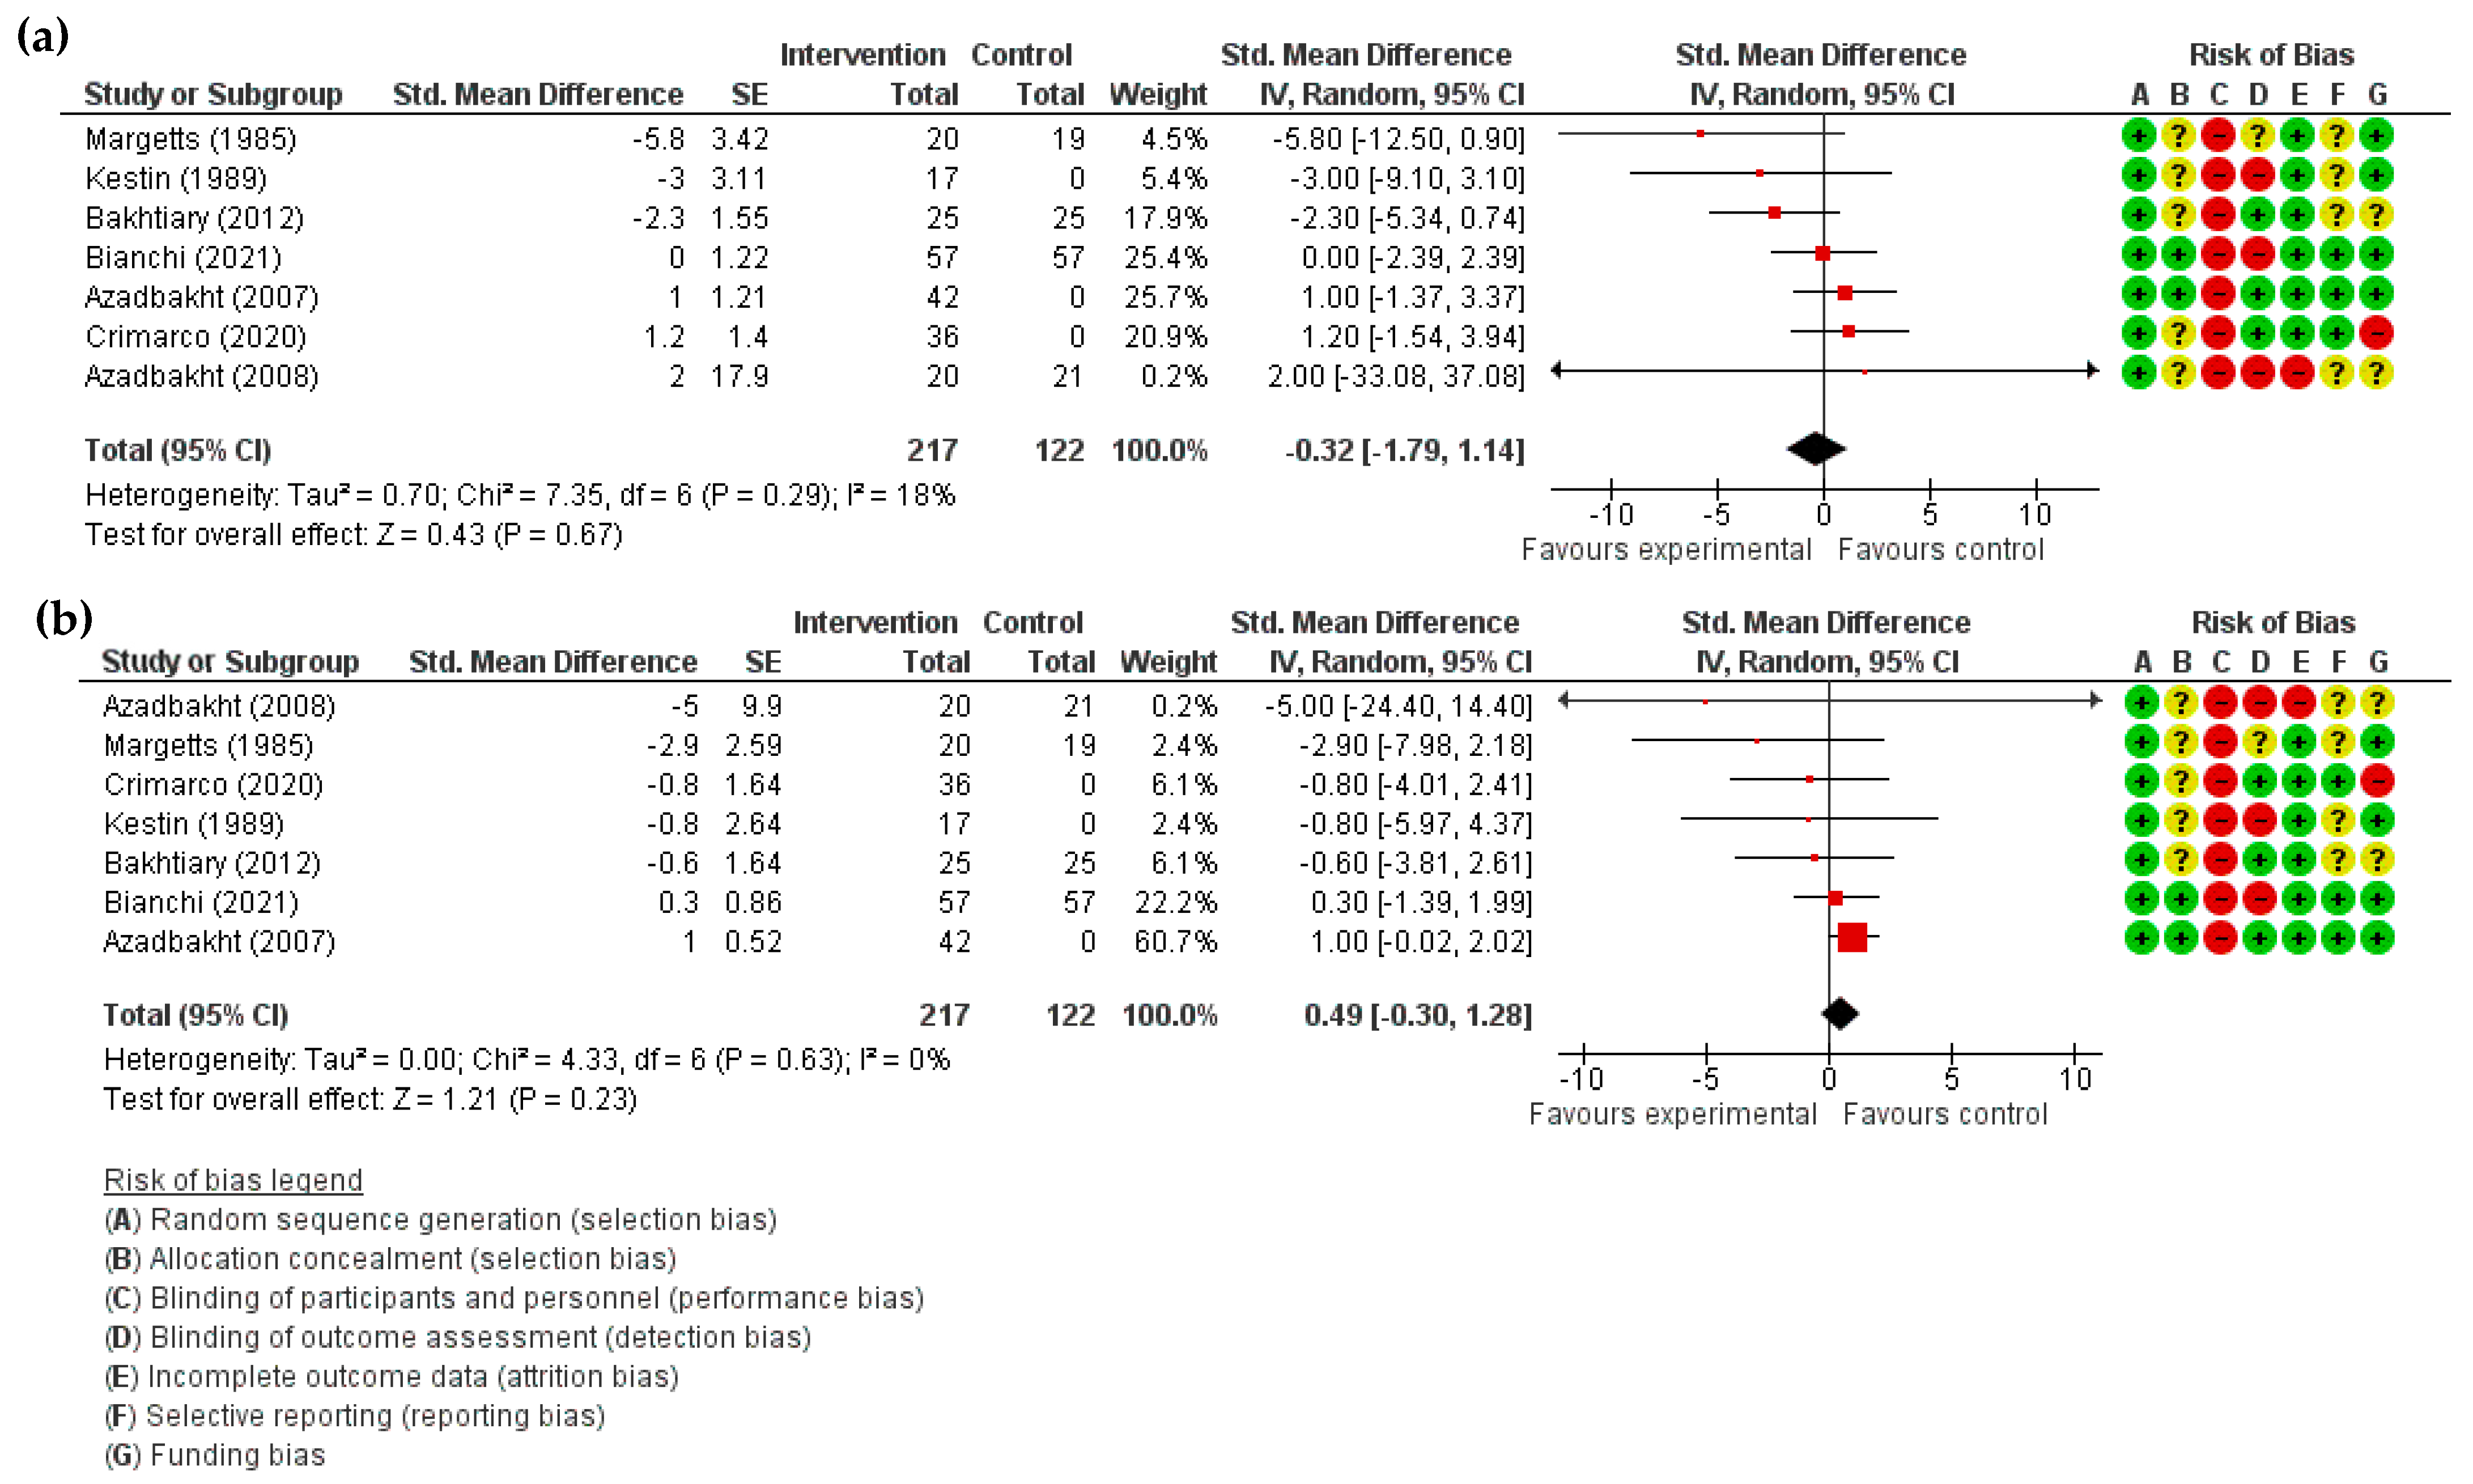
A total of seven studies were included in these meta-analyses. The total sample size was 339 (217 in the intervention groups and 122 in the control groups; median sample size 41; range 17–114) and the mean age of the participants was 50.9 years. The median duration of the studies was 8 weeks (range 4–208 weeks). In the trials, replacement of meat with mycoprotein or plant-based meat substitutes was not associated with a significant change in SBP (−0.32 mmHg; 95% CI, −1.79 to 1.14; p = 0.67; I2 = 18%; p = 0.29 for heterogeneity) or DBP (0.49 mmHg; 95% CI, −0.30 to 1.28; p = 0.23; I2 = 0%; p = 0.63 for heterogeneity) compared with the consumption of comparator diets (Figure 7). In the one-study-removed sensitivity analysis, SBP findings were diverse, with differences between the intervention and control groups ranging from −0.80 to 0.22 mmHg (Supplementary Table S2). The DBP results were similarly diverse with a range of −0.30 to 0.57 mmHg (Supplementary Table S2). The removal of one study [18] reduced the SBP effect heterogeneity from 18 to 0% and changed the mean change in SBP to 0.01 (−1.25 to 1.28) (Supplementary Table S3). There was no overall heterogeneity between the included studies for DBP. The certainty of this evidence is low (Table 2).

3.3.7. Weight

Five studies were included in this meta-analysis. The total sample size was 294 (168 in the intervention groups and 126 in the control groups; median sample size 47; range 41–114) and the mean age of the participants was 55.6 years. The median duration of the studies was 8 weeks (range 4–208 weeks). In the trials, replacement of meat with mycoprotein or plant-based meat substitutes was not associated with a significant change in weight (−0.12 Kg; 95% CI, −1.52 to 1.27; p = 0.86; I2 = 0%; p = 0.93 for heterogeneity) compared with the consumption of comparator diets (Figure 8). In the one-study-removed sensitivity analysis, weight findings had some diversity, with differences between the intervention and control groups ranging from −0.58 to 0.31 Kg (Supplementary Table S2). There was no overall heterogeneity between the included studies. The certainty of this evidence is low (Table 2).

3.4. Meta-Regression

The meta-regression model identified study sample size as a potential source of heterogeneity for TC (β coefficient, 0.0072; p = 0.010) and LDL-C analyses (β coefficient, 0.0066; p = 0.012) (Supplementary Table S4). Intervention duration, age, baseline BMI, and sex (proportion of men) were not statistically significant sources of heterogeneity (Supplementary Table S4).

3.5. Publication Bias

Supplemental Table S5 and Figures S1–S7 present the publication bias and trim-and-fill (where applicable) assessments for all outcomes where there were ≥10 trials available. There was no evidence of funnel plot asymmetry in the analysis of HDL-C. However, there was evidence of funnel plot asymmetry in the TC (Egger’s test, p = 0.066; Begg’s test, p = 0.089), LDL-C (Egger’s test, p = 0.044), and TG (Begg’s test, p = 0.059) analyses. Adjustment for funnel plot asymmetry with the imputation of three missing studies slightly reduced the TC effect magnitude (imputed mean difference: −0.398 [−0.693, −0.104]) but did not alter the direction or statistical significance of the effect. Adjustment for funnel plot asymmetry with the imputation of five studies did not alter the direction of the LDL-C effect but reduced the effect magnitude and eliminated the statistical significance (−0.213 [−0.431, 0.005]). Similarly, the imputation of two studies did not alter the direction of the TG effect but reduced the effect magnitude and eliminated the statistical significance (−0.073 [−0.327, 0.180]).

4. Discussion

This collection of meta-analyses shows that the consumption of meat substitutes is associated with reduced TC, LDL-C, and TG when compared with the consumption of omnivorous diets. Consumption of meat substitutes was associated with a 0.50 mmol/L reduction in TC, which statistically was a highly significant result. In comparison, the most up-to-date meta-analysis on the effect of PBDs on plasma lipids found a 0.69 mmol/L reduction in TC [22]. Our analyses also showed that the consumption of meat substitutes was associated with a highly significant 0.39 mmol/L reduction in LDL-C. For comparison, the consumption of PBDs has been shown to be associated with a 0.68 mmol/L reduction in LDL-C [22]. The effects of PBDs and meat substitutes on HDL-C seem to differ. The present analyses showed that meat substitutes had a null effect on HDL-C, whereas PBDs have been associated with reduced HDL-C in clinical trials [22]. Additionally, our study showed that the consumption of meat substitutes was associated with a statistically significant 0.15 mmol/L reduction in TG, which is interesting as the consumption of PBDs has not been shown to be associated with significant changes in TG [22]. The accordance between the effects of meat substitutes and PBDs on plasma lipids is of great importance as it highlights that individuals may be able to acquire the cardioprotective benefits of PBDs by eating foods that mimic the eating experience of meat and better align with their preferences than vegetables. However, the results of the present analyses should be interpreted with caution. Due to the presence of trial design limitations such as lack of assessor blinding, potential funding bias, and publication bias, these findings only have a moderate to low certainty, meaning that the true effect of meat substitutes on the plasma lipids may differ in magnitude and/or direction to what has been shown here. This especially applies to our findings for FBG, SBP, DBP, and weight which showed null effects but with low or very low certainty. PBDs have shown significant reductions in SBP, DBP, and body weight compared to omnivorous diets in previous meta-analyses [23,24]. Lastly, our FBG findings are in accordance with a meta-analysis showing no association between PBD consumption and changes in FBG [25]. More high-quality RCTs are required to better establish the true effects of meat substitutes on cardiometabolic risk factors.

4.1. Strengths and Limitations

The present meta-analysis has several key strengths. First, it is the first meta-analysis conducted on meat substitutes and has a comprehensive inclusion of cardiometabolic outcomes. Second, 92% of studies included in the analyses were RCTs, which promotes confidence in the results. Third, we adjusted our findings for publication bias using the trim-and-fill method where applicable. Fourth, sources of heterogeneity were determined, and the results were mostly unaffected by their exclusion. Fifth, sensitivity analyses showed that the pooled effect estimates were robust to the removal of individual studies. Sixth, there was a low level of dropouts in the included studies, meaning that there is a low chance of attrition bias.
The analysis also has several noteworthy limitations. First, the included trials have inherent design limitations which were carried forward by the meta-analyses. Small sample sizes were a general limitation but particularly affected FBG, SBP, DBP, and weight outcomes. One study was not randomised, meaning it was highly susceptible to bias, which is concerning as the study found the largest effect size for FBG and the second-largest for TC [10]. Many of the included studies did not blind study personnel or outcome assessors, putting their results at high risk of performance bias and detection bias. Many of the included studies were funded by meat substitute manufacturers with financial stakes and obvious conflicting interests, meaning the results may be subject to funding bias [26]. Some of the studies also did not adjust for confounding factors, for example, exercise or alcohol intake. None of the trials were double-blinded, meaning they were all subject to performance bias. Going forward, as meat substitutes become more resembling of actual meat, we may reach a point where the two are indistinguishable. If this is achieved, double-blind trial design may be possible. Second, the findings for LDL-C and HDL-C may be affected by an error induced by changes in assessment methodologies that occurred between 1977–2022 for LDL-C and 1989–2022 for HDL-C. During these periods, LDL-C and HDL-C assessment shifted from utilising calculation methods to direct methods. The measurements obtained from different direct methods vary significantly depending on the producer of the kits. In an evaluation of 8 LDL-C and 8 HDL-C direct methods from seven manufacturers, Miller et al. found that the total error in diseased groups ranged from −19.8% to 36.3% for HDL-C and from −26.6% to 31.9% for LDL-C [27]. Third, study availability was limited particularly for weight, SBP, DBP, and weight outcomes. No studies were available with data on the effects of mycoprotein consumption on BP and weight. New RCTs are needed to close this gap. Fourth, the results only show the short-term health effects of meat alternative consumption. Long-duration RCTs and prospective cohort studies are required to determine the long-term effects of meat substitute consumption on human health outcomes. Fifth, there may have been other differences in dietary composition other than meat substitute intake that could have influenced the results. Sixth, some of the studied products are not representative of current meat substitutes on the market, meaning the results may not accurately depict the effect meat substitutes are having and would have on public health. More RCTs need to be conducted on the effect of modern ultra-processed meat analogues on important health markers. Finally, the changes observed in TC and TG may be attributed to within-subject biological variation rather than dietary changes.

4.2. Potential Mechanisms

The nutritional composition differences between meat substitutes and traditional meat products may be responsible for the effects observed in the present analyses. Unlike meat from animal sources, meat substitutes made from plant protein or mycoprotein contain dietary fiber, and do not contain trans fats or dietary cholesterol [4,28]. Excluding the Beyond Meat products investigated by Crimarco et al. [11], all of the meat substitutes included in the present analyses were also low in saturated fat compared with traditional meat products [29]. In contrast, modern meat substitutes, such as Beyond Meat products, differ in this aspect due to the inclusion of coconut oil in their ingredients. Beyond Meat products actually contain comparable quantities of saturated fat to traditional meat products [29]. There is high-certainty evidence that trans fats, saturated fats, and to a lesser extent, dietary cholesterol raise blood TC and LDL-C concentrations [30,31,32]. The reduced intake of trans fats, saturated fats, and cholesterol associated with regular consumption of meat substitutes may lead to less absorption of the aforementioned nutrients in the gut and therefore reduced conversion to blood cholesterol [33]. Fiber lowers blood cholesterol concentration via multiple mechanisms. Soluble fiber binds bile acids and cholesterol, resulting in a reduction of liver cell cholesterol content. This leads to the up-regulation of LDL receptors which is associated with increased clearance of LDL-C [34]. Short chain fatty acids (SCFAs), such as propionate, acetate, and butyrate, are products of fiber fermentation. SCFAs may inhibit hepatic cholesterol synthesis, resulting in reduced blood cholesterol levels [28,35]. Substitutes derived from soy protein may have additional cholesterol-lowering effects facilitated by the ability of phytoestrogens (isoflavones) to inhibit cholesterol synthesis [36]. Isoflavones may also increase the resistance of LDL-C to oxidation and inhibit thrombus formation, thus leading to better cardiovascular outcomes [37,38].

4.3. Implications

4.3.1. Public Health

High blood cholesterol is a leading risk factor for Ischaemic Heart Disease (IHD) and stroke, accounting for approximately 3.9 million deaths worldwide every year [39,40]. A meta-analysis on the effect of statins on IHD and stroke risk found that a 0.5 mmol/L reduction in LDL-C was associated with a 20% reduction in IHD events [41]. Another study estimated that a 0.5 mmol/L reduction in LDL-C would be expected to reduce the risk of Coronary Heart Disease (CHD) by 25% over two years [42]. Our analyses showed a reduction in LDL-C of a similar magnitude (0.39 [−0.57, −0.21]), meaning the consumption of meat substitutes could have a meaningful impact on cardiovascular disease (CVD) risk. Whilst switching to meat substitutes may not be as powerful as statins, which on average reduce LDL-C by 1.8 mmol/L, the two interventions are not mutually exclusive [41]. They could be used in combination to achieve reductions in IHD and stroke risk not possible with statin treatment alone. Switching to meat substitutes also has the intrinsic advantage of not causing any known severe side effects.
As meat substitute products move in the direction of becoming more and more like traditional meat, their ingredients are continually evolving. There are safety concerns surrounding some of these new, innovative ingredients. Soy leghaemoglobin is a haem iron-containing molecule found in the root nodules of soy plants. Impossible Foods have utilised leghaemoglobin in their plant-based substitutes to enhance the meaty flavour and aroma. No long-term human studies have ever been conducted on the effects of high haem intake from plant-based sources on human health; however, there is reason to believe it may be associated with the same disease risks as haem iron from animal sources. Impossible Foods have reported that the level of haem iron in its beef substitute is similar to that found in beef sourced from cattle [43]. They have also reported that their haem is molecularly identical (once cooked and digested) to haem sourced from animals. High haem iron intakes from animal-based sources have been associated with increased risk of developing numerous non-communicable diseases including type 2 diabetes, CVD, colorectal cancer, and lung cancer [43,44,45,46].
An additional additive of concern is carrageenan. Carrageenan is a structural ingredient used for thickening, gelling, or stabilising [43]. Carrageenan consumption has been observed to provoke gastrointestinal inflammation and alter intestinal microflora [47]. Carrageenan consumption has also been linked to the development of irritable bowel syndrome and colon cancer [43]. Since carrageenan is derived from seaweed, it has the potential to bioaccumulate heavy metal pollutants found in the sea [48]. Exposure to heavy metal contaminants via carrageenan consumption is yet to be characterised in the literature.
Meat substitutes also contain some better characterised ingredients of concern. First, modern substitutes contain alarmingly high amounts of sodium [29]. Sodium is the leading dietary factor in terms of the global burden of disease due to its role in the causation of hypertension and CVD. Approximately four million people die every year as a result of consuming too much salt [49]. The second ingredient of concern is coconut oil. Coconut oil is high in saturated fatty acids which raise LDL-C and increase risk of CVD [50]. As the demand for meat substitutes increases, it is important that products are reformulated to contain less sodium and less saturated fat. It is also vital that novel ingredients are heavily researched to minimise adverse effects.

4.3.2. Food Safety

The main food safety hazard associated with plant-based and mycoprotein-based meat substitutes is allergens. A few case reports have been published describing adverse reactions to mycoprotein in individuals with a history of mould allergy; however, the incidence of such reactions appears to be low [51]. Consumer complaints have been tracked worldwide since the sale of mycoprotein began in the UK in 1985. Between 2003 and 2017, the frequency of reported illnesses was one per 1.85 million servings and the frequency of possible allergic reactions was one per 24.3 million servings [52]. It is well established that some of the common ingredients in plant-based meat substitutes, such as soy, legumes, and wheat, contain allergens [53,54]. Going forward, it is imperative that adverse reactions to meat alternatives are monitored and tracked, and that product packaging clearly highlights known allergens.

4.3.3. Planetary Health

The livestock sector is a significant contributor to overall anthropogenic GHG emissions. It is accountable for approximately 18% of global GHG emissions [55]. A recent review found that the median GHG footprint of plant-based meat substitutes was 34, 43, 63, 72, 87, and 93% smaller than those of farmed fish, poultry meat, pork, farmed crustaceans, beef from dairy herds, and beef from beef herds, respectively, per 100 g of protein [43]. This review also found that tofu, pulses, and peas were 1.6, 4.6, and 7.0 times less GHG-intensive than plant-based meats, respectively. Mycoprotein-based substitutes have also demonstrated better carbon footprints than conventional meat. The Carbon Trust reported that the carbon footprint of Quorn mince was at least 10 times smaller than that of beef and the carbon footprint of Quorn pieces was at least four times smaller than that of chicken [6]. Since most of the GHG emissions associated with meat substitutes come from the energy needed to process and manufacture the products, future decarbonisation of the energy grid may reduce the carbon footprint of these products further.
We must limit the expansion of agricultural land to 15% of global ice-free land (currently at 12%) in order to prevent seriously threatening biodiversity and destabilising the climate system and hydrological cycle. It is estimated that the livestock sector is responsible for 80% of agricultural land use, whilst only supplying 18% of calories [56,57]. A previous review found that the median land use required for the production of plant-based meat substitutes was 41, 77, 82, 89, and 98% less than that of farmed fish, poultry meat, pork, beef from dairy herds, and beef from beef herds, respectively, per 100 g of protein [43]. The Carbon Trust found that the land used for the production of mycoprotein-based Quorn pieces was at least two times lower than for chicken [6]. Therefore, switching to meat substitutes could free up land which could be returned to its natural habitat (reforested), promoting biodiversity and carbon sequestration.
Agriculture accounts for 70% of humanity’s freshwater footprint [58]. Of this total agricultural water use, it is estimated that 41% is utilised for the production of livestock feed [59]. A recent review found that the blue water (water in our surface and groundwater reservoirs) footprint of plant-based meat substitutes was 89% smaller than those of farmed poultry meat, beef, and pork per 100 g of protein [43]. The same review also found that the blue water footprint of meat substitutes is two orders of magnitude lower than that of aquatic animals reared in ponds, e.g., farmed shrimp. The water footprint for mycoprotein-based Quorn mince is estimated to be 10 times less than that of beef and the footprint of Quorn pieces is estimated to be three times less than that of chicken [6]. Meat substitutes could therefore play an important role in alleviating pressures on our freshwater resources, resulting in its preservation and the associated ecological benefits.

5. Conclusions

With the rise of chronic diseases, climate change, and biodiversity loss threatening human wellbeing and development, it is imperative that we adopt a health-promoting sustainable food system [2]. The livestock sector intersects with most of the sustainability and health issues facing humanity, highlighting it as an important area of focus for research and development. Meat substitutes derived from plant protein and mycoprotein have been shown to have smaller carbon, land, and water footprints than conventional meat products [43]. For the first time in the literature, this collection of meta-analyses has shown that the consumption of meat substitutes is associated with lower TC, LDL-C, and TG than the consumption of omnivorous diets with meat as the predominant protein source. This improvement in cardiometabolic biomarkers would translate to a lower burden of CVD and CVD mortality at the population level, supporting the pledge to switch to meat substitutes for environmental sustainability.

Supplementary Materials

The following supporting information can be downloaded at: https://www.mdpi.com/article/10.3390/dietetics2010009/s1, Table S1: Electronic database search strategy; Table S2: One-study-removed analysis; Table S3: Mean differences in outcomes adjusted for zero percent heterogeneity; Table S4: Results of meta-regression including age, study duration, sample size, baseline BMI, and sex; Table S5: p values of Egger’s test and Begg’s test; Figure S1: Publication bias funnel plot for total cholesterol concentration; Figure S2: Publication bias funnel plot for LDL-cholesterol concentration; Figure S3: Publication bias funnel plot for HDL-cholesterol concentration; Figure S4: Publication bias funnel plot for triglyceride concentration; Figure S5: Trim-and-Fill funnel plot for total cholesterol concentration; Figure S6: Trim-and-fill funnel plot for LDL-cholesterol concentration; Table S7: Trim-and-fill funnel plot for triglyceride concentration.

Author Contributions

J.G. conceptualised the article and designed the protocol, J.G. conducted the database searches, J.G. and G.-K.L. carried out study screening and data extraction, and J.G. carried out data analysis and wrote the manuscript. All authors have read and agreed to the published version of the manuscript.

Funding

J.G. and G.-K.L. are supported by Economic and Social Research Council PhD Studentships. This research received no external funding.

Institutional Review Board Statement

Not applicable.

Informed Consent Statement

Not applicable.

Data Availability Statement

Not applicable.

Conflicts of Interest

The authors declare no conflict of interest.

References

  1. Graça, J.; Godinho, C.A.; Truninger, M. Reducing meat consumption and following plant-based diets: Current evidence and future directions to inform integrated transitions. Trends Food Sci. Technol. 2019, 91, 380–390. [Google Scholar] [CrossRef] [Green Version]
  2. Gibbs, J.; Cappuccio, F.P. Plant-Based Dietary Patterns for Human and Planetary Health. Nutrients 2022, 14, 1614. [Google Scholar] [CrossRef] [PubMed]
  3. Pohjolainen, P.; Vinnari, M.; Jokinen, P. Consumers′ perceived barriers to following a plant-based diet. Br. Food J. 2015, 117, 1150–1167. [Google Scholar] [CrossRef]
  4. Bohrer, B.M. An investigation of the formulation and nutritional composition of modern meat analogue products. Food Sci. Hum. Wellness 2019, 8, 320–329. [Google Scholar] [CrossRef]
  5. Riaz, M.N. Textured soy protein and its uses. Agro Food Industry Hi Tech 2001, 12, 28–31. [Google Scholar]
  6. Finnigan, T.; Needham, L.; Abbott, C. Mycoprotein: A healthy new protein with a low environmental impact. In Sustainable Protein Sources; Elsevier: Amsterdam, The Netherlands, 2017; pp. 305–325. [Google Scholar]
  7. Hutton, B.; Salanti, G.; Caldwell, D.M.; Chaimani, A.; Schmid, C.H.; Cameron, C.; Ioannidis, J.P.; Straus, S.; Thorlund, K.; Jansen, J.P. The PRISMA extension statement for reporting of systematic reviews incorporating network meta-analyses of health care interventions: Checklist and explanations. Ann. Intern. Med. 2015, 162, 777–784. [Google Scholar] [CrossRef] [Green Version]
  8. Sterne, J.A.C.; Gavaghan, D.; Egger, M. Publication and related bias in meta-analysis: Power of statistical tests and prevalence in the literature. J. Clin. Epidemiol. 2000, 53, 1119–1129. [Google Scholar] [CrossRef]
  9. Duval, S.; Tweedie, R. Trim and fill: A simple funnel-plot–based method of testing and adjusting for publication bias in meta-analysis. Biometrics 2000, 56, 455–463. [Google Scholar] [CrossRef]
  10. Ruxton, C.H.; McMillan, B. The impact of mycoprotein on blood cholesterol levels: A pilot study. Br. Food J. 2010, 112, 1092–1101. [Google Scholar] [CrossRef]
  11. Crimarco, A.; Springfield, S.; Petlura, C.; Streaty, T.; Cunanan, K.; Lee, J.; Fielding-Singh, P.; Carter, M.M.; Topf, M.A.; Wastyk, H.C. A randomized crossover trial on the effect of plant-based compared with animal-based meat on trimethylamine-N-oxide and cardiovascular disease risk factors in generally healthy adults: Study With Appetizing Plantfood—Meat Eating Alternative Trial (SWAP-MEAT). Am. J. Clin. Nutr. 2020, 112, 1188–1199. [Google Scholar]
  12. Kestin, M.; Rouse, I.L.; Correll, R.A.; Nestel, P.J. Cardiovascular disease risk factors in free-living men: Comparison of two prudent diets, one based on lactoovovegetarianism and the other allowing lean meat. Am. J. Clin. Nutr. 1989, 50, 280–287. [Google Scholar] [CrossRef] [PubMed]
  13. Azadbakht, L.; Kimiagar, M.; Mehrabi, Y.; Esmaillzadeh, A.; Padyab, M.; Hu, F.B.; Willett, W.C. Soy inclusion in the diet improves features of the metabolic syndrome: A randomized crossover study in postmenopausal women. Am. J. Clin. Nutr. 2007, 85, 735–741. [Google Scholar] [CrossRef] [PubMed] [Green Version]
  14. Turnbull, W.H.; Leeds, A.R.; Edwards, D.G. Mycoprotein reduces blood lipids in free-living subjects. Am. J. Clin. Nutr. 1992, 55, 415–419. [Google Scholar] [CrossRef] [PubMed]
  15. Turnbull, W.H.; Leeds, A.R.; Edwards, G.D. Effect of mycoprotein on blood lipids. Am. J. Clin. Nutr. 1990, 52, 646–650. [Google Scholar] [CrossRef] [PubMed]
  16. Bianchi, F.; Stewart, C.; Astbury, N.M.; Cook, B.; Aveyard, P.; Jebb, S.A. Replacing meat with alternative plant-based products (RE-MAP): A randomized controlled trial of a multicomponent behavioral intervention to reduce meat consumption. Am. J. Clin. Nutr. 2022, 115, 1357–1366. [Google Scholar] [CrossRef] [PubMed]
  17. Sirtori, C.; Agradi, E.; Conti, F.; Mantero, O.; Gatti, E. Soybean-protein diet in the treatment of type-II hyperlipoproteinaemia. Lancet 1977, 309, 275–277. [Google Scholar] [CrossRef] [PubMed]
  18. Margetts, B.M.; Beilin, L.J.; Armstrong, B.K.; Vandongen, R. Vegetarian diet in the treatment of mild hypertension: A randomized controlled trial. J. Hypertens. Suppl. 1985, 3, S429–S431. [Google Scholar] [CrossRef]
  19. Azadbakht, L.; Atabak, S.; Esmaillzadeh, A. Soy protein intake, cardiorenal indices, and C-reactive protein in type 2 diabetes with nephropathy: A longitudinal randomized clinical trial. Diabetes Care 2008, 31, 648–654. [Google Scholar] [CrossRef] [Green Version]
  20. Bakhtiary, A.; Yassin, Z.; Hanachi, P.; Rahmat, A.; Ahmad, Z.; Jalali, F. Effects of soy on metabolic biomarkers of cardiovascular disease in elderly women with metabolic syndrome. Arch. Iran Med. 2012, 15, 462–468. [Google Scholar]
  21. Ta, N.T.; Ngo, H.T.T.; Nguyen, P.M.; Truong, T.T.; Nguyen, G.H.; Dinh, H.T.D.; Nguyen, L.T.; Le, H.T.; Nguyen, K.C.; Yamamoto, S. Effectiveness of Textured Soybean Protein on Blood Biochemistry in Vietnamese Type 2 Diabetes Mellitus Patients. J. Nutr. Sci. Vitaminol. 2022, 68, 32–38. [Google Scholar] [CrossRef]
  22. Yokoyama, Y.; Levin, S.M.; Barnard, N.D. Association between plant-based diets and plasma lipids: A systematic review and meta-analysis. Nutr. Rev. 2017, 75, 683–698. [Google Scholar] [CrossRef] [Green Version]
  23. Gibbs, J.; Gaskin, E.; Ji, C.; Miller, M.A.; Cappuccio, F.P. The effect of plant-based dietary patterns on blood pressure: A systematic review and meta-analysis of controlled intervention trials. J. Hypertens. 2021, 39, 23–37. [Google Scholar] [CrossRef] [PubMed]
  24. Barnard, N.D.; Levin, S.M.; Yokoyama, Y. A systematic review and meta-analysis of changes in body weight in clinical trials of vegetarian diets. J. Acad. Nutr. Diet. 2015, 115, 954–969. [Google Scholar] [CrossRef] [PubMed]
  25. Yokoyama, Y.; Barnard, N.D.; Levin, S.M.; Watanabe, M. Vegetarian diets and glycemic control in diabetes: A systematic review and meta-analysis. Cardiovasc. Diagn. Ther. 2014, 4, 373. [Google Scholar] [PubMed]
  26. Chopra, S.S. Industry Funding of Clinical Trials: Benefit or Bias? JAMA 2003, 290, 113–114. [Google Scholar] [CrossRef] [Green Version]
  27. Miller, W.G.; Myers, G.L.; Sakurabayashi, I.; Bachmann, L.M.; Caudill, S.P.; Dziekonski, A.; Edwards, S.; Kimberly, M.M.; Korzun, W.J.; Leary, E.T. Seven direct methods for measuring HDL and LDL cholesterol compared with ultracentrifugation reference measurement procedures. Clin. Chem. 2010, 56, 977–986. [Google Scholar] [CrossRef] [Green Version]
  28. Derbyshire, E.; Ayoob, K.-T. Mycoprotein: Nutritional and health properties. Nutr. Today 2019, 54, 7–15. [Google Scholar] [CrossRef]
  29. Curtain, F.; Grafenauer, S. Plant-based meat substitutes in the flexitarian age: An audit of products on supermarket shelves. Nutrients 2019, 11, 2603. [Google Scholar] [CrossRef] [Green Version]
  30. Islam, M.A.; Amin, M.N.; Siddiqui, S.A.; Hossain, M.P.; Sultana, F.; Kabir, M.R. Trans fatty acids and lipid profile: A serious risk factor to cardiovascular disease, cancer and diabetes. Diabetes Metab. Syndr. Clin. Res. Rev. 2019, 13, 1643–1647. [Google Scholar] [CrossRef]
  31. Siri-Tarino, P.W.; Sun, Q.; Hu, F.B.; Krauss, R.M. Saturated fat, carbohydrate, and cardiovascular disease. Am. J. Clin. Nutr. 2010, 91, 502–509. [Google Scholar] [CrossRef] [Green Version]
  32. Hegsted, D. Serum-cholesterol response to dietary cholesterol: A re-evaluation. Am. J. Clin. Nutr. 1986, 44, 299–305. [Google Scholar] [CrossRef] [PubMed]
  33. Ferdowsian, H.R.; Barnard, N.D. Effects of plant-based diets on plasma lipids. Am. J. Cardiol. 2009, 104, 947–956. [Google Scholar] [CrossRef] [PubMed]
  34. Brown, L.; Rosner, B.; Willett, W.W.; Sacks, F.M. Cholesterol-lowering effects of dietary fiber: A meta-analysis. Am. J. Clin. Nutr. 1999, 69, 30–42. [Google Scholar] [CrossRef] [PubMed] [Green Version]
  35. Nishina, P.M.; Freedland, R.A. The effects of dietary fiber feeding on cholesterol metabolism in rats. J. Nutr. 1990, 120, 800–805. [Google Scholar] [CrossRef]
  36. Anderson, J.W.; Johnstone, B.M.; Cook-Newell, M.E. Meta-analysis of the effects of soy protein intake on serum lipids. N. Engl. J. Med. 1995, 333, 276–282. [Google Scholar] [CrossRef]
  37. Damasceno, N.R.T.; Apolinário, E.; Flauzino, F.D.; Fernandes, I.; Abdalla, D.S.P. Soy isoflavones reduce electronegative low-density lipoprotein (LDL−) and anti-LDL− autoantibodies in experimental atherosclerosis. Eur. J. Nutr. 2007, 46, 125–132. [Google Scholar] [CrossRef]
  38. Rimbach, G.; Boesch-Saadatmandi, C.; Frank, J.; Fuchs, D.; Wenzel, U.; Daniel, H.; Hall, W.L.; Weinberg, P.D. Dietary isoflavones in the prevention of cardiovascular disease–A molecular perspective. Food Chem. Toxicol. 2008, 46, 1308–1319. [Google Scholar] [CrossRef]
  39. Assessment, R. Major lipids, apolipoproteins, and risk of vascular disease. JAMA 2009, 302, 1993–2000. [Google Scholar]
  40. Collaboration, N.R.F. Repositioning of the global epicentre of non-optimal cholesterol. Nature 2020, 582, 73. [Google Scholar]
  41. Law, M.R.; Wald, N.J.; Rudnicka, A. Quantifying effect of statins on low density lipoprotein cholesterol, ischaemic heart disease, and stroke: Systematic review and meta-analysis. BMJ 2003, 326, 1423. [Google Scholar] [CrossRef] [PubMed] [Green Version]
  42. JBS 2: Joint British Societies’ guidelines on prevention of cardiovascular disease in clinical practice. Heart 2005, 91, v1–v52. [CrossRef] [Green Version]
  43. Santo, R.E.; Kim, B.F.; Goldman, S.E.; Dutkiewicz, J.; Biehl, E.; Bloem, M.W.; Neff, R.A.; Nachman, K.E. Considering plant-based meat substitutes and cell-based meats: A public health and food systems perspective. Front. Sustain. Food Syst. 2020, 4, 134. [Google Scholar] [CrossRef]
  44. Bao, W.; Rong, Y.; Rong, S.; Liu, L. Dietary iron intake, body iron stores, and the risk of type 2 diabetes: A systematic review and meta-analysis. BMC Med. 2012, 10, 1–13. [Google Scholar] [CrossRef] [PubMed] [Green Version]
  45. Fang, X.; An, P.; Wang, H.; Wang, X.; Shen, X.; Li, X.; Min, J.; Liu, S.; Wang, F. Dietary intake of heme iron and risk of cardiovascular disease: A dose–response meta-analysis of prospective cohort studies. Nutr. Metab. Cardiovasc. Dis. 2015, 25, 24–35. [Google Scholar] [CrossRef] [PubMed]
  46. Fonseca-Nunes, A.; Jakszyn, P.; Agudo, A. Iron and cancer risk—A systematic review and meta-analysis of the epidemiological evidence. Cancer Epidemiol. Prev. Biomark. 2014, 23, 12–31. [Google Scholar] [CrossRef] [PubMed] [Green Version]
  47. David, S.; Levi, C.S.; Fahoum, L.; Ungar, Y.; Meyron-Holtz, E.G.; Shpigelman, A.; Lesmes, U. Revisiting the carrageenan controversy: Do we really understand the digestive fate and safety of carrageenan in our foods? Food Funct. 2018, 9, 1344–1352. [Google Scholar] [CrossRef]
  48. Besada, V.; Andrade, J.M.; Schultze, F.; González, J.J. Heavy metals in edible seaweeds commercialised for human consumption. J. Mar. Syst. 2009, 75, 305–313. [Google Scholar] [CrossRef]
  49. Lim, S.S.; Vos, T.; Flaxman, A.D.; Danaei, G.; Shibuya, K.; Adair-Rohani, H.; Amann, M.; Anderson, H.R.; Andrews, K.G.; Aryee, M.; et al. A comparative risk assessment of burden of disease and injury attributable to 67 risk factors and risk factor clusters in 21 regions, 1990-2010: A systematic analysis for the Global Burden of Disease Study 2010. Lancet 2012, 380, 2224–2260. [Google Scholar] [CrossRef] [Green Version]
  50. Voon, P.T.; Ng, T.K.W.; Lee, V.K.M.; Nesaretnam, K. Diets high in palmitic acid (16: 0), lauric and myristic acids (12: 0+ 14: 0), or oleic acid (18: 1) do not alter postprandial or fasting plasma homocysteine and inflammatory markers in healthy Malaysian adults. Am. J. Clin. Nutr. 2011, 94, 1451–1457. [Google Scholar] [CrossRef] [Green Version]
  51. Hadi, J.; Brightwell, G. Safety of Alternative Proteins: Technological, environmental and regulatory aspects of cultured meat, plant-based meat, insect protein and single-cell protein. Foods 2021, 10, 1226. [Google Scholar] [CrossRef]
  52. Finnigan, T.J.A.; Wall, B.T.; Wilde, P.J.; Stephens, F.B.; Taylor, S.L.; Freedman, M.R. Mycoprotein: The future of nutritious nonmeat protein, a symposium review. Curr. Dev. Nutr. 2019, 3, nzz021. [Google Scholar] [CrossRef] [PubMed] [Green Version]
  53. Verma, A.K.; Kumar, S.; Das, M.; Dwivedi, P.D. A comprehensive review of legume allergy. Clin. Rev. Allergy Immunol. 2013, 45, 30–46. [Google Scholar] [CrossRef] [PubMed]
  54. Inomata, N. Wheat allergy. Curr. Opin. Allergy Clin. Immunol. 2009, 9, 238–243. [Google Scholar] [CrossRef]
  55. UNEP. Assessing the Environmental Impacts of Consumption and Production: Priority Products and Materials; UNEP: Nairobi, Kenya, 2010; p. 80. [Google Scholar]
  56. Stehfest, E.; Bouwman, L.; Van Vuuren, D.P.; Den Elzen, M.G.; Eickhout, B.; Kabat, P. Climate benefits of changing diet. Clim. Chang. 2009, 95, 83–102. [Google Scholar] [CrossRef]
  57. Poore, J.; Nemecek, T. Reducing food’s environmental impacts through producers and consumers. Science 2018, 360, 987–992. [Google Scholar] [CrossRef] [Green Version]
  58. Pimentel, D.; Berger, B.; Filiberto, D.; Newton, M.; Wolfe, B.; Karabinakis, E.; Clark, S.; Poon, E.; Abbett, E.; Nandagopal, S. Water resources: Agricultural and environmental issues. BioScience 2004, 54, 909–918. [Google Scholar] [CrossRef] [Green Version]
  59. Heinke, J.; Lannerstad, M.; Gerten, D.; Havlík, P.; Herrero, M.; Notenbaert, A.M.O.; Hoff, H.; Müller, C. Water use in global livestock production—Opportunities and constraints for increasing water productivity. Water Resour. Res. 2020, 56, e2019WR026995. [Google Scholar] [CrossRef]
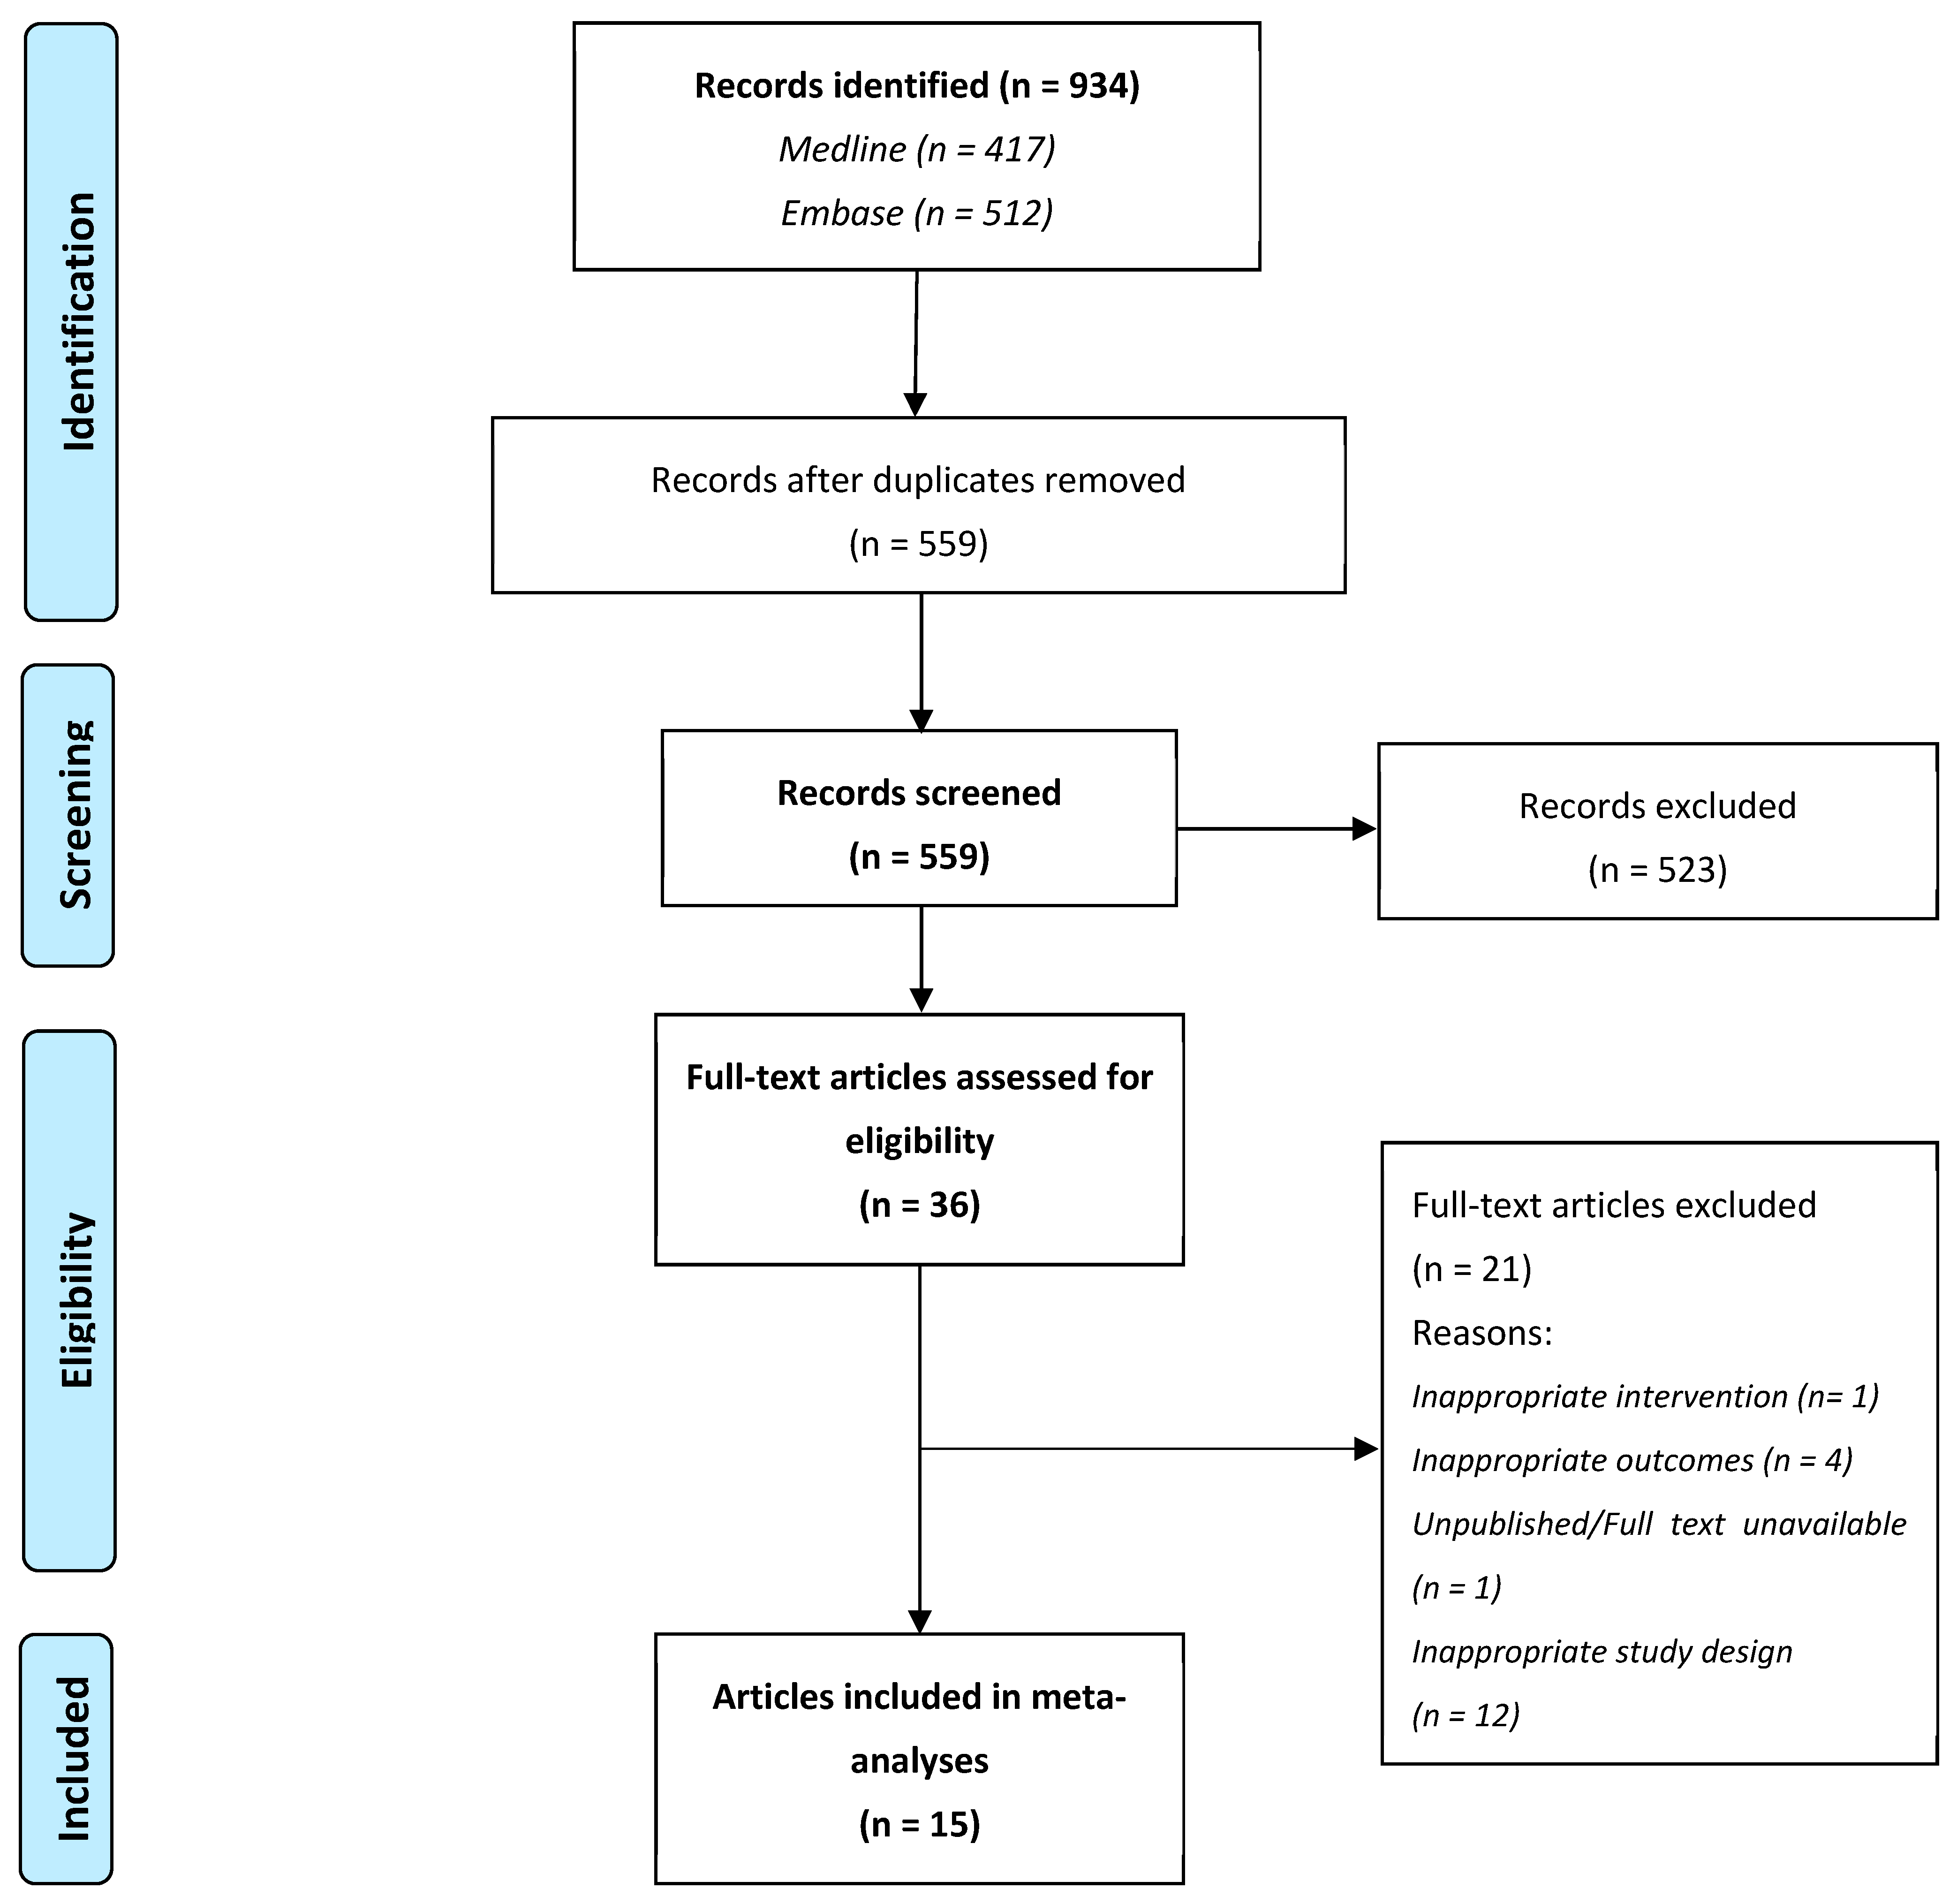
Figure 1. Preferred Reporting Items for Systematic reviews and Meta-analyses flow chart.
Dietetics 02 00009 g001
Figure 2. The effect of meat substitutes on total cholesterol concentration (mmol/L). Results are expressed as mean difference (95% confidence interval) [10,12,13,14,15,16,17,19,20,21]. Arrows indicate that the confidence interval exceeds the scale on the x-axis, red squares indicate the mean difference for individual studies, black diamond represents the aggregated mean difference and confidence interval.
Dietetics 02 00009 g002
Figure 3. The effect of meat substitutes on LDL-cholesterol concentration (mmol/L). Results are expressed as mean difference (95% confidence interval) [10,11,12,13,14,15,16,17,19,20,21]. Arrows indicate that the confidence interval exceeds the scale on the x-axis, red squares indicate the mean difference for individual studies, black diamond represents the aggregated mean difference and confidence interval.
Dietetics 02 00009 g003
Figure 4. The effect of meat substitutes on HDL-cholesterol concentration (mmol/L). Results are expressed as mean difference (95% confidence interval) [10,11,12,13,14,15,16,19,20,21]. Arrows indicate that the confidence interval exceeds the scale on the x-axis, red squares indicate the mean difference for individual studies, black diamond represents the aggregated mean difference and confidence interval.
Dietetics 02 00009 g004
Figure 5. The effect of meat substitutes on triglyceride concentration (mmol/L). Results are expressed as mean difference (95% confidence interval) [10,11,12,13,14,15,16,17,19,20,21]. Arrows indicate that the confidence interval exceeds the scale on the x-axis, red squares indicate the mean difference for individual studies, black diamond represents the aggregated mean difference and confidence interval.
Dietetics 02 00009 g005
Figure 6. The effect of meat substitutes on fasting blood glucose (mmol/L). Results are expressed as mean difference (95% confidence interval) [10,11,13,19,20,21]. Arrows indicate that the confidence interval exceeds the scale on the x-axis, red squares indicate the mean difference for individual studies, black diamond represents the aggregated mean difference and confidence interval.
Dietetics 02 00009 g006
Figure 7. The effect of meat substitutes on blood pressure (mmHg). (a) Systolic blood pressure; (b) Diastolic blood pressure. Results are expressed as mean difference (95% confidence interval) [11,12,13,16,18,19,20]. Arrows indicate that the confidence interval exceeds the scale on the x-axis, red squares indicate the mean difference for individual studies, black diamond represents the aggregated mean difference and confidence interval.
Dietetics 02 00009 g007
Figure 8. The effect of meat substitutes on weight (Kg). Results are expressed as mean difference (95% confidence interval) [13,16,19,20,21]. Arrows indicate that the confidence interval exceeds the scale on the x-axis, red squares indicate the mean difference for individual studies, black diamond represents the aggregated mean difference and confidence interval.
Dietetics 02 00009 g008
Table 1. Study designs and participant characteristics.
AuthorCountryYearDesignDuration (Weeks)NMean Age or Age Range (Years)Men (%)InterventionControlQuantity of Substitute Per DayPopulation
Sirtori [17]Italy1977RCT, O, P62040–6850Plant-basedOmnivorousTextured soy protein in place of animal proteinType-II hyperlipoproteinemia
Margetts [18]Aus1985RCT, O, P123949.971.8Plant-basedOmnivorousLOV diet with substitutes derived from wheat gluten, soy, and peanut proteinMild hypertension
Kestin [12]Aus1989RCT, O, C61744100Plant-based Omnivorous LOV diet with substitutes derived from wheat gluten, soy, and peanut proteinHealthy
Turnbull [15]UK1990RCT, O, P31719–4829.4MycoproteinOmnivorous191 g wet weight, 40 g dry weightTC > 5.2 mmol/L
Turnbull [14]UK1992RCT, B, P82121–6166.7MycoproteinOmnivorous diet130 g wet weight, 26.9 g dry weightTC > 5.2 mmol/L
Azadbakht [13]Iran2007RCT, O, C842NR0Plant-based Omnivorous diet30 g textured soy proteinPostmenopausal women
Azadbakht [19]Iran2008RCT, O, P2084162.143.9Plant-basedOmnivorous15.5 g textured soy proteinType 2 diabetics with nephropathy
Ruxton [10]UK2010CT, O, P61539.2NRMycoproteinOmnivorous diet88 g wet weight, 21 g dry weightTC > 4.19 mmol/L
Bakhtiary [20]Iran2012RCT, O, P125064.40Plant-basedOmnivorous35 g textured soy proteinElderly women with MetS
Crimarco [11]US2020RCT, O, C8365033Plant-basedOmnivorous≥2 servings of Beyond MeatHealthy
Bianchi [16]UK2021RCT, O, P41143533Mycoprotein + plant-basedOmnivorousParticipants were provided with a range of substitutes every fortnightHealthy
Ta [21]Vietnam2022RCT, O, P44760.938.3Plant-basedOmnivorous40 g textured soy proteinType 2 diabetics
C, crossover; CT, controlled trial; LOV, lacto-ovo vegetarian; MetS, metabolic syndrome; NR, not reported; O, open label; P, parallel; RCT, randomized controlled trial; B, blinded; TC, total cholesterol.
Table 2. GRADE summary of findings.
GRADE
OutcomesEffect (95% CI)N (No. Studies)Risk of BiasInconsistencyIndirectnessImprecisionPublication BiasCertainty of Evidence
Total Cholesterol (mmol/L)SMD 0.50 lower
(0.70 lower to 0.29 lower)
384 (10) ⊕⊕⊕◯ MODERATE
LDL Cholesterol (mmol/L)SMD 0.39 lower
(0.57 lower to 0.21 lower)
420 (11) ⊕⊕◯◯ LOW
HDL Cholesterol (mmol/L)SMD 0.01 higher
(0.02 lower to 0.05 higher)
400 (10) ⊕⊕⊕◯ MODERATE
Triglycerides (mmol/L)SMD 0.15 lower
(0.29 lower to 0.01 lower)
420 (11) ⊕⊕◯◯ LOW
Fasting Blood Glucose (mmol/L)SMD 0.08 lower
(0.23 lower to 0.08 higher)
231 (6) ⊕◯◯◯ VERY LOW
Systolic Blood Pressure (mmHg) SMD 0.32 lower
(1.79 lower to 1.14 higher)
339 (7) ⊕⊕◯◯ LOW
Diastolic Blood Pressure (mmHg) SMD 0.49 higher
(0.30 lower to 1.28 higher)
339 (7) ⊕⊕◯◯ LOW
Weight (Kg)SMD 0.12 lower
(1.52 lower to 1.27 higher)
294 (5) ⊕⊕◯◯ LOW
Shading indicates presence of GRADE criteria.
Disclaimer/Publisher’s Note: The statements, opinions and data contained in all publications are solely those of the individual author(s) and contributor(s) and not of MDPI and/or the editor(s). MDPI and/or the editor(s) disclaim responsibility for any injury to people or property resulting from any ideas, methods, instructions or products referred to in the content.