Article

Effects of Aging on Secreted Adipocytokines in Visceral Fat of Female C3H/HeJ Mice Consuming a Long-Term High-Fat Diet

1
Department of Biological Sciences, Texas Tech University, 2500 Broadway, Lubbock, TX 79409, USA
2
Obesity Research Institute, Texas Tech University, 2500 Broadway, Lubbock, TX 79409, USA
*
Author to whom correspondence should be addressed.
Dietetics 2024, 3(2), 191-213; https://doi.org/10.3390/dietetics3020016
Submission received: 14 March 2024 / Revised: 1 June 2024 / Accepted: 5 June 2024 / Published: 13 June 2024

Abstract

:
The excess consumption of a high-fat diet has been identified as one of the factors contributing to obesity. Women are at higher risk of adult obesity than men, predisposing them to a different set of detrimental disease conditions. Furthermore, aging studies show that physiological decline also has a serious impact on changes in the endocrine properties of white adipose tissue. However, there is still relatively little known about the factors associated with obesity and aging and their compounding impacts on women’s health. To investigate changes in adipocytokine secretion profiles, obesity was induced in female C3H/HeJ mice through the long-term consumption of a high-fat diet. Weight gain measurements and the Echo MRI analysis of fat composition showed that increases were due solely to the high fat content in the diet. Adipocytokine secretions were analyzed in media conditioned from harvested visceral fat tissue that was organ-cultured ex vivo. Adipocytokine analysis performed across diets and ages showed that there were significant increases in Adiponectin and Leptin secretion in high-fat diets, accelerating increases in Resistin secretion in high-fat diets. Aging induced the increased secretion of Lipcalin-2, Pentraxin-3, Serpin E1, MCP-1, and ICAM-1, regardless of diet. Furthermore, the comparisons of organoid-cultured protein secretions and flash-frozen tissue samples differed greatly, suggesting the WAT organoid cultures may yield information that is more reflective of in situ conditions. Taken together, our results show that high-fat diets and aging in C3H/HeJ female mice significantly impact secretions from adipose tissue, which may contribute to women’s health issues.

1. Introduction

White adipose tissue (WAT) is no longer considered to be just an insulating cushion for the body’s internal organs [1]. It is an endocrine organ, secreting adipokines and adipocytokines that have paracrine and endocrine effects [2,3]. Their changes in expression, followed by the infiltration of pro-inflammatory immune cells under obese conditions, are responsible for the emergence of local and systemic pathogenic conditions such as type 2 diabetes mellitus, cancer (liver, colon, breast, ovary, and prostate), fatty liver, hypertension, Alzheimer’s disease, depression, and asthma [4,5,6,7,8]. Obesity is reaching pandemic proportions in the Western Hemisphere, and the most common contributing factor behind this consequence is the excessive consumption of calories and an energy-dense diet [9]. Epidemiological evidence suggests a positive correlation between high-fat diets and the development of obesity [10,11]. Due to physiological decline, aging is another critical variable that also has a serious impact on changes in the endocrine properties of white adipose tissue. Age-associated changes, such as a decline in fat mass and sex hormones, the redistribution of lipids from subcutaneous to visceral deposits, a decline in brown adipose tissue function, reductions in the differentiation and proliferation potential of adipose progenitor stem cells, cellular senescence, cell stemness, and adipogenesis, give rise to multifactorial effects that alter the secretion patterns of WAT [12,13,14]. This ultimately hampers metabolic homeostasis through ectopic lipid deposition, inflammation, disruptions in glucose metabolism, and insulin sensitivity [12,13,14]. Under these circumstances, excess adiposity accelerates the aging process [12]. A few studies have reported the correlation between the changes in adipocytokine secretion with aging and obesity under different dietary interventions, mostly in male mice [15,16,17,18,19,20]. Furthermore, fewer studies have explored these changes in female mice [21]. In the current study, a diet-driven induction-of-obesity (DIO) approach was used in a long-term study of CH3/HeJ female mice in order to investigate the effects of a high-fat diet and aging on changing the expression of endocrine factors secreted from WAT.
To navigate the association between obesity-mediated changes in WAT and the emergence of various metabolic disorders in organs at the molecular level, different in vitro, in vivo, and clinical study models of WAT are available [3]. However, the significant variability between these study models can affect the relevance of experimental outcomes [1,22]. One of the most common strategies with which to study WAT-associated disease biology at the cellular and molecular level is an in vitro research approach, where adipocyte cell lines are used to mimic the in vivo effect of WAT [3]. By definition, WAT is heterogeneous, containing preadipocytes, adipocytes, macrophages, stem cells, neutrophils, lymphocytes, endothelial cells, and other cell types [12]. Hence, the adipocyte cell model used for in vitro research differs significantly from the in vivo form of WAT, potentially impacting the interpretation of experimental outcomes [1,22]. Furthermore, according to the CDC, women are reported to have a higher prevalence of adult obesity than men [23]; this, in turn, is responsible for the emergence of different detrimental disease conditions in women [24,25,26]. To better understand how a high-fat diet and aging change the adipocyte-secreted factors of WAT in the in vivo microenvironment, the current study generated a conditioned medium derived from visceral fat of female mice cultured ex vivo using an organ culture technique [1,22]. Organ culture techniques allow for the maintenance of the organotypic cell–cell and cell–matrix interactions of WAT ex vivo [1,22] and more closely recapitulate the traits of WAT from the in vivo microenvironment.
There are various strains of mice whose responses to exposure to high-fat diets have been characterized [27,28]. The most used mouse strain for diet induction in obesity studies is C57BL/6 mice. However, this mouse strain has susceptibility to fat accumulation, weight gain, hyperglycemia, and insulin resistance when fed on high-fat diets [29,30]. To circumvent this predisposition, and to evaluate the impact of a high-fat diet alone in terms of contributing to the changes in adipocytokine secretion in WAT under obese conditions in vivo through a DIO approach, the C3H/HeJ mouse strain was used. C3H/HeJ is a general strain of mice used for cancer-, immunology-, inflammation-, and cardiovascular-related research studies in the biomedical sciences. To date, no study has reported on their susceptibility to obesity, making the model suitable for investigating the impact of the diet-mediated induction of obesity and/or aging on changes in the secretion pattern of adipocytokines. This current study reports on the changes in the diet- and age-induced adipocytokine secretion profiles of visceral fat in female C3H/HeJ mice using a DIO approach. The findings yield important information for understanding the connection between the influence of high-fat diets on the aberrant secretion of adipocytokines, seen with the emergence of obesity-associated health disorders and aging in women. Thus, the results from this study will help, not only in establishing this mouse strain as a study model for obesity and its associated metabolic disorders, and by yielding important information on how adipocyte-secreted factors from WAT change with a high-fat diet and aging in females, leading to new areas of study in terms of their impact on women’s health.

2. Materials and Methods

2.1. Mouse Study Design

The mice used in this specific study were a part of a much larger study under Texas Tech University IACUC protocol 19021-02. For this study specifically, a total of 32 C3H/HeJ female mice were utilized at 4 weeks of age. At all times, mouse care and handling were followed as per the protocol. This strain of mice was selected as a robust, generic strain, being unmodified for disease susceptibility or resistance. After two weeks of acclimatization, female C3H/HeJ mice were randomized into two customized diets. Diets, prepared by Research Diets, Inc. (New Brunswick, NJ, USA), were categorized based on dietary fat content (control fat: 11% fat kcals, or high-fat (HF): 46% fat kcals %). The total dietary components and formulations are listed in Supplementary Table S1. Mice were housed in a ventilated cage (4 per cage) with a 12 h light/dark cycle at 22–23 °C and 70% humidity. They also had access to their respective diets and water ad libitum. Their weight and food intake were measured weekly. At the end of the dietary intervention period (12 months and 18 months for this study), mice were fasted for 2 h before euthanasia. At collection, 16 females (8 control and 8 HF) from 4 cages (2 control and 2 HF) were euthanized using CO2 gas inhalation, followed by cervical dislocation, as per the IACUC-approved protocol 19021-02. The resection of visceral fat immediately followed, and the WAT was processed into organoid cultures within 30 min of collection.

2.2. Whole Body Composition Analysis

To analyze the weight gain status based on the body composition of the control and experimental groups of mice, the Echo MRITM Body Composition Analyzer E26-292-BH (EchoMRI Inc., Houston, TX, USA) was used. Echo MRI provides precise measurements of the fat mass, lean tissue, free water, and total water composition of a live animal (i.e., mouse) using a nuclear magnetic resonance method [31,32,33,34,35,36,37,38]. The body composition of all mice was analyzed at the baseline value of 0 and monthly until the termination of the experiment. For purposes of this study, only months 12 and 18 were analyzed to assess adipocytokine secretion changes.

2.3. Tissue Extraction

Mouse visceral fat, anatomically located around the branches of the superior and inferior mesenteric arteries, was used for this study [22,39]. The rationale for choosing visceral fat over other fat deposits is based on its active metabolic potential to produce hormones and cytokines over other fat deposits [16,39,40]. Following euthanasia, mice were first positioned anatomically and pinned in place. Using a scalpel, an incision was made along the midline, extending caudally to the pubic symphysis. Forceps were used to grasp the skin, and a scalpel was used to carefully separate the skin from the peritoneum. This allowed access to the visceral white adipose tissue (WAT) deposits, from which a 5 mm3 portion was collected and placed into appropriately labeled 2 mL microcentrifuge tubes. Microcentrifuge tubes containing visceral WAT samples were then flash-frozen in liquid nitrogen and stored at −80 °C. Approximately 5 mm3 of the remaining fat was used for the organ culture procedures described in the following section.

2.4. Protein Extraction

The protein extraction process was performed cautiously and under low temperatures (4 °C) to prevent protein degradation. The reagents used were stored as per the manufacturer’s instructions and kept on ice when used. Moreover, any additional microcentrifuge tubes to be used were stored at −80 °C prior to use and immediately placed on ice after being removed from −80 °C storage. Similar to the additional microcentrifuge tubes, when visceral WAT samples were removed for protein extraction, they were kept on ice. To begin the protein extraction process, ~400 μL of RIPA buffer (Lot# XG348655, Thermo Fisher Scientific, Waltham, MA, USA) was added to a 2 mL microcentrifuge tube. For every 100 μL of RIPA buffer, 1 μL of Halt Protease Inhibitor Cocktail 100× (Product# 1862209, Thermo Fisher Scientific, Waltham, MA, USA) was added, as outlined in the manufacturer’s recommendations. The broad spectrum of protease inhibitor cocktail contains AEBSF, aprotinin, E-64, bestatin, leupeptin, and pepstatin A. After thoroughly vortexing the solution, it was then transferred to sterile, pre-cooled 2 mL homogenization tubes containing 1.4 mm ceramic soft tissue homogenizing beads (VWR, Catalog # 10158-610). An average of ~50 mg of sample tissue was added to the tube before inverting it to ensure its complete coating with the RIPA buffer/Halt Protease Inhibitor cocktail mixture. Visceral WAT samples were then homogenized using the Bead Mill Homogenizer (Catalog # 75840-022, VWR, West Chester, PA, USA), which was preset to 6 m/s for 30 s. Samples were removed and immediately placed on the rotating apparatus to allow for continuous agitation for an hour. Following agitation, samples were placed into a mini-spin microcentrifuge (Eppendorf 5452 Minispin Centrifuge, Hamburg, Germany) and spun at 13,000 RPM for 15 min. Following centrifugation, the sample was separated into a clear supernatant with a white lipid layer on the top. A micropipette was used to pierce the lipid layer and remove the protein extract before transferring it to a new, properly labeled 1.5 mL microcentrifuge tube. Protein concentration was then determined, followed by final storage at −80 °C to reduce the number of freeze–thaw cycles occurring and thus preserve protein integrity.

2.5. Protein Quantification

The protein concentration for each sample was then quantified using the Pierce Bicinchoninic Acid (BCA) Protein Assay Kit (Thermo Fisher Scientific, Waltham, MA, USA). The quantification assay was conducted following the manufacturer’s recommendations. Prior to quantification, a portion of each sample was diluted by a factor of ten with RIPA buffer to ensure that it fell within the assay’s detectable limits for optimal accuracy. After quantification, the obtained value could be multiplied by the dilution factor to obtain the protein concentration for each sample.

2.6. Visceral Fat Tissue Harvest for Organ Culture

Visceral WAT deposits were surgically removed from female mice within 30 min of euthanasia. The collected fat deposit was placed in a 50 cc tube containing a sterile mixture of Medium 199, supplemented with glutamine and 25 nM HEPES (Catalog# 12340030, Thermo Fisher Scientific, Waltham, MA, USA), 50 μg/mL gentamycin (Lot# 058M4860V, Millipore Sigma, Burlington, MA, USA), and 1% penicillin–streptomycin (Catalog # 15140122, Thermo Fisher Scientific, Waltham, MA, USA). Under aseptic conditions, the fat tissue was then coarsely minced using sterile scissors to avoid hypoxia. Once minced, the sample could remain at room temperature for an hour. The tube was capped and transported to the lab within 30 min. Next, a nylon mesh (Mfr # 148147- item # EW-06631-15, Cole Palmer-Scientific, Vernon Hills, IL, USA) of ~240–300 μm was made into a cone shape and placed on a 500 mL bottle opening. At least 300 mL of sterile 1× PBS was poured over the minced fat to drain all the blood and other waste from the minced fat deposit. After cleaning, the fat tissues were recovered from the mesh and put into a petri dish using sterile forceps. The petri dishes were weighed beforehand and adjusted with the weight of fat tissue to ~0.5 gm of fat per dish. Fat tissue weight may have been overestimated as it was not dry. Following this, ~15 mL of culture media containing a mixture of M199 media supplemented with 50 μg/mL gentamycin, 1% penicillin–streptomycin, 0.5 μg/mL amphotericin B (Catalog # 15290018, Thermo Fisher Scientific, Waltham, MA, USA), 0.7 nM of insulin (Catalog # I0516, Sigma-Aldrich, St. Louis, MO, USA), and 250 nM of dexamethasone (Catalog# BML-EI126-0001, Enzo Life Sciences, Farmingdale, NY, USA) was added to each dish (Table 1). The media supernatants from every petri dish were collected every 24 h for one week and replenished with Medium 199 and freshly added hormones. These collected media supernatants were the conditioned media which were frozen at −80 °C and used to determine adipocytokine profiles later.

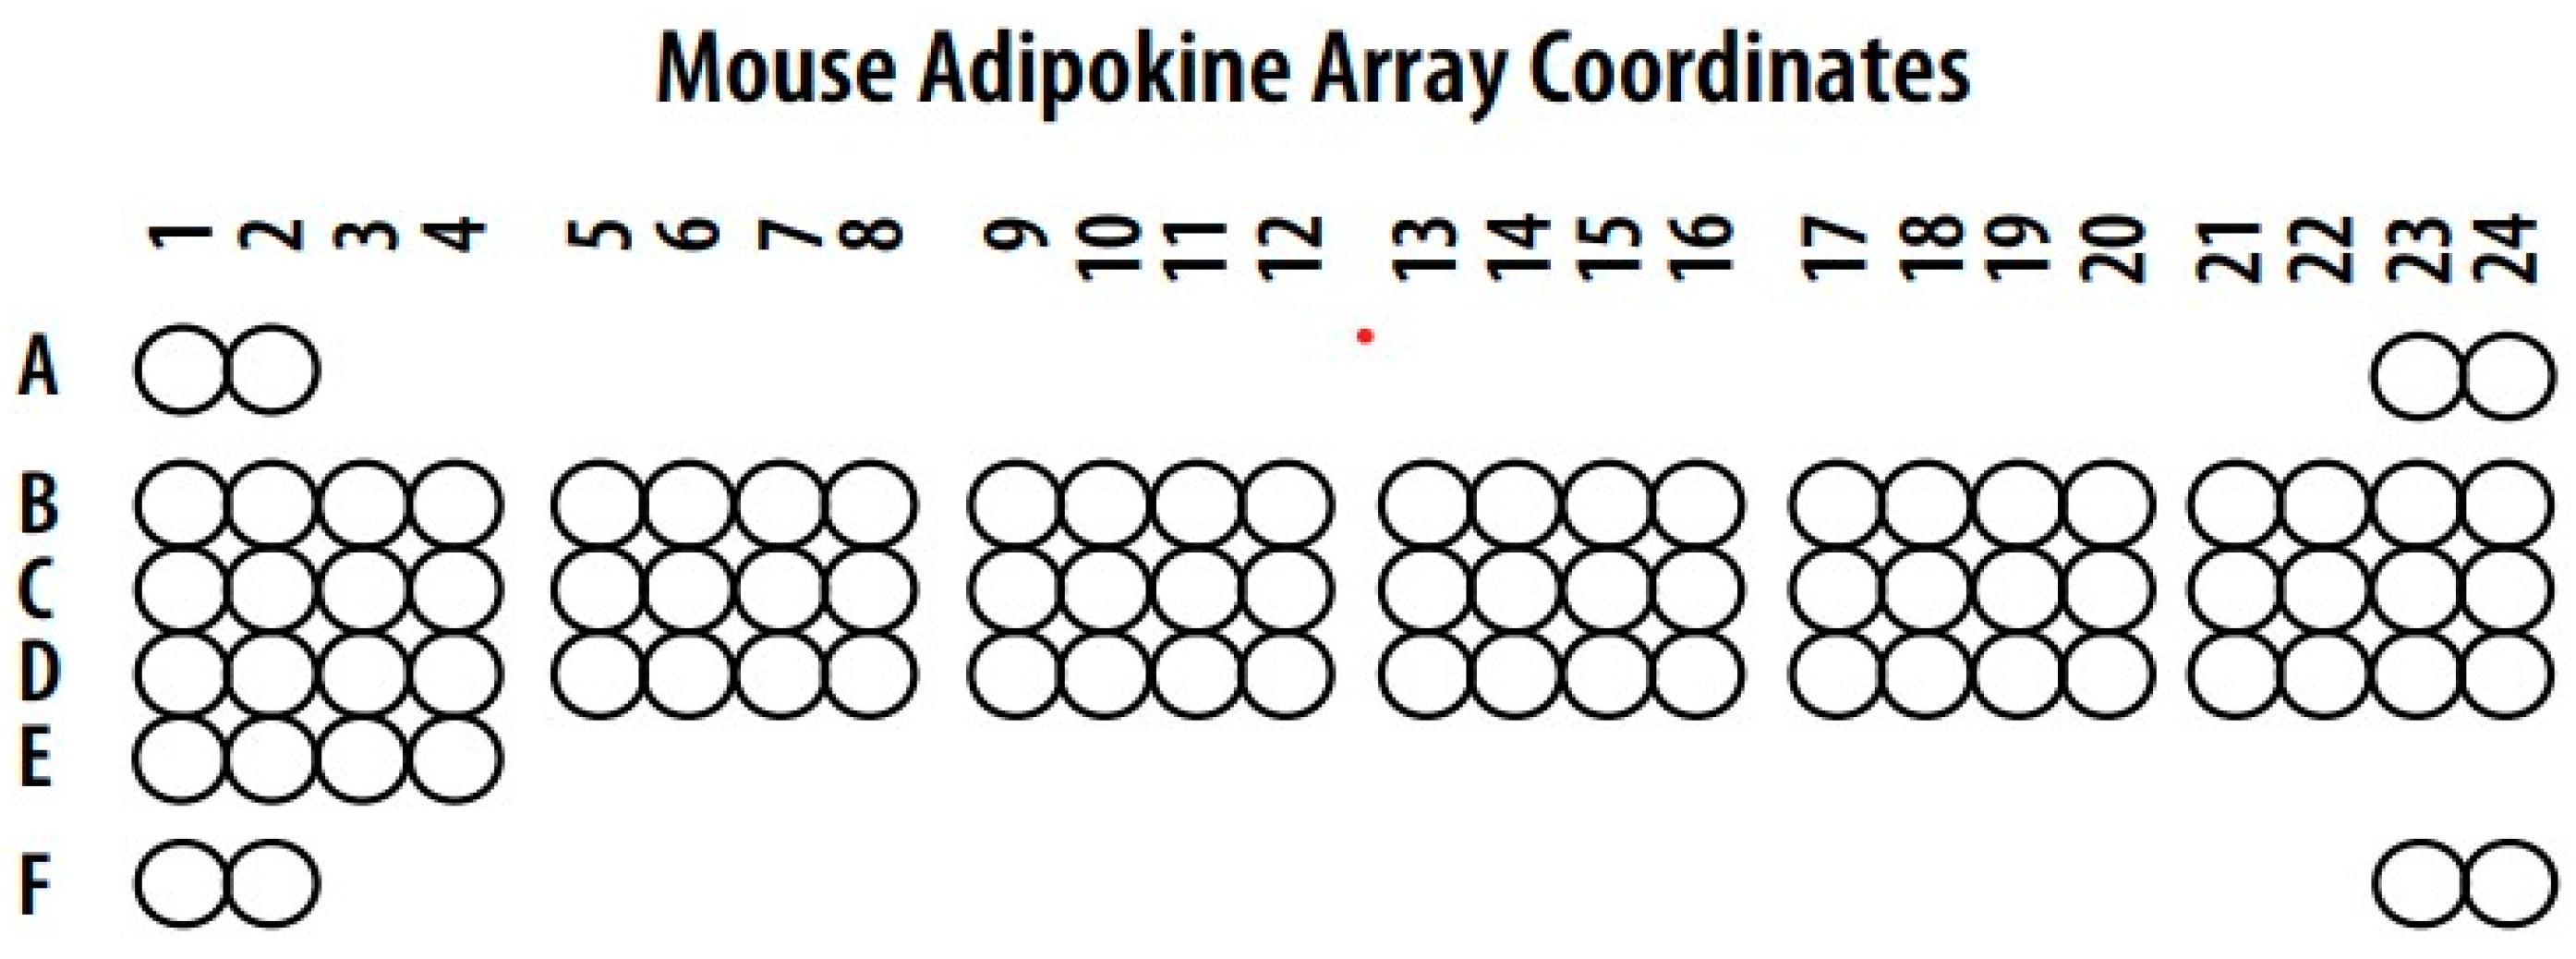
2.7. Adipocytokine Analysis from Organoid Cultures

The adipose secretion profiling of the conditioned media collected from the organ-cultured visceral fat was performed using a Proteome Profiler Mouse Adipokine Array Kit (Catalog# ARY013, R and D Systems, Minneapolis, MN, USA), following the manufacturer’s protocol. Chemiluminescence was detected with the Odyssey® Fc Imaging System (LI-COR Biosciences, Lincoln, NE, USA), with 8 min of exposure time. This profiler kit contained antibodies printed onto nitrocellulose membranes against 38 commonly occurring adipocytokines secreted by mouse adipocytes (shown in Figure 1 and listed in Table 2). This approach was used to generate a broad overview of the adipocytokines secreted by mouse adipocytes rather than using an ELISA kit for a particular adipocytokine separately.

2.8. Adipocytokine Protein Levels from Flash-Frozen Tissue Samples

Flash-frozen samples of adipose tissue are different to work with than other tissue types due to their concentrations of lipids. Therefore, a modified protein extraction approach was used. Briefly, 0.5 mL of RIPA buffer without Triton X-100 was added to ~100 mg of adipose tissue in a 2.0 mL tube with a protease inhibitor. We used the Halt Protease Inhibitor Cocktail at 10 µL/mL. The recommended RIPA lysis buffer contained 50 mmol/L Tris-HCl (pH 8.0); 0.25 mol/L NaCl; 5 mmol/L EDTA; and 1% Triton X-100 (v/v). Tissue was homogenized using the TissueLyser II (Qiagen, Hilden, Germany) at the highest frequency for 3–5 min with the addition of one stainless steel bead into the 2 mL tube. The sample was kept on ice. Once clear, the sample was centrifuged at 6000× g for 15 min at 4 °C (9500 RPM). The fat cake (refers to the white lipid layer on top of the aqueous layer) was carefully removed and the loose pellet was resuspended. It should be noted that it is alternatively possible to use the pipette tip to penetrate the fat cake and transfer the solution and the pellet to a new 1.5 mL tube. Triton X-100 was added to a final concentration of 1% (v/v), mixed well, and the sample was kept on ice. The sample was incubated at 4 °C for 30–60 min; it was then centrifuged at 12,000× g for 15 min at 4 °C (13,500 RPM). The upper lipid layer was removed, and the supernatant transferred to a new 1.5 mL tube. The samples were stored at −80 °C until being analyzed.
The following ELISA kits were purchased to determine the levels of adipocytokines from FF-WAT based on the prior results from the mouse adipokine array. The 6 adipokines/adipocytokines with the strongest signal were assayed using these ELISA kits. For each ELISA, 400 µg of tissue lysate was used to run the test on the Adipokine membrane. For this study, the manufacturer’s instructions were followed.
Mouse Adiponectin ELISA Kit-Cat# KMP0041 (Invitrogen, Waltham, MA, USA)
Mouse Leptin ELISA Kit-Cat# KMC2281 (Invitrogen, Waltham, MA, USA)
MCP-1 ELISA Kit-Cat# BMS6005 (Invitrogen, Waltham, MA, USA)
Mouse Resistin ELISA Kit-Cat# EMRETN (Invitrogen, Waltham, MA, USA)
Mouse VEGF-A ELISA Kit-Cat# BMS619-2 (Invitrogen, Waltham, MA, USA)
Mouse TIMP1 ELISA Kit-Cat# KE10039 (Proteintech, Rosemont, IL, USA)

2.9. Statistical Analysis

The statistical interpretation of the data was performed using GraphPad Prism 9 software (GraphPad Software Inc., San Diego, CA, USA). When calculating mouse weight changes, total % fat (or lean) mass columns are the average mass type of all samples/average total mass of all samples ×100. Each experiment was conducted independently 3 times with at least 2 technical replicates and the resultant data were expressed as mean ± standard error. The statistical significance of the treatment group and control was determined using two-way analysis of variance (ANOVA). Tukey’s post hoc test was employed for multiple comparisons of means between groups. Overall, a p value < 0.05 was considered statistically significant.

3. Results

3.1. Changes in Weight and Body Composition in Control Fat and High-Fat-Fed Mice

To measure the changes in the weight, fat, and lean mass composition of female C3H/HeJ mice with respect to a given diet, their weight and body composition variables were noted by weighing them once every week and performing Echo MRI every month, respectively. In Table 3, experimental samples represent the animals that were sacrificed at the given time points (Months 12 and 18). The progressive samples represent the animals that were not sacrificed during Month 12 and instead progressed to Month 18. A sample size of less than 8 represented the unexpected death of mice in their respective cages, being randomly selected for sacrifice in Month 12 and Month 18.
The changes in the cumulative weight, fat, and lean mass composition of female C3H/HeJ mice, grouped based on the control diet and high-fat diet, in Month 12 and Month 18 were compared with the control, baseline mice at time 0. The mice started this study with an average weight of 17.2 g at time 0. Female C3H/HeJ mice, fed on a high-fat diet, were observed to have increases of more than 100% (~119%) in their body weight during Month 12 compared to the initial weight measured for mice at time 0. In contrast, the changes in the weight of mice fed the control diet in Month 12 were much smaller, being measured at ~41%. The trend in weight gain of both the mice groups on Month 18 was similar to that of Month 12. However, on Month 18, both the control and experimental group of mice showed a smaller percentage of weight gain than they had on Month 12 due to aging.
The changes in the percentage of fat mass status of the control and experimental groups of mice were in proportion to their weight gain status. Mice fed on high-fat diets showed 1000-fold increases in their fat mass from the fat mass found for the mice at a time of 0. Conversely, similar comparative measurements for the fat mass of mice fed on control fat diets found that it was close to being increased 100-fold, which was much less compared to the gain by high-fat-diet-fed mice at Month 12. A similar trend of reduction in fat mass occurred with the reduction in the percentage of weight gain in the control and experimental group of mice in Month 18. Moreover, the trend in the changes of the percentage of lean mass composition for both the control and experimental mice groups, in comparison to the initial measure of lean mass composition found for control mice at time 0, paralleled the observed changes in the percentage of weight gain and fat mass composition at Month 12 and Month 18.

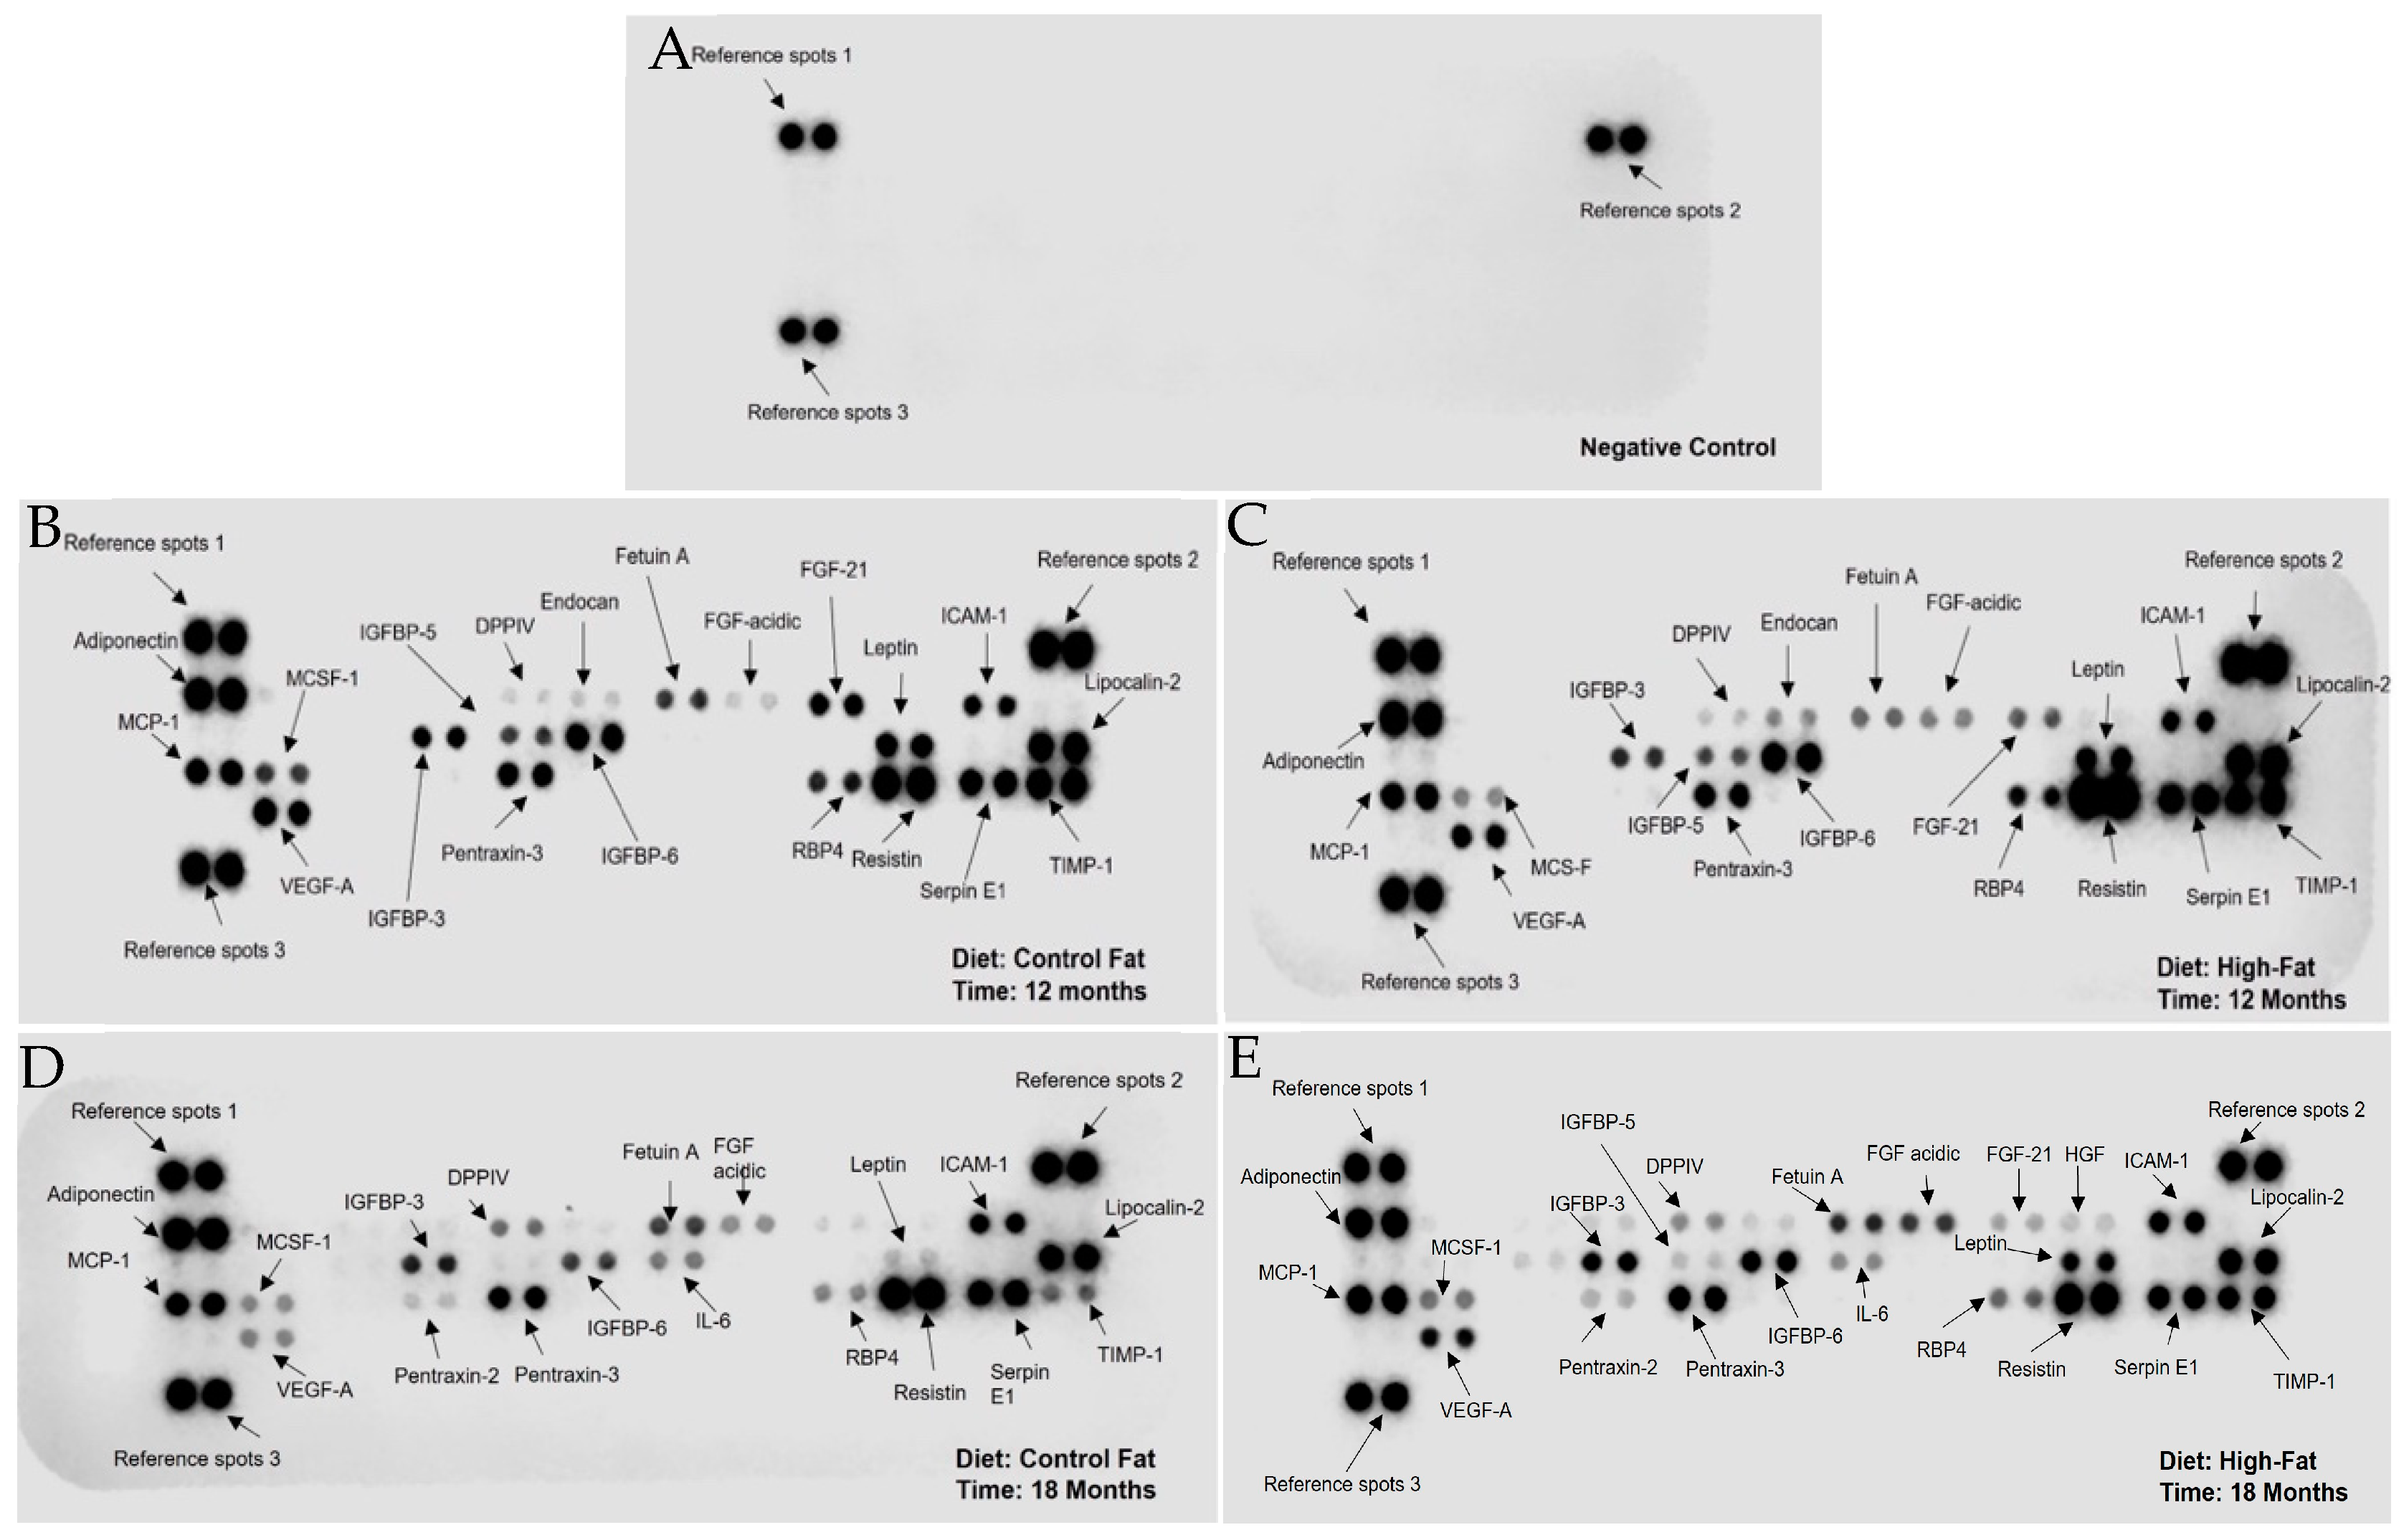
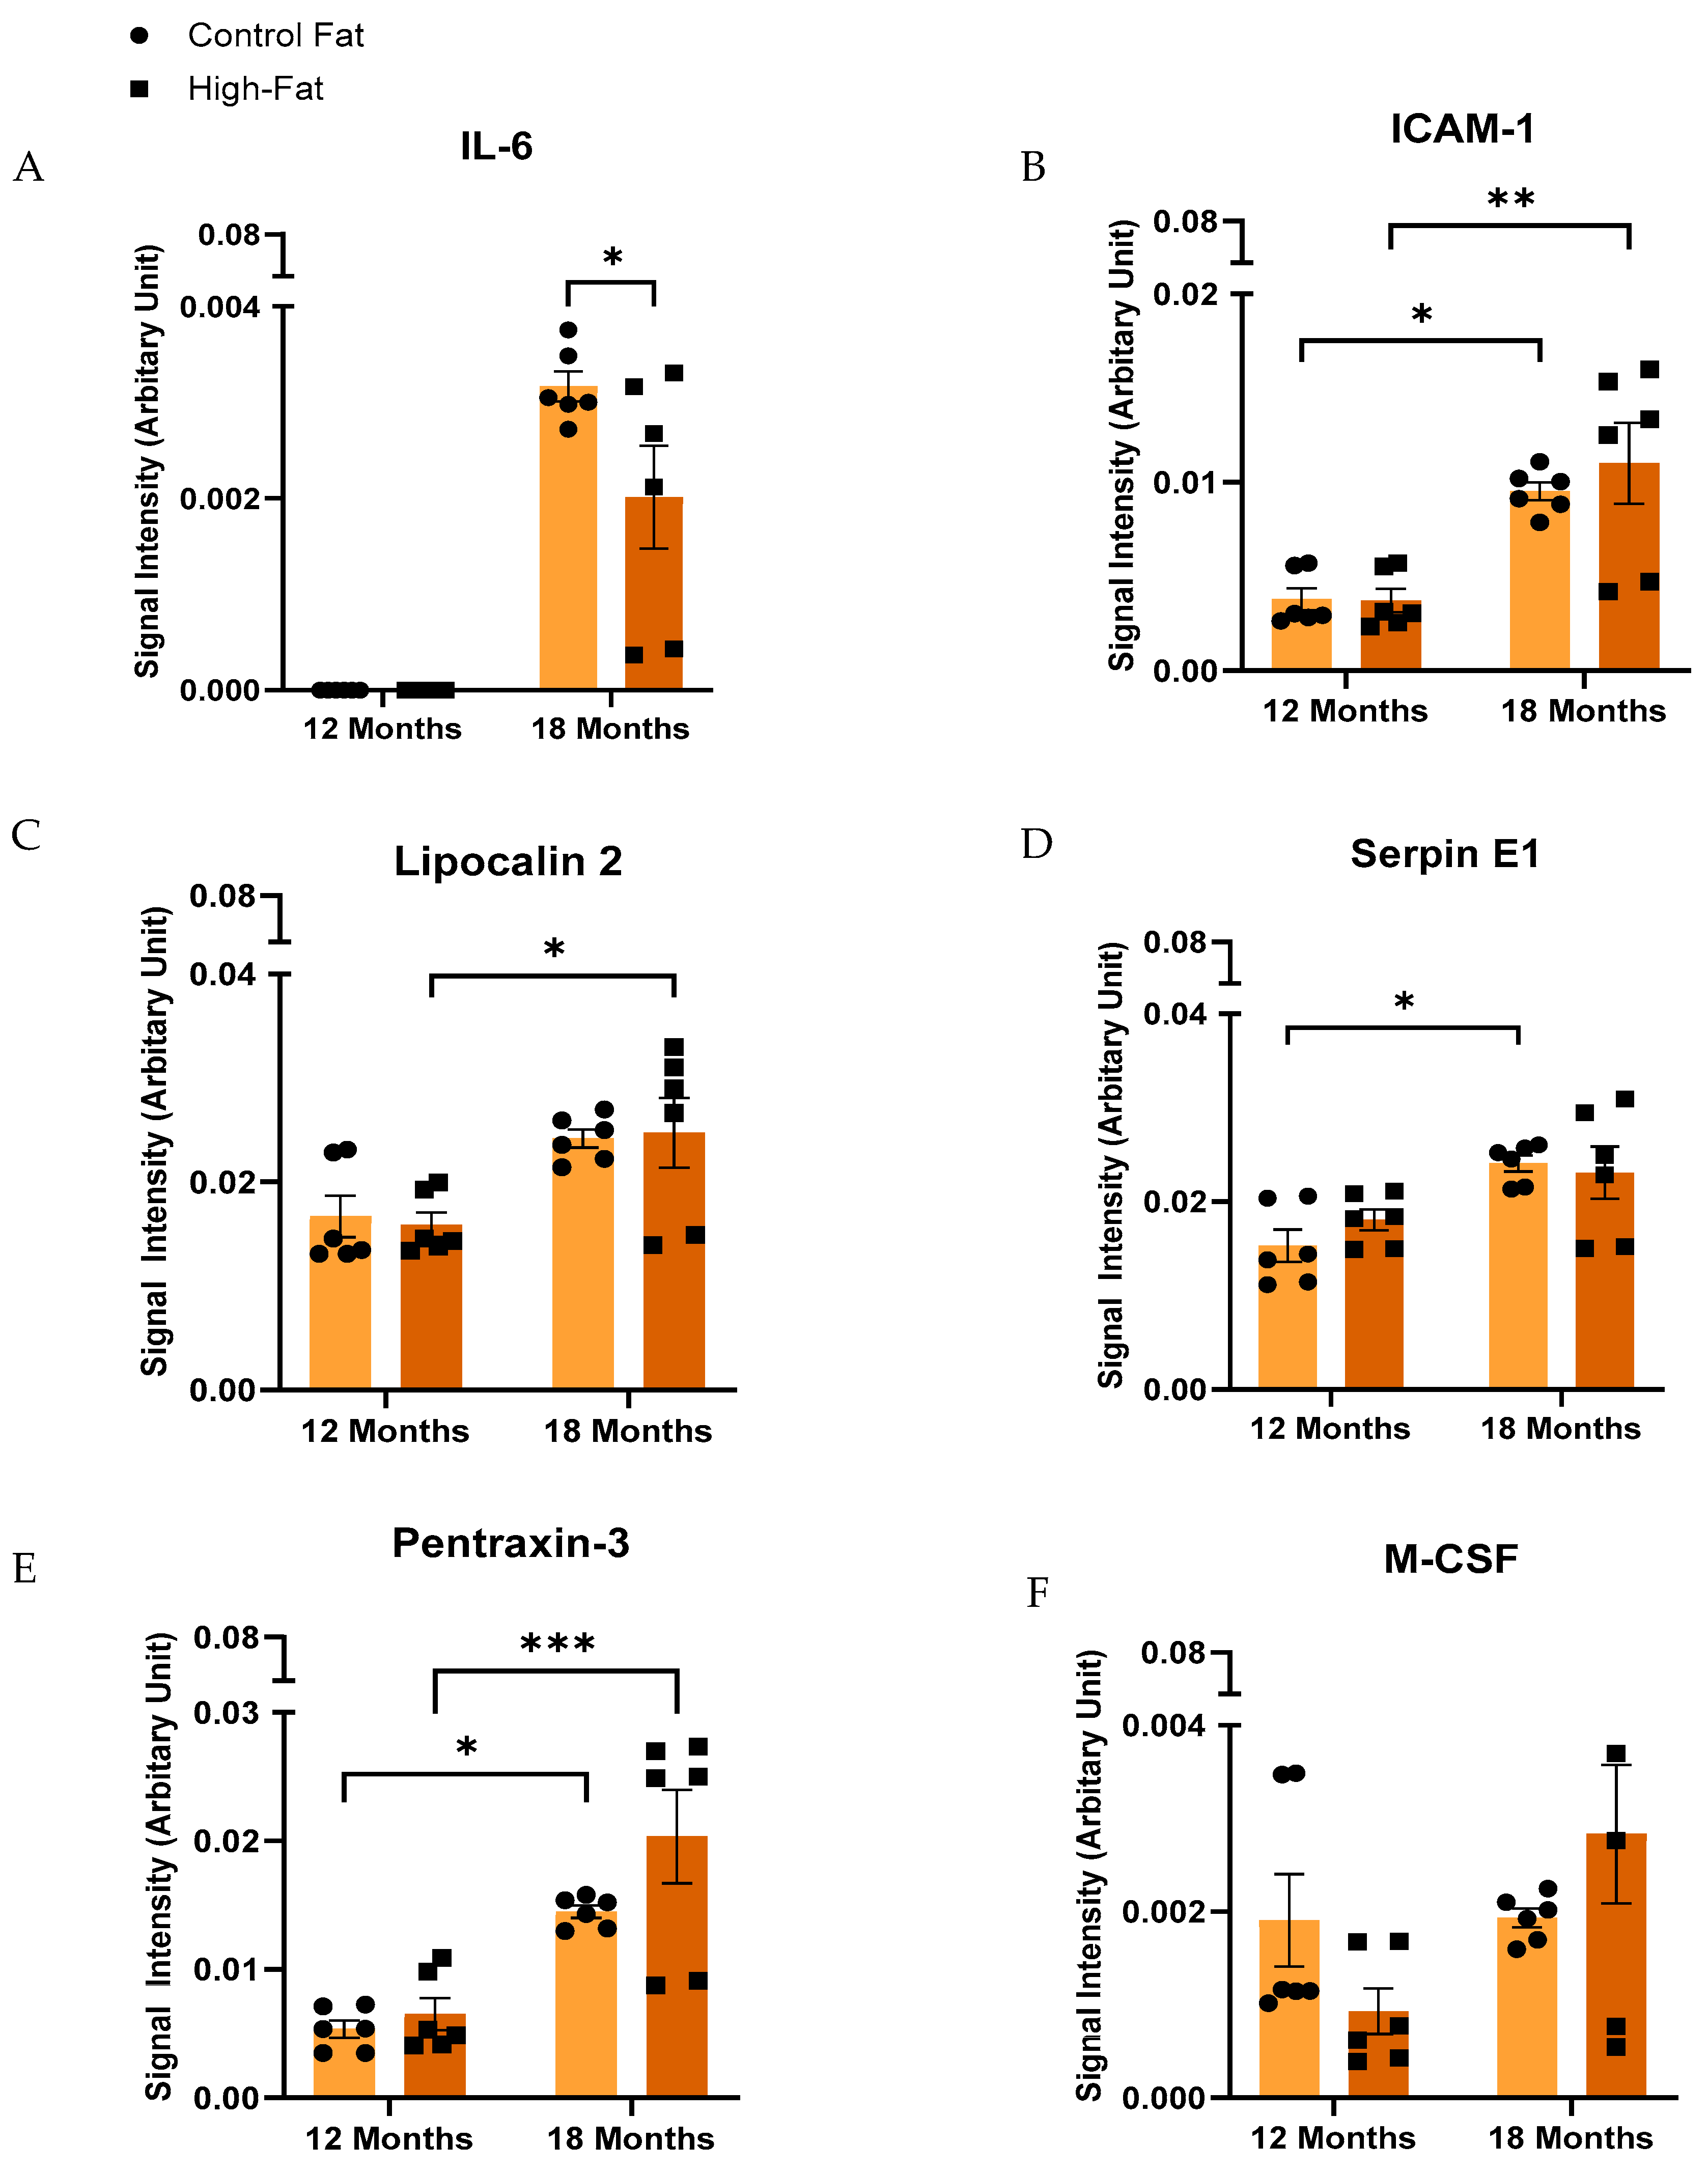
3.2. Secretome Profiles of Visceral Fat Harvested from High-Fat and Control-Diet-Fed C3H/HeJ Mice Differ Significantly with Diet and Aging

For reference, the conditioned medium collected from ex vivo organ-cultured visceral fat will be therefore represented as ExV-WAT-CM in this study. The explanation of the adipocytokine arrangement is described in the Methods section. The different adipocytokines present appears as dots. Their various intensities correlate directly to the changes in secretion patterns of the ex vivo-cultured visceral fat harvested from control and high-fat-diet-fed female C3H/HeJ mice at Month 12 and Month 18 in ExV-WAT-CM.
Figure 1 shows the signal output for the adipocytokines from the array kit. In the dot blots, the reference spots represent the intensity of a reference antibody present on the nitrocellulose membrane against which the signal intensity of the secreted ExV-WAT-CM adipocytokines, at separate time points, was measured. The changes in adipocytokine secretions between the conditioned media are designated as arbitrary units on the y-axis of the bar graph, as per the instructions from the Proteome Profiler Mouse Adipokine Array Kit (R and D System, Catalog# ARY013). The calculated expression levels of these adipocytokines in mean ± SEM are presented in Table 3. Figure 2 and Figure 3 show visual comparisons of the data included in Table 3. It is important to note the scale breaks in the y-axes for all the secreted adipocytokine results, except Adiponectin and Resistin. The scale breaks were added because, without them, there would be no meaningful visualization of the representative results in Table 3.
As shown in Figure 2 and Figure 3A and Table 4, Adiponectin was used to analyze ExV-WAT-CM, exhibiting significant increases in secretion in both control and high-fat-diet-fed mice as a result of age. Furthermore, there were significant increases in Adiponectin secretion between control and HF-diet-fed mice at 12 months. However, this difference was not observed at 18 months. Interestingly, the difference in Adiponectin secretion at 12 months in the HF-diet-fed mice was comparable to the secretion levels in the control mice when measured at 18 months (not significant). It is also important to note that, of the ExV-WAT-CM samples measured, Adiponectin was secreted at the highest concentrations along with Resistin.
The results for Leptin showed mice fed a high-fat diet had significantly increased Leptin secretion with aging, whereas that of the control-diet-fed mice trended downward. Moreover, the WAT secretion levels of Leptin also significantly increased in mice with the increase in fat mass with aging (Figure 2 and Figure 3B and Table 4). Even with an increase in the level of Leptin, mice on the high-fat diet were obese, failing to respond to reduced feeding signals from Leptin, which was most likely due to the development of Leptin resistance or insufficient Leptin sensitivity in the brain receptors [41].
Adipocytes also secrete chemokines. Monocyte chemoattractant protein-1 (MCP-1) is a chemokine that attracts blood monocytes to the site of inflammation [42]. The elevation in the level of MCP-1 is thought to be correlated with the age-related induction of inflammation (inflammaging) [43,44]. The data generated from the ExV-WAT-CM samples show that HF-diet-fed mice exhibit significantly increased secretions of MCP-1 with aging, irrespective of diet (Figure 2 and Figure 3C and Table 4). Furthermore, while there was an upward trend in control-diet-fed mice, this difference was not significant with aging, suggesting that high-fat diet alone promotes inflammatory events in aging mice.
Another important secretory protein of adipocytes (and other cells) is Resistin. It is a hormone which impairs the action of insulin and induces glucose intolerance, leading to the development of type 2 diabetes mellitus [45]. Figure 2 and Figure 3D and Table 4 showed a significant increase in the Resistin secreted in ExV-WAT-CM samples in the mice fed on a HF diet at Month 12 when compared to the control diet. Interestingly, a significant increase in the expression of Resistin was also observed in control-diet-fed mice between Month 12 to Month 18, while the difference in secreted concentrations of Resistin in the HF-diet-fed mice did not change much with aging. It is also important to note that, of the ExV-WAT-CM samples measured, Resistin was secreted AT the highest concentrations along with Adiponectin, as indicated by the y-axis scale break.
TIMP-1, a member of the family of tissue inhibitors of metalloproteinases, physiologically plays a role in the inhibition of matrix metalloproteinase. This, in turn, causes the degradation of the extracellular matrix (ECM) and tissue remodeling. The analysis of TIMP-1 in our study showed the significantly decreased expression of TIMP-1 with aging in control-diet-fed ExV-WAT-CM mouse samples (Figure 2 and Figure 3E and Table 4). In contrast, the group fed on a HF diet did not demonstrate significant changes in the expression of TIMP-1 with aging. Moreover, the expression level of TIMP-1 was decreased in mice fed on a HF diet at Month 12. It is of note that the measurements from the 18-month samples varied greatly in their distribution between mice.
Vascular endothelial growth factor (VEGF) is a protein secreted by adipocytes and other cells that drives angiogenesis. Its overexpression in tumors is associated with increased angiogenesis, proliferation, and metastasis [46,47,48]. Similar to our TIMP-1 results, the ExV-WAT-CM-analyzed secretions demonstrated significant decreases in the presence of VEGF for control-diet-fed mice between 12 and 18 months (with aging) (Figure 2 and Figure 3F and Table 4). Furthermore, the levels of VEGF between 12 and 18 months were basically unchanged, and while there was significantly less VEGF present in these samples versus the 12-month controls, the difference was not significant compared to 18-month control samples.
ICAM-1 is a cell surface glycoprotein receptor, expressed by immune, endothelial, and epithelial cells [32]. Its expression becomes upregulated in response to inflammatory stimulation, regulating the recruitment of leukocytes to the sites of inflammation [32]. Our results (Figure 2 and Figure 4 and Table 4) showed that, irrespective of diet, ICAM-1 secretion in ExV-WAT-CM was significantly increased in mice with aging, while there was no significant difference between diets at each respective timepoint. These results suggest that ICAM-1’s effects were more affected by aging than diet (in this case, HF versus control).
Lipocalin 2 is an adipocytokine produced from WAT that is responsible for transporting hydrophobic molecules like steroid hormones, fatty acids, etc., to their target site of action [49]. The results from the current study showed an increase in the secretion of Lipocalin-2 from ExV-WAT-CM in mice with aging, irrespective of the fat content in the diet (Figure 2 and Figure 4 and Table 4).
Adipocytes also secrete other proteins that directly or indirectly play a role in inflammation. IL-6 is a pro-inflammatory cytokine known to be secreted from adipocytes [50,51,52]. IL-6 expression in the ExV-WAT-CM samples at 12 months was undetectable, regardless of diet (Figure 2 and Figure 4 and Table 4). With aging, female mice expressed IL-6 at Month 18 and both control and HF-diet samples were significantly greater than 12 months. Surprisingly, however, at 18 months, the control diet samples showed significantly greater IL-6 secretion than the HF-diet-fed mice.
Pentraxin-3 is an adipocytokine secreted under inflammatory conditions and reported to promote metastasis [53,54]. In our study, Pentraxin-3 was observed to be significantly upregulated with aging, irrespective of diet (Figure 2 and Figure 4 and Table 4). Furthermore, there were no significant differences in Pentraxin-3 secretion between the diet groups at either time point.
Serpin E1 is a plasminogen activator inhibitor that functions to stabilize wound healing via fibrinogen clot formation [55]. As shown in Figure 2 and Figure 4 and Table 3, Serpin E1 secretions from ExV-WAT-CM increased significantly with aging for the control diet mice. However, secretion profiles for HF-diet-fed mice, while trending upwards with aging, were not significant. Like the Pentraxin-3 results, the Serpin E1 results were not significant between groups at either timepoint.
M-CSF is a growth factor cytokine, mediating local survival, proliferation, and differentiation signaling to mononuclear phagocytic cells at the site of inflammation [31]. We observed that there were no differences in the secretion of M-CSF across time or diet. There was a trend towards the increased expression of M-CSF when mice were fed a high-fat diet (Figure 2 and Figure 4 and Table 4).

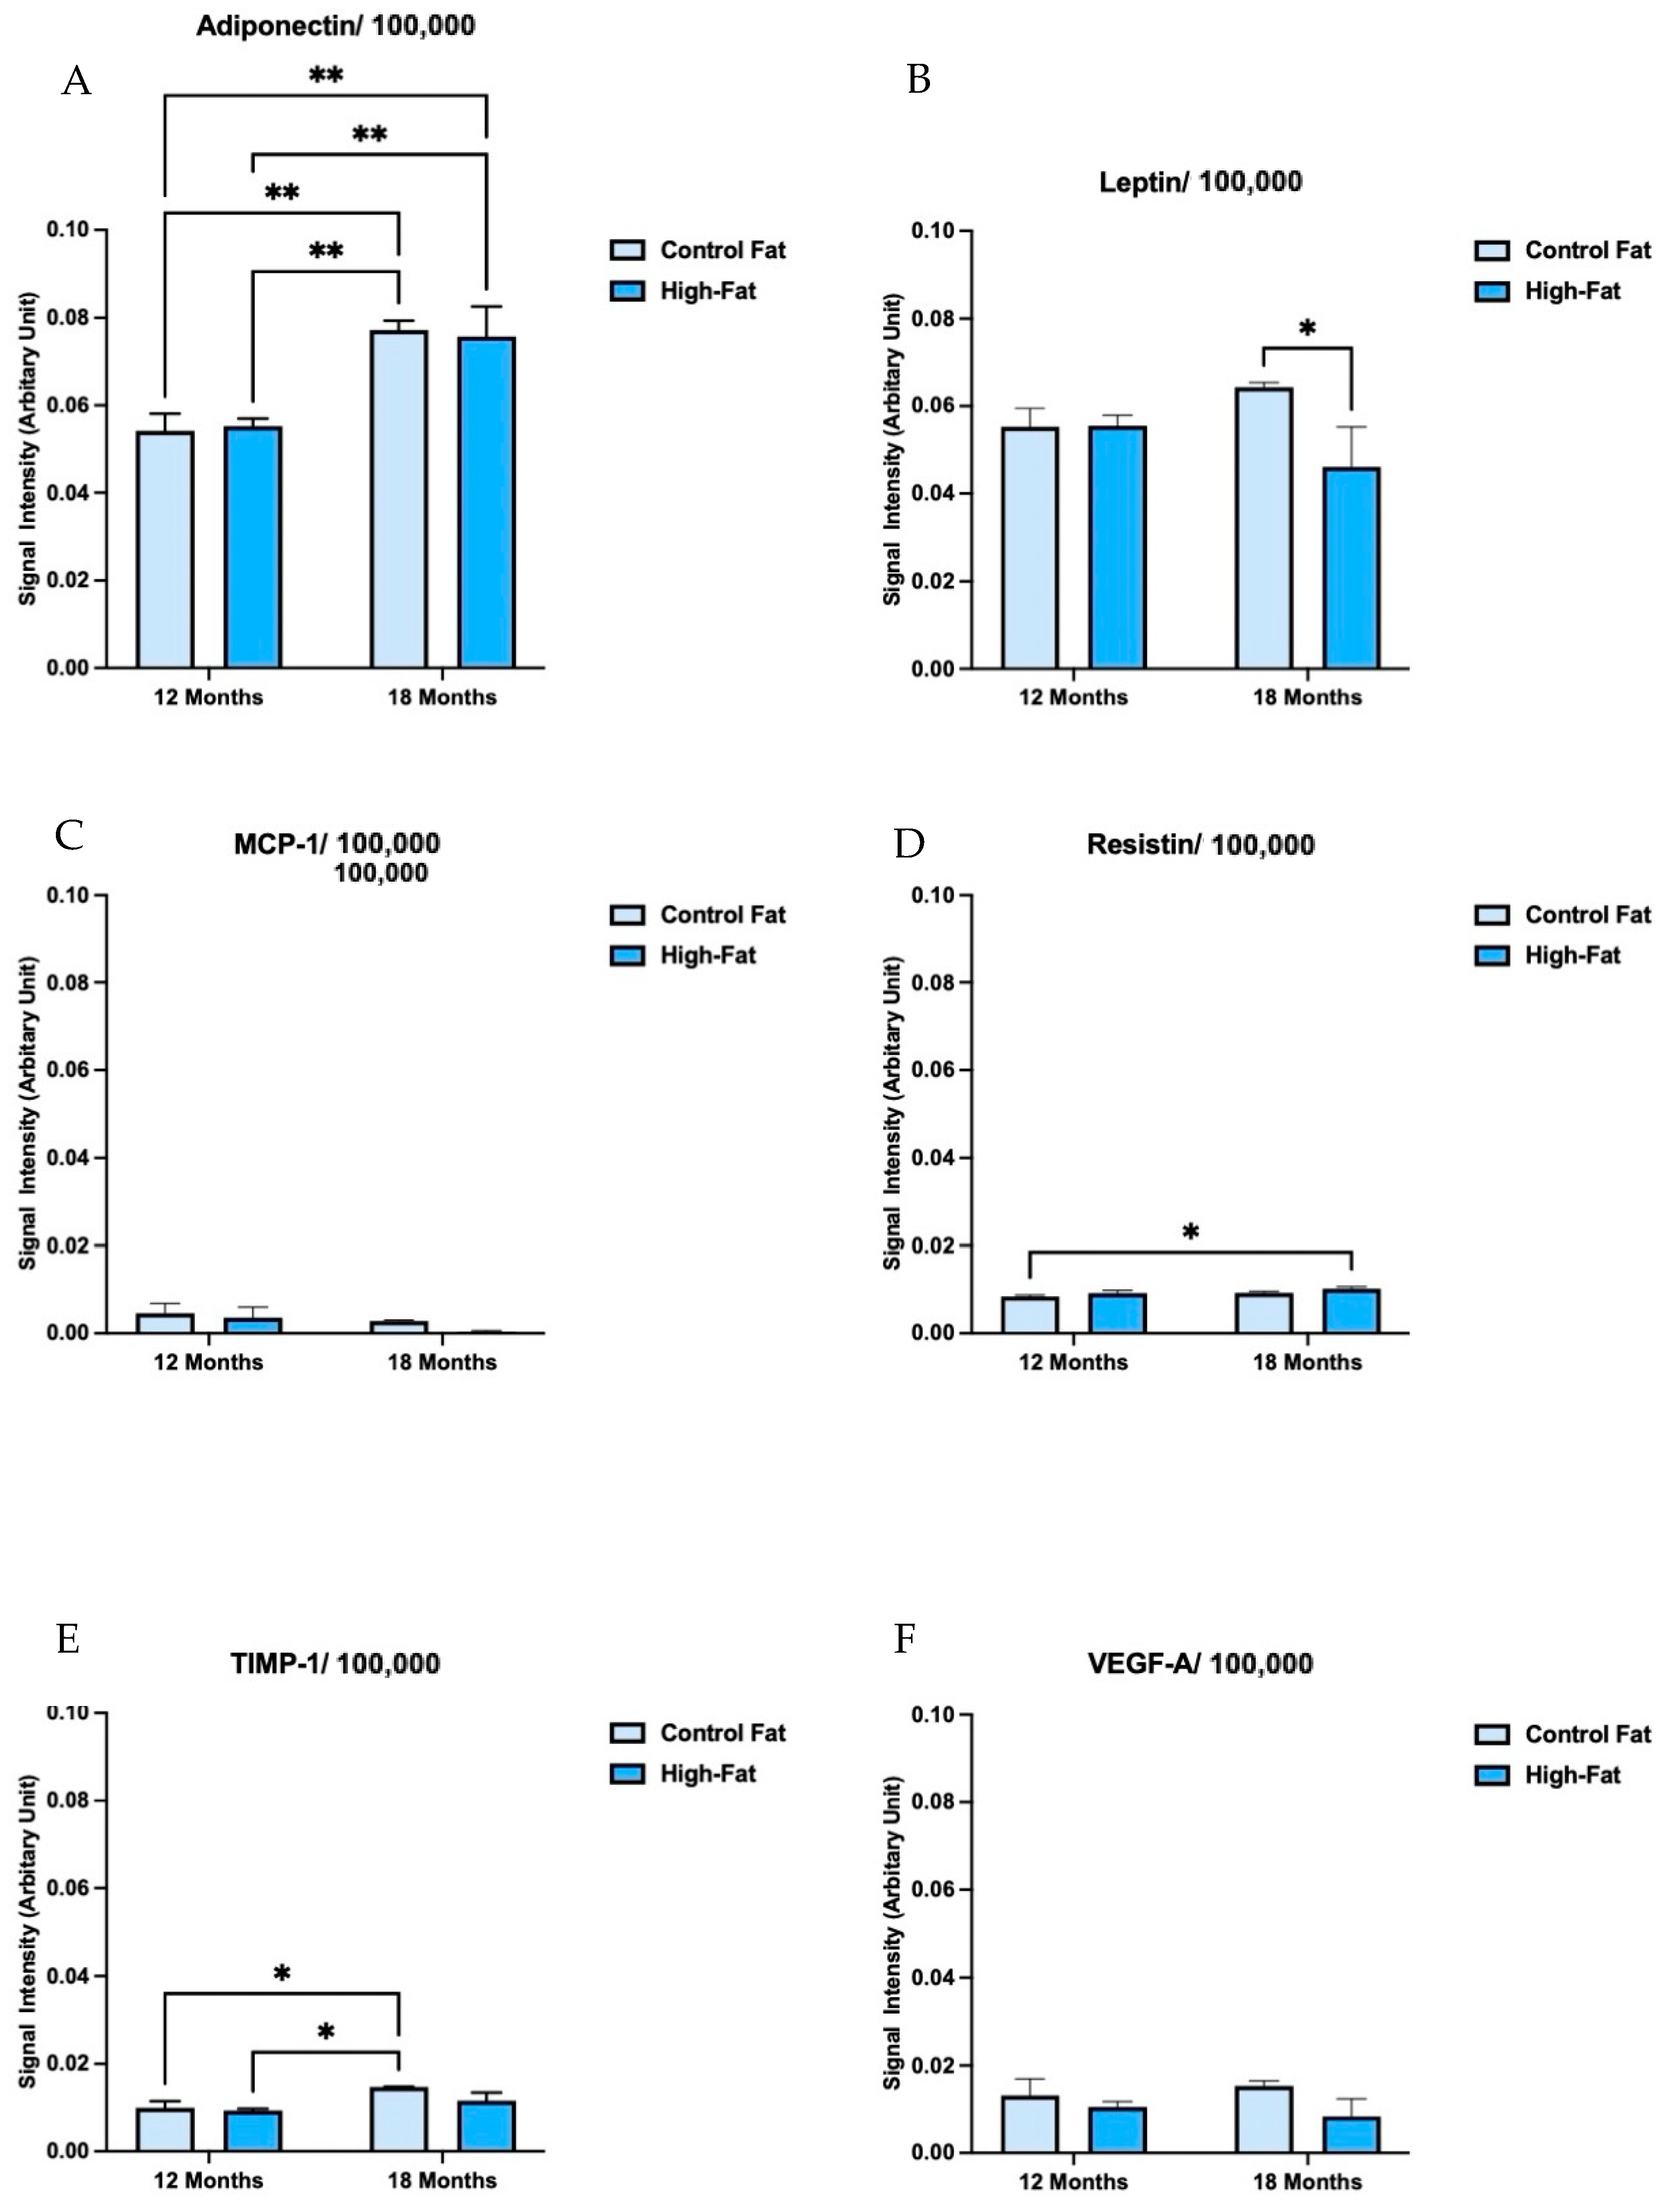
3.3. Adipocytokine Profiles of Flash-Frozen Visceral Fat Tissue Harvested from High-Fat and Control-Diet-Fed C3H/HeJ Mice Differ Significantly from Corresponding Organoid-Cultured Samples

One of the major goals of this study was to determine whether there is a difference between flash-frozen WAT (FF-WAT) sample secretions and fresh samples. This is important because it reveals whether frozen WAT tissue accurately represents changes in adipocytokine secretion compared to freshly harvested samples. Inconsistencies could have repercussions for data interpretation in in vitro studies. To distinguish between the results, and for ease of identification, the flash-frozen samples are heretofore represented as FF-WAT to be compared to the ex vivo samples represented as ExV-WAT-CM.
Figure 5 is a graphical representation of the results after being analyzed by ELISA to determine the levels of Adiponectin, Leptin, Resistin, MCP-1, TIMP-1, and VEGF in FF tissue samples. These were also the 6 secreted adipocytokines, which we analyzed from media obtained from cultured organoids, shown in Figure 3. It is important to note that the y-axis scale breaks when comparing these results.
Interestingly, the Adiponectin we analyzed from FF-WAT reflected similar increases in protein levels to ExV-WAT-CM (Figure 3) for both control and high-fat-diet-fed mice due to aging. However, the protein levels in the groups at each time point were very similar. Interestingly, the levels of Adiponectin were markedly higher in the FF-WAT samples. It is also important to note that, of the FF-WAT samples measured, Adiponectin exhibited the highest concentrations (Figure 5).
The results for Leptin showed that mice fed on a high-fat diet had significantly decreased Leptin expression with aging. Moreover, the WAT secretion levels of Leptin also trended upward in control-diet-fed mice (Figure 5). Also important to note was the substantial increase in Leptin concentrations in FF-WAT compared to ExV-WAT-CM. Although statistical comparisons were not performed, the amount of measurable Leptin was 5× greater than in the FF-WAT samples. These results are contrary to the adipokine secretion results from ExV-WAT-CM (Figure 3), in which an increase in Leptin in high-fat-diet-fed mice was observed. Even with an increase in the level of Leptin, mice on the high-fat diet were obese, failing to respond to reduced feeding signals from Leptin, which was most likely due to the development of Leptin resistance or insufficient Leptin sensitivity in the brain receptors [41].
Monocyte chemoattractant protein-1 (MCP-1) is a chemokine that attracts blood monocytes to the site of inflammation [42]. The elevation in the level of MCP-1 is thought to be correlated with the age-related induction of inflammation (inflammaging) [43,44]. Results for MCP-1 from FF-WAT showed that mice fed a high-fat diet had significantly decreased concentrations with aging. Moreover, the WAT secretion levels of MCP-1 in control-diet-fed mice were not significantly different (Figure 5). Although statistical comparisons were not performed, the amount of measurable MCP-1 was ~2–3× greater in the ExV-WAT-CM samples (note the scale break in Figure 2’s y-axis). These results are contrary to the secretion results from Figure 5, in which a decrease in MCP-1 in high-fat-diet-fed mice was observed.
The Resistin levels in the FF-WAT samples basically remained unchanged between diet and aging (Figure 5). Additionally, there were no significant changes in Resistin expression between diets for each time point. Furthermore, the FF-WAT samples of Resistin were ~5× lower than the levels observed in ExV-WAT-CM.
The analysis of TIMP-1 expression from FF-WAT (Figure 5) showed a significant increase in expression in control diets with aging, but no significant changes in the high-fat-diet-fed mice. Furthermore, there was no significant difference between diet groups when compared at each time point. This contrasted with the results for ExV-WAT-CM samples, where the control-diet-fed groups were observed to decrease in terms of expression significantly with aging. However, the expression level of TIMP-1 was comparable between ExV and FF samples in the high-fat-diet-fed mice, with no significant changes and approximately the same signal intensity when measured over time.
The vascular endothelial growth factor (VEGF) results for FF-WAT expression, established via ELISA, were not significant for either diet or aging at any level (Figure 5).

4. Discussion

C3H/HeJ is a generic strain of laboratory mouse without any documented susceptibility for obesity or type 2 diabetes. Thus, choosing this mouse model for evaluating the changes in adipocytokine expression in metabolically active visceral fat, based on the variability of dietary fat consumption for a long-term aging study, yielded important information about how a long-term high-fat diet impacts physiological homeostasis without any existing predisposition. In this study, the visceral fat was organ-cultured ex vivo (ExV-WAT), and the conditioned media were collected to determine the expression secretion of adipocytokines from visceral fat tissue into the media. Further, this study evaluated the changes in the expression of adipocytokines in the flash-frozen sample of the same visceral fat (FF-WAT) to compare the changes in expressed adipocytokines vs. secreted adipocytokines. This approach allowed to determine how diet impacted the physiological condition of visceral adipose tissue in vivo and how that impact resulted in significant changes in the expression and secretion of adipocytokines from differently processed visceral fat tissue. As expected, the data presented in this study demonstrated that excessive consumption of a high-fat diet contributed to weight gain in the mice. This was further supported by fat mass composition data, measured through Echo MRI. It showed that the 1000-fold increase in fat deposition in high-fat-diet-fed mice at 12 months. These data, in comparison to data from the control-diet-fed mice, provide further evidence that the increase in the weight and fat mass composition in the C3H/HeJ mouse model is solely due to the high-fat content included in the diet.
The data shown in Figure 2, Figure 3, Figure 4 and Figure 5 and Table 4 confirmed our hypothesis that significant changes exist in the expression and secretion of adipocytokines from visceral fat tissue, harvested from high-fat- and control fat-diet-fed female C3H/HeJ mice at Month 12 and Month 18. As there are very few studies reporting adipocytokine secretions from fat deposits in female mice or C3H/HeJ mice, most of the insights for the discussion of the current study are drawn from previously reported observations for the corresponding adipocytokines secreted from other mouse strains.
One of the critical adipocytokines secreted by WAT is Adiponectin. Not only is it the most abundant adipocytokine secreted from the adipose tissue [56], but it also plays a protective role in minimizing the effects of inflammation, maintaining whole-body energy homeostasis by expediting lipid and carbohydrate metabolism, increasing the insulin sensitivity of the glucose transport system and inhibiting hepatic gluconeogenesis and lipogenesis [57].
In Figure 2, the results suggest that the secretion of Adiponectin increased at the mid-to-advanced stage of life in female C3H/HeJ mice when they are on a high-fat diet. This result contradicts most of the epidemiological and experimental evidence in obesity studies, which report that decreased expression of Adiponectin is correlated with increases in fat mass [58,59,60,61,62]. One possible explanation for this discrepancy may be associated with the total intake of calories and not the changes in fat mass as a function of dietary fat or source of calorie intake [63,64,65]. Furthermore, the total caloric intake may play a critical role at the molecular level in controlling the expression of Adiponectin, as suggested by in vivo studies using C57BL/6 mice [66,67]. Qiao et al. reported that 2 groups of C57BL/6 mice, receiving the same number of calories through the high-fat- and low-fat-diet regimens, did not exhibit any changes in WAT-based Adiponectin gene expression or blood Adiponectin levels, even though high-fat-diet-fed mice showed increased adiposity [67]. Subsequently, different dietary feeding regimens and treatments (low-fat control diet, 30% calorie restriction regimen, a treadmill exercise regimen with a low-fat control diet, and a continuation of the high-fat diet) on the high-fat-diet-fed C57BL/6 mice showed that only calorie restriction in the high-fat-fed C57BL/6 mice increased the expression of Adiponectin [67]. According to the dietary formulations for the C3H/HeJ mice (Supplementary Table S1), both groups of mice (control and high-fat) were given diets containing similar calorie levels. Taken together, these reports coupled with our findings suggest that increases in fat mass, with high-fat dietary intake in C3H/HeJ mice, do not significantly contribute to the changes in Adiponectin expression. Rather, the intake of total calories when given diets containing similar amounts of high-fat and control fat content could be the reason for the observed changes in Adiponectin expression in this current study. Moreover, most of this study’s findings, discussed above, are based primarily on findings that are interpreted from male mice. Thus, when differences in physiology are considered, the sex of the mice could be a reason for the discrepancy in the Adiponectin secretion reported in this study from those of previous studies. However, as some clinical findings also reported, the serum Adiponectin level does not depend on the obese state of the individual. One study reported that 7 days of overfeeding of energy-dense diet induced significant increases in Adiponectin level in young men, irrespective of whether they were of normal weight, overweight, or obese [68]. Another study found no significant difference in the concentration of serum Adiponectin between obese and non-obese female subjects [69]. Further studies are needed to find the reasons behind such contradictory reports.
Leptin is another adipocytokine secreted profusely from WAT [70]. Under normal physiological conditions, as a hormone, it regulates appetite and energy expenditure and helps to maintain a normal weight [71]. However, the circulatory levels have been reported to increase in obese individuals with increased fat mass [41,68]. Even with increased plasma levels of Leptin, mice fed on high-fat diets keep progressing to obesity due to Leptin resistance [41]. Our results from the ExV-WAT-CM samples are in line with these findings. In our study, C3H/Hej female mice fed on a high-fat diet were observed to have significantly increased Leptin secretion on the control fat diet with aging. These results are in line with the studies demonstrating that the Leptin level increases with obesity [41,72,73,74,75,76].
The changes in Resistin secretion levels suggest that high-fat-diet consumption increases Resistin expression sooner in the mouse lifespan, as increased expression in the control-diet-fed C3H/HeJ mice was observed in Month 18. This suggests that the continuous consumption of high-fat diet promotes the occurrence of age-associated metabolic comorbidities earlier in life by increasing the secretion of Resistin from visceral fat.
TIMP-1, a member of the family of tissue inhibitors of metalloproteinases, physiologically plays a role in the inhibition of matrix metalloproteinase, which in turn causes the degradation of the extracellular matrix (ECM) and tissue remodeling [77]. A number of clinical and in vivo studies in male mice have found increased circulatory and fat tissue-based expression of TIMP-1 under conditions of obesity [78,79]. Studies have proposed the role of TIMP-1 in adipogenesis through TIMP1-mediated extracellular matrix remodeling and adipocyte expansion [79,80,81]. The reduced expression of TIMP-1 with aging implies that there is less space available for adipose tissue to expand, which can lead to the “mechanical stuffing” of expanded adipose tissue with continuous high-fat-diet consumption, followed by hypoxia and associated inflammatory condition. In contrast, an in vivo study in a TIMP-1-deficient female mice model reported a pronounced increase in body weight compared to wild-type mice, with increased weight and size of white adipose tissue attributed to hyperphagia [82]. Taking these results into consideration, it is possible that there is a link between decreased expression of TIMP-1 in ExV-WAT-CM samples of female mice fed on high-fat diet and hyperphagia, explaining their increased weight gain and adipose tissue mass. More study observations are needed to address this possibility.
Based on the observations for TIMP-1 and VEGF, the data suggest that the secretion of both adipocytokines decreased with aging with control-fat-diet consumption. However, with the consumption of the high-fat diet, their secretion remained stable with aging. The decreased expression of VEGF in aged control-diet-fed as well as young and aged high-fat-fed female C3H/HeJ mice in this current study suggests a possible impairment in angiogenic capacity in adipose tissue, progressing to hypoxia and dysfunction due to the limitation of the removal of fatty acids from the extracellular spaces. This was exhibited through enhanced fat mass as well as inflammatory events in adipose tissue (shown later) [76,83].
The Lipocalin results parallel reports from previous studies demonstrating a link between the elevated expression of Lipocalin 2 with obesity and glucose intolerance [84,85,86,87]. However, these findings are controversial as other studies have demonstrated the protective effect of Lipocalin-2 against metabolic deterioration with aging [88,89]. Clarifying these studies and elucidating the reason behind this outcome will need further research.
The observations for the adipocytokines Pentraxin-3 and Serpin-1 parallel those reported in previous studies correlating their increased expression with obesity and age-related disease [90,91,92,93]. Pentraxin-3, an inflammatory biomarker secreted under inflammatory conditions, was found to promote cell stemness [94] and metastasis [53,54]. Serpin E1, a plasminogen activator inhibitor encoded by the SERPIN E1 gene, primarily plays a role in the stabilization of fibrinogen clot formation and the maintenance of wound healing [55]. However, studies have also reported Serpin E1 signaling to have a role in malignant progression and resistance [88,89,90,91], hepatic steatosis [92], and aging [95]. The same results were observed for ICAM and IL-6. Considering the influence of the above-mentioned adipocytokines in pathogenic and metabolic disorder, it is possible that increased secretion of Pentraxin-3, Serpin E1 ICAM, and IL-6 from ExV-WAT-CM samples of female mice fed on high-fat diets were involved in age-associated disease pathogenesis in this female C3H/HeJ mice model. This study’s findings concur with the current paradigm where age-associated pathogenesis is the direct outcome of inflammatory changes during aging [33,34,35].
The differences in protein expression in flash-frozen portions of WAT (FF-WAT) and proteins secreted from organoid-cultured portions of WAT (ExV-WAT-CM) into the medium are important to consider. The data for ExV-WAT-secreted proteins compared to the FF-WAT samples show that there is a difference in the levels of adipocytokines from the same visceral fat sample when processed differently. FF-WAT is a sample of the whole, heterogeneous visceral fat tissue that has been flash-frozen before protein extraction. After protein extraction and quantification, the changes in the expression of embedded adipocytokines were evaluated. However, it is important to distinguish those from the secreted proteins analyzed by the array kit. Adipocytokines are secretory proteins that are released systematically in vivo. When the visceral fat was organ-cultured ex vivo, the conditioned media approach was used to evaluate the expression of those same adipocytokines. This approach facilitated the investigation of how the diet impacted the visceral adipose tissue in vivo and how that impact resulted in significant changes in the expression of adipocytokines, which was measured through this ex vivo process. Of the 3 signaling factors primarily secreted by WAT, a strong discrepancy was observed between Leptin and Resistin. The results for Adiponectin and Leptin were greatest in FF-WAT, unlike ExV-WAT, where Adiponectin and Resistin were highest. This difference in key adipocytokines between processing methods needs further study.
This is the first report of the secretion patterns of adipocytokines from visceral fat in C3H/HeJ mice after exposure to high-fat diets. The impact of high-fat diets and aging on the adipocytokine secretions from visceral fat is summarized in Table 5. Collectively, with the current study, it appears that inflammatory adipocytokine secretions from ExV-WAT-CM samples of visceral fat in female C3H/HeJ mice might promote age-associated pathogenesis.
One limitation of this study was the possibility for C3H/HeJ mice to develop a spontaneous mutation in the lipopolysaccharide response locus. This was later found to be detected as a toll-like receptor-4 gene (Tlr4-gene) [96,97,98], resulting in a defective TLR-4; this made those mice with the spontaneous mutation susceptible to endotoxins [94,95,96]. The relevance of TLR-4 in the current study may have implications for the obesity-induced inflammatory response [97,98,99,100,101]. Moreover, TLR4 is also involved in the crosstalk between adipocytes and immune cells, leading to the induction of pro-inflammatory environments in white adipose tissue [102,103]. However, the influence of TLR4 loss of function is controversial and other studies have shown that C3H/HeJ mice with this mutation are protected against the development of diet-induced obesity [104]. Future studies could address the frequency and status of this mutation to better understand the molecular signaling between adipocytes and immune cells in this model. While not considered a limitation, it should also be noted that, as this study was specific to female C3H/HeJ mice, the results in males may not be comparable.

5. Conclusions

Because mouse physiology can vary greatly from one strain to another, it is difficult to determine which factor has the stronger impact on the altered secretions of adipocytokines from visceral fat–high-fat diets, or aging. However, with the current study findings, it can be surmised that aging plays a major role in the altered secretion of adipocytokines from the visceral fat tissue of these female mice. This study’s findings, discussed above, successfully demonstrated that a high-fat-based diet alone changes the secretion pattern of adipocytokines from visceral fat adipose tissue and suggests that continuous long-term high-fat-diet consumption (in this case the lifespan of the mice) increases the likelihood of age-related disease and morbidities occurring earlier. More research focusing on obesity, aging, and women’s health is needed. The insights gained from the current study will be helpful in considering the C3H/HeJ mouse strain for the future in vivo obesity-mediated metabolic disorder studies. It is our hope that the findings from this study will add important information to the growing field of research into women’s health issues.

Supplementary Materials

The following supporting information can be downloaded at: https://www.mdpi.com/article/10.3390/dietetics3020016/s1, Table S1: Total dietary components and formulations.

Author Contributions

Conceptualization, N.M. and L.G.; methodology, N.M., C.B. and B.B.; formal analysis, N.M., C.B. and B.B.; investigation, N.M.; resources, L.G.; data curation, N.M. and L.G.; writing—original draft preparation, N.M.; writing—review and editing, N.M., B.B., C.B. and L.G.; supervision, L.G. All authors have read and agreed to the published version of the manuscript.

Funding

This research was funded by Texas Tech Association of Biologists Grants-in-Aid, Department of Biological Sciences at Texas Tech University and Empirical Foods Inc.

Institutional Review Board Statement

The animal study protocol was approved by the Institutional Review Board (or Ethics Committee) of Texas Tech University (Texas Tech University IACUC protocol 19021-02, Approved 2 December 2019) for studies involving animals.

Informed Consent Statement

Not applicable.

Data Availability Statement

Data are available from the corresponding author upon reasonable request.

Acknowledgments

We acknowledge the Texas Tech University Department of Biological Sciences, Texas Tech University Graduate School, Texas Tech University Association of Biologists for Grants-in-Aid, Cathy Wakeman and Naima Moustaid-Moussa for instrumentation access and advice.

Conflicts of Interest

The authors declare no conflicts of interest.

References

  1. Carswell, K.A.; Lee, M.J.; Fried, S.K. Culture of isolated human adipocytes and isolated adipose tissue. Methods Mol. Biol. 2012, 806, 203–214. [Google Scholar] [CrossRef] [PubMed]
  2. Poddar, M.; Chetty, Y.; Chetty, V.T. How does obesity affect the endocrine system? A narrative review. Clin. Obes. 2017, 7, 136–144. [Google Scholar] [CrossRef] [PubMed]
  3. Dufau, J.; Shen, J.X.; Couchet, M.; De Castro Barbosa, T.; Mejhert, N.; Massier, L.; Griseti, E.; Mouisel, E.; Amri, E.Z.; Lauschke, V.M.; et al. In vitro and ex vivo models of adipocytes. Am. J. Physiol. Cell Physiol. 2021, 320, C822–C841. [Google Scholar] [CrossRef] [PubMed]
  4. Redinger, R.N. The pathophysiology of obesity and its clinical manifestations. Gastroenterol. Hepatol. 2007, 3, 856–863. [Google Scholar]
  5. Blüher, M. Obesity: Global epidemiology and pathogenesis. Nat. Rev. Endocrinol. 2019, 15, 288–298. [Google Scholar] [CrossRef] [PubMed]
  6. Després, J.P.; Lemieux, I. Abdominal obesity and metabolic syndrome. Nature 2006, 444, 881–887. [Google Scholar] [CrossRef] [PubMed]
  7. Qatanani, M.; Lazar, M.A. Mechanisms of obesity-associated insulin resistance: Many choices on the menu. Genes Dev. 2007, 21, 1443–1455. [Google Scholar] [CrossRef] [PubMed]
  8. Mubtasim, N.; Moustaid-Moussa, N.; Gollahon, L. The Complex Biology of the Obesity-Induced, Metastasis-Promoting Tumor Microenvironment in Breast Cancer. Int. J. Mol. Sci. 2022, 23, 2480. [Google Scholar] [CrossRef]
  9. Wisse, B.E.; Kim, F.; Schwartz, M.W. Physiology. An integrative view of obesity. Science 2007, 318, 928–929. [Google Scholar] [CrossRef]
  10. Lissner, L.; Heitmann, B.L. Dietary fat and obesity: Evidence from epidemiology. Eur. J. Clin. Nutr. 1995, 49, 79–90. [Google Scholar]
  11. Golay, A.; Bobbioni, E. The role of dietary fat in obesity. Int. J. Obes. Relat. Metab. Disord. 1997, 21 (Suppl. S3), S2–S11. [Google Scholar]
  12. Mancuso, P.; Bouchard, B. The Impact of Aging on Adipose Function and Adipokine Synthesis. Front. Endocrinol. 2019, 10, 137. [Google Scholar] [CrossRef]
  13. Varghese, M.; Song, J.; Singer, K. Age and Sex: Impact on adipose tissue metabolism and inflammation. Mech. Ageing Dev. 2021, 199, 111563. [Google Scholar] [CrossRef]
  14. Ou, M.Y.; Zhang, H.; Tan, P.C.; Zhou, S.B.; Li, Q.F. Adipose tissue aging: Mechanisms and therapeutic implications. Cell Death Dis. 2022, 13, 300. [Google Scholar] [CrossRef]
  15. Peek, V.; Neumann, E.; Inoue, T.; Koenig, S.; Pflieger, F.J.; Gerstberger, R.; Roth, J.; Matsumura, K.; Rummel, C. Age-Dependent Changes of Adipokine and Cytokine Secretion From Rat Adipose Tissue by Endogenous and Exogenous Toll-Like Receptor Agonists. Front. Immunol. 2020, 11, 1800. [Google Scholar] [CrossRef]
  16. Fontana, L.; Eagon, J.C.; Trujillo, M.E.; Scherer, P.E.; Klein, S. Visceral fat adipokine secretion is associated with systemic inflammation in obese humans. Diabetes 2007, 56, 1010–1013. [Google Scholar] [CrossRef]
  17. Castro-Barquero, S.; Casas, R.; Rimm, E.B.; Tresserra-Rimbau, A.; Romaguera, D.; Martínez, J.A.; Salas-Salvadó, J.; Martínez-González, M.A.; Vidal, J.; Ruiz-Canela, M.; et al. Loss of Visceral Fat is Associated with a Reduction in Inflammatory Status in Patients with Metabolic Syndrome. Mol. Nutr. Food Res. 2023, 67, e2200264. [Google Scholar] [CrossRef]
  18. Cobos-Palacios, L.; Muñoz-Úbeda, M.; Gallardo-Escribano, C.; Ruiz-Moreno, M.I.; Vilches-Pérez, A.; Vargas-Candela, A.; Leiva-Gea, I.; Tinahones, F.J.; Gómez-Huelgas, R.; Bernal-López, M.R. Adipokines Profile and Inflammation Biomarkers in Prepubertal Population with Obesity and Healthy Metabolic State. Children 2022, 9, 42. [Google Scholar] [CrossRef]
  19. Cobos-Palacios, L.; Ruiz-Moreno, M.I.; Vilches-Perez, A.; Vargas-Candela, A.; Muñoz-Úbeda, M.; Benítez Porres, J.; Navarro-Sanz, A.; Lopez-Carmona, M.D.; Sanz-Canovas, J.; Perez-Belmonte, L.M.; et al. Metabolically healthy obesity: Inflammatory biomarkers and adipokines in elderly population. PLoS ONE 2022, 17, e0265362. [Google Scholar] [CrossRef]
  20. Senkus, K.E.; Crowe-White, K.M.; Bolland, A.C.; Locher, J.L.; Ard, J.D. Changes in adiponectin:leptin ratio among older adults with obesity following a 12-month exercise and diet intervention. Nutr. Diabetes 2022, 12, 30. [Google Scholar] [CrossRef]
  21. Oraha, J.; Enriquez, R.F.; Herzog, H.; Lee, N.J. Sex-specific changes in metabolism during the transition from chow to high-fat diet feeding are abolished in response to dieting in C57BL/6J mice. Int. J. Obes. 2022, 46, 1749–1758. [Google Scholar] [CrossRef]
  22. Shen, J.X.; Couchet, M.; Dufau, J.; de Castro Barbosa, T.; Ulbrich, M.H.; Helmstädter, M.; Kemas, A.M.; Zandi Shafagh, R.; Marques, M.A.; Hansen, J.B.; et al. 3D Adipose Tissue Culture Links the Organotypic Microenvironment to Improved Adipogenesis. Adv. Sci. 2021, 8, e2100106. [Google Scholar] [CrossRef]
  23. Hales, C.M.; Carroll, M.D.; Fryar, C.D.; Ogden, C.L. Prevalence of Obesity and Severe Obesity among Adults: United States, 2017–2018. NCHS Data Brief 2020, 288, 1–8. Available online: https://stacks.cdc.gov/view/cdc/49223/cdc_49223_DS1.pdf (accessed on 1 June 2024).
  24. Neuhouser, M.L.; Aragaki, A.K.; Prentice, R.L.; Manson, J.E.; Chlebowski, R.; Carty, C.L.; Ochs-Balcom, H.M.; Thomson, C.A.; Caan, B.J.; Tinker, L.F.; et al. Overweight, Obesity, and Postmenopausal Invasive Breast Cancer Risk: A Secondary Analysis of the Women’s Health Initiative Randomized Clinical Trials. JAMA Oncol. 2015, 1, 611–621. [Google Scholar] [CrossRef]
  25. Faulkner, J.L. Obesity-associated cardiovascular risk in women: Hypertension and heart failure. Clin. Sci. 2021, 135, 1523–1544. [Google Scholar] [CrossRef]
  26. Hruby, A.; Manson, J.E.; Qi, L.; Malik, V.S.; Rimm, E.B.; Sun, Q.; Willett, W.C.; Hu, F.B. Determinants and Consequences of Obesity. Am. J. Public Health 2016, 106, 1656–1662. [Google Scholar] [CrossRef]
  27. Sclafani, A. Animal models of obesity: Classification and characterization. Int. J. Obes. 1984, 8, 491–508. [Google Scholar]
  28. Hariri, N.; Thibault, L. High-fat diet-induced obesity in animal models. Nutr. Res. Rev. 2010, 23, 270–299. [Google Scholar] [CrossRef]
  29. Surwit, R.S.; Feinglos, M.N.; Rodin, J.; Sutherland, A.; Petro, A.E.; Opara, E.C.; Kuhn, C.M.; Rebuffé-Scrive, M. Differential effects of fat and sucrose on the development of obesity and diabetes in C57BL/6J and A/J mice. Metabolism 1995, 44, 645–651. [Google Scholar] [CrossRef]
  30. Siersbæk, M.S.; Ditzel, N.; Hejbøl, E.K.; Præstholm, S.M.; Markussen, L.K.; Avolio, F.; Li, L.; Lehtonen, L.; Hansen, A.K.; Schrøder, H.D.; et al. C57BL/6J substrain differences in response to high-fat diet intervention. Sci. Rep. 2020, 10, 14052. [Google Scholar] [CrossRef] [PubMed]
  31. Fixe, P.; Praloran, V. M-CSF: Haematopoietic growth factor or inflammatory cytokine? Cytokine 1998, 10, 32–37. [Google Scholar] [CrossRef]
  32. Bui, T.M.; Wiesolek, H.L.; Sumagin, R. ICAM-1: A master regulator of cellular responses in inflammation, injury resolution, and tumorigenesis. J. Leukoc. Biol. 2020, 108, 787–799. [Google Scholar] [CrossRef]
  33. Bruunsgaard, H.; Ladelund, S.; Pedersen, A.N.; Schroll, M.; Jørgensen, T.; Pedersen, B.K. Predicting death from tumour necrosis factor-alpha and interleukin-6 in 80-year-old people. Clin. Exp. Immunol. 2003, 132, 24–31. [Google Scholar] [CrossRef] [PubMed]
  34. Gordon, C.J.; Rowsey, P.J.; Bishop, B.L.; Ward, W.O.; Macphail, R.C. Serum biomarkers of aging in the Brown Norway rat. Exp. Gerontol. 2011, 46, 953–957. [Google Scholar] [CrossRef] [PubMed]
  35. Kwon, H.J.; Sung, B.K.; Kim, J.W.; Lee, J.H.; Kim, N.D.; Yoo, M.A.; Kang, H.S.; Baek, H.S.; Bae, S.J.; Choi, J.S.; et al. The effect of lipopolysaccharide on enhanced inflammatory process with age: Modulation of NF-κB. J. Am. Aging Assoc. 2001, 24, 163–171. [Google Scholar] [CrossRef] [PubMed]
  36. Kovner, I.; Taicher, G.Z.; Mitchell, A.D. Calibration and validation of EchoMRI™ whole body composition analysis based on chemical analysis of piglets, in comparison with the same for DXA. Int. J. Body Compos. Res. 2010, 8, 17–29. [Google Scholar] [PubMed]
  37. Jones, A.S.; Johnson, M.S.; Nagy, T.R. Validation of quantitative magnetic resonance for the determination of body composition of mice. Int. J. Body Compos. Res. 2009, 7, 67–72. [Google Scholar] [PubMed]
  38. Tinsley, F.C.; Taicher, G.Z.; Heiman, M.L. Evaluation of a quantitative magnetic resonance method for mouse whole body composition analysis. Obes. Res. 2004, 12, 150–160. [Google Scholar] [CrossRef] [PubMed]
  39. Mandarim-de-Lacerda, C.A.; Del Sol, M.; Vásquez, B.; Aguila, M.B. Mice as an animal model for the study of adipose tissue and obesity. Int. J. Morphol. 2021, 39, 1521–1528. [Google Scholar] [CrossRef]
  40. O’Rourke, R.W.; Metcalf, M.D.; White, A.E.; Madala, A.; Winters, B.R.; Maizlin, I.I.; Jobe, B.A.; Roberts, C.T., Jr.; Slifka, M.K.; Marks, D.L. Depot-specific differences in inflammatory mediators and a role for NK cells and IFN-gamma in inflammation in human adipose tissue. Int. J. Obes. 2009, 33, 978–990. [Google Scholar] [CrossRef]
  41. Amitani, M.; Asakawa, A.; Amitani, H.; Inui, A. The role of leptin in the control of insulin-glucose axis. Front. Neurosci. 2013, 7, 51. [Google Scholar] [CrossRef]
  42. Yoshimura, T. The chemokine MCP-1 (CCL2) in the host interaction with cancer: A foe or ally? Cell. Mol. Immunol. 2018, 15, 335–345. [Google Scholar] [CrossRef] [PubMed]
  43. Yousefzadeh, M.J.; Schafer, M.J.; Noren Hooten, N.; Atkinson, E.J.; Evans, M.K.; Baker, D.J.; Quarles, E.K.; Robbins, P.D.; Ladiges, W.C.; LeBrasseur, N.K.; et al. Circulating levels of monocyte chemoattractant protein-1 as a potential measure of biological age in mice and frailty in humans. Aging Cell 2018, 17, 12706. [Google Scholar] [CrossRef] [PubMed]
  44. Kim, S.-H. Age-Associated Increasing of MCP-1 in Adults. J. Exp. Biomed. Sci. 2007, 13, 183–187. [Google Scholar]
  45. Tripathi, D.; Kant, S.; Pandey, S.; Ehtesham, N.Z. Resistin in metabolism, inflammation, and disease. FEBS J. 2020, 287, 3141–3149. [Google Scholar] [CrossRef] [PubMed]
  46. Takahashi, Y.; Kitadai, Y.; Bucana, C.D.; Cleary, K.R.; Ellis, L.M. Expression of vascular endothelial growth factor and its receptor, KDR, correlates with vascularity, metastasis, and proliferation of human colon cancer. Cancer Res. 1995, 55, 3964–3968. [Google Scholar] [PubMed]
  47. Salven, P.; Ruotsalainen, T.; Mattson, K.; Joensuu, H. High pre-treatment serum level of vascular endothelial growth factor (VEGF) is associated with poor outcome in small-cell lung cancer. Int. J. Cancer 1998, 79, 144–146. [Google Scholar] [CrossRef]
  48. Niu, G.; Chen, X. Vascular endothelial growth factor as an anti-angiogenic target for cancer therapy. Curr. Drug Targets 2010, 11, 1000–1017. [Google Scholar] [CrossRef] [PubMed]
  49. Jaberi, S.A.; Cohen, A.; D’Souza, C.; Abdulrazzaq, Y.M.; Ojha, S.; Bastaki, S.; Adeghate, E.A. Lipocalin-2: Structure, function, distribution and role in metabolic disorders. Biomed. Pharmacother. 2021, 142, 112002. [Google Scholar] [CrossRef] [PubMed]
  50. Hirano, T. IL-6 in inflammation, autoimmunity and cancer. Int. Immunol. 2021, 33, 127–148. [Google Scholar] [CrossRef]
  51. Yao, X.; Huang, J.; Zhong, H.; Shen, N.; Faggioni, R.; Fung, M.; Yao, Y. Targeting interleukin-6 in inflammatory autoimmune diseases and cancers. Pharmacol. Ther. 2014, 141, 125–139. [Google Scholar] [CrossRef]
  52. Uciechowski, P.; Dempke, W.C.M. Interleukin-6: A Masterplayer in the Cytokine Network. Oncology 2020, 98, 131–137. [Google Scholar] [CrossRef] [PubMed]
  53. Ying, T.H.; Lee, C.H.; Chiou, H.L.; Yang, S.F.; Lin, C.L.; Hung, C.H.; Tsai, J.P.; Hsieh, Y.H. Knockdown of Pentraxin 3 suppresses tumorigenicity and metastasis of human cervical cancer cells. Sci. Rep. 2016, 6, 29385. [Google Scholar] [CrossRef]
  54. Song, T.; Wang, C.; Guo, C.; Liu, Q.; Zheng, X. Pentraxin 3 overexpression accelerated tumor metastasis and indicated poor prognosis in hepatocellular carcinoma via driving epithelial-mesenchymal transition. J. Cancer 2018, 9, 2650–2658. [Google Scholar] [CrossRef] [PubMed]
  55. Iwaki, T.; Urano, T.; Umemura, K. PAI-1, progress in understanding the clinical problem and its aetiology. Br. J. Haematol. 2012, 157, 291–298. [Google Scholar] [CrossRef]
  56. Lubbers, E.R.; List, E.O.; Jara, A.; Sackman-Sala, L.; Cordoba-Chacon, J.; Gahete, M.D.; Kineman, R.D.; Boparai, R.; Bartke, A.; Kopchick, J.J.; et al. Adiponectin in mice with altered GH action: Links to insulin sensitivity and longevity? J. Endocrinol. 2013, 216, 363–374. [Google Scholar] [CrossRef] [PubMed]
  57. Nguyen, T.M.D. Adiponectin: Role in Physiology and Pathophysiology. Int. J. Prev. Med. 2020, 11, 136. [Google Scholar] [CrossRef]
  58. Fruebis, J.; Tsao, T.S.; Javorschi, S.; Ebbets-Reed, D.; Erickson, M.R.; Yen, F.T.; Bihain, B.E.; Lodish, H.F. Proteolytic cleavage product of 30-kDa adipocyte complement-related protein increases fatty acid oxidation in muscle and causes weight loss in mice. Proc. Natl. Acad. Sci. USA 2001, 98, 2005–2010. [Google Scholar] [CrossRef]
  59. Yamauchi, T.; Kamon, J.; Waki, H.; Terauchi, Y.; Kubota, N.; Hara, K.; Mori, Y.; Ide, T.; Murakami, K.; Tsuboyama-Kasaoka, N.; et al. The fat-derived hormone adiponectin reverses insulin resistance associated with both lipoatrophy and obesity. Nat. Med. 2001, 7, 941–946. [Google Scholar] [CrossRef]
  60. Berg, A.H.; Combs, T.P.; Du, X.; Brownlee, M.; Scherer, P.E. The adipocyte-secreted protein Acrp30 enhances hepatic insulin action. Nat. Med. 2001, 7, 947–953. [Google Scholar] [CrossRef]
  61. Combs, T.P.; Berg, A.H.; Obici, S.; Scherer, P.E.; Rossetti, L. Endogenous glucose production is inhibited by the adipose-derived protein Acrp30. J. Clin. Investig. 2001, 108, 1875–1881. [Google Scholar] [CrossRef]
  62. Arita, Y.; Kihara, S.; Ouchi, N.; Takahashi, M.; Maeda, K.; Miyagawa, J.; Hotta, K.; Shimomura, I.; Nakamura, T.; Miyaoka, K.; et al. Paradoxical decrease of an adipose-specific protein, adiponectin, in obesity. Biochem. Biophys. Res. Commun. 1999, 257, 79–83. [Google Scholar] [CrossRef]
  63. Kern, P.A.; Di Gregorio, G.B.; Lu, T.; Rassouli, N.; Ranganathan, G. Adiponectin expression from human adipose tissue: Relation to obesity, insulin resistance, and tumor necrosis factor-alpha expression. Diabetes 2003, 52, 1779–1785. [Google Scholar] [CrossRef]
  64. Barnea, M.; Shamay, A.; Stark, A.H.; Madar, Z. A high-fat diet has a tissue-specific effect on adiponectin and related enzyme expression. Obesity 2006, 14, 2145–2153. [Google Scholar] [CrossRef]
  65. Bullen, J.W., Jr.; Bluher, S.; Kelesidis, T.; Mantzoros, C.S. Regulation of adiponectin and its receptors in response to development of diet-induced obesity in mice. Am. J. Physiol. Endocrinol. Metab. 2007, 292, E1079–E1086. [Google Scholar] [CrossRef]
  66. Lee, B.; Shao, J. Adiponectin and energy homeostasis. Rev. Endocr. Metab. Disord. 2014, 15, 149–156. [Google Scholar] [CrossRef]
  67. Qiao, L.; Lee, B.; Kinney, B.; Yoo, H.S.; Shao, J. Energy intake and adiponectin gene expression. Am. J. Physiol. Endocrinol. Metab. 2011, 300, E809–E816. [Google Scholar] [CrossRef]
  68. Cahill, F.; Amini, P.; Wadden, D.; Khalili, S.; Randell, E.; Vasdev, S.; Gulliver, W.; Sun, G. Short-term overfeeding increases circulating adiponectin independent of obesity status. PLoS ONE 2013, 8, e74215. [Google Scholar] [CrossRef]
  69. Owecki, M.; Miczke, A.; Pupek-Musialik, D.; Bryl, W.; Cymerys, M.; Nikisch, E.; Sowiński, J. Circulating serum adiponectin concentrations do not differ between obese and non-obese caucasians and are unrelated to insulin sensitivity. Horm. Metab. Res. 2007, 39, 25–30. [Google Scholar] [CrossRef]
  70. Coelho, M.; Oliveira, T.; Fernandes, R. Biochemistry of adipose tissue: An endocrine organ. Arch. Med. Sci. 2013, 9, 191–200. [Google Scholar] [CrossRef] [PubMed]
  71. Morton, G.J.; Schwartz, M.W. Leptin and the central nervous system control of glucose metabolism. Physiol. Rev. 2011, 91, 389–411. [Google Scholar] [CrossRef] [PubMed]
  72. Frederich, R.C.; Hamann, A.; Anderson, S.; Löllmann, B.; Lowell, B.B.; Flier, J.S. Leptin levels reflect body lipid content in mice: Evidence for diet-induced resistance to leptin action. Nat. Med. 1995, 1, 1311–1314. [Google Scholar] [CrossRef]
  73. Al Maskari, M.Y.; Alnaqdy, A.A. Correlation between Serum Leptin Levels, Body Mass Index and Obesity in Omanis. Sultan Qaboos Univ. Med. J. 2006, 6, 27–31. [Google Scholar]
  74. Liu, W.; Zhou, X.; Li, Y.; Zhang, S.; Cai, X.; Zhang, R.; Gong, S.; Han, X.; Ji, L. Serum leptin, resistin, and adiponectin levels in obese and non-obese patients with newly diagnosed type 2 diabetes mellitus: A population-based study. Medicine 2020, 99, e19052. [Google Scholar] [CrossRef]
  75. Gómez-Crisóstomo, N.P.; De la Cruz-Hernández, E.N.; Méndez Méndez, E.R.; Hernández-Landero, M.F.; Camacho Liévano, J.U.; Martínez-Abundis, E. Differential effect of high-fat, high-sucrose and combined high-fat/high-sucrose diets consumption on fat accumulation, serum leptin and cardiac hypertrophy in rats. Arch. Physiol. Biochem. 2020, 126, 258–263. [Google Scholar] [CrossRef] [PubMed]
  76. Khodamoradi, K.; Khosravizadeh, Z.; Seetharam, D.; Mallepalli, S.; Farber, N.; Arora, H. The role of leptin and low testosterone in obesity. Int. J. Impot. Res. 2022, 34, 704–713. [Google Scholar] [CrossRef] [PubMed]
  77. Brew, K.; Nagase, H. The tissue inhibitors of metalloproteinases (TIMPs): An ancient family with structural and functional diversity. Biochim. Biophys. Acta 2010, 1803, 55–71. [Google Scholar] [CrossRef]
  78. Kralisch, S.; Bluher, M.; Tonjes, A.; Lossner, U.; Paschke, R.; Stumvoll, M.; Fasshauer, M. Tissue inhibitor of metalloproteinase-1 predicts adiposity in humans. Eur. J. Endocrinol. 2007, 156, 257–261. [Google Scholar] [CrossRef] [PubMed]
  79. Chavey, C.; Mari, B.; Monthouel, M.N.; Bonnafous, S.; Anglard, P.; Van Obberghen, E.; Tartare-Deckert, S. Matrix metalloproteinases are differentially expressed in adipose tissue during obesity and modulate adipocyte differentiation. J. Biol. Chem. 2003, 278, 11888–11896. [Google Scholar] [CrossRef]
  80. Sharma, A.M.; Staels, B. Review: Peroxisome proliferator-activated receptor gamma and adipose tissue--understanding obesity-related changes in regulation of lipid and glucose metabolism. J. Clin. Endocrinol. Metab. 2007, 92, 386–395. [Google Scholar] [CrossRef]
  81. Meissburger, B.; Stachorski, L.; Röder, E.; Rudofsky, G.; Wolfrum, C. Tissue inhibitor of matrix metalloproteinase 1 (TIMP1) controls adipogenesis in obesity in mice and in humans. Diabetologia 2011, 54, 1468–1479. [Google Scholar] [CrossRef]
  82. Gerin, I.; Louis, G.W.; Zhang, X.; Prestwich, T.C.; Kumar, T.R.; Myers, M.G., Jr.; Macdougald, O.A.; Nothnick, W.B. Hyperphagia and obesity in female mice lacking tissue inhibitor of metalloproteinase-1. Endocrinology 2009, 150, 1697–1704. [Google Scholar] [CrossRef] [PubMed]
  83. Corvera, S.; Solivan-Rivera, J.; Yang Loureiro, Z. Angiogenesis in adipose tissue and obesity. Angiogenesis 2022, 25, 439–453. [Google Scholar] [CrossRef] [PubMed]
  84. Wang, Y.; Lam, K.S.; Kraegen, E.W.; Sweeney, G.; Zhang, J.; Tso, A.W.; Chow, W.S.; Wat, N.M.; Xu, J.Y.; Hoo, R.L.; et al. Lipocalin-2 is an inflammatory marker closely associated with obesity, insulin resistance, and hyperglycemia in humans. Clin. Chem. 2007, 53, 34–41. [Google Scholar] [CrossRef] [PubMed]
  85. Yan, Q.W.; Yang, Q.; Mody, N.; Graham, T.E.; Hsu, C.H.; Xu, Z.; Houstis, N.E.; Kahn, B.B.; Rosen, E.D. The adipokine lipocalin 2 is regulated by obesity and promotes insulin resistance. Diabetes 2007, 56, 2533–2540. [Google Scholar] [CrossRef] [PubMed]
  86. Zhang, Y.; Foncea, R.; Deis, J.A.; Guo, H.; Bernlohr, D.A.; Chen, X. Lipocalin 2 expression and secretion is highly regulated by metabolic stress, cytokines, and nutrients in adipocytes. PLoS ONE 2014, 9, e96997. [Google Scholar] [CrossRef] [PubMed]
  87. Guo, H.; Jin, D.; Zhang, Y.; Wright, W.; Bazuine, M.; Brockman, D.A.; Bernlohr, D.A.; Chen, X. Lipocalin-2 deficiency impairs thermogenesis and potentiates diet-induced insulin resistance in mice. Diabetes 2010, 59, 1376–1385. [Google Scholar] [CrossRef] [PubMed]
  88. Deis, J.A.; Guo, H.; Wu, Y.; Liu, C.; Bernlohr, D.A.; Chen, X. Adipose Lipocalin 2 overexpression protects against age-related decline in thermogenic function of adipose tissue and metabolic deterioration. Mol. Metab. 2019, 24, 18–29. [Google Scholar] [CrossRef] [PubMed]
  89. Law, I.K.; Xu, A.; Lam, K.S.; Berger, T.; Mak, T.W.; Vanhoutte, P.M.; Liu, J.T.; Sweeney, G.; Zhou, M.; Yang, B.; et al. Lipocalin-2 deficiency attenuates insulin resistance associated with aging and obesity. Diabetes 2010, 59, 872–882. [Google Scholar] [CrossRef] [PubMed]
  90. Alessi, M.C.; Juhan-Vague, I. PAI-1 and the metabolic syndrome: Links, causes, and consequences. Arterioscler. Thromb. Vasc. Biol. 2006, 26, 2200–2207. [Google Scholar] [CrossRef]
  91. Samad, F.; Loskutoff, D.J. Tissue distribution and regulation of plasminogen activator inhibitor-1 in obese mice. Mol. Med. 1996, 2, 568–582. [Google Scholar] [CrossRef]
  92. Landin, K.; Stigendal, L.; Eriksson, E.; Krotkiewski, M.; Risberg, B.; Tengborn, L.; Smith, U. Abdominal obesity is associated with an impaired fibrinolytic activity and elevated plasminogen activator inhibitor-1. Metabolism 1990, 39, 1044–1048. [Google Scholar] [CrossRef] [PubMed]
  93. Guo, H.; Qiu, X.; Deis, J.; Lin, T.Y.; Chen, X. Pentraxin 3 deficiency exacerbates lipopolysaccharide-induced inflammation in adipose tissue. Int. J. Obes. 2020, 44, 525–538. [Google Scholar] [CrossRef] [PubMed]
  94. Thomas, C.; Henry, W.; Cuiffo, B.G.; Collmann, A.Y.; Marangoni, E.; Benhamo, V.; Bhasin, M.K.; Fan, C.; Fuhrmann, L.; Baldwin, A.S.; et al. Pentraxin-3 is a PI3K signaling target that promotes stem cell-like traits in basal-like breast cancers. Sci. Signal. 2017, 10, aah4674. [Google Scholar] [CrossRef] [PubMed]
  95. Khan, S.S.; Shah, S.J.; Klyachko, E.; Baldridge, A.S.; Eren, M.; Place, A.T.; Aviv, A.; Puterman, E.; Lloyd-Jones, D.M.; Heiman, M.; et al. A null mutation in SERPINE1 protects against biological aging in humans. Sci. Adv. 2017, 3, eaao1617. [Google Scholar] [CrossRef] [PubMed]
  96. Sultzer, B.M. Endotoxin-induced resistance to a staphylococcal infection: Cellular and humoral responses compared in two mouse strains. J. Infect. Dis. 1968, 118, 340–348. [Google Scholar] [CrossRef] [PubMed]
  97. Hoshino, K.; Takeuchi, O.; Kawai, T.; Sanjo, H.; Ogawa, T.; Takeda, Y.; Takeda, K.; Akira, S. Cutting edge: Toll-like receptor 4 (TLR4)-deficient mice are hyporesponsive to lipopolysaccharide: Evidence for TLR4 as the Lps gene product. J. Immunol. 1999, 162, 3749–3752. [Google Scholar] [CrossRef] [PubMed]
  98. Poltorak, A.; He, X.; Smirnova, I.; Liu, M.Y.; Van Huffel, C.; Du, X.; Birdwell, D.; Alejos, E.; Silva, M.; Galanos, C.; et al. Defective LPS signaling in C3H/HeJ and C57BL/10ScCr mice: Mutations in Tlr4 gene. Science 1998, 282, 2085–2088. [Google Scholar] [CrossRef] [PubMed]
  99. Benomar, Y.; Taouis, M. Molecular Mechanisms Underlying Obesity-Induced Hypothalamic Inflammation and Insulin Resistance: Pivotal Role of Resistin/TLR4 Pathways. Front. Endocrinol. 2019, 10, 140. [Google Scholar] [CrossRef] [PubMed]
  100. Jin, C.; Flavell, R.A. Innate sensors of pathogen and stress: Linking inflammation to obesity. J. Allergy Clin. Immunol. 2013, 132, 287–294. [Google Scholar] [CrossRef]
  101. Kuzmich, N.N.; Sivak, K.V.; Chubarev, V.N.; Porozov, Y.B.; Savateeva-Lyubimova, T.N.; Peri, F. TLR4 Signaling Pathway Modulators as Potential Therapeutics in Inflammation and Sepsis. Vaccines 2017, 5, 34. [Google Scholar] [CrossRef]
  102. Engin, A.B. Adipocyte-Macrophage Cross-Talk in Obesity. Adv. Exp. Med. Biol. 2017, 960, 327–343. [Google Scholar] [CrossRef] [PubMed]
  103. McKernan, K.; Varghese, M.; Patel, R.; Singer, K. Role of TLR4 in the induction of inflammatory changes in adipocytes and macrophages. Adipocyte 2020, 9, 212–222. [Google Scholar] [CrossRef] [PubMed]
  104. Suganami, T.; Mieda, T.; Itoh, M.; Shimoda, Y.; Kamei, Y.; Ogawa, Y. Attenuation of obesity-induced adipose tissue inflammation in C3H/HeJ mice carrying a Toll-like receptor 4 mutation. Biochem. Biophys. Res. Commun. 2007, 354, 45–49. [Google Scholar] [CrossRef] [PubMed]
Figure 1. Schematic representation of mouse adipokine array and coordinates for antibodies against 38 commonly occurring adipocytokines.
Dietetics 03 00016 g001
Figure 2. Adipokine array showing dot blot results of different adipocytokines on nitrocellulose membrane. Dots are adipocytokine signals detected after treatment with a visceral, fat-derived, conditioned medium harvested from C3H/HeJ female mice fed on control or high-fat diets, both for Month 12 and Month 18. (A) The negative control is M199 media without FBS, used for conditioning cells. (B) Organ-cultured visceral fat harvested from control-diet-fed mice at Month 12. (C) Organ-cultured visceral fat harvested from high-fat-diet-fed mice at Month 12. (D) Organ-cultured visceral fat harvested from control fat-diet-fed mice at Month 18. (E) Organ-cultured visceral fat harvested from high-fat-diet-fed mice at Month 18.
Dietetics 03 00016 g002
Figure 3. Changes in adipocytokine secretions, (A) Adiponectin, (B) Leptin, (C) MCP-1, (D) Resistin, (E) TIMP-1, and (F) VEGF in the Ex-WAT-CM harvested from control and high-fat-diet-fed female C3H/HeJ mice at Month 12 and Month 18. Each data point represents the mean value of the secretome from 2 technical replicates for 3 independent experiments. Adipocytokine secretion changes over time between the control and high-fat diet; this was determined using two-way ANOVA, followed by Tukey’s post hoc test for multiple comparisons. A p value ≤ 0.05 was considered statistically significant and identified by one asterisk (*); two asterisks (**) indicate p ≤ 0.01; three asterisks (***) indicate p ≤ 0.001; and four asterisks (****) indicate p ≤ 0.0001. p-value > 0.05 was considered statistically nonsignificant and not marked on the graphs. Note: As ExV-WAT-CM samples are conditioned media collected from ex vivo visceral adipose tissue, the changes in adipocytokine secretions between the conditioned medium are designated as arbitrary units for the y-axis, following the manufacturer’s kit instructions.
Dietetics 03 00016 g003
Figure 4. Changes in adipocytokine secretions, (A) IL-6, (B) ICAM-1, (C) Lipocalin-2, (D) Serpin E1, (E) Pentraxin-3, and (F) M-CSF in the ExV-WAT-CM harvested from control and high-fat-diet-fed mice female C3H/HeJ mice at Month 12 and Month 18. Each data point represents the mean value of the secretome from 2 technical replicates for 3 independent experiments. Adipocytokine secretion changes over time, between control and high-fat diets, were measured using two-way ANOVA followed by Tukey’s post hoc test for multiple comparisons. A p value p ≤ 0.05 was considered statistically significant and identified by one asterisk (*), two asterisks (**) indicate p ≤ 0.01, and three asterisks (***) indicate p ≤ 0.001. Note: As ExV-WAT-CM samples are conditioned media collected from ex vivo visceral adipose tissue, the changes in adipocytokine secretions between the conditioned medium as designated as arbitrary units for the y-axis, following the manufacturer’s kit instruction.
Dietetics 03 00016 g004
Figure 5. Graphical representation of observable changes in the expression of adipocytokine proteins extracted from visceral fat flash-frozen tissue (FF-WAT) and harvested from control and high-fat-diet-fed mice at Month 12 and Month 18. (A) Adiponectin, (B) Leptin, (C) MCP-1, (D) Resistin, (E) TIMP-1, and (F) VEGF in the FF-WAT tissue harvested from control and high-fat-diet-fed female C3H/HeJ mice at Month 12 and Month 18. Each data point represents the mean value of the protein analyzed from 3 technical replicates for 3 independent experiments. Adipocytokine protein changes over time between control and high-fat diets were determined using two-way ANOVA followed by Tukey’s post hoc test for multiple comparisons. A p value ≤ 0.05 was considered statistically significant and identified by one asterisk (*), and two asterisks (**) indicate p ≤ 0.01. The changes in adipocytokine protein levels have been designated as arbitrary units for the y-axis following the manufacturer’s kit instruction. Note that the scale breaks in the y-axis units based on protein expression levels.
Dietetics 03 00016 g005
Table 1. Media and Ingredients used for Organoid Culture.
IngredientsAmountFunction/Role
M199 media500 mLSource of glucose, amino acid, vitamins, and inorganic salts
Gentamycin50 μg/mLAntibiotic
Penicillin–streptomycin1% or 5 mLAntibiotics
Insulin0.7 nMAids in lipogenesis and fat accumulation
Dexamethasone250 nMHelps in adipogenic gene expression
Amphotericin B0.5 μg/mLAntifungal agent
HEPES25 nMBuffering agent
Table 2. List of adipocytokine duplicates printed onto the nitrocellulose membranes.
CoordinateAdipokineCoordinateAdipokine
A1, A2Reference spotsC15, C16IL-10
A23, A24Reference spotsC17, C18IL-11
B1, B2AdiponectinC19, C20Leptin
B3, B4AgRPC21, C22LIF
B5, B6ANGPT-L1C23, C24Lipocalin-2
B7, B8C-reactive proteinD1, D2MCP-1
B9, B10DPPIVD3, D4M-CSF
B11, B12EndocanD5, D6Oncostatin M
B13, B14Fetuin AD7, D8Pentraxin 2
B15, B16FGF acidicD9, D10Pentraxin-3
B17, B18FGF-21D11, D12Pref-1
B19, B20HGFD13, D14RAGE
B21, B22ICAM-1D15, D16RANTES
B23, B24IGF-ID17, D18RBP4
C1, C2IGF-IID19, D20Resistin
C3, C4IGFBP-1D21, D22Serpin E1
C5, C6IGFBP-2D23, D24TIMP-1
C7, C8IGFBP-3E1, E2TNF-α
C9, C10IGFBP-5E3, E4VEGF-A
C11, C12IGFBP-6F1, F2Reference spots
C13, C14IL-6F23, F24PBS (negative control)
Table 3. Weight gain and body composition details of control and high-fat-diet-fed female C3H/HeJ mice over time.
Mice Groups Based
on Date and Time Sample
of Euthanasia Size (n)
Mass
(g)
(ave)
Total %
∆ from Control
Mice
Fat
Mass
(g)
Total
% Fat
Mass
Fat %
∆ from
Control
Mice
Lean
Mass
(g)
Total
%
Lean
Mass
Lean %
∆ from
Control
Mice
Time 0
Control Mice
817.2
± 0.59
1.19
± 0.24
6.92 15.31
± 0.68
88.97
Control
Diet-Fed
Mice
Month
12
Prog *
625.33
± 1.54
47.292.76
± 1.22
10.74132.721.04
± 1.85
83.437.48
Month
12
Exper
624.23
± 2.7
40.893.1
± 1.63
12.38160.7719.59
± 0.88
81.827.99
Month
18
Exper
723.13
± 1.55
34.471.45
± 0.28
6.2322.1116.73
± 2.61
729.27
High-Fat Diet-Fed
Mice
Month
12
Prog *
637.5
± 8.07
118.0213.55
± 6.95
34.231040.6323.13
± 1.48
63.451.13
Month
12
Exper
837.81
± 8.48
119.8413.76 ± 6.89 34.111058.9523.43
± 2.01
64.153.04
Month
18
Exper
832.05
± 7.83
86.347.83
± 6.31
21.81559.4722.09
± 1.93
71.3544.34
Note: * Prog = progressive (mice carried from Month 12 to Month 18). Exper = experimental (euthanized on the given month).
Table 4. Adipocytokine secretions from visceral fat harvested from control and high-fat-diet-fed female C3H/HeJ mice at Month 12 and Month 18.
AdipocytokinesControl Fat
(Month 12)
(Mean ± SEM)
High-Fat
(Month 12)
(Mean ± SEM)
Control Fat
(Month 18)
(Mean ± SEM)
High-Fat
(Month 18)
(Mean ± SEM)
Ref Spot 10.039 ± 0.00230.043 ± 0.00210.056 ± 0.00040.050 ± 0.0020
Ref Spot 20.043 ± 0.00230.042 ± 0.00160.049 ± 0.00040.047 ± 0.0019
Adiponectin0.033 ± 0.00200.046 ± 0.00100.060 ± 0.00030.057 ± 0.0023
ICAM-10.004 ± 0.00020.003 ± 0.00020.009 ± 0.00010.011 ± 0.0008
IL-6000.003 ± 6.36 × 10−50.002 ± 0.0002
Leptin0.005 ± 0.00020.003 ± 0.00020.002 ± 7.10 × 10−50.008 ± 0.0004
Lipocalin-20.018 ± 0.00080.015 ± 0.00040.020 ± 0.00030.025 ± 0.0013
MCP-10.009 ± 0.00080.011 ± 0.00080.019 ± 0.00010.028 ± 0.0026
MCS-F0.002 ± 0.00020.000 ± 9.95 × 10−50.001 ± 4.11 × 10−50.002 ± 0.0003
Pentraxin-30.005 ± 0.00020.006 ± 0.00050.014 ± 0.00020.020 ± 0.0015
RBP40.003 ± 0.00020.003 ± 0.00010.004 ± 0.00020.005 ± 0.0003
Resistin0.032 ± 0.00150.050 ± 0.00150.051 ± 0.00050.048 ± 0.0025
Serpin E10.015 ± 0.00070.018 ± 0.00040.024 ± 0.00030.023 ± 0.0011
TIMP-10.017 ± 0.00080.009 ± 0.00080.003 ± 0.00030.009 ± 0.0014
VEGF0.011 ± 0.00080.005 ± 0.00040.002 ± 3.86 × 10−50.006 ± 0.0004
Ref Spot 30.040 ± 0.00230.044 ± 0.00100.050 ± 0.00030.045 ± 0.0021
Table 5. Summary of the impact of aging and high-fat diet on the selected adipocytokine secretions.
AgingAdiponectin, Leptin, MCP-1, TIMP-1, VEGF, IL-6,
ICAM-1, Lipocalin-2, Serpin E1, M-CSF
High-Fat DietAdiponectin, Leptin, Resistin, TIMP-1, VEGF
Disclaimer/Publisher’s Note: The statements, opinions and data contained in all publications are solely those of the individual author(s) and contributor(s) and not of MDPI and/or the editor(s). MDPI and/or the editor(s) disclaim responsibility for any injury to people or property resulting from any ideas, methods, instructions or products referred to in the content.

