
Influence of the Blunt Trailing-Edge Thickness on the Aerodynamic Characteristics of the Very Thick Airfoil

National Key Laboratory of Science and Technology on Aerodynamic Design and Research, Northwestern Polytechnical University, Xi’an 710072, China
*
Author to whom correspondence should be addressed.
Wind 2023, 3(4), 439-458; https://doi.org/10.3390/wind3040025
Submission received: 9 August 2023
/
Revised: 26 September 2023
/
Accepted: 3 October 2023
/
Published: 9 October 2023
Abstract
:In this paper, the NWT600 airfoil with a thickness ratio of 60% is taken as the research object. The aerodynamic performance of the airfoil is analyzed by experiments and numerical simulations. The results simulated by various turbulence models used in the 2D steady-state RANS method are compared, including the Spalart–Allmaras model, k-ω SST model, k-ε realizable model, and Reynolds stress (linear pressure-strain) model. The influence of blunt trailing-edge thickness on aerodynamic characteristics is studied by adding thickness symmetrically. The results show that even under the low subsonic flow with a Mach number of 0.149, the airflow is prone to severe separation. The aerodynamic performance of the airfoil is very different from that of the conventional thin airfoil. Although the 2D steady-state RANS models overestimate the pressure on the surface of the airfoil in most cases, it is qualitatively acceptable to predict the pressure distribution of the very thick airfoil. Numerical results simulated by the Reynolds stress model are in the best agreement with the experimental data. It is also found that symmetrically thickening the trailing edge effectively improves the maximum lift coefficient and reduces the drag coefficient at a small angle of attack.
1. Introduction
In recent decades, as environmental conditions worsen and global fossil fuel supplies diminish, there is growing interest in renewable energy sources such as solar, wind, and biomass. Of all the renewable energy options available, wind energy is considered to have the greatest potential in terms of generating capacity [1,2]. To lower the cost of wind energy, wind turbines have gradually become larger. Wind turbine blades increase in length and weight. The blade’s inner part also needs to have greater resistance to bending and twisting. Therefore, the thickness of the airfoil used for the inboard section increases continuously [3]. How to maximize the aerodynamic performance of the blade while meeting the structural requirement has become a new design problem [4], which further promotes the development of thick airfoils.
Flatback airfoils, also known as blunt trailing-edge (BTE) airfoils, as opposed to sharp trailing-edge airfoils, have a greater cross-section area and a larger inertia moment, which can greatly enhance blade rigidity while efficaciously decreasing blade weight [5]. Moreover, the BTE airfoil exhibits less sensitivity to surface soiling than sharp trailing-edge airfoils [6] and is more convenient for industrial processing with lower technological requirements [7]. More and more scholars have demonstrated that adding thickness to the BTE can significantly increase the CL (lift coefficient) of the wind turbine airfoils [8,9,10,11,12,13]. In the design of large wind turbine blades, the thick BTE airfoil is increasingly serving as a bridge between structural strength and aerodynamic characteristics [14,15].
For the numerical simulation method of flatback airfoils, it has been demonstrated that the load predictions obtained from 2D URANS simulations are acceptable [16,17]. The DES method has been proved to be a suitable method; the predicted forces and unsteady characteristics show excellent agreement with the experimental data [16,17,18,19]. The LES method is also a suitable method to study unsteady characteristics of flatback airfoils [20].
In practical engineering applications, more attention is paid to the value of the forces and whether the forces are increasing or decreasing. Therefore, the load prediction at the lowest possible cost has attracted more attention. Based on that, some turbulence models used in the RANS method are compared in this paper to figure out whether the 2D steady-state RANS method is a suitable way to predict loads with large separation flows and find the most suitable turbulence model.
For the BTE airfoils, a lot of research have been performed. In previous studies, Hoerner [21] conducted wind tunnel experiments on some blunt trailing-edge airfoils. He found that the CLmax increased significantly while increasing the trailing-edge thickness after truncating the Go-490 airfoil with a relative thickness of 20%. In addition, Tanner [8], Ramjee [9], Sato [10], Law [11], and Fuglsang [12] all experimentally investigated the aerodynamic characteristics of airfoils with relative thicknesses from 6% to 43% at different Reynolds numbers and trailing-edge thicknesses. However, in the above studies, the BTE is generated by truncating the trailing edge. In this way, the airfoil’s relative thickness is changed. Timmer et al. [22] summarized the experimental data of wind turbine airfoils developed by Delft University of Technology with a relative thickness from 21% to 30% and studied the effects of the trailing-edge wedge, the Gurney flap, and the vortex generators on the aerodynamic performance of the DU series of airfoils. These airfoils were designed to be the BTE with a very limited relative thickness. In 2006, Baker et al. [13] studied the aerodynamic characteristics of the FB-3500 airfoil under different blunt trailing-edge thicknesses through experiment and numerical simulation. The BTE airfoil is generated by symmetrical thickening, in which the relative thickness of the airfoil remains 35%. The results showed that increasing the trailing-edge thickness could improve the aerodynamic characteristics of the thick airfoil.
In recent years, many scholars studied the influence of passive and active flow control devices on the aerodynamic characteristics of BTE airfoils. Scholars at home and abroad studied a variety of methods, such as adding Gurney flaps [23], the application of vortex generators [23,24,25], and splitter plates [26,27], as well as active circulation control devices [28]. The results all showed that these flow control devices could effectively improve the aerodynamic characteristics of BTE airfoils.
To increase the power generation of a single wind turbine and lower the cost of power generation, wind turbine blades gradually increase in size. The size of wind turbines has grown rapidly over the past few decades, from rotor diameters of 17 m in the early years, to more than 125 m in modern times [29]. It is expected that the size will keep increasing.
With this background, the airfoils used in the inboard section are getting thicker and thicker. The application of thick airfoils with relative thicknesses of more than 40% has become very common. The demand for thicker airfoils also increased significantly. However, in existing studies, there are few studies on the numerical simulation for airfoils with thickness-to-chord ratios exceeding 40%, let alone airfoils with relative thicknesses of 60%.
For the airfoils with relative thicknesses over 40%, it seems that only Zhang Lei’s team at the Chinese Academy of Sciences has conducted some research. Through numerical simulation and experimental methods, Zhang et al. [25,30,31] has investigated the aerodynamic characteristics of the DU00-W-401 airfoil and CAS-W1-450 airfoil, as well as the effects of vortex generators on the aerodynamic performance of the CAS-W2-400 airfoil and CAS-W1-450 airfoil. They also investigated the influence of the Reynolds number on the CAS-W2-400 airfoil experimentally, and it was found that the “positive” effects observed on thin aviation airfoils because of increasing Re are not definitely applicable to thick airfoils. Therefore, the theory that is applicable to thin airfoils may not be appropriate for thick airfoils. It is necessary to study the effect of the BTE thickness on an airfoil with a relative thickness of up to 60%. It aids in the accurate assessment and improvement of the aerodynamics of extremely thick airfoils used in wind turbines.
2. Method
2.1. Experimental Setup
In this paper, the research object is the NWT600 airfoil, which is shown in Figure 1. It is a very thick airfoil in the megawatt wind turbine airfoil series and is designed for the inner sections of the wind turbine blade. Its relative thickness is up to 60% with a BTE relative thickness of 2%.
The measurements of the NWT600 airfoil were conducted in the NF-3 wind tunnel of Northwestern Polytechnical University, which is of a closed blow-down type with three replaceable test sections. The testing section of a 2D airfoil has a dimension of 1.6 m × 3 m and a length of 8 m. The velocity of the flow varies from 15 m/s to 120 m/s, with the turbulence level averaging 0.045%. It is the largest low-speed airfoil testing section in Asia.
The testing model is a mixed steel–wood structure with a span length of 1.595 m, a chord length of 0.6 m, and an aspect ratio of 2.67. The pressure taps were positioned along the model’s central span-wise line. By measuring the surface pressure, the lift force and pitching moment of the airfoil were calculated. Figure 2 displays the pressure tap distribution and geometrical profiles.
The wake rake is positioned at 1.2 chord lengths from the trailing edge of the model, which is shown in Figure 3. It contains 9 static pressure tubes and 186 total pressure tubes.
In the experiments, both surface static pressure and total wake pressure were measured using a 9816-pressure scanning valve with a range of 1 Psi. The acquisition frequency was 100 Hz, and the acquisition duration was 20 s. Since the NF-3 wind tunnel is a closed blow-down wind tunnel, the surface roughness of the model will be affected by the test environment. During the test, the wind was stopped 3 times, and the model surface was wiped with a clean towel to maintain the cleanliness of the model surface.
During the acquisition process, the signal deviation is mainly caused by the change of atmospheric temperature and pressure, as well as by the heating of electronic components. The 9816-pressure scan valve has a system uncertainty of 0.05% and an AoA uncertainty of less than 3′. Due to the large sample size of each data point (collection time 20 s, collection frequency 100 Hz, and sample size 2000), according to statistical theory, the standard deviation range of the average value is 3~5% of a single time. The final uncertainty transfer results are given by 7 repeated tests, which fully meet the requirements of the airfoil test.
During the service of the wind turbine, the surface roughness of the blade gradually increases, which is caused by material erosion, manufacturing defects, and the accumulation of dust, insects, and ice adhering to the leading edge of the blade. These pollutants may affect the aerodynamic performance of the blades by promoting boundary-layer separation or laminar-to-turbulent transition [32]. Therefore, it is necessary to add a set of experimental data of the airfoil with zig-zag tapes on the leading edge (fixed transition) to the data of the original airfoil in the experiment (free transition).
As a standard way of checking the roughness sensitivity of the leading edge, a zig-zag tape with a thickness of 0.35 mm was used (shown in Figure 4). The material of the zig-zag tape is No. 80 emery. The width of the tape is 3 mm. The tape was settled at 5% chord on the upper side and 10% chord on the lower side. The thickness and the position of the specific tape are determined by the method of Braslow [33] to effectively force the inflow to be transformed into turbulent flow.
For the very thick airfoil, the surface flow is affected by the boundary layer of the side wall. Flow separation occurs easily at the end of the model, which affects the two-dimensional characteristics of the flow. In the process of the test, a vortex generator was installed at the end of the upper surface to control the corner flow separation between the model and the side wall and to ensure the two-dimensional characteristics of the flow on the wing surface. This method has been confirmed in a previous paper [34].
The experiments were conducted with varying Re (2.0 × 10⁶, 2.5 × 10⁶, and 3.0 × 10⁶) and under free and fixed transition conditions. The pressure tests are performed at 1° intervals from −15° to 25°. The test plan is presented in Table 1.
2.2. Numerical Method and Validation
The numerical simulations are based on the 2D steady-state Reynolds-averaged Navier–Stokes (RANS) equations in the CFD solver Fluent. To improve the calculation accuracy, the spatial discretization of all the cases is set as the second order upwind. The pressure–velocity coupling is based on the SIMPLE method, and the pressure-based solver is used in the numerical simulation. The properties of air are set as an ideal gas, and its viscosity is solved by the Sutherland model.
The DU97-W-300 airfoil was developed and tested in a low-speed, low-turbulence wind tunnel at the Institute of Aerospace Engineering, University of Delft, The Netherlands, and was widely used in wind turbine applications and research [22]. In this paper, the DU97-W-300 airfoil is selected to validate the numerical method and to determine the appropriate grid density used in this study. The mesh is shown in Figure 5. The grid is created with an O-type topology structure. The far-field radius is 50 times the chord length, and the far-field center is set on the leading-edge point of the airfoil. The wall is set as the non-slip wall. The outer boundary is set as the pressure far-field boundary.
Three sets of grids with different densities are created, which are Grid A (28,800 cells), Grid B (80,000 cells), and Grid C (115,200 cells). The topological structure of these grids is consistent with that in Figure 5b. Detailed parameters of the grids are shown in Table 2—the main parameters of the DU97-W-300 grids.
The grid independency study is conducted at a typical test condition: AoA (angle of attack) = 9.3°, Ma = 0.2165, and Re = 3.0 × 10⁶. The turbulence model used in the simulation is the k-ω SST model. The results are shown in Table 3. It can be seen that the simulated CL is all higher than the experimental data [22], and with grid numbers increasing, the numerical results gradually approach the experimental data. The calculated CD is a little higher than the experimental data, which are similar to the simulation results of Gao et al. [35] using the S-A model. From Table 3, the results calculated with Grid C are closer to the experimental data. The lift coefficient is slightly closer to the experimental results than that of Grid B, but at the same time, the number of cells is 44% larger than that of Grid B. To maintain the accuracy of the simulation and save calculation resources, the grid density in this paper will be same as that of Grid B for the remaining numerical simulations.
To further validate the numerical method, the flow fields of the DU97-W-300 airfoil are simulated at the AoAs between −4° and 20°. Figure 6 and Figure 7 present the numerical results of the CL and CD curves and the CP distribution.
For the CL, the simulation results of the S-A model and k-ω SST are in good agreement with the experimental data before the stall AoA of about 12.8° but overestimate after the stall. When approaching the stall AoA, the simulation results of the Reynolds stress model (RSM) underestimate the lift of the airfoil and overestimate its drag. However, after the stall, the simulated results of the Reynolds stress model agree well with the experimental data. For CD, the present results are all higher than the experiment data before the stall but a little underestimated after the stall. For the CP distribution, the simulation results of the S-A model and k-ω SST are in good agreement with the experimental data. Overall, the simulation results of the S-A model and k-ω SST agree quite well with the experimental data before stall, while the simulation results of the k-ε realizable model and RSM agree quite well with the experimental data after stall.
3. Results and Discussion
3.1. Analysis of Aerodynamic Characteristics of the NWT600 Airfoil
At different Reynolds numbers, Re = 2.0 × 10⁶, Re = 2.5 × 10⁶, and Re = 3.0 × 10⁶, the CL, CD, CM, and L/D of the NWT600 airfoil under the free and fixed transition conditions are measured experimentally, as shown in Figure 8.
It can be observed from the data that the aerodynamic performance of the NWT600 airfoil is very different from that of the conventional thin airfoil, which is mainly reflected in the following aspects.
First, for the AoAs between −15° and 15°, the CL of the airfoil decreases when the AoA increases. A similar phenomena also appears in the numerical results of the FB-3500-0050 airfoil by Baker et al. [13] and the CL curve of the TR-44 airfoil simulated by Standish et al. [36] using the MSES. The AoA range of the negative lift gradient is much bigger in this study.
Second, for the conventional thick airfoil, the CL under the fixed transition condition is usually lower than that under the free transition condition, while the CD is usually higher [13,36]. However, the case of the NWT600 airfoil is quite different. The CL of the NWT600 airfoil under the fixed transition condition is higher than that under the free transition condition at most AoAs. The CD under the fixed transition condition is lower than that under the free transition condition at a part of the AoAs. For example, for the experimental data with Re = 2.0 × 10⁶, when AoA is less than −8°, the drag coefficient under the fixed transition condition is lower than that under the free transition condition.
The simulation condition is set at Re = 2.0 × 10⁶ and Ma = 0.149, which is consistent with the experimental condition at Re = 2.0 × 10⁶. The setting of the numerical simulation is exactly the same as that in the numerical validation. Many numerical simulations of the NWT600 airfoil are performed based on various turbulence models, including the Spalart–Allmaras model, k-ω SST model, k-ε realizable model, and Reynolds stress (linear pressure-strain) model, and the results simulated with these turbulence models are compared. All the simulations are considered to be fully turbulent. At the same time, the reason why the aerodynamic characteristics of the NWT600 airfoil are so different from those of the conventional thin airfoils is explored.
The curves of CL, CD, CM, and L/D are shown in Figure 9. The variation trends of the aerodynamic force coefficients with the four turbulence models agree qualitatively well with those of the experimental data, although the numerical values deviate from the experimental data. Among these turbulence models, the Reynolds stress (linear pressure-strain) model gives the best agreement with the experimental data, and differences between the results of the other three models are small.
Figure 10 displays the flow fields of the airfoil. It can be seen that even at a low subsonic flow with the Ma = 0.149, the airflow separates easily on the surface of the NWT600 airfoil at all AoAs. The separation vortices are generated around the trailing edge and extend to at least 1.3 times the chord length. When the AoA is over 20°, the separation area is significantly larger.
The RANS method, as the name implies, simulates turbulence through time-averaged treatment. The Reynolds stress terms in the equations are solved by modeling the time-averaged terms rather than the energy transported through the random turbulence fluctuation [37]. Due to the strong separation flow on the airfoil surface, the flow presents three-dimensional characteristics, whereas the present numerical simulation is based on the two-dimensional RANS method. In the validation of the DU97-W-300 airfoil, simulation results of CL after stall also deviate more or less from the experimental data. Therefore, it is not surprising that the present numerical results with severe flow separation deviate from the experimental data.
Among the various types of RANS turbulence models available in ANSYS Fluent, the Reynolds stress model (RSM) is the most elaborate. The RSM abandons the assumption of isotropic eddy viscosity and solves transport equations for the Reynolds stresses in conjunction with an equation for the dissipation rate, thereby closing the RANS equations [38,39]. Since the RSM accounts for the effects of streamline curvature, swirl, rotation, and rapid changes in strain rate in a more rigorous manner, it has the potential to provide more precise prediction for intricate flows. Therefore, it is not surprising that the results of RSM simulation agree best with the experimental data.
For the NWT600 airfoil with a very large relative thickness, the change rate of its thickness along the chord line direction is very high. The pressure would change rapidly, causing a severe adverse pressure gradient and separation phenomenon. Therefore, the aerodynamic characteristics are very poor and difficult to predict, which is similar to those of the conventional thin airfoil under the stall condition. Because the slope of the trailing-edge profile of the airfoil is large, when AoA = 25°, the airflow direction is almost parallel to the trailing-edge profile of the lower surface and perpendicular to the trailing-edge profile of the upper surface. The air can flow over the lower trailing edge without hindrance but can hardly attach to the upper trailing edge.
The larger lift at negative AoAs is mainly due to the higher flow velocity around the maximum thickness point, which forms a low-pressure area on the upper surface. With AoA increasing, the airflow velocity on the upper surface decreases because of the occurrence of separation at the upper trailing edge. The airflow velocity on the lower surface increases because of the disappearance of separation at the lower trailing edge, resulting in the increase in pressure on the upper surface and the decrease in pressure on the lower surface. Therefore, the lift force gradually decreases. When the AoA gets larger than 15°, the component force of the high pressure around the stagnation point in the lift direction becomes larger, so the lift increases with the AoA.
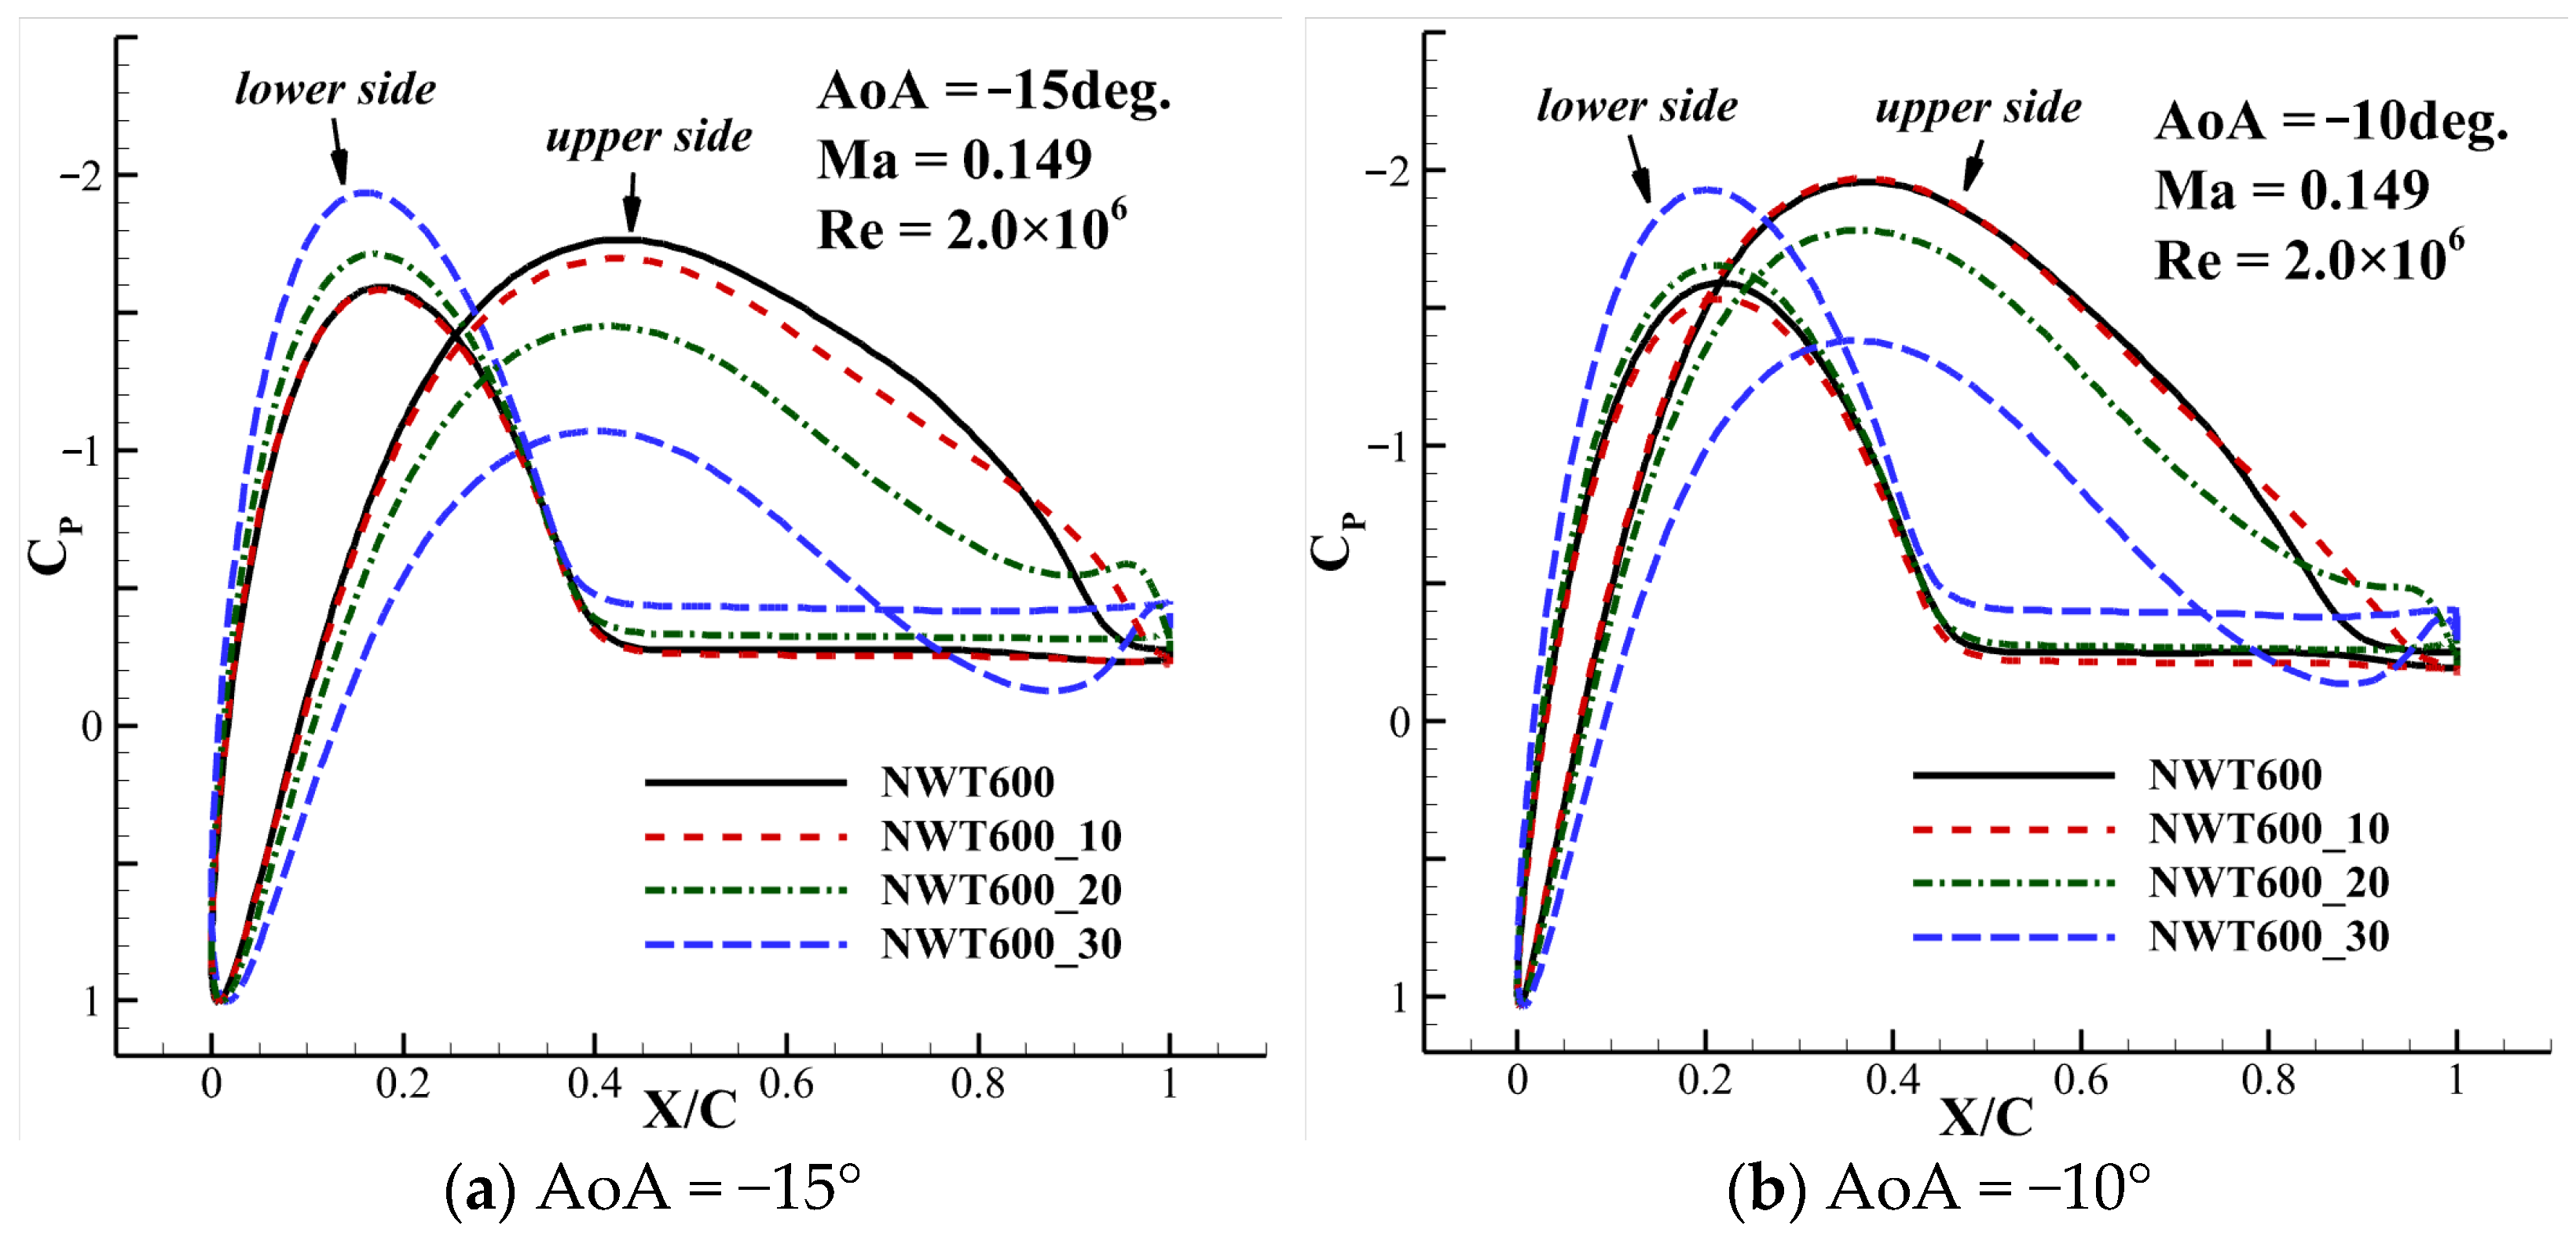
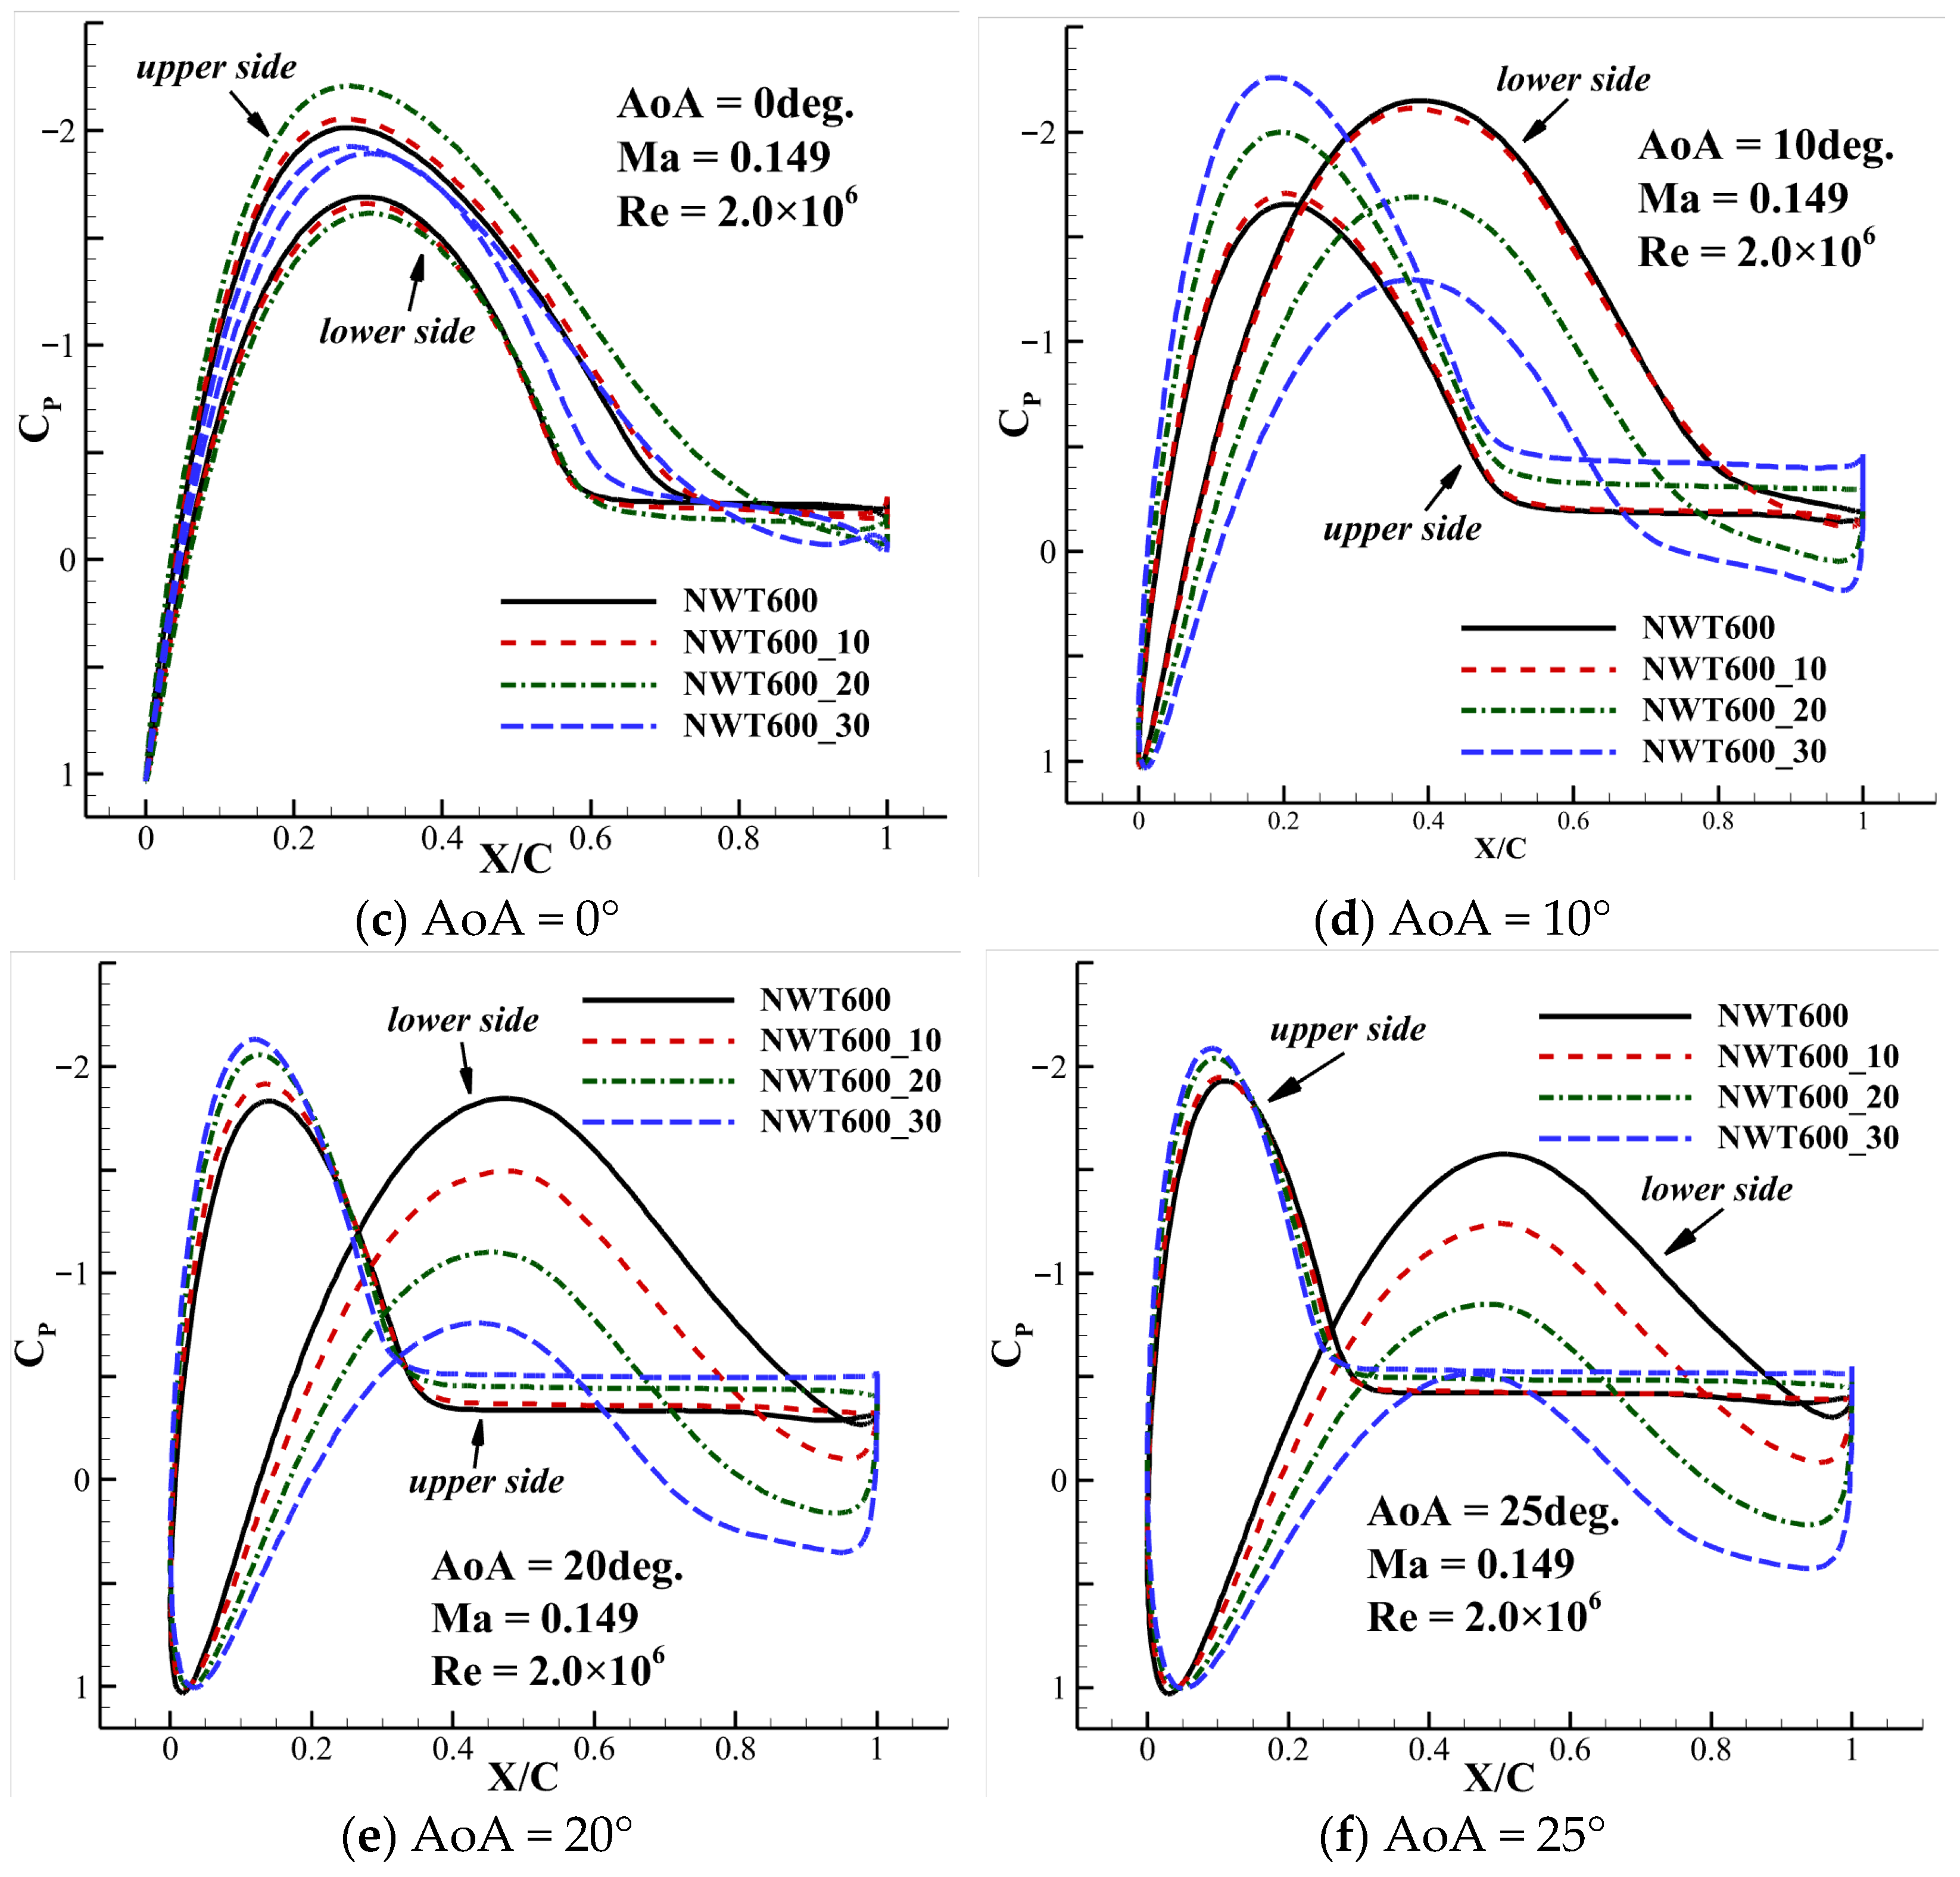
Figure 11a–f show the CP distribution of the simulation results and the experimental data at different AoAs. From the CP distribution curve, it can be observed that although there is a difference in values between the force coefficient simulated by the RANS model and the experimental data, the variation trend of the pressure distribution curves along the airfoil surface at different AoAs is consistent with the experimental data. The reason for the value difference of the force coefficient is that the RANS method overestimates the pressure of the airfoil surface in most cases, especially in the separation region (i.e., the horizontal part of the CP distribution curve). Although the 2D steady-state RANS models overestimate the pressure of the airfoil surface in most cases, it is qualitatively acceptable to predict the surface pressure distribution of the very thick airfoil. Although there is a deviation between the aerodynamic force value predicted by the RANS method and the experimental data, it is reasonable for reference.
It is obvious that the dp/dx is quite large before the separation area. In this region of adverse pressure gradient, the fluid elements moving along a streamline have to work their way “uphill” against an increasing pressure. The fluid elements will slow down. As a result, the fluid element comes to a stop somewhere downstream and reverses its direction, causing separation from the surface.
Due to the low-pressure area on both the upper and lower surfaces of the airfoil, the CP curve of the upper surface intersects that of the lower surface. The pressure force direction around the leading edge is opposite to that around the trailing edge. Therefore, the lower and upper surfaces of the NWT600 airfoil cannot be simply called the pressure side and suction side, respectively.
At the negative AoAs, the force direction around the leading edge is downward, and the force direction around the trailing edge is upward. The moment of the airfoil is a negative pitching moment. As the AoA increases to 0°, the CP distribution curves of the upper and lower airfoil gradually approach each other. The moment gradually decreases to about 0. The variation trend of the pressure distribution from AoA = 0° to AoA = 15° is similar to that from AoA = −15° to AoA = 0°. The moment changes to a positive pitching moment and gradually increases. When the AoA is over 15°, the positive lift force around the leading edge continues to increase, but the negative lift force around the trailing edge gradually decreases. With the increasing of AoA, the direction of incoming flow is gradually parallel to the trailing edge profile of the lower surface. Therefore, the suction force on the lower trailing edge gradually decreases. The positive pitching moment of the airfoil decreases gradually.
3.2. Influence of the BTE Thickness on the Aerodynamic Characteristics of the NWT600 Airfoil
The BTE modification of the wind turbine airfoils has become a hot topic in the past few years. There are several methods to modify an airfoil to a BTE, such as rotating the upper and lower curves of the airfoil around the leading-edge point and the trailing-edge wedge, which is to add a Gurney flap on the trailing edge and then connect the 90% chord position to the edge of the Gurney flap with a smooth curve to form a BTE airfoil and adding trailing-edge thickness symmetrically or asymmetrically [20,40].
Among these methods, the most commonly used method is adding trailing-edge thickness symmetrically, which is to add thickness symmetrically on both sides of the mean camber line. In this way, the airfoil obtains a BTE, and the important geometric parameters such as “nose” geometry, airfoil camber, and maximum thickness do not change. This method is adopted in this paper. Set the original coordinate point as (x0, y0), and set the new coordinate point on the profile curve after modification as (x, y), which can be expressed as follows:
where δ represents the thickness increment at the trailing edge; xt represents the location of the maximum thickness; c is the chord length; n is the power exponent. n = 1 corresponds to a linear distribution. The larger the n is, the smaller the thickness increment will be at the beginning of the thickening process. In this study, n is equal to five. Six airfoils with different trailing-edge thicknesses have been obtained. The BTE relative thicknesses of these airfoils are shown in Table 4, and the airfoils are shown in Figure 12.
Figure 13a–d present the curves of CL, CD, CM, and L/D of the six airfoils. From the CL curve, it can be clearly observed that with the trailing-edge thickness increasing, the variation trend of the CL curve gradually becomes similar to the trend of the conventional thin airfoil, and the AoA range where the slope of the CL curve is negative gets shorter. At positive AoAs, CL increases with the BTE thickness. When the BTE thickness is thickened to 30% chord length, the phenomenon of CL decreasing with increasing AoA disappears completely. For the CD, with the increasing of the BTE thickness, the CD increases at large AoAs and decreases at small AoAs. The moment coefficient also changes greatly. The moment coefficient curve at positive AoAs is continuously shifted downward.
The simulated results show that by adding the BTE thickness symmetrically, the aerodynamic characteristics of the NWT600 airfoil can be effectively improved. The CLmax of the NWT600 airfoil is 0.519, and the corresponding AoA is −12 degrees. The CLmax of the NWT600_30 airfoil is 0.802 at 25 degrees. The maximum L/D also increases significantly. The L/Dmax of the NWT600 airfoil is 4.308 at −10 degrees. The L/Dmax of the NWT600_30 airfoil is 9 at 4 degrees.
Figure 14a–f show the flow fields of the NWT600_30 airfoil at different AoAs. With the thickening of the trailing edge, the change rate of its thickness along the chord line direction is getting smaller. The pressure changes more gently along the airfoil surface. The adverse pressure gradient becomes smaller. The flow becomes easier to attach to the airfoil surface. It seems as if the thickened part of the BTE fills the separation area. This makes the aerodynamic characteristics of this very thick airfoil similar to those of conventional thin airfoils, especially at small AoAs between −4° and 4°. At AoA = 0°, the separation flow on the NWT600_30 airfoil surface almost disappears. Except for a vortex on the lower surface caused by the positive camber, there is only a pair of reverse vortices behind the BTE. It should be noted that this vortex mentioned here is not a real vortex in the flow field, but a time-averaged result. This greatly improves the aerodynamic performance of the airfoil at small AoAs.
For the NWT600_30 airfoil, the BTE is much thicker. At a negative AoA, when the air flows over the upper surface, compared with the situation of the NWT600 airfoil, the pressure on the upper surface increases significantly. The upper surface of the NWT600_30 airfoil becomes the pressure surface. Because the lower surface is still in the separation zone, its pressure changes very little. As a result, the lift at negative AoAs becomes lower.
At positive AoAs, the situation corresponds to that at negative AoAs. In addition, the positive camber of the lower surface profile further increases the pressure on it, resulting in an area of high pressure. The lift force at a positive AoA increases substantially.
Figure 15 presents the CP distribution of the airfoils with different BTE thicknesses. It can be observed that the increase in the trailing-edge thickness obviously changes the CP distribution of the airfoil at all AoAs, but the chord line position of the peak pressure point and the variation trend of the CP distribution curve are not changed. It can be found that, as the BTE thickness increases, the pressure of the leeward side (the side where the separation occurs) has a little change. The pressure increase on the windward side of the airfoil during the thickening process is the major cause of the significant improvement in the aerodynamic characteristics. It further verifies the analysis in the previous part.
In general, the way of symmetrically thickening the BTE of the NWT600 airfoil could greatly improve its aerodynamic characteristics. The aerodynamic characteristics of the NWT600 airfoil gradually become similar to those of the conventional thin airfoil when the BTE of the airfoil is symmetrically thickened.
4. Summary
In this paper, the aerodynamic characteristics of the NWT600 airfoil with a relative thickness of up to 60% are studied. The simulation results with different turbulence models are compared. The influence of the BTE thickness on the aerodynamic characteristics of the NWT600 airfoil is studied. The conclusions are as follows.
(1) For such very thick airfoils, the aerodynamic characteristics are very different from those of the conventional thin airfoil. Between −15° and 15°, the lift coefficient of the airfoil decreases with the AoA increase. For the NWT600 airfoil, due to its very large relative thickness, the airflow is very prone to separation even in a low subsonic flow, and the separation region is quite large. The CP distribution curves of the lower and upper surfaces intersect, so that the aerodynamic forces around the leading edge and trailing edge are in opposite directions. The aerodynamic performance of the NWT600 airfoil is very poor.
(2) Although the 2D steady-state RANS models overestimate the pressure of the airfoil surface in most cases, it is qualitatively acceptable to predict the surface pressure distribution of the very thick airfoil. Although there is a deviation between the aerodynamic force value predicted by the RANS method and the experimental data, it is reasonable for reference. In addition, among the S-A model, k-ε realizable model, k-ω SST model, and Reynolds stress (linear pressure-strain) model used in this paper, the results simulated with the RSM have the best agreement with the experimental data.
(3) The aerodynamic characteristics of the NWT600 airfoil with different BTE thicknesses are studied. During the process of trailing-edge thickening, it seems as if the thickened area of the airfoil fills the separation area, so that the airflow can easily attach to the airfoil surface. The CLmax and the L/Dmax of the airfoil are significantly increased. The CD is slightly reduced at small AoAs. The aerodynamic characteristics of the airfoil are significantly improved.
Author Contributions
Conceptualization, Z.P. and H.-Y.X.; methodology, H.-Y.X.; software, Z.P. and L.-X.L.; validation, Z.P.; formal analysis, Z.P. and H.-Y.X.; investigation, Z.P., H.-Y.X. and L.D.; resources, H.-Y.X.; data curation, Z.P. and L.D.; writing—original draft preparation, Z.P.; writing—review and editing, Z.P., H.-Y.X., L.D. and L.-X.L.; visualization, Z.P.; supervision, H.-Y.X.; project administration, H.-Y.X.; funding acquisition, H.-Y.X. All authors have read and agreed to the published version of the manuscript.
Funding
This work was supported by the National Natural Science Foundation of China (Grant No. 11972306) and the 111 Project of China (B17037).
Institutional Review Board Statement
Not applicable.
Informed Consent Statement
Not applicable.
Data Availability Statement
The data are available from the corresponding author on reasonable request.
Acknowledgments
The authors would like to acknowledge the computing services of the High Performance Computing Center of Northwestern Polytechnical University.
Conflicts of Interest
The authors declare no conflict of interest.
Nomenclature
| AoA | angle of attack [°] |
| CL | lift coefficient [-] |
| CLmax | maximum lift coefficient [-] |
| CD | drag coefficient [-] |
| CM | moment coefficient [-] |
| L/D | lift-to-drag ratio [-] |
| CP | pressure coefficient [-] |
| Ma | Mach number [-] |
| Re | Reynolds number [-] |
| c | chord length [m] |
| BTE | blunt trailing edge |
| RANS | Reynolds-averaged Navier–Stokes |
| S-A | Spalart–Allmaras model |
| RSM | Reynolds stress model |
References
- Yu, H.W.; Duan, J.H.; Du, W.; Xue, S.; Sun, J.H. China’s Energy Storage Industry: Develop Status, Existing Problems and Countermeasures. Renew. Sustain. Energy Rev. 2017, 71, 767–784. [Google Scholar] [CrossRef]
- Zhang, Y.; Xu, Y.J.; Guo, H.; Zhang, X.J.; Guo, C.; Chen, H.S. A Hybrid Energy Storage System with Optimized Operating Strategy for Mitigating Wind Power Fluctuations. Renew. Energy 2018, 125, 121–132. [Google Scholar] [CrossRef]
- Grasso, F. Development of Thick Airfoils for Wind Turbines. J. Aircr. 2013, 50, 975–981. [Google Scholar] [CrossRef]
- Li, X.X.; Yang, K.; Bai, J.Y.; Xu, J.Z. A New Optimization Approach to Improve the Overall Performance of Thick Wind Turbine Airfoils. Energy 2016, 116, 202–213. [Google Scholar] [CrossRef]
- Griffith, D.T.; Richards, P.W. The SNL100-03 Blade: Design Studies with Flatback Airfoils for the Sandia 100-Meter Blade; SANDIA Report No. SAND2014-18129; Sandia National Laboratories: Albuquerque, NM, USA, 2014. [Google Scholar] [CrossRef]
- Cooperman, A.M.; Melennan, A.W.; Chow, R.; Baker, J.P.; Van Dam, C.P. Aerodynamic Performance of Thick Blunt Trailing Edge Airfoils. In Proceedings of the 28th AIAA Applied Aerodynamics Conference, Chicago, IL, USA, 28 June–1 July 2010. [Google Scholar] [CrossRef]
- Van Dam, C.P.; Kahn, D.L.; Berg, D.E. Trailing Edge Modifications for Flatback Airfoils; SANDIA Report No. SAND2008-1781; Sandia National Laboratories: Albuquerque, NM, USA, 2008. [Google Scholar] [CrossRef]
- Tanner, M. A Method for Reducing the Base Drag of Wings with Blunt Trailing Edge. Aeronaut. Q. 1970, 23, 15–23. [Google Scholar] [CrossRef]
- Ramjee, V.; Tulapurkara, E.G.; Balabaskaran, V. Experimental and Theoretical Study of Wings with Blunt Trailing Edges. J. Aircr. 1986, 23, 349–352. [Google Scholar] [CrossRef]
- Sato, J. Experimental Research on Blunt Trailing-Edge Airfoil Sections at Low Reynolds Numbers. AIAA J. 1995, 33, 2001–2005. [Google Scholar] [CrossRef]
- Law, S.P.; Gregorek, G.M. Wind Tunnel Evaluation of a Truncated NACA 64-621 Airfoil for Wind Turbine Applications; NASA Report No. NASA CR-180803; NASA: Washington, DC, USA, 1987. [Google Scholar] [CrossRef]
- Fuglsang, P.; Antoniou, I.; Dahl, K.S. Wind Tunnel Tests of the FFA-W3-241, FFA-W3-301 and NACA 63-430 Airfoils; Risø National Laboratory: Roskilde, Denmark, 1998. [Google Scholar]
- Baker, J.P.; Mayda, E.A.; Van Dam, C.P. Experimental Analysis of Thick Blunt Trailing-Edge Wind Turbine Airfoils. J. Sol. Energy Eng. 2006, 128, 422–431. [Google Scholar] [CrossRef]
- Chao, D.D.; Van Dam, C.P. Computational Aerodynamic Analysis of a Blunt Trailing-edge Airfoil Modification to the NREL Phase VI rotor. Wind Energy 2010, 10, 529–550. [Google Scholar] [CrossRef]
- Lee, S.G.; Sang, J.P.; Lee, K.S.; Chung, C. Performance Prediction of NREL (National Renewable Energy Laboratory) Phase VI Blade Adopting Blunt Trailing Edge Airfoil. Energy 2012, 47, 47–61. [Google Scholar] [CrossRef]
- Papadakis, G.; Manolesos, M. The flow past a flatback airfoil with flow control devices: Benchmarking numerical simulations against wind tunnel data. Wind Energy Sci. 2020, 5, 911–927. [Google Scholar] [CrossRef]
- Manolesos, M. Papadakis, G, Investigation of the three-dimensional flow past a flatback wind turbine airfoil at high angles of attack. Phys. Fluids 2021, 33, 085106. [Google Scholar] [CrossRef]
- Bangga, G.; Seel, F.; Lutz, T.; Kvhn, T. Aerodynamic and Acoustic Simulations of Thick Flatback Airfoils Employing High Order DES Methods. Adv. Theory Simul. 2022, 2022, 2000129. [Google Scholar] [CrossRef]
- Fuchs, M.; Weihing, P.; Kuehn, T.; Herr, M.; Suryadi, A.; Mockett, C.; Knobbe-Eschen, H.; Kramer, F.; Knacke, T. Two computational studies of a flatback airfoil using non-zonal and embedded scale-resolving turbulence modelling approaches. In Proceedings of the 28th AIAA/CEAS Aeroacoustics 2022 Conference, Southampton, UK, 14–17 June 2022. [Google Scholar] [CrossRef]
- Wang, G.F.; Zhang, L.; Shen, W.Z. LES simulation and experimental validation of the unsteady aerodynamics of blunt wind turbine airfoils. Energy 2018, 158, 911–923. [Google Scholar] [CrossRef]
- Hoerner, S.F. Fluid-Dynamic Lift; Hoerner Fluid Dynamic: Bricktown, NJ, USA, 1985. [Google Scholar]
- Timmer, W.A.; Rooij, V.R. Summary of the Delft University Wind Turbine Dedicated Airfoils. J. Sol. Energy Eng. 2003, 125, 488–496. [Google Scholar] [CrossRef]
- Cene, A.; Grasso, F.; Manolesos, M. Aerodynamic and Aeroacoustic Measurements of the Flow Past a Very Thick Flatback Airfoil with Passive Flow Control Devices. In Proceedings of the AIAA SciTech 2022 Forum, San Diego, CA, USA, 3–7 January 2022. [Google Scholar] [CrossRef]
- Baldacchino, B.; Ferreira, C.; Tavernier, D.D.; Timmer, W.A.; Van Bussel, G.J.W. Experimental Parameter Study for Passive Vortex Generators on a 30% Thick Airfoil. Wind Energy 2018, 21, 745–765. [Google Scholar] [CrossRef]
- Zhang, L.; Li, X.X.; Yang, K.; Xue, D.Y. Effects of vortex generators on aerodynamic performance of thick wind turbine airfoils. J. Wind Eng. Ind. Aerodyn. 2016, 156, 84–92. [Google Scholar] [CrossRef]
- Metzinger, C.N.; Chow, R.; Baker, J.P.; Cooperman, A.M.; Van Dam, C.P. Experimental and Computational Investigation of Blunt Trailing-Edge Airfoils with Splitter Plates. AIAA J. 2018, 56, 3229–3239. [Google Scholar] [CrossRef]
- Manolesos, M.; Voutsinas, S.G. Experimental Study of Drag Reduction Devices on a Flatback Airfoil. AIAA J. 2016, 54, 3382–3396. [Google Scholar] [CrossRef]
- Xu, H.Y.; Qiao, C.L.; Yang, H.Q.; Ye, Z.Y. Active Circulation Control on the Blunt Trailing Edge Wind Turbine Airfoil. AIAA J. 2017, 56, 554–570. [Google Scholar] [CrossRef]
- Wang, L.; Liu, X.W.; Kolios, A. State of the art in the aeroelasticity of wind turbine blades: Aeroelastic modelling. Renew. Sustain. Energy Rev. 2016, 64, 195–210. [Google Scholar] [CrossRef]
- Zhang, L.; Li, X.X.; Yang, K. Experimental and computational aerodynamic investigations of very thick wind turbine airfoils. J. Renew. Sustain. Energy 2016, 8, 013306. [Google Scholar] [CrossRef]
- Li, X.X.; Yang, K.; Zhang, L.; Bai, J.Y. Experimental study of Reynolds number effects on performance of thick CAS wind turbine airfoils. J. Renew. Sustain. Energy 2017, 9, 063309. [Google Scholar] [CrossRef]
- White, E.B.; Kutz, D.; Freels, J.; Hidore, J.P. Leading-Edge Roughness Effects on 633-418 Airfoil Performance. In Proceedings of the 49th AIAA Aerospace Sciences Meeting including the New Horizons Forum and Aerospace Exposition, Orlando, FL, USA, 4–7 January 2011. [Google Scholar] [CrossRef]
- Braslow, A.L.; Knox, E.C. Simplified Method for Determination of Critical Height of Distributed Roughness Particles for Boundary-Layer Transition at Mach Numbers from 0 to 5; National Advisory Committee for Aeronautics: Edwards, CA, USA, 1958. [Google Scholar]
- Wei, B.B.; Gao, Y.W.; Shi, Y.; Li, D.; Hao, L.S. Research on Sidewall interference Control in Airfoil Wind Tunnel Test Based on Vortex Generator. Adv. Aeronaut. Sci. Eng. 2021, 12, 38–51. (In Chinese) [Google Scholar] [CrossRef]
- Gao, L.Y.; Zhang, H.; Liu, Y.Q.; Han, S. Effects of Vortex Generators on a Blunt Trailing-Edge Airfoil for Wind Turbines. Renew. Energy 2015, 76, 303–311. [Google Scholar] [CrossRef]
- Standish, K.J.; Van Dam, C.P. Aerodynamic Analysis of Blunt Trailing Edge Airfoils. J. Sol. Energy Eng. 2003, 125, 479–487. [Google Scholar] [CrossRef]
- Xu, H.Y.; Qiao, C.L.; Yang, H.Q.; Ye, Z.Y. Delayed Detached Eddy Simulation of the Wind Turbine Airfoil S809 for Angles of Attack up to 90 Degrees. Energy 2017, 118, 1090–1109. [Google Scholar] [CrossRef]
- Launder, B.E.; Reece, G.J.; Rodi, W. Progress in the Development of a Reynolds-Stress Turbulence Closure. J. Fluid Mech. 1975, 68, 537–566. [Google Scholar] [CrossRef]
- Launder, B.E. Second-Moment Closure: Present… and Future? Int. J. Heat Fluid Flow 1989, 10, 282–300. [Google Scholar] [CrossRef]
- Liu, H.; Wang, Y.; Yan, R.; Xu, P.; Wang, Q. Influence of the Modification of Asymmetric Trailing-edge Thickness on the Aerodynamic Performance of a Wind Turbine Airfoil. Renew. Energy 2020, 147, 1623–1631. [Google Scholar] [CrossRef]
Figure 1.
The profile of the NWT600 airfoil.
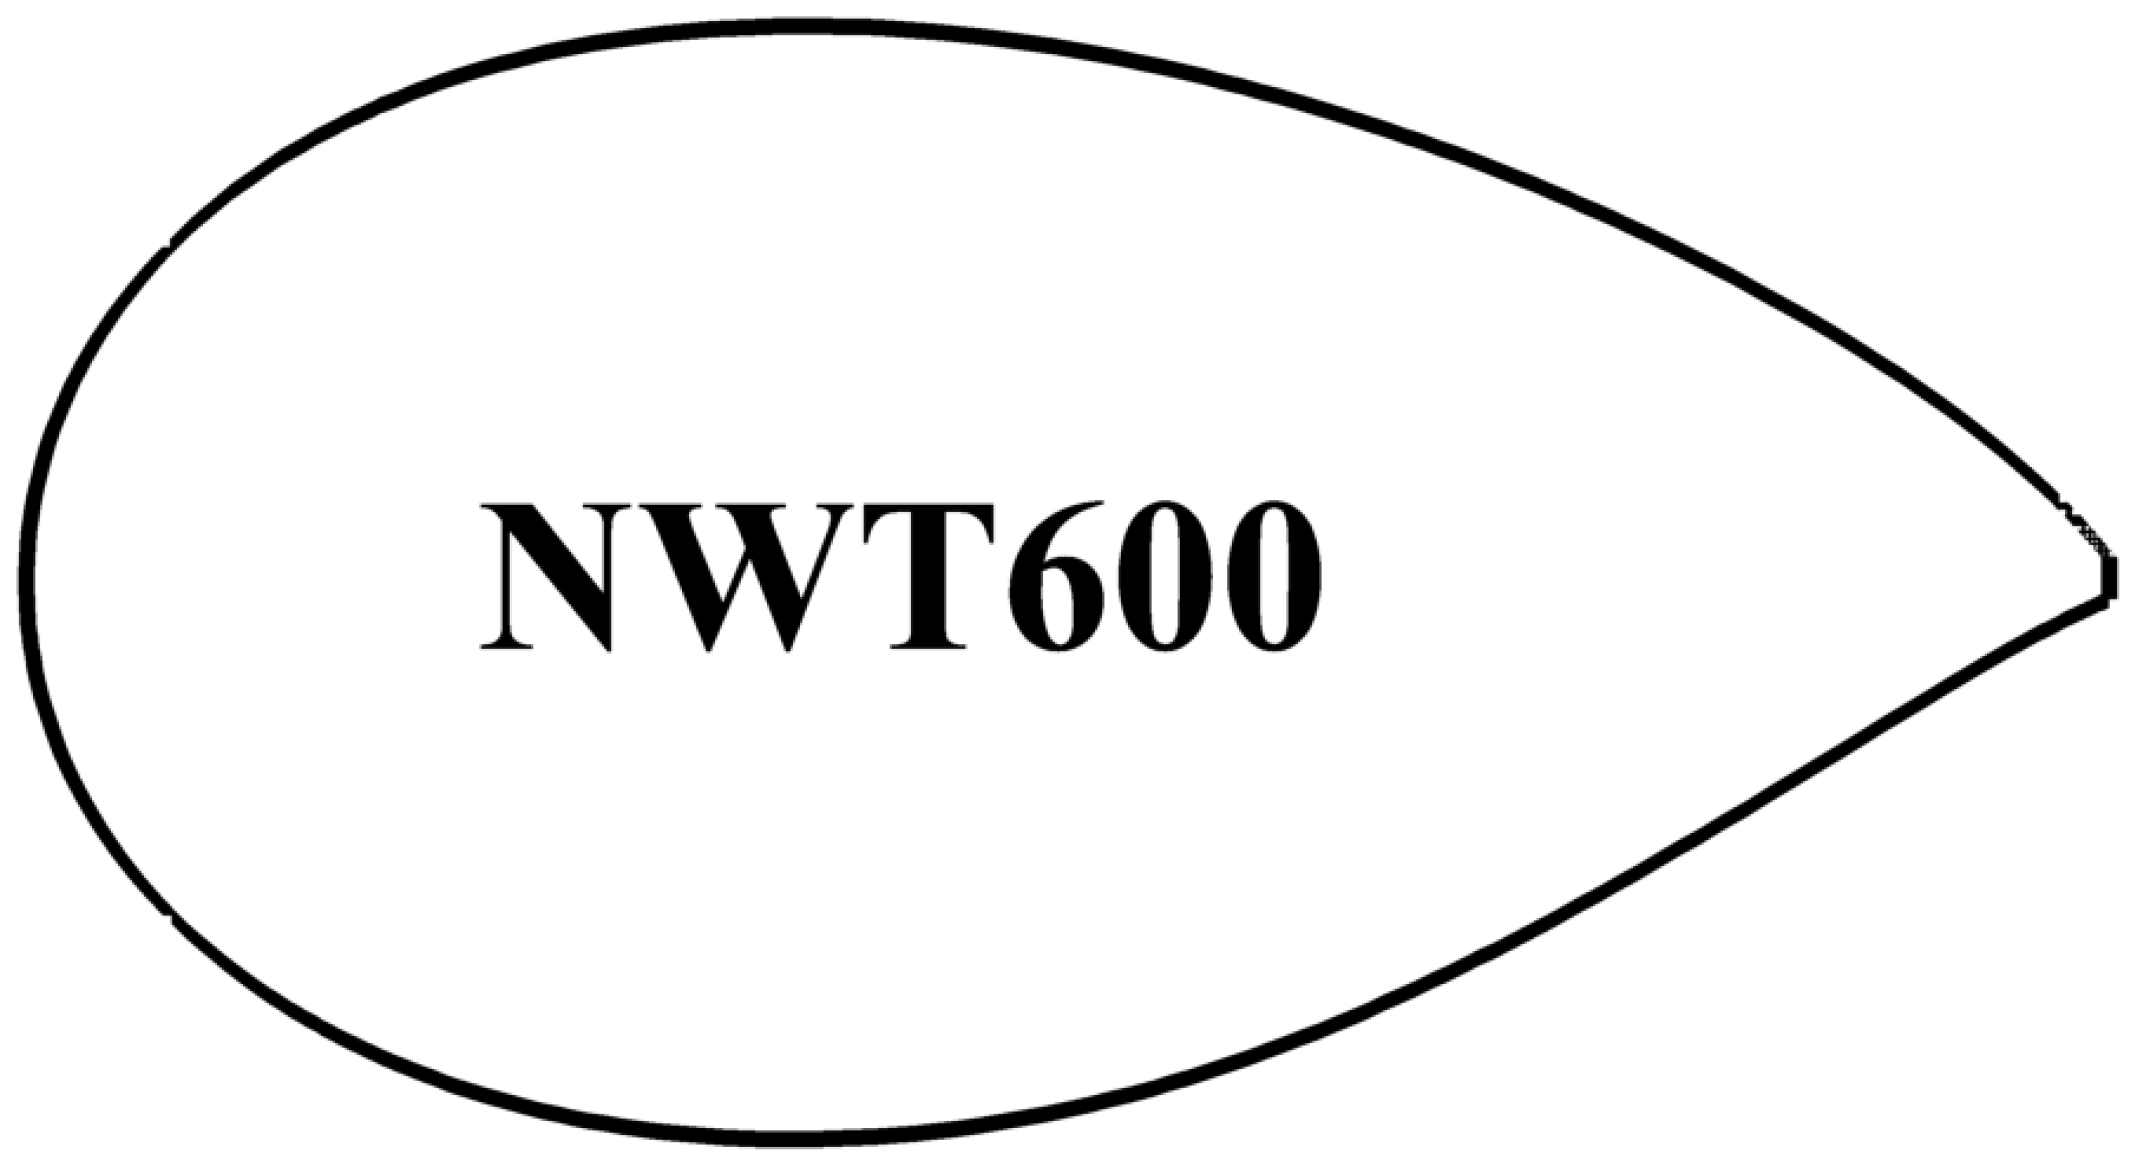
Figure 2.
The distribution of pressure taps on the NWT600 airfoil.
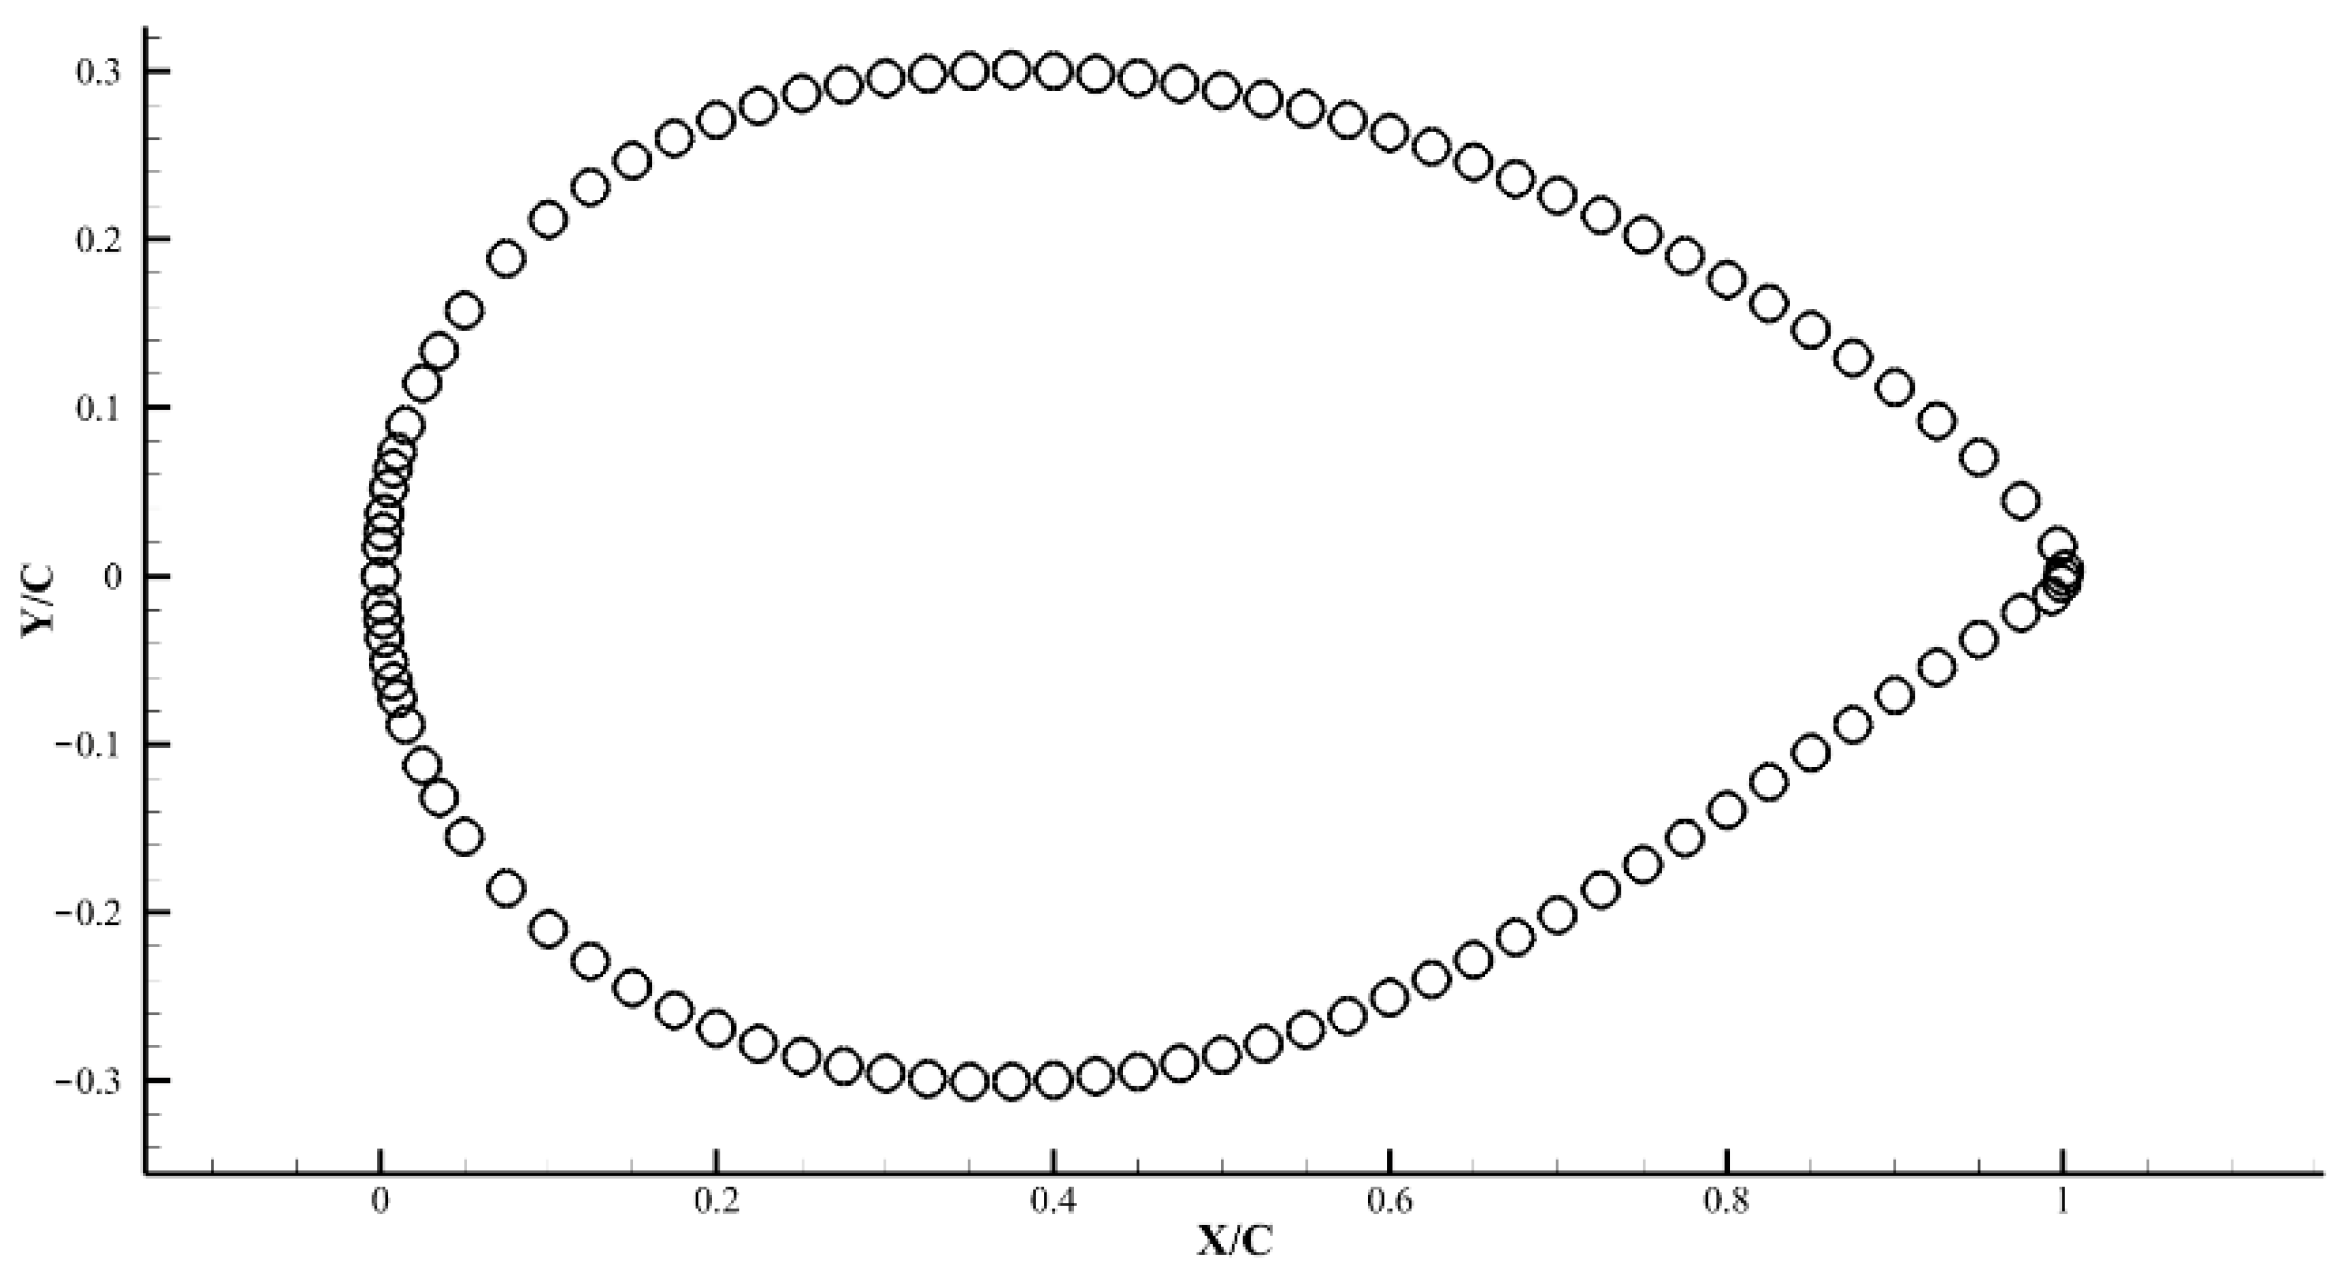
Figure 3.
Total pressure measuring rake (wake rake).

Figure 4.
Zig-Zag tape geometry.

Figure 5.
Schematic diagram of the boundary conditions and the grid.
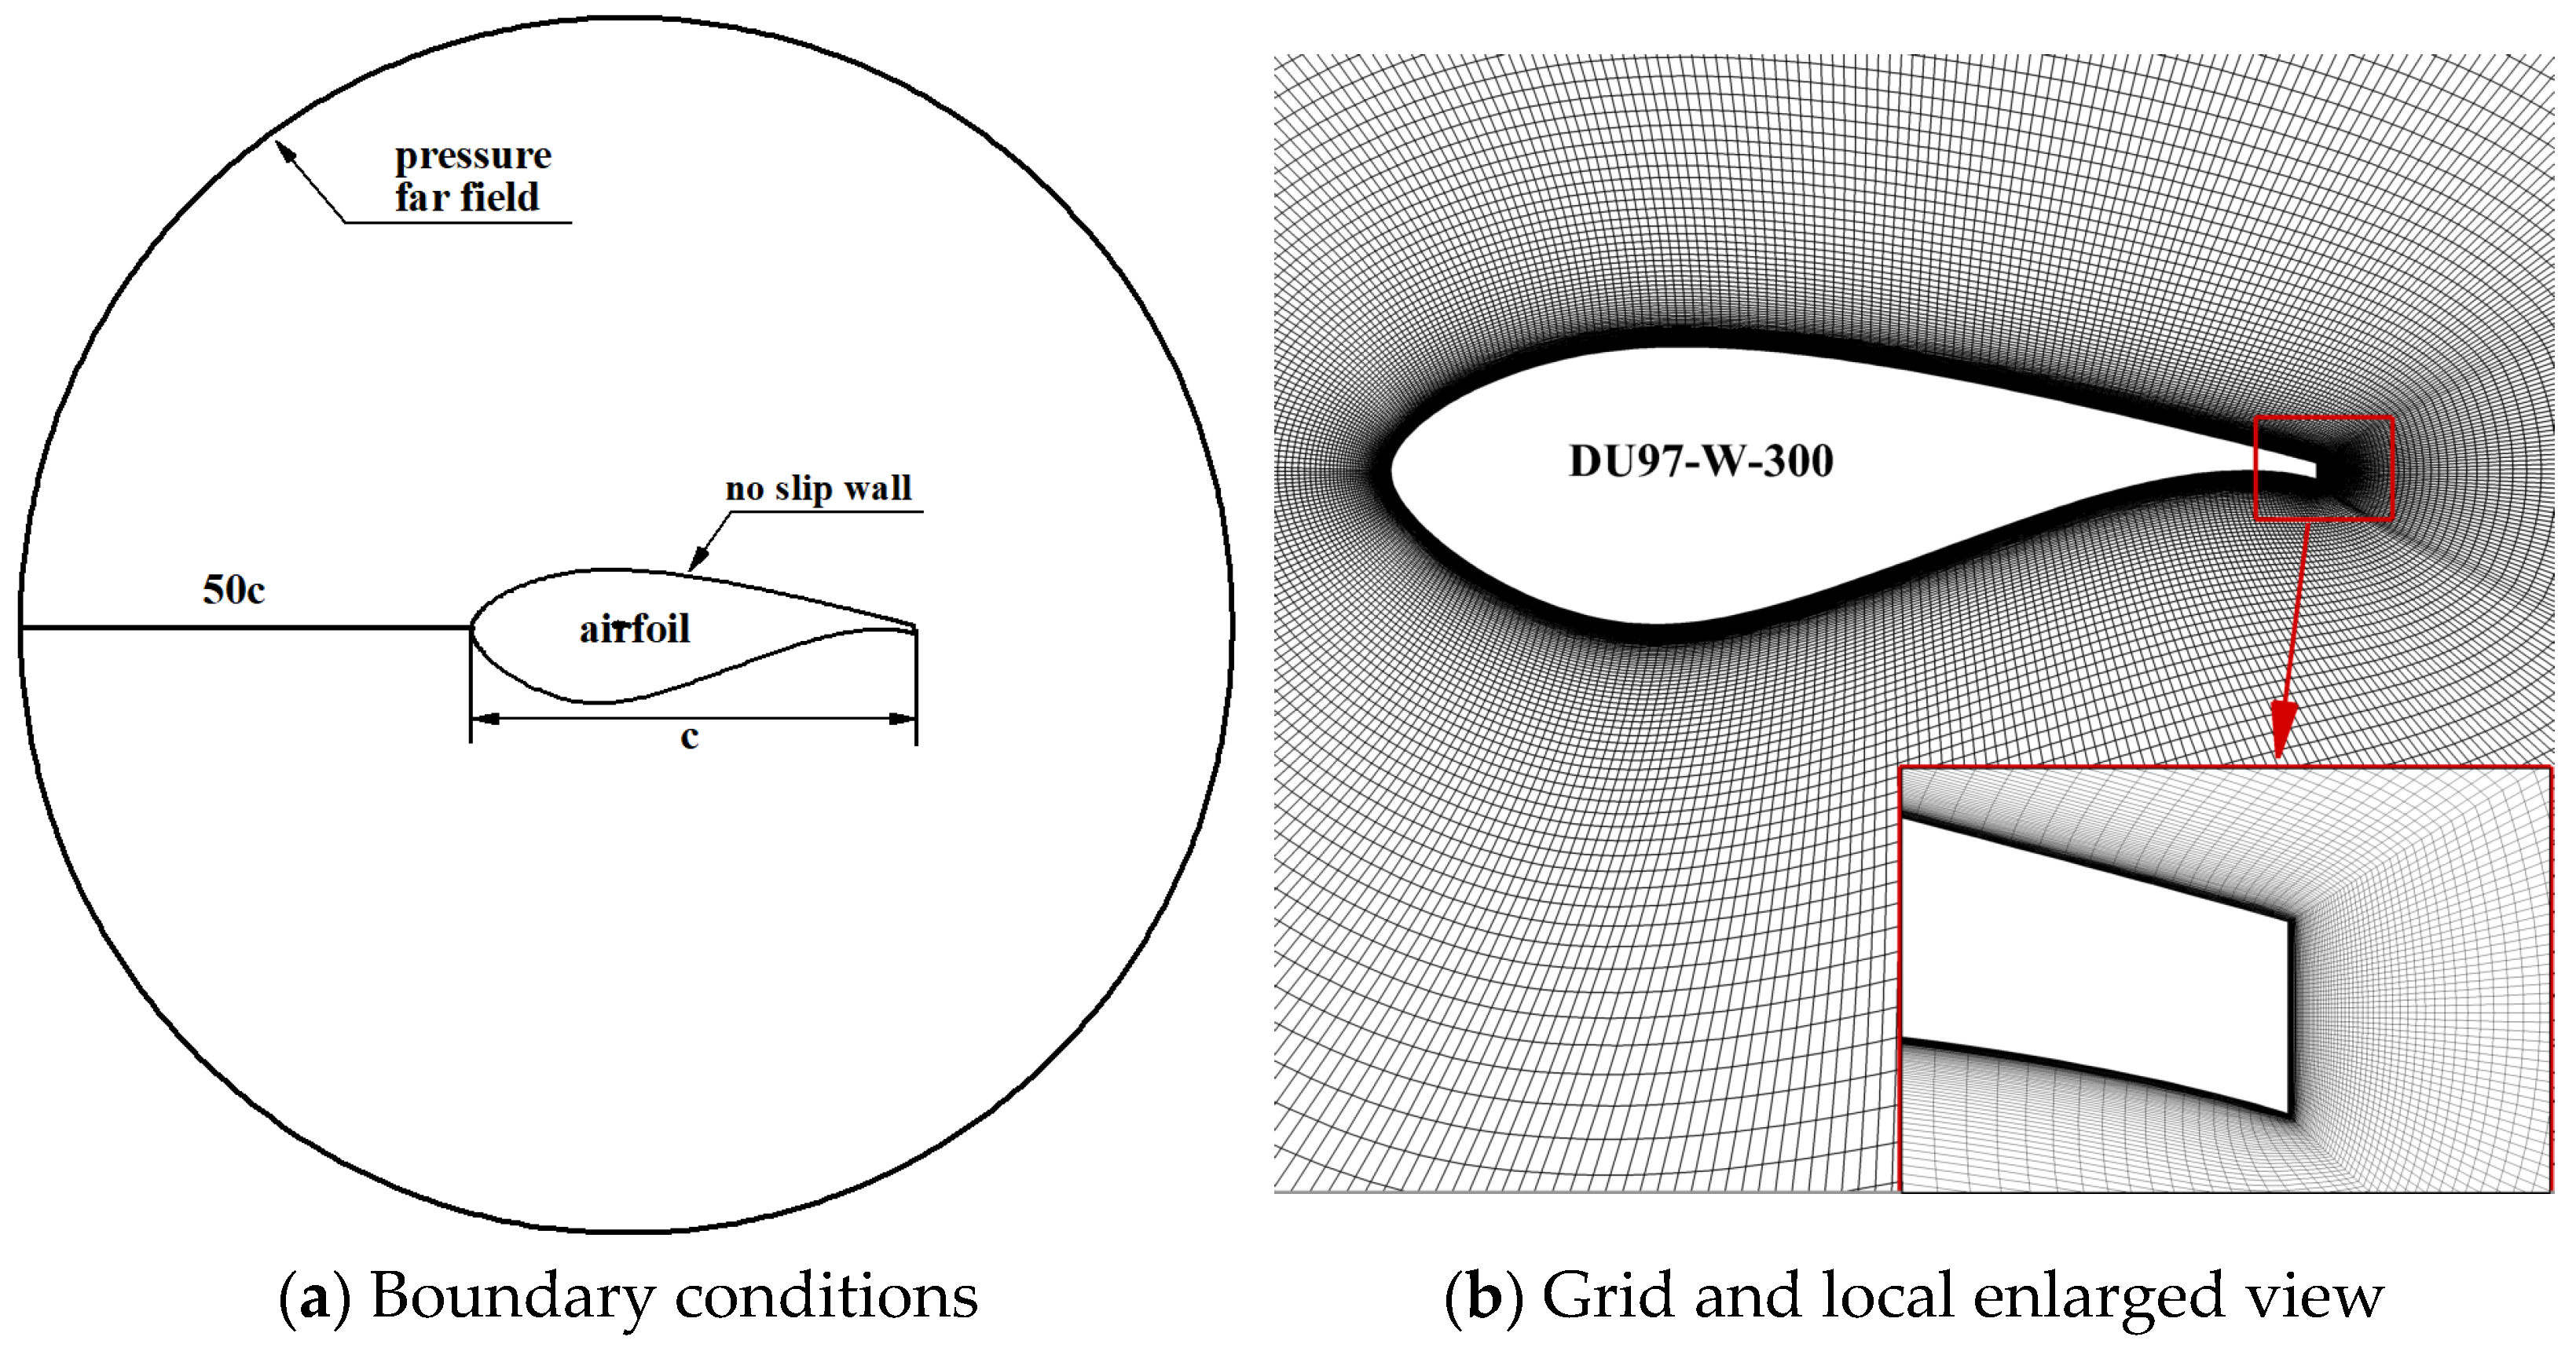
Figure 6.
Curves of lift coefficient and drag coefficient.
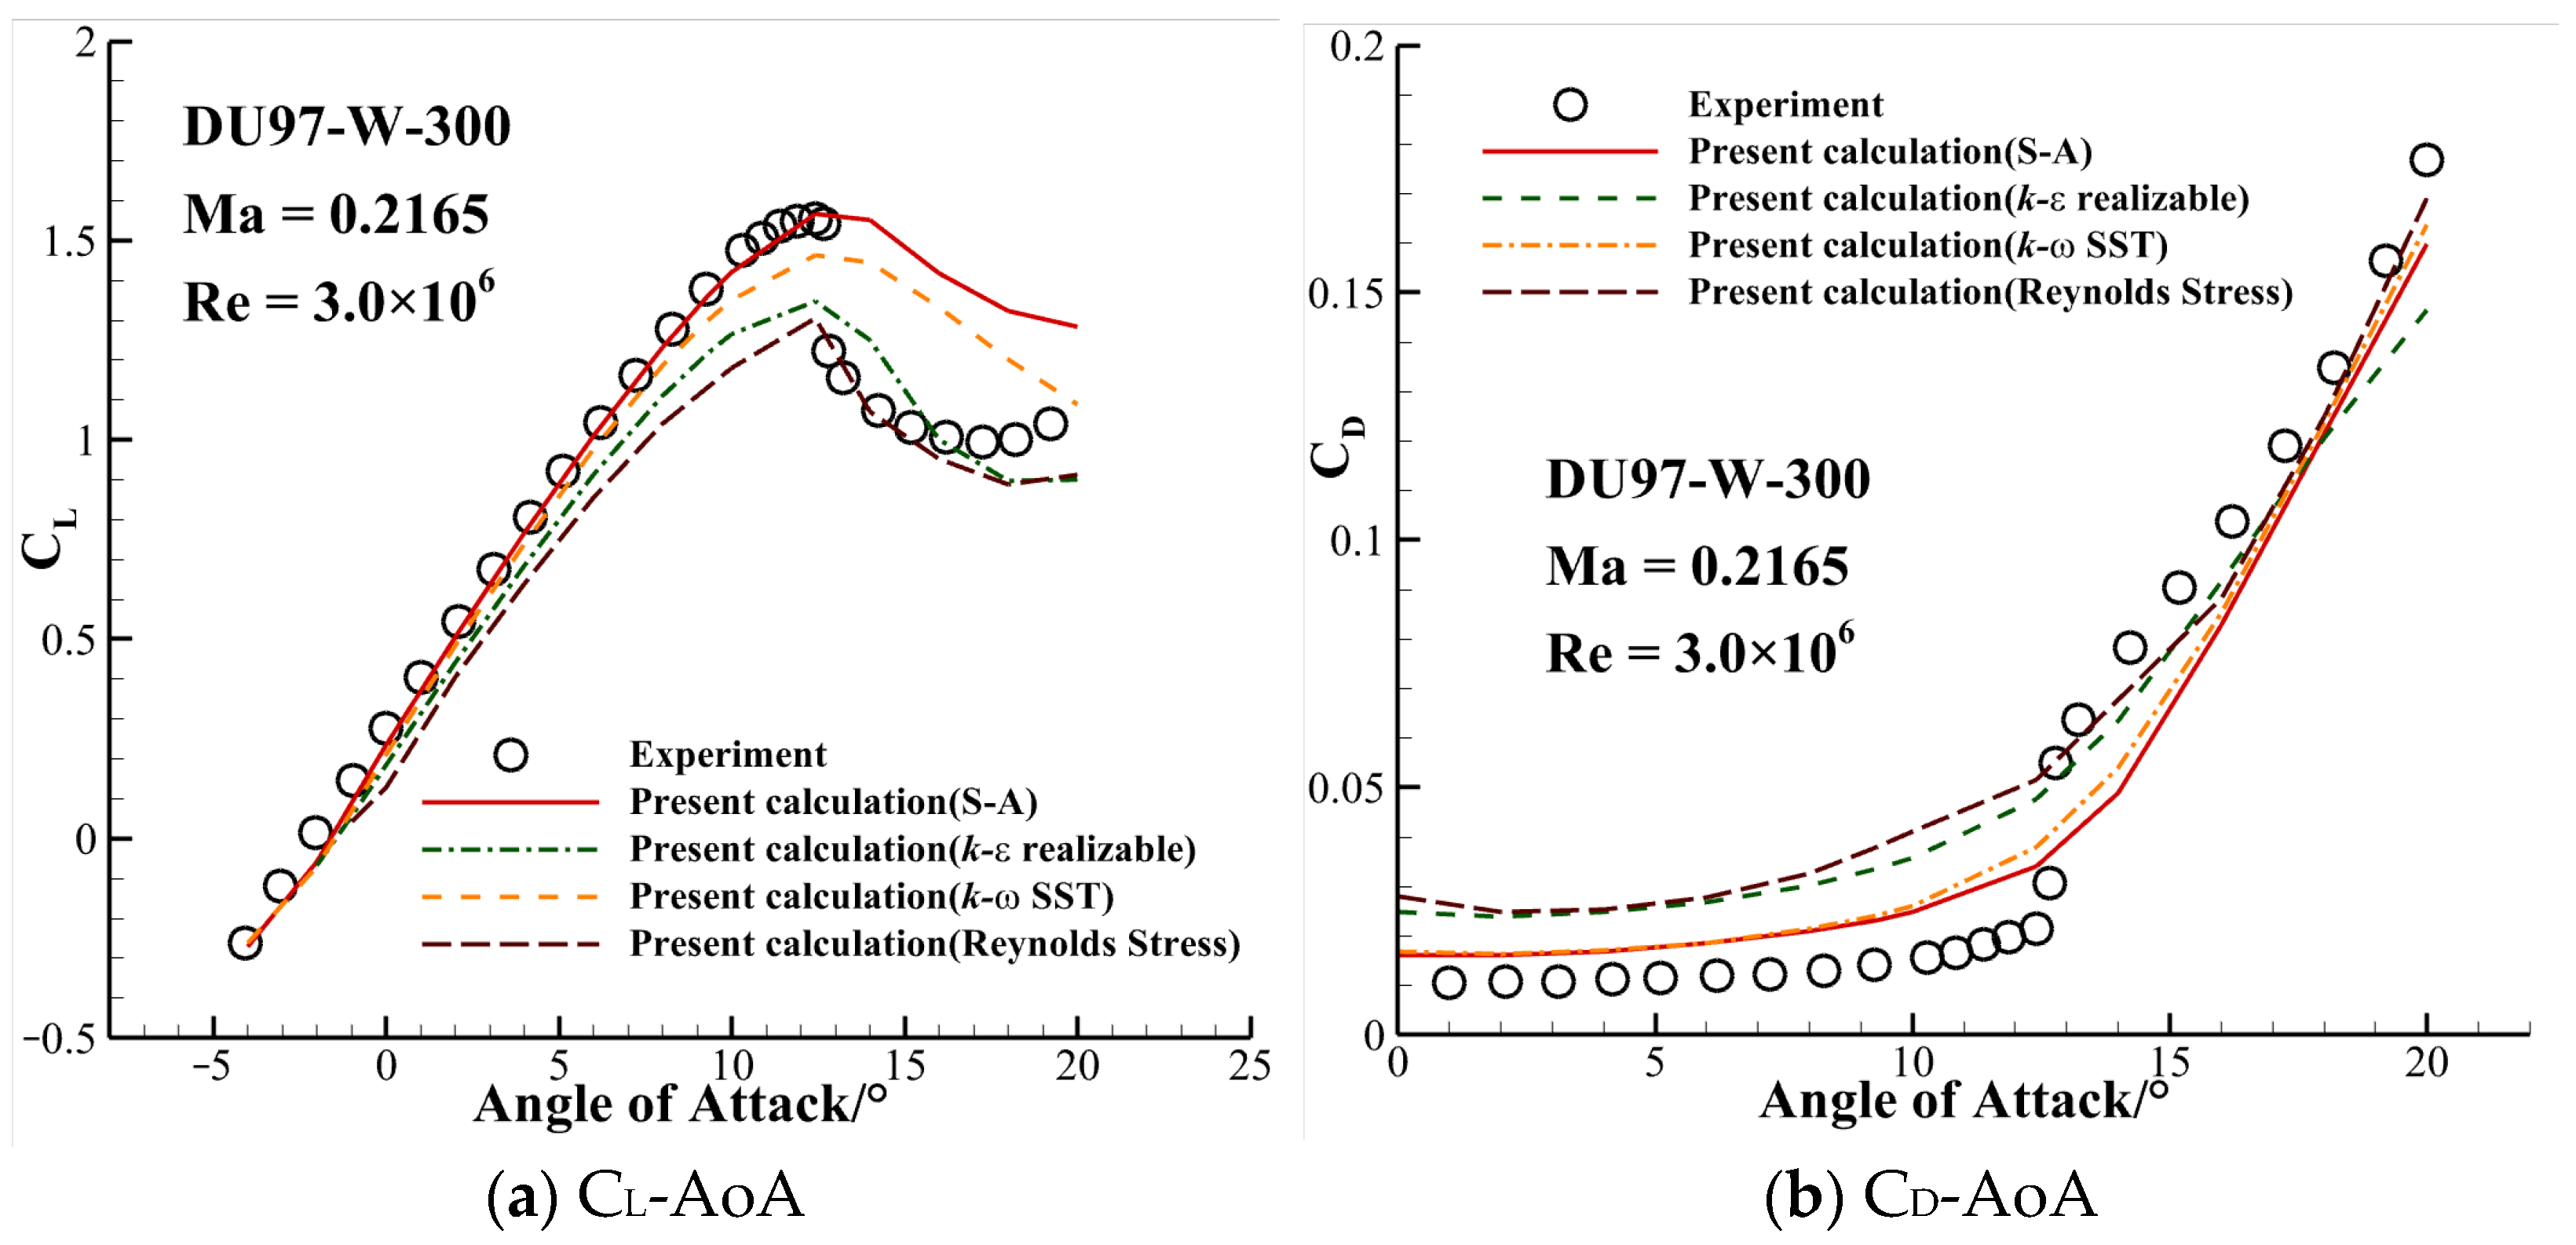
Figure 7.
Comparison of CP distribution between experimental data and simulation results.
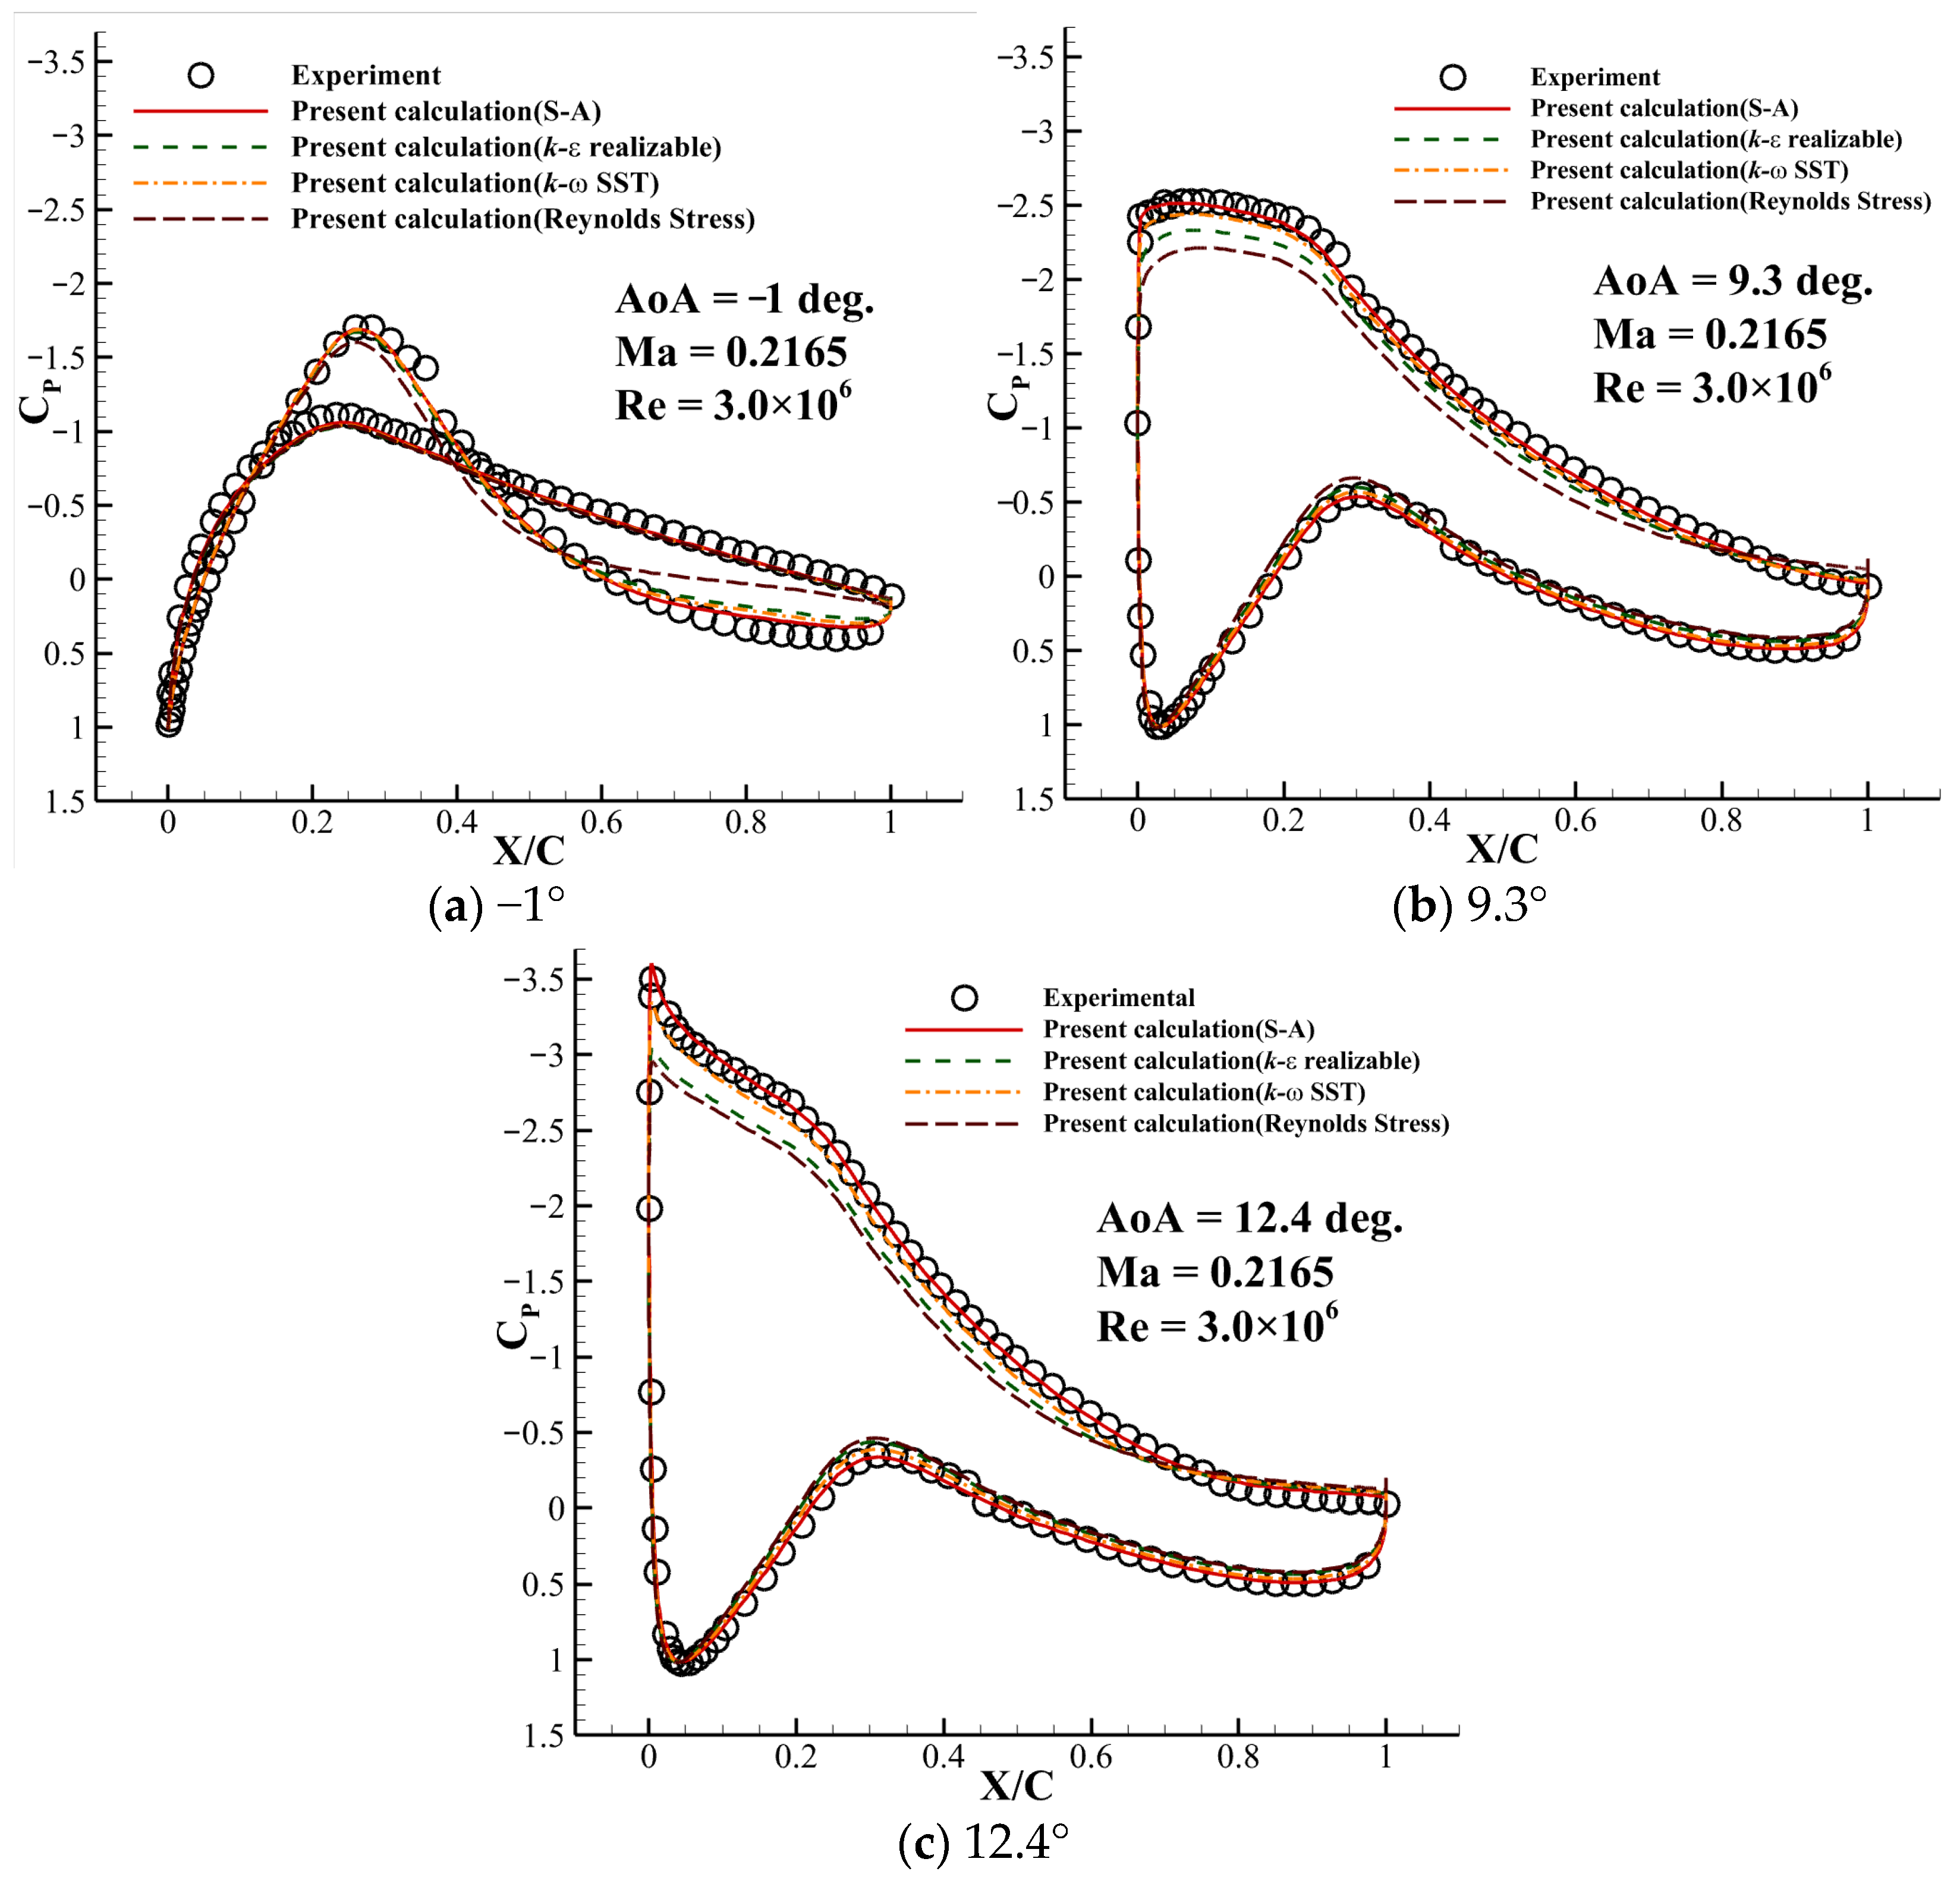
Figure 8.
Experimental data of the NWT600 airfoil.

Figure 9.
Curves of CL, CD, CM, and L/D of the NWT600 airfoil.
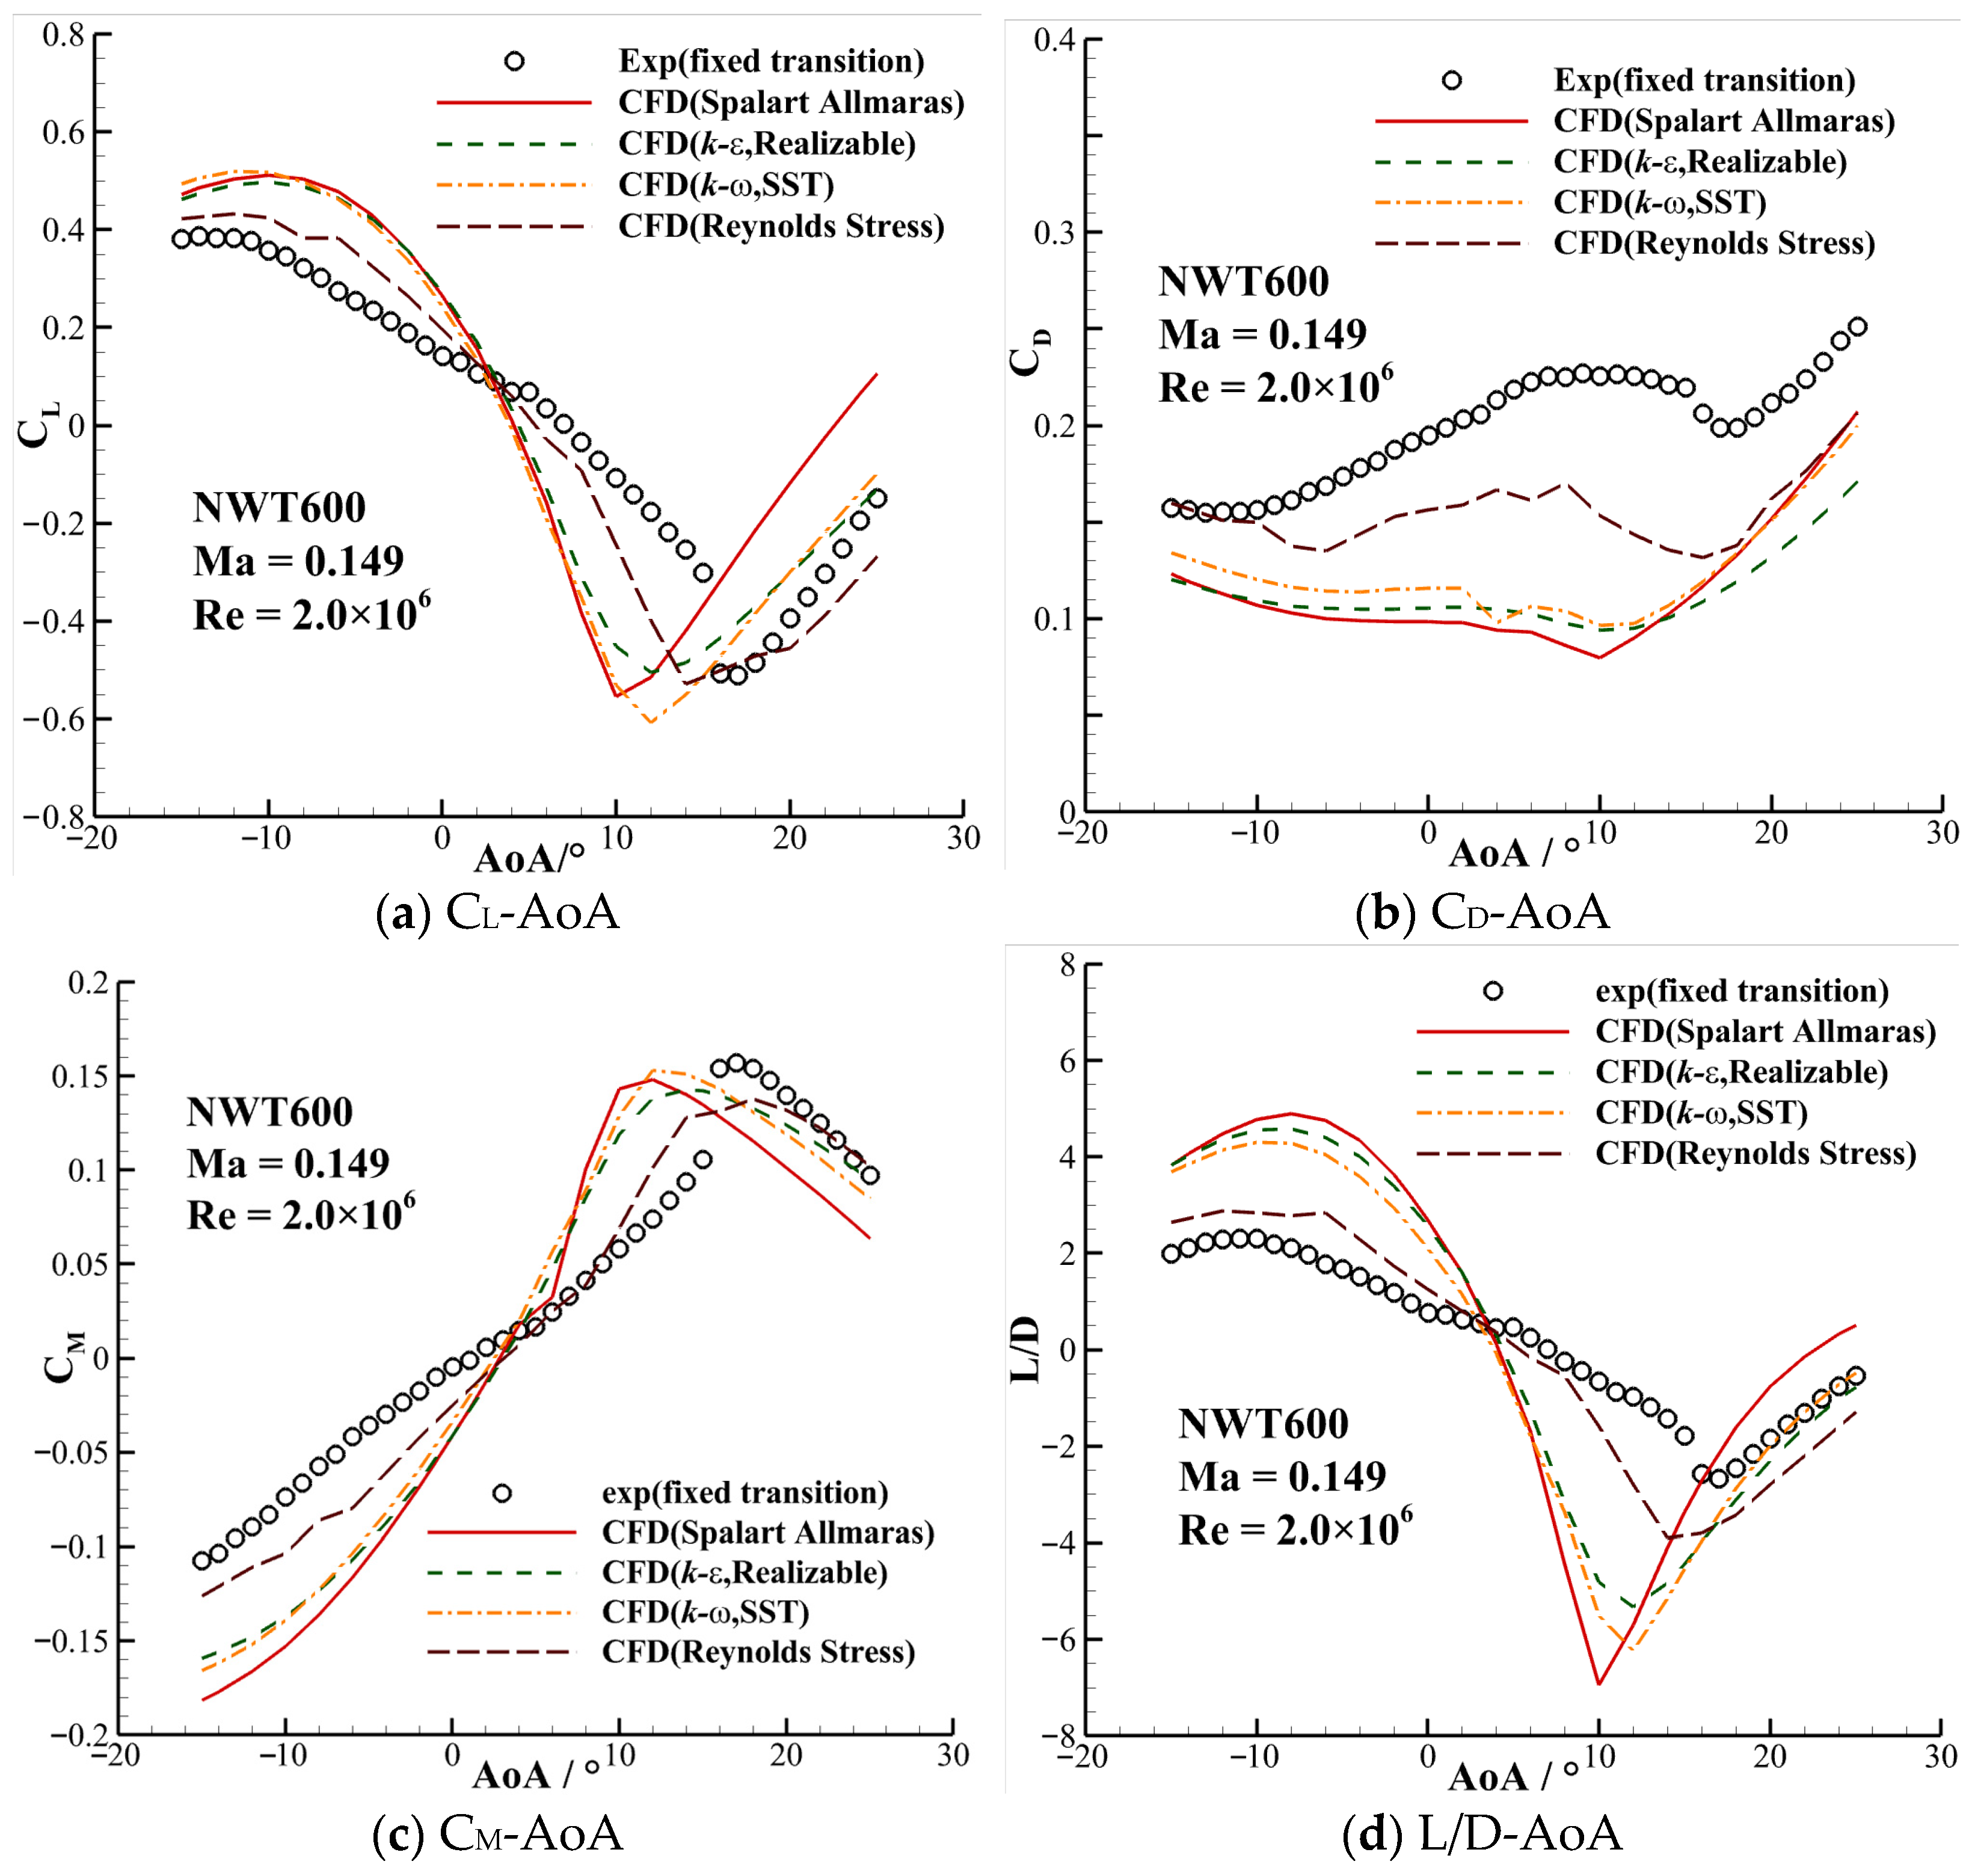
Figure 10.
Flow fields of the NWT600 airfoil with different AoAs (simulated by k-ω SST).
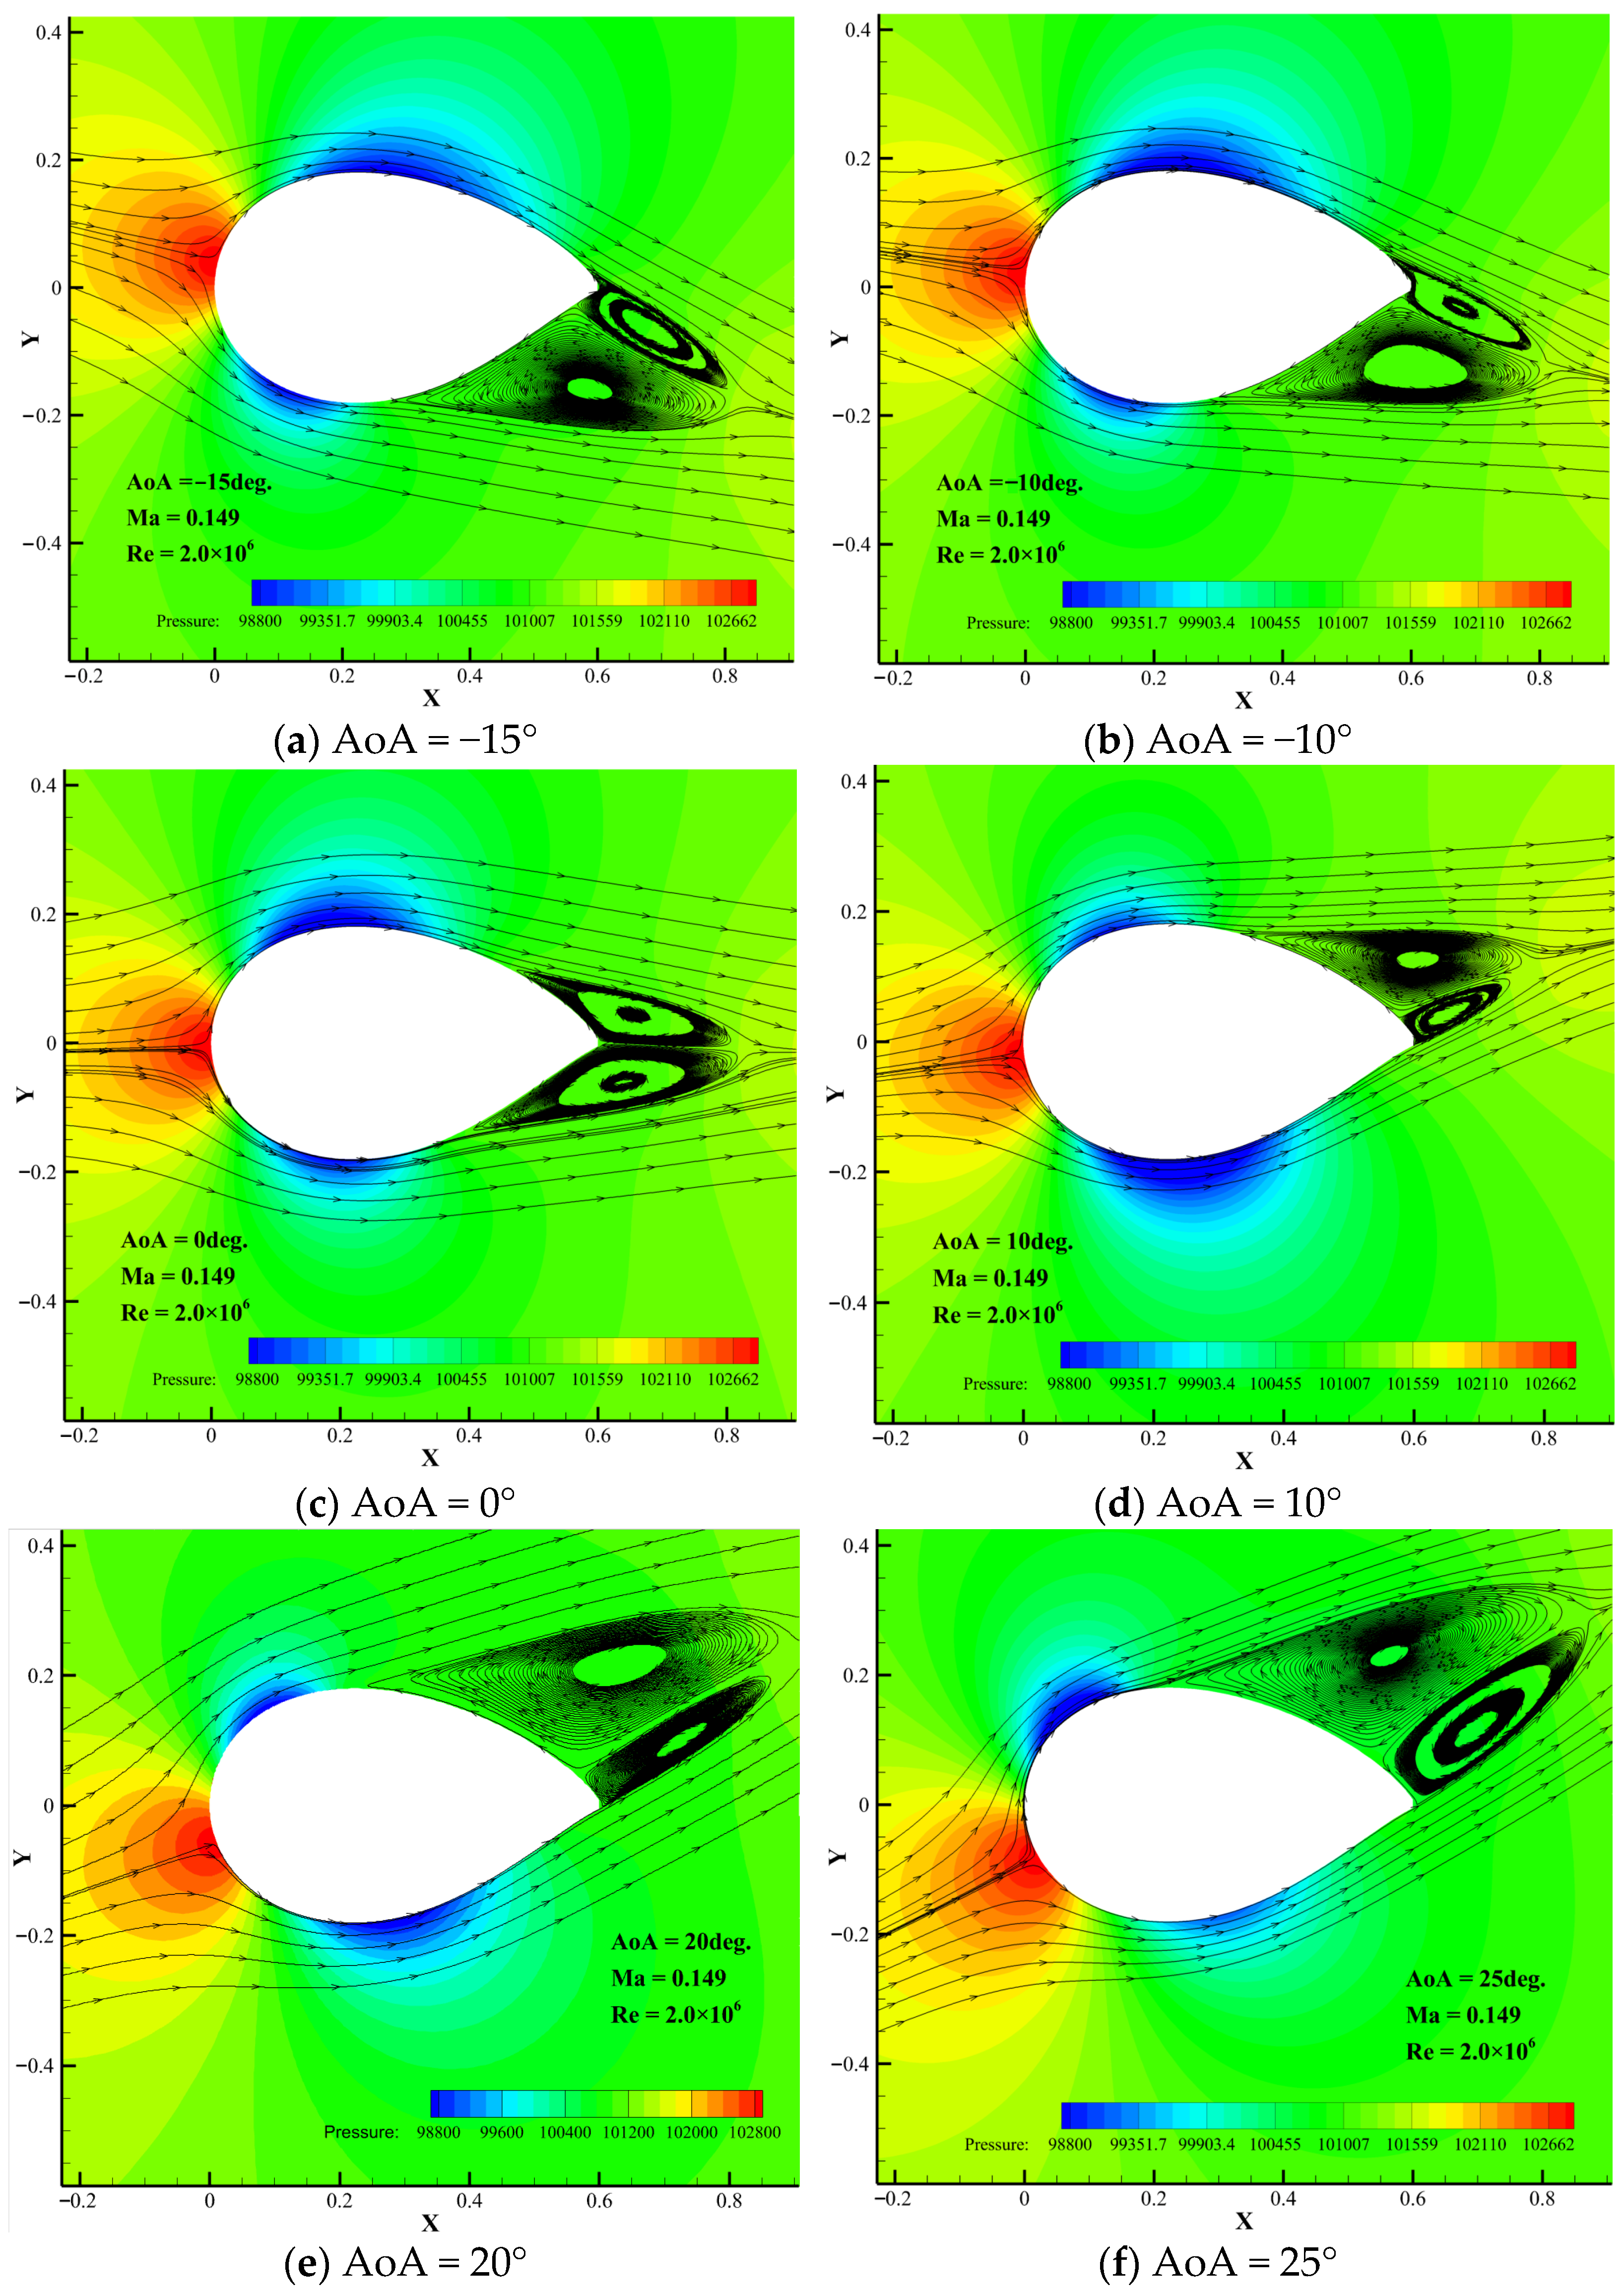
Figure 11.
CP distribution at different AoAs.
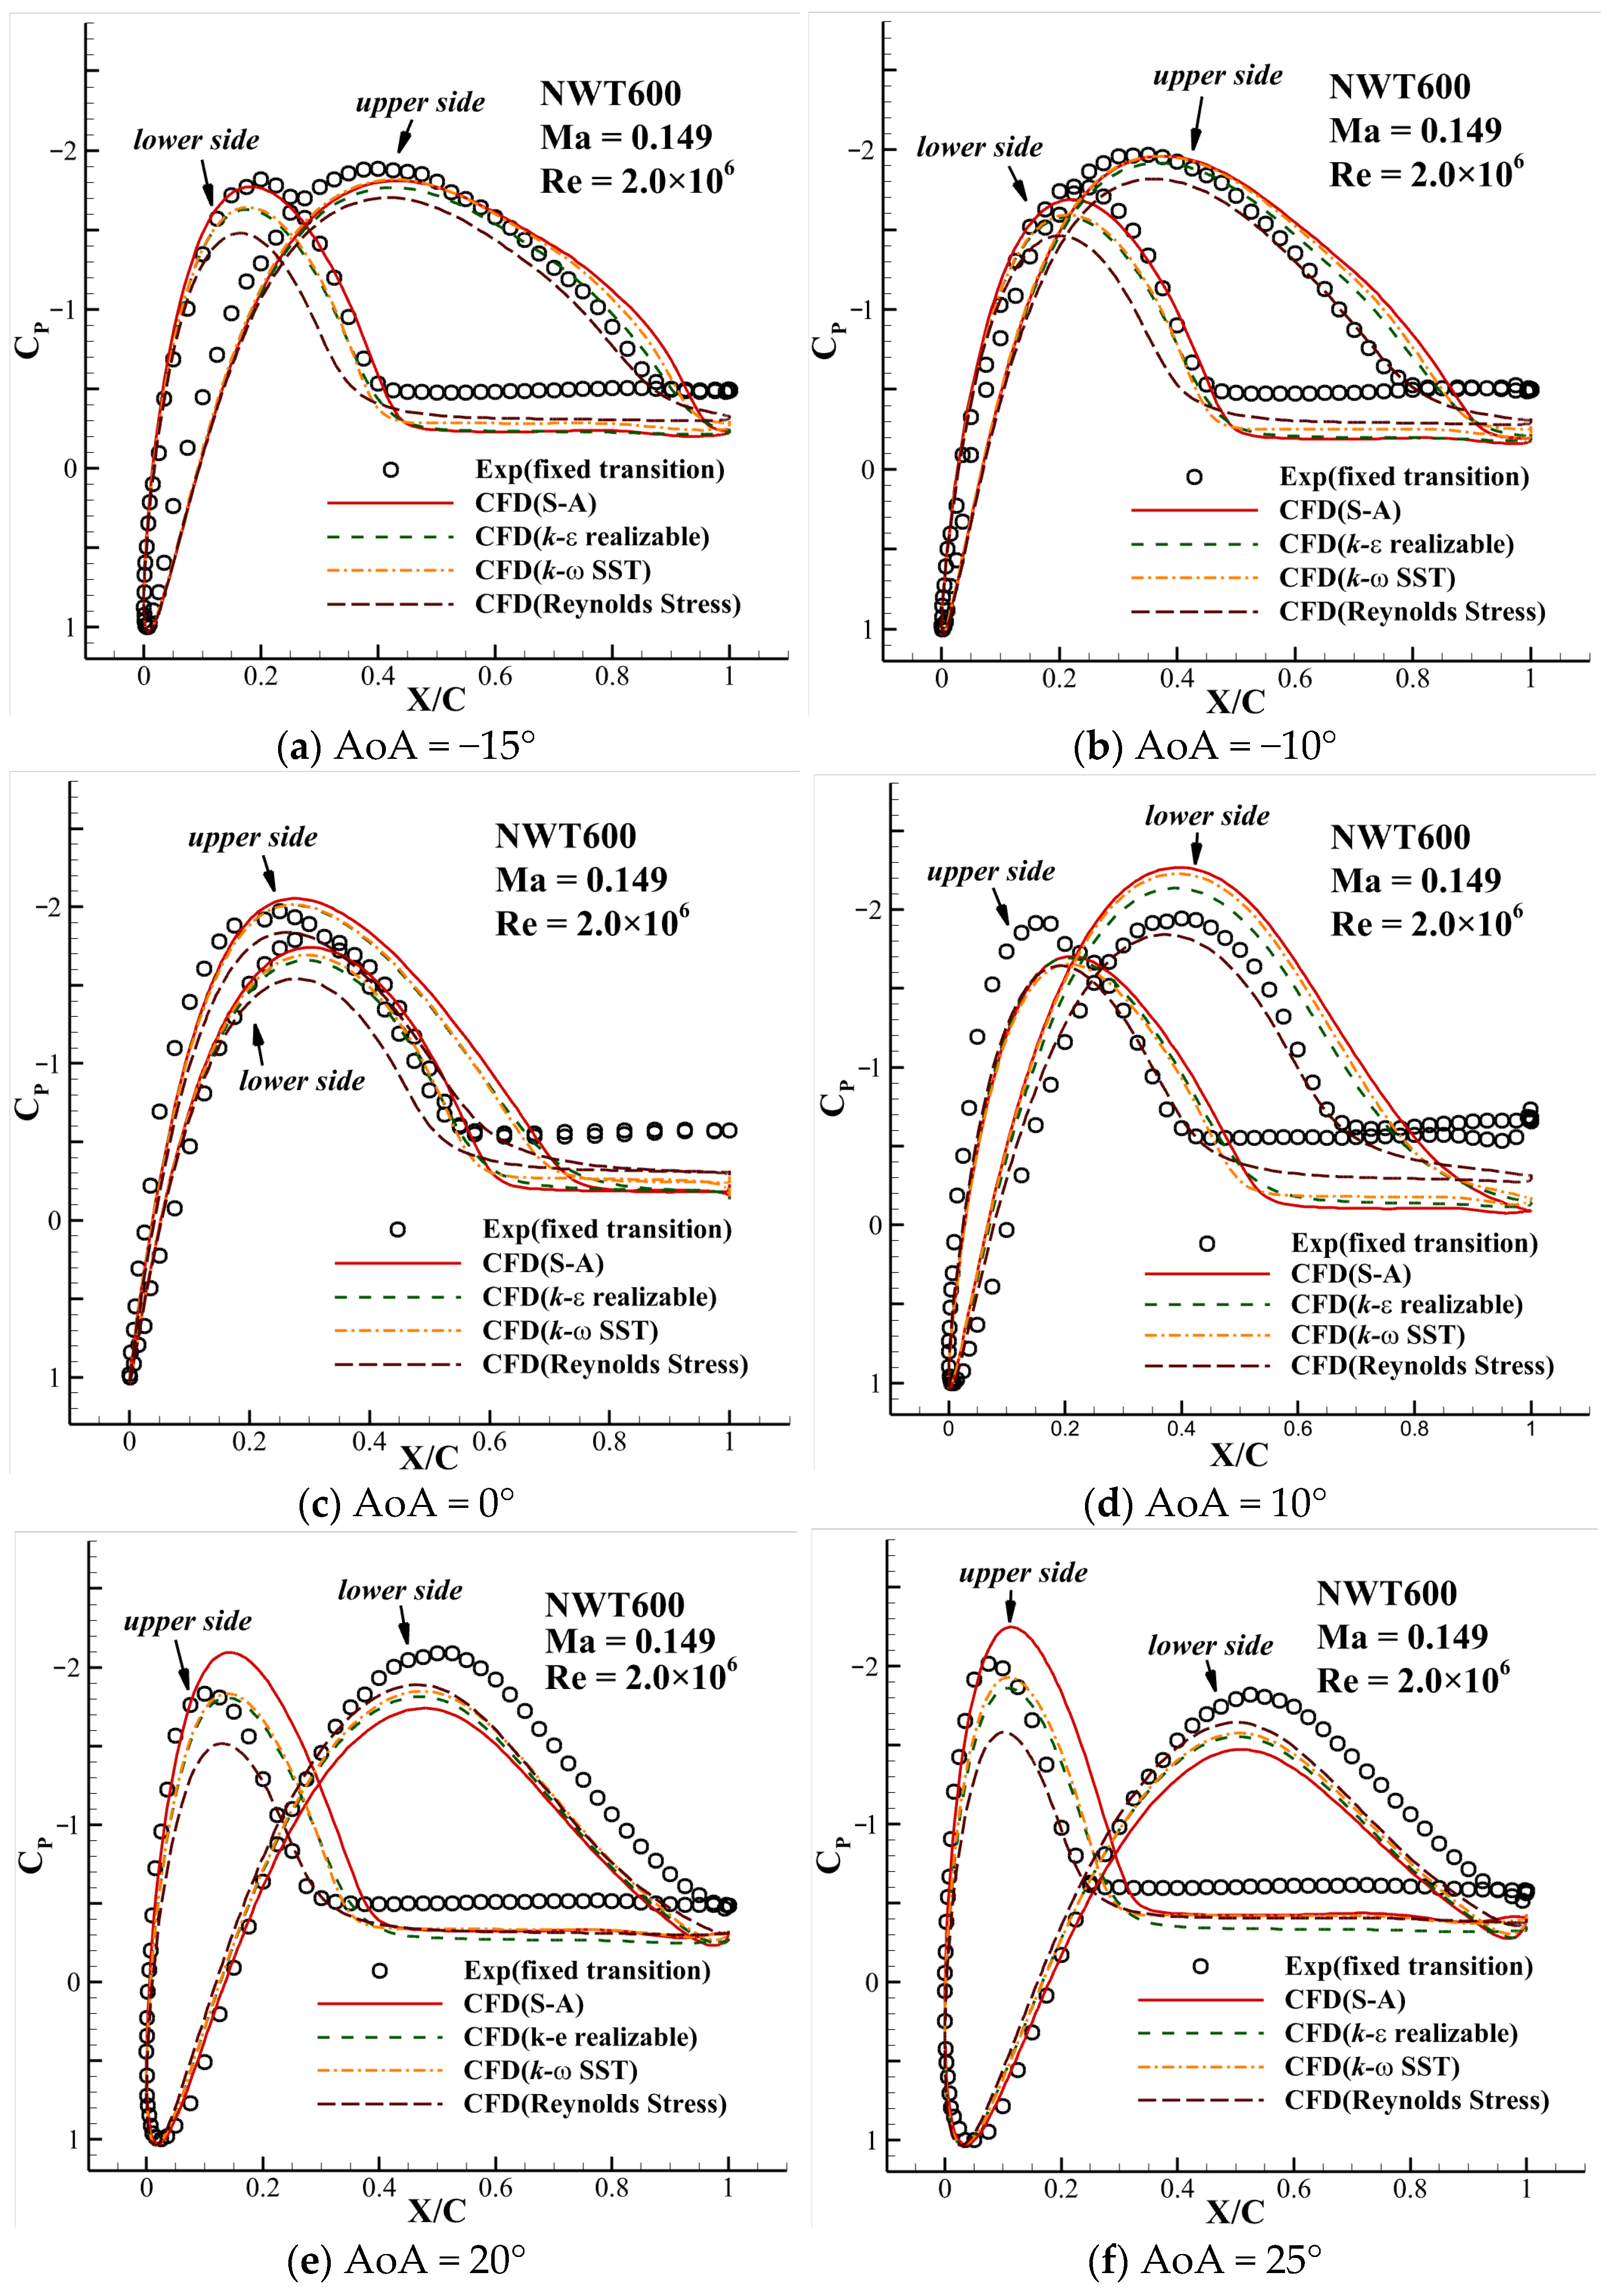
Figure 12.
Airfoils with different trailing-edge thicknesses.
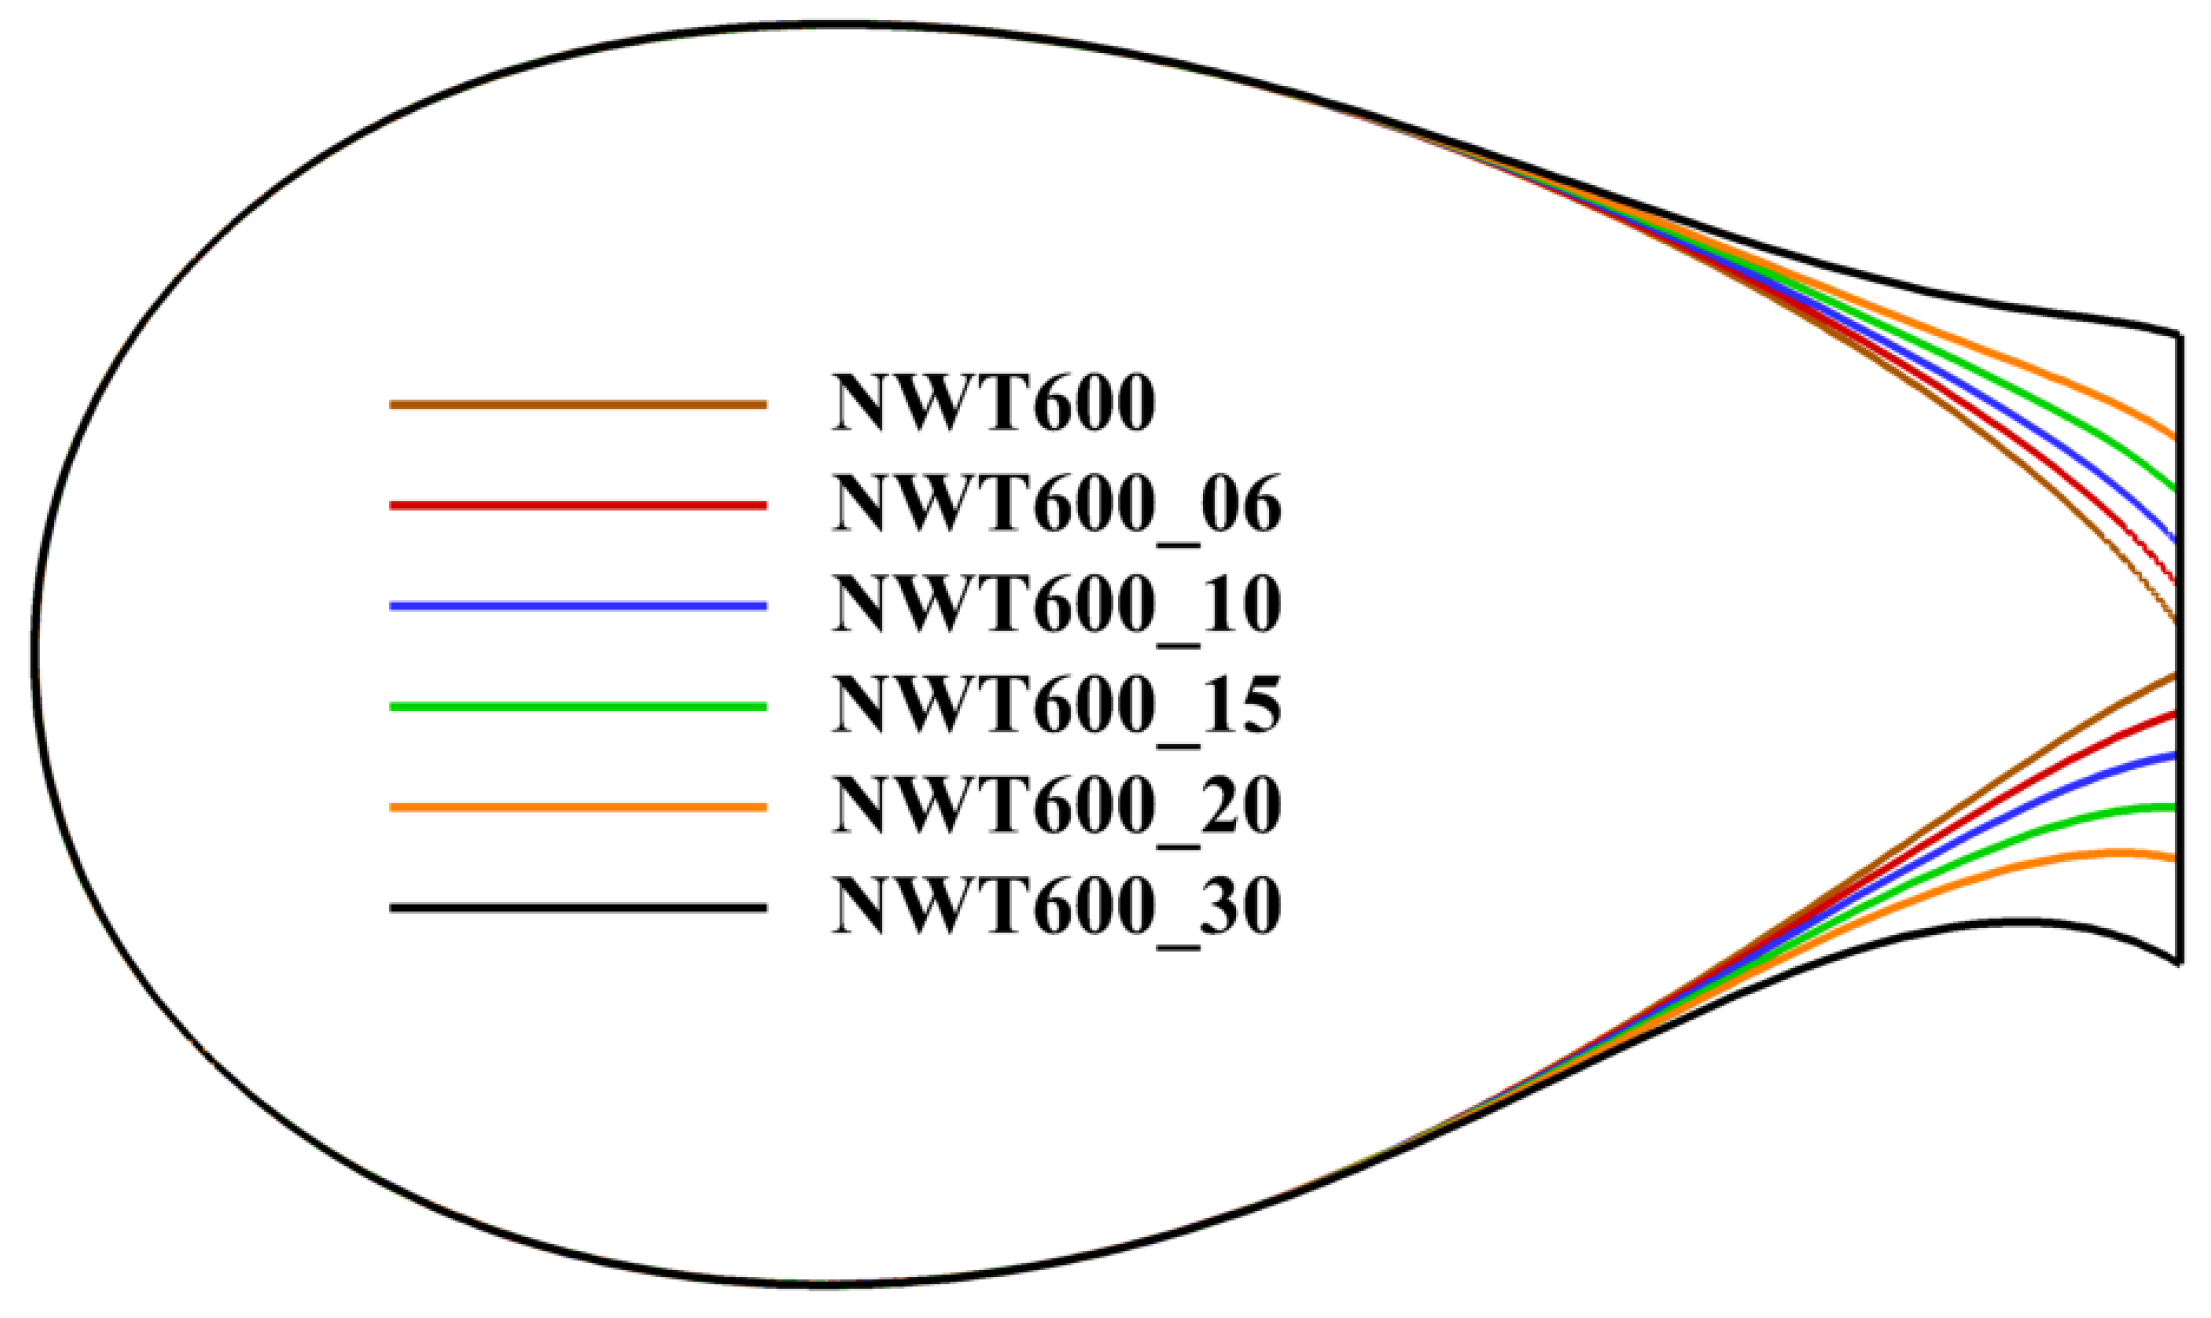
Figure 13.
Force coefficient curves (simulated by the k-ω SST model).
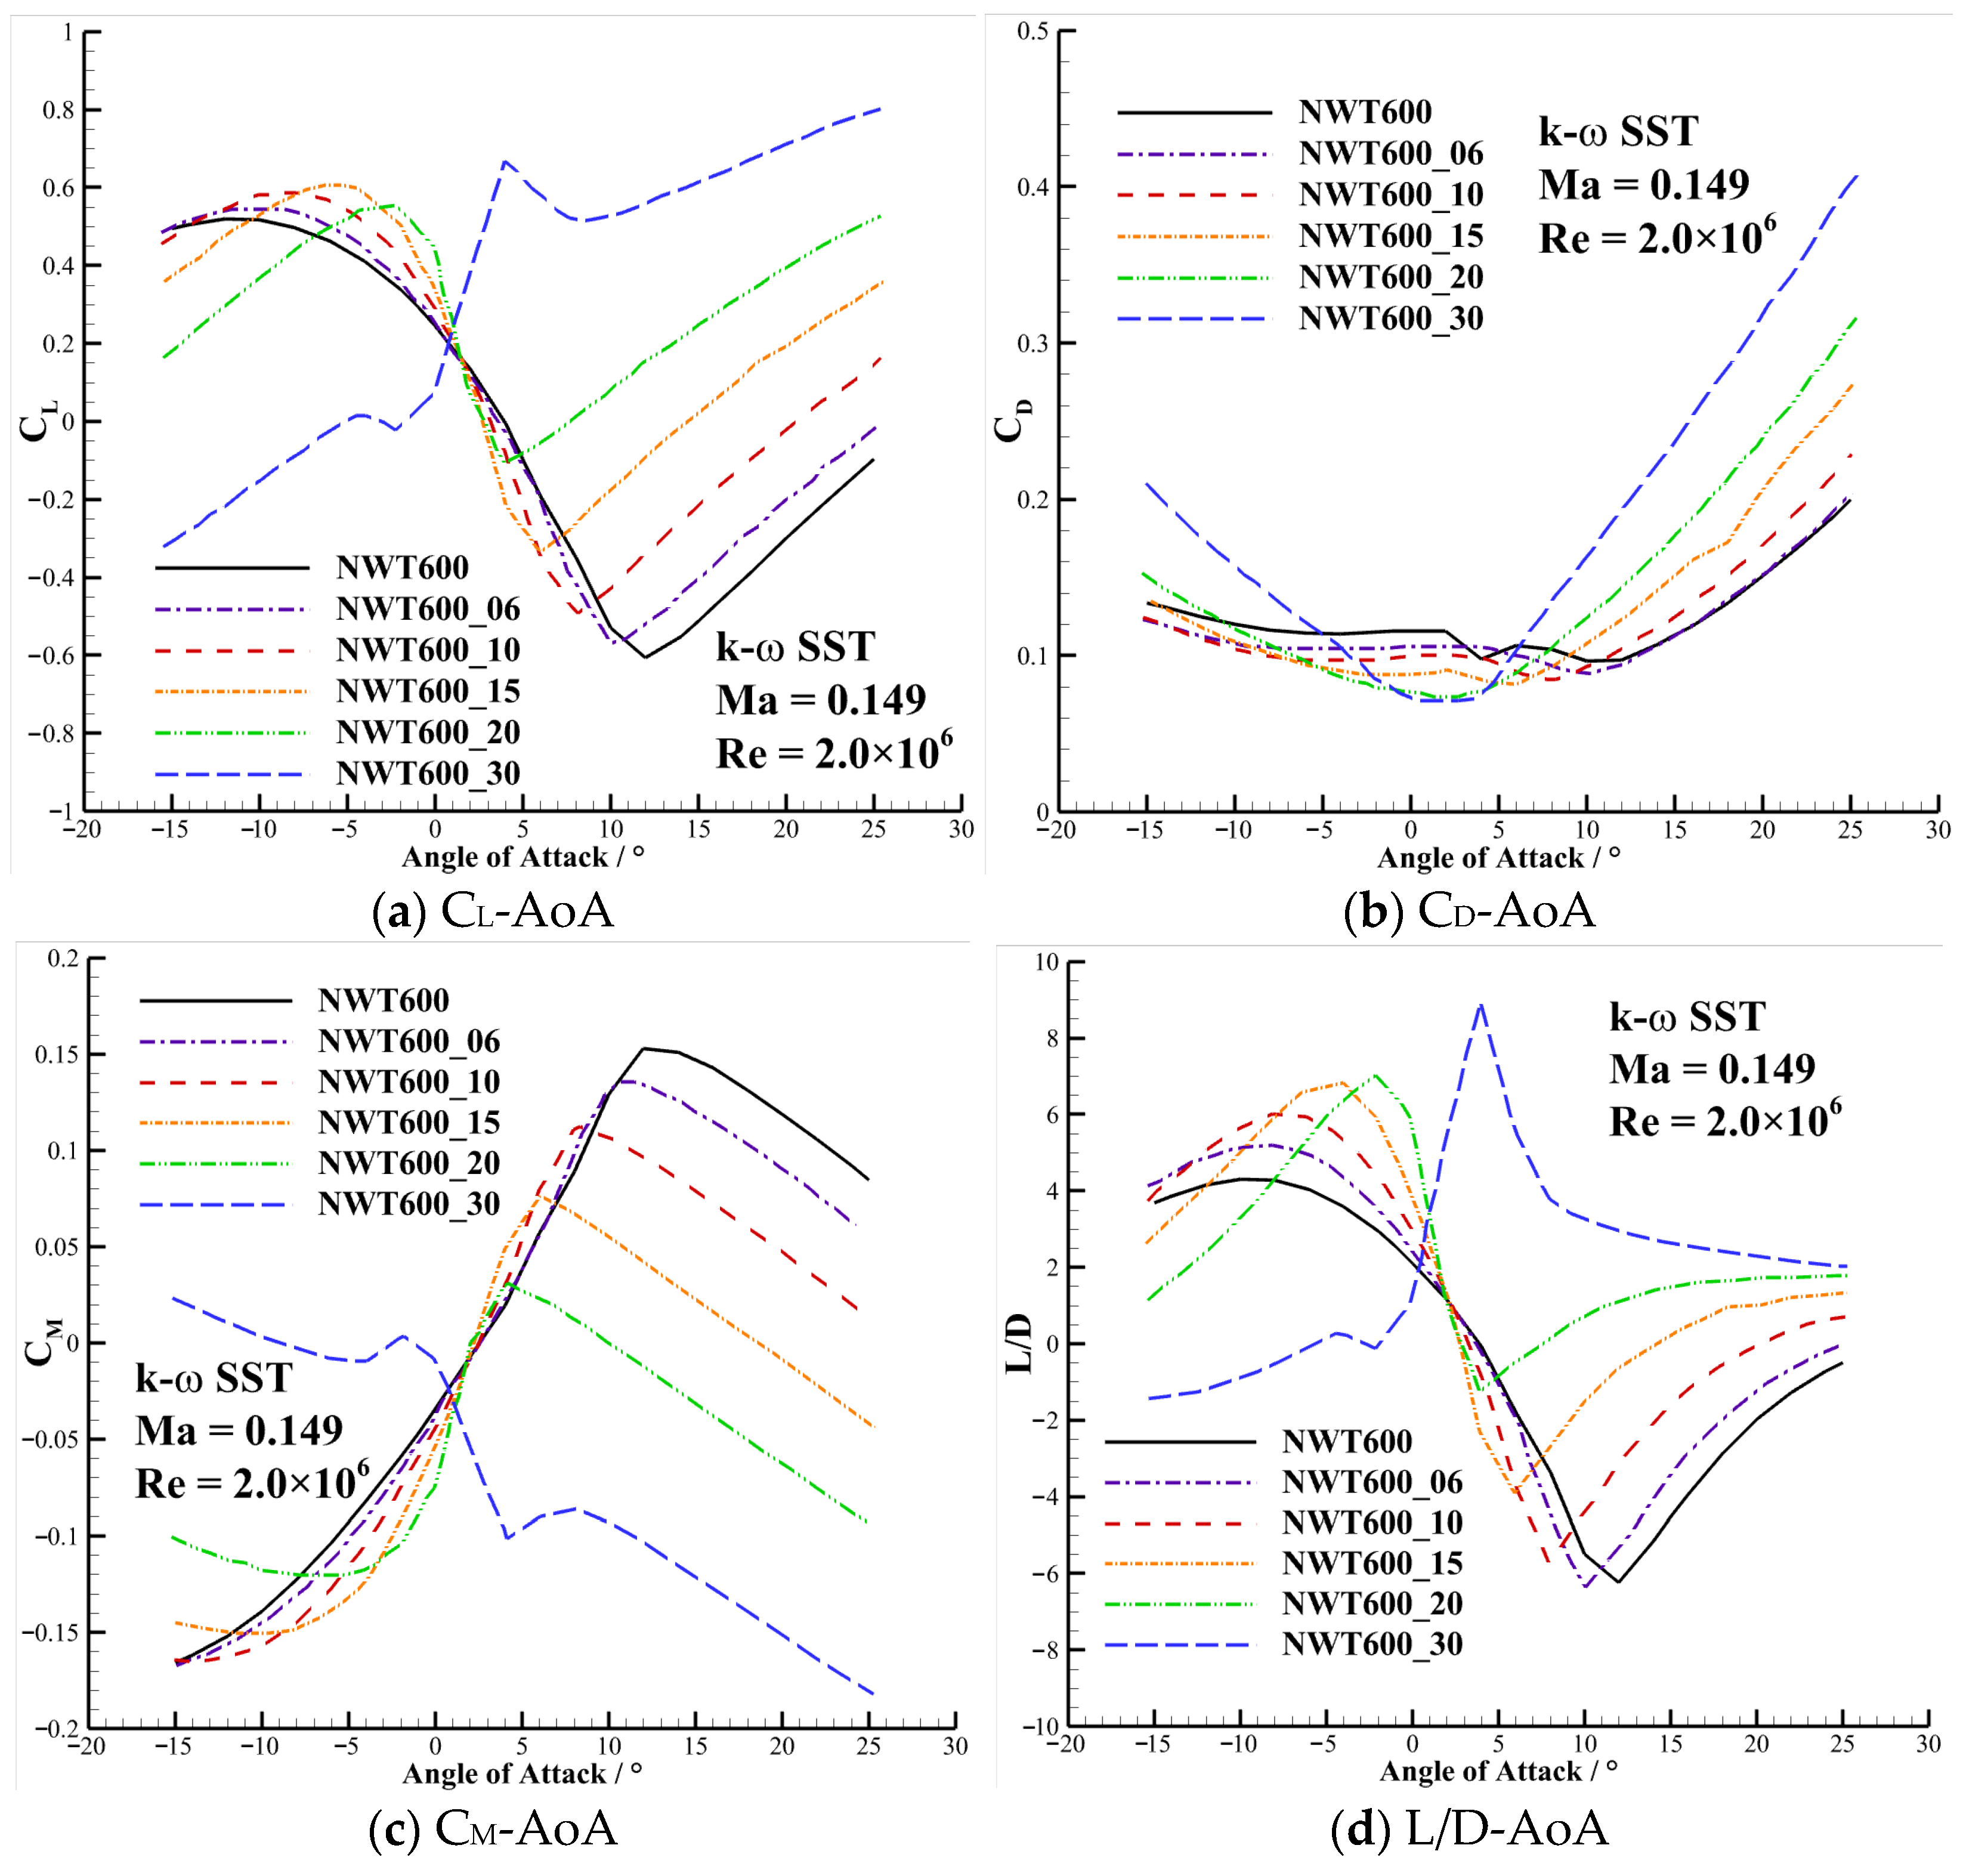
Figure 14.
Flow fields of the NWT600_30 airfoil (simulated by k-ω SST model).
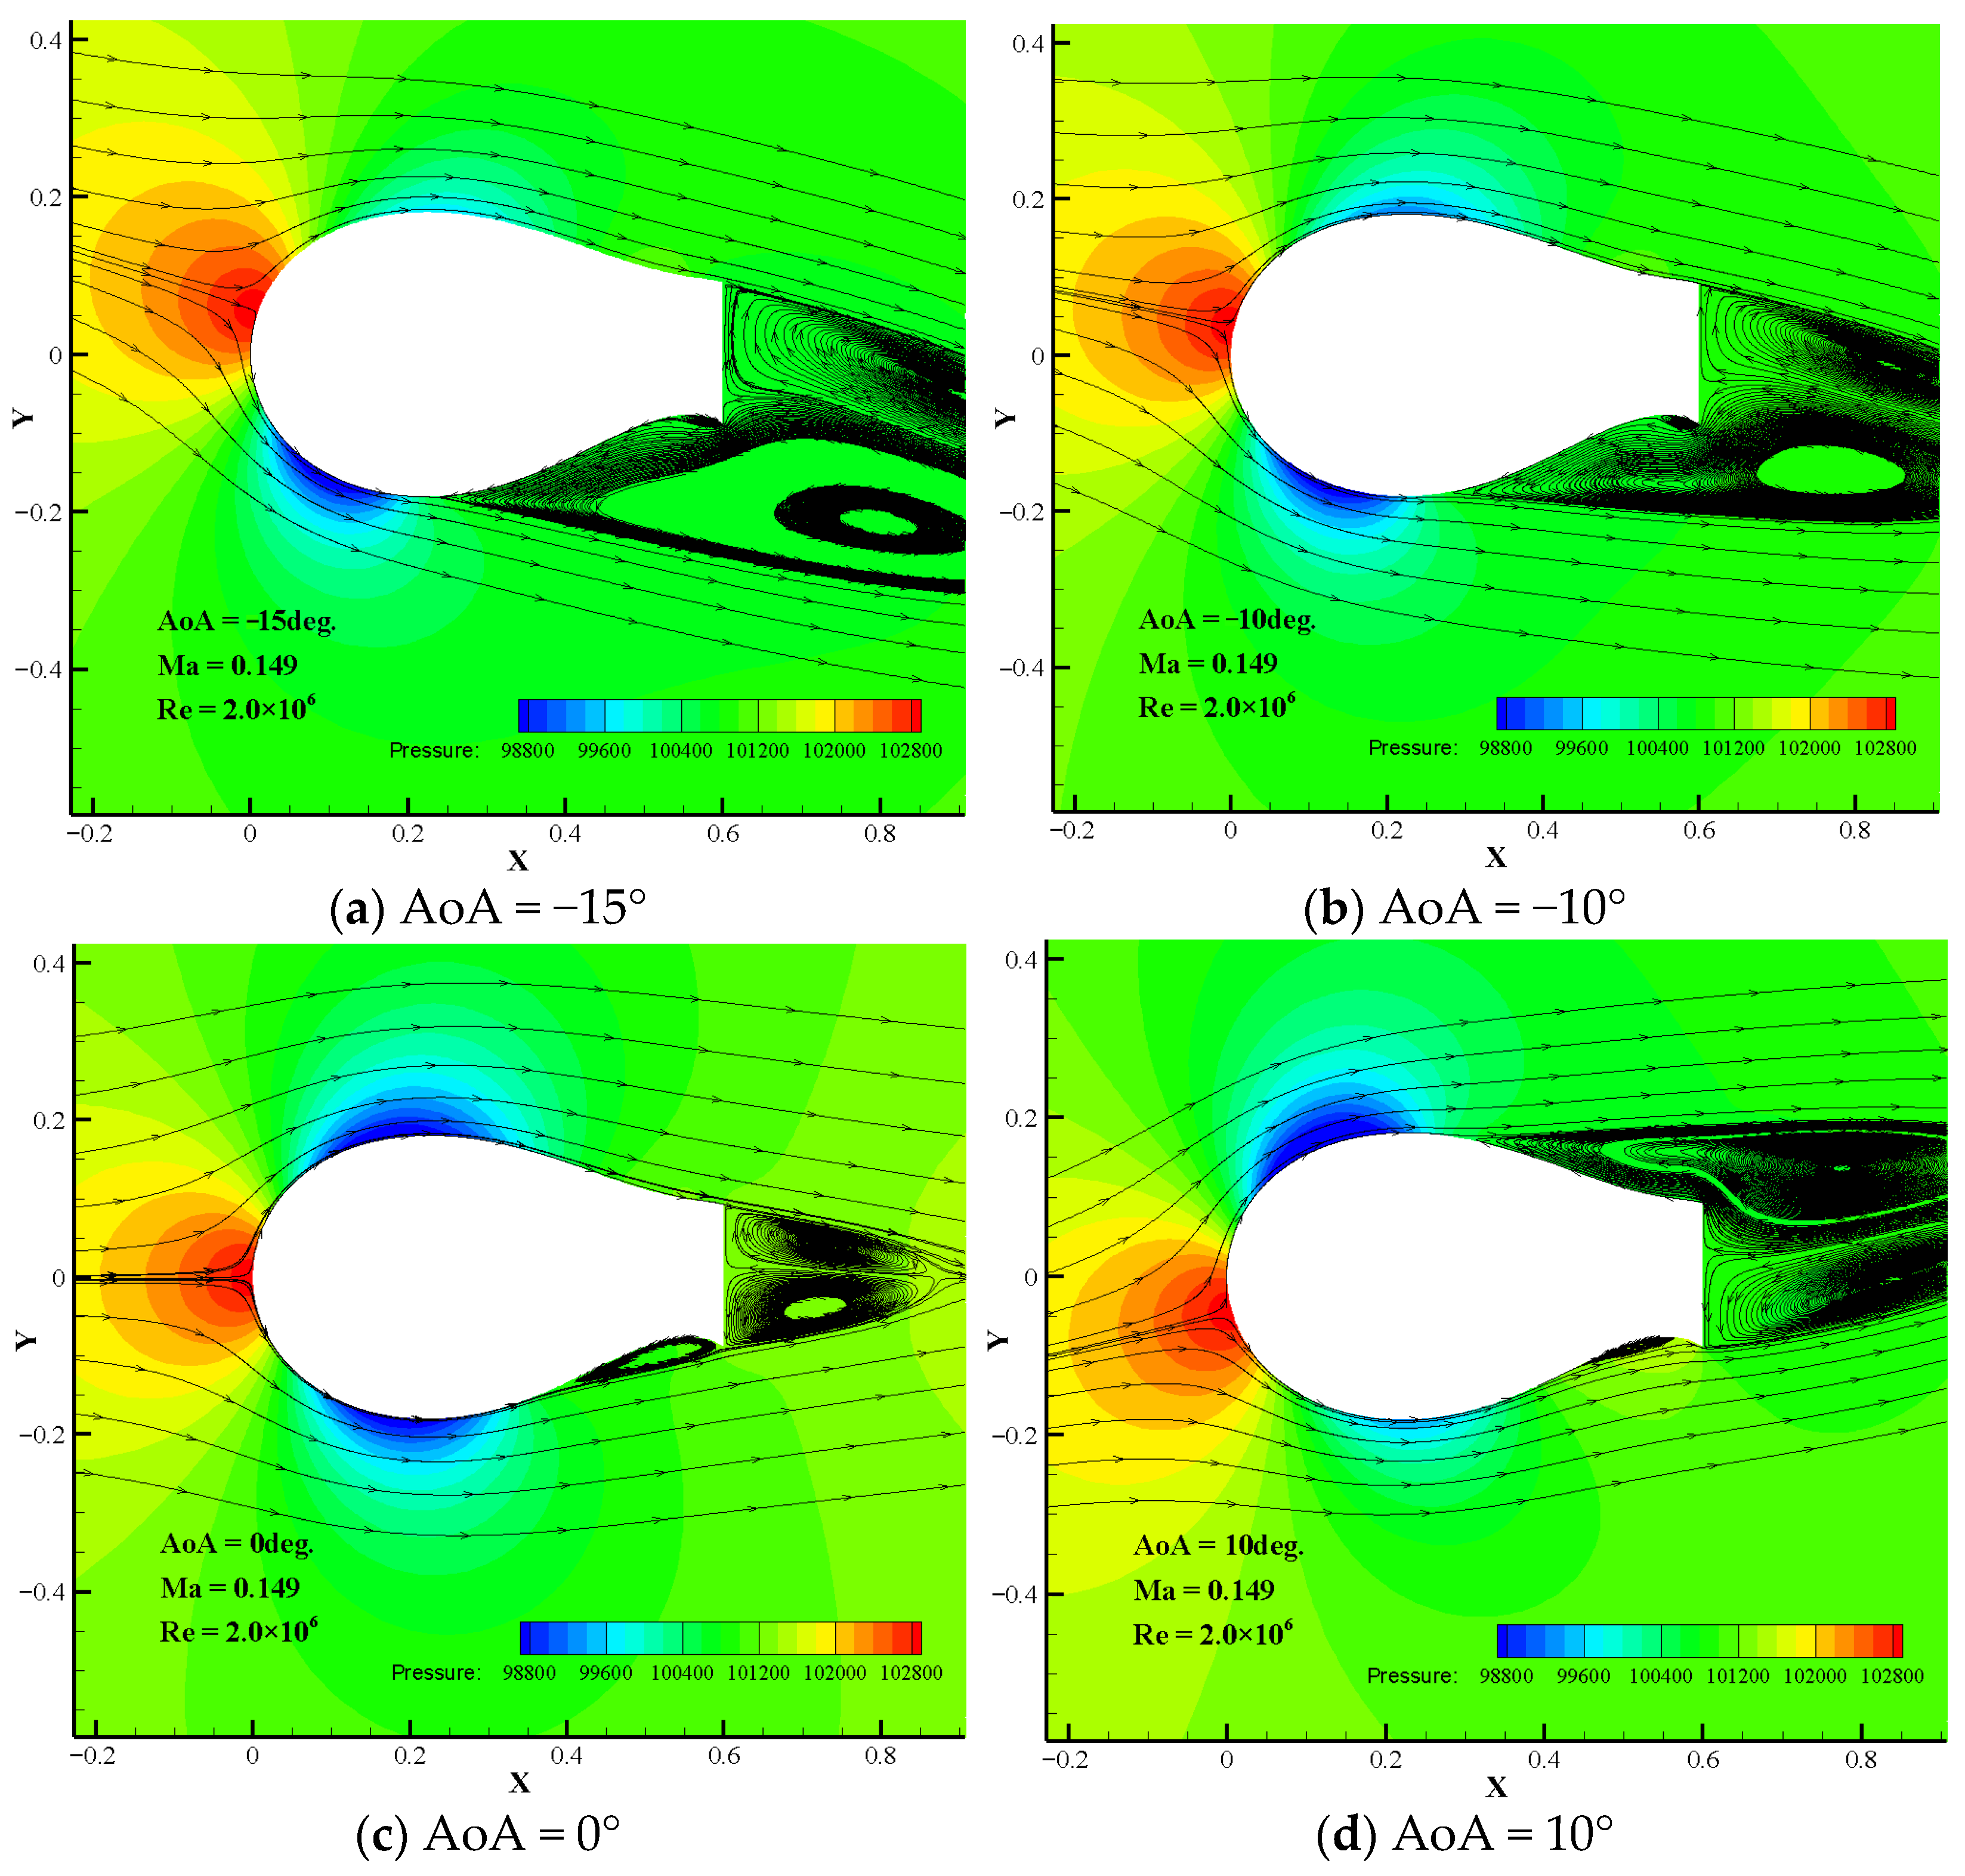
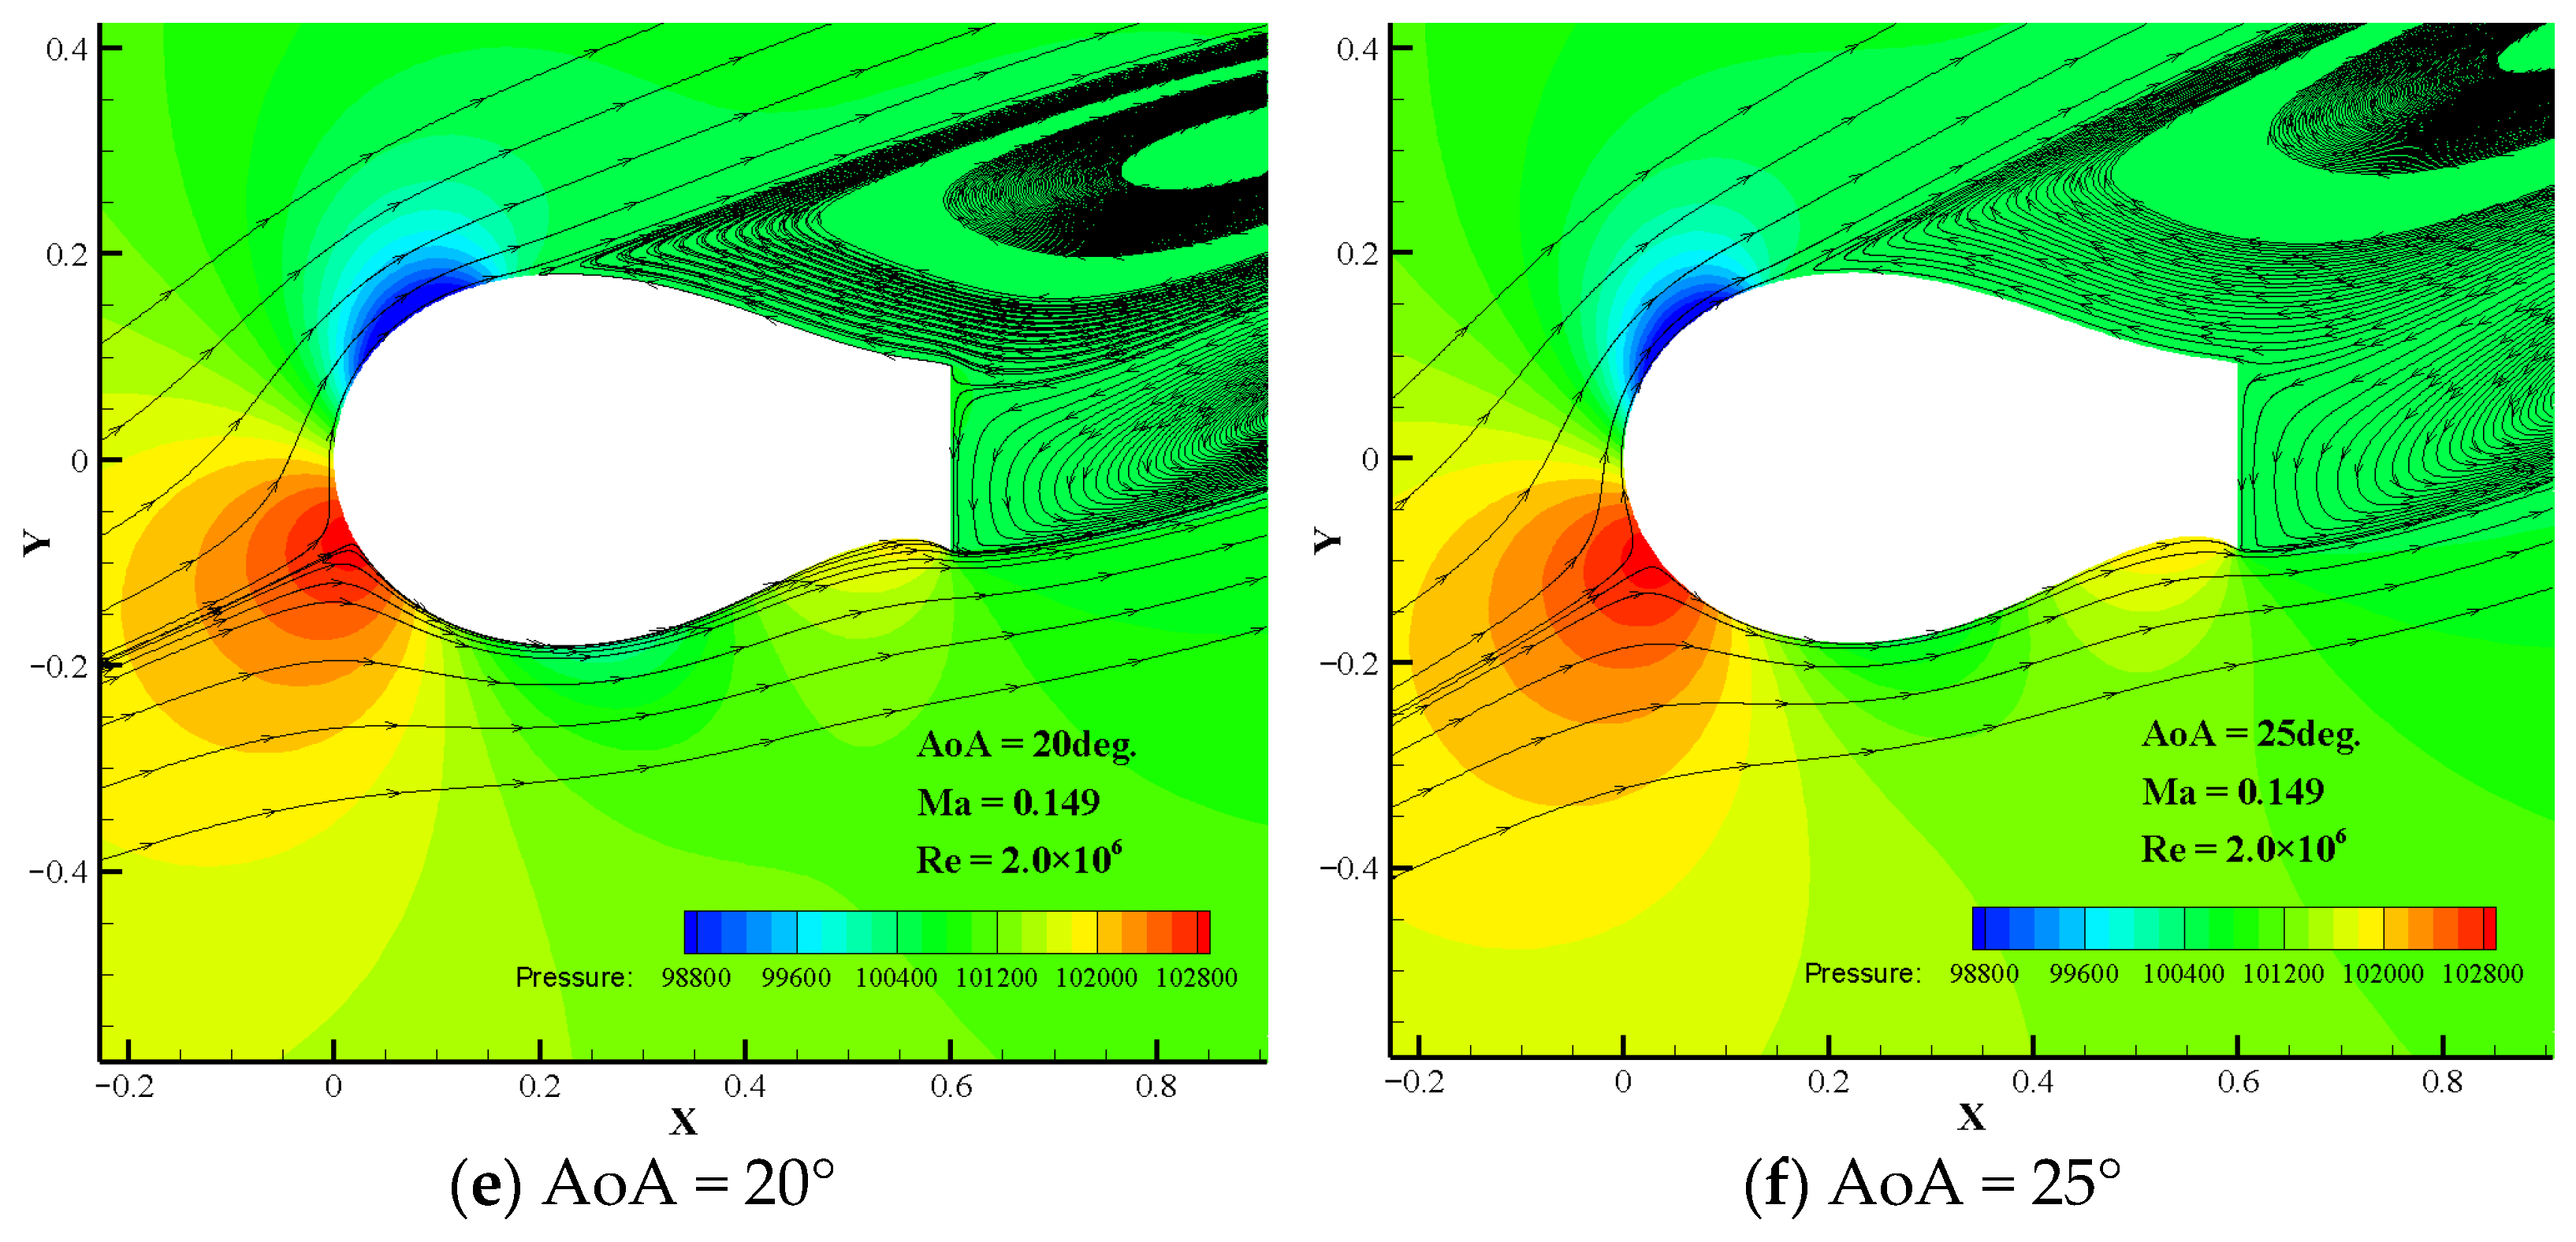
Figure 15.
CP distribution of airfoils with different BTE thicknesses.

Table 1.
Test plan of NWT600 airfoil in the NF-3 wind tunnel.
| Model | Run No. | Transition | Re | AoA Region | ΔAoA |
|---|---|---|---|---|---|
| NWT600 | 1 | Fixed | 2.0 ×10⁶ | −15° to 25° | 1° |
| 2 | Fixed | 2.5 × 10⁶ | −15° to 25° | 1° | |
| 3 | Fixed | 3.0 × 10⁶ | −15° to 25° | 1° | |
| 4 | Free | 2.0 × 10⁶ | −15° to 25° | 1° | |
| 5 | Free | 2.5 × 10⁶ | −15° to 25° | 1° | |
| 6 | Free | 3.0 × 10⁶ | −15° to 25° | 1° |
Table 2.
Main parameters of the DU97-W-300 grids.
| Parameters | Grid A | Grid B | Grid C |
|---|---|---|---|
| Far-field radius/c | 50 | 50 | 50 |
| Wrap-around points | 240 | 400 | 480 |
| Normal layers | 120 | 200 | 240 |
| First layer height/m | 1.0 × 10⁻⁵ | 1.0 × 10⁻⁵ | 1.0 × 10⁻⁵ |
| Total cells number | 2.88 × 10⁴ | 8.00 × 10⁴ | 11.52 × 10⁴ |
| Y plus | <1.00 | <1.00 | <1.00 |
Table 3.
Calculated results and experimental data of the DU97-W-300 airfoil.
| Grid A | Grid B | Grid C | CFD [35] | Experiment [22] | |
|---|---|---|---|---|---|
| Total number of cells | 2.88 × 10⁴ | 8.00 × 10⁴ | 11.52 × 10⁴ | - | - |
| CL | 1.3941 | 1.3903 | 1.3819 | 1.3750 | 1.380 |
| CD | 0.0238 | 0.0234 | 0.0232 | 0.0206 | 0.014 |
Table 4.
The BTE relative thicknesses of these airfoils.
| Airfoil | NWT600_06 | NWT600_10 | NWT600_15 | NWT600_20 | NWT600_30 |
|---|---|---|---|---|---|
| Relative thickness of the trailing edge | 6% | 10% | 15% | 20% | 30% |
Disclaimer/Publisher’s Note: The statements, opinions and data contained in all publications are solely those of the individual author(s) and contributor(s) and not of MDPI and/or the editor(s). MDPI and/or the editor(s) disclaim responsibility for any injury to people or property resulting from any ideas, methods, instructions or products referred to in the content. |
© 2023 by the authors. Licensee MDPI, Basel, Switzerland. This article is an open access article distributed under the terms and conditions of the Creative Commons Attribution (CC BY) license (https://creativecommons.org/licenses/by/4.0/).
Share and Cite
MDPI and ACS Style
Pei, Z.; Xu, H.-Y.; Deng, L.; Li, L.-X. Influence of the Blunt Trailing-Edge Thickness on the Aerodynamic Characteristics of the Very Thick Airfoil. Wind 2023, 3, 439-458. https://doi.org/10.3390/wind3040025
AMA Style
Pei Z, Xu H-Y, Deng L, Li L-X. Influence of the Blunt Trailing-Edge Thickness on the Aerodynamic Characteristics of the Very Thick Airfoil. Wind. 2023; 3(4):439-458. https://doi.org/10.3390/wind3040025
Chicago/Turabian StylePei, Zhen, He-Yong Xu, Lei Deng, and Ling-Xiao Li. 2023. "Influence of the Blunt Trailing-Edge Thickness on the Aerodynamic Characteristics of the Very Thick Airfoil" Wind 3, no. 4: 439-458. https://doi.org/10.3390/wind3040025