Communication

Observations on the Frequency, Duration, and Geographical Extent of Summertime Cold-Front Activity in the Southeastern USA: 1973–2020

1
Carolina Tree-Ring Science Laboratory, Department of Geography, Environment, and Sustainability, University of North Carolina at Greensboro, Greensboro, NC 27412, USA
2
Department of Earth and Environmental Sciences, University of West Florida, Pensacola, FL 32514, USA
*
Author to whom correspondence should be addressed.
Meteorology 2022, 1(2), 211-219; https://doi.org/10.3390/meteorology1020014
Submission received: 11 April 2022 / Revised: 24 May 2022 / Accepted: 28 May 2022 / Published: 2 June 2022
(This article belongs to the Special Issue Early Career Scientists' (ECS) Contributions to Meteorology (2022))

Abstract

:
We analyzed summertime (June–August) cold-front activity via frequency and duration in the southeastern USA during 1973–2020 to summarize and identify the temporal trends of the annual and total number of hours associated with cold fronts, cold-front days, and multi-day cold-front events. Using data from 34 ASOS Network stations, we defined summertime cold fronts as events that lowered the dew point temperature below 15.56 °C (< 60 °F). Additionally, we examined 500 hPa geopotential height anomalies associated with years with cold front frequency/duration deviations of +/− 1.0 SD. The extent of the cold-front activity exhibited a north–south latitudinal gradient with a more southerly latitudinal expression on the east side of the Appalachian Mountains and was negligible south of the 30°N latitude. The cold-front activity was most prominent during the first half of June. Our results suggest that all three metrics of summertime cold-front activity were stable at a regional scale during the 48-year study period with a few (three–five) stations experiencing significant decreases. A regional-scale stability was coincident with significant increases in minimum, maximum, and average summertime temperatures in the southeastern USA. Years with either above-average or below-average cold-front activity were concurrent with synoptic conditions that supported either troughing or ridging in the southeastern USA. We conclude that the observed weakening in the southeastern USA warming hole is the result of external and/or internal forcings unrelated to reductions in anomalously cool summer weather.

1. Introduction

Many places on Earth have experienced significant air temperature increases since at least 1900 CE [1]. However, certain regions, including the southeastern and central United States of America (USA), have exhibited either no significant trend or even slight cooling trends during the same period [2]. In recent decades, this “warming hole” has received substantial research attention (e.g., [3,4], p. 1]. Several explanations for the warming hole have been proposed, including cloud–precipitation–soil moisture [5], teleconnections to sea-surface temperatures in the tropical Pacific Ocean [2], and anthropogenic aerosol modifications of the surface radiation budget [6]. Summer temperatures in the southeastern USA are uncorrelated to ocean–atmosphere indices, supporting the notion that other forcings play roles [3,7]. Ultimately, it appears that the warming hole phenomenon can be explained by multiple approaches, and thus likely represents an internal atmospheric variability triggered by multiple contributing factors [2]. More recent work indicates that the warming hole varies seasonally and by the selected analysis period and that the causes of the warming hole may vary in different seasons [7,8].
A signal of the continued increase in the global average surface-air temperature, however, has emerged in the southeastern USA. For approximately the last five decades, warming has become evident in the region, with a decadal trend of 0.22 °C during 1973–2020 (https://www.ncdc.noaa.gov/cag/regional/time-series, accessed on 30 May 2021). Annual temperature trends are consistently positive across the region, accompanied by increases in heat extremes and decreases in cold extremes [3,4]. Further, some analyses indicate that since the late 1990s, the warming hole in the southeastern USA has disappeared (e.g., [2]), possibly associated with a shift in the Interdecadal Pacific Oscillation.
One potential contributor to changes in the summertime temperature in the Southeast could be variability in the frequency and/or duration of summertime cold fronts. Although mid-latitude cyclones (MLCs) are least frequent in the study area during the summer season when the polar front is relatively weak and displaced to high latitudes, transient eddies and associated fronts occasionally affect the Southeast in the summer, bringing periodic relief from the normal heat and humidity [9]. One set of expected responses to global warming includes Arctic amplification, reduced low-level baroclinicity, and fewer cyclones and fronts in eastern North America, which can contribute to increasing average summer temperatures and possibly to summer heat extremes [9]. Over North America, summertime cold-front activity occurs most frequently between the Rockies and Appalachia, with a regional (secondary) maximum in our study area due to frequent cold-air damming on the east side of the Blue Ridge/Southern Appalachian complex [9].
To evaluate summertime temperature trends in the context of the warming hole, we examined and analyzed the summertime cold-front frequency and duration in the southeastern USA during 1973–2020. Our specific objectives were to identify and analyze temporal trends for the annual and the total number of (1) hours associated with summer cold fronts; (2) summer cold-front days; and (3) multi-day summer cold-front events. Additionally, we (4) evaluated the synoptic conditions associated with summers with either anomalously high or anomalously low cold-front frequencies/durations.

2. Materials and Methods

2.1. Climate Data

Data were obtained from ASOS Network (available at: https://mesonet.agron.iastate.edu/request/download.phtml, accessed on 30 May 2021) for 34 stations (Table 1) in the southeastern USA that each had ≥99% completeness for hourly dew-point temperatures during June–August (n = 92 days; 2208 h) 1973–2020 (n = 48 years). We analyzed the effects of summertime cold-front activity, defined as events that lowered the dew-point temperature to below 15.56 °C (<60 °F), as these conditions represent below-mean dew-point temperatures during the summer months in the southeastern USA [10]. We confirmed that each event producing < 15.56°C dew-point temperatures was associated with cold-front passage by reviewing historic daily weather maps for three stations (i.e., DCA, GSO, and MCN; Table 1) along a latitudinal gradient (available at: https://library.noaa.gov/Collections/Digital-Collections/US-Daily-Weather-Maps, accessed on 30 May 2021).
Our criteria excluded other meteorological events that may cause temporary cooling (e.g., mesoscale systems, such as downdrafts associated with thunderstorms) that are not coincident with macroscale dew-point temperature reductions. Relative to air temperature, the use of dew-point temperature to identify cold-front passage provides a better comparison between (1) locations at higher and lower elevations and (2) event durations because dew-point temperatures express smaller diurnal variations. We assessed the potential of missing data inhomogeneities by correlating the nearest stations to determine if outlier observations occurred (i.e., the absence of a cold front when other nearby stations recorded).
We used multiple criteria to analyze cold-front activity, including cold-front hours, cold-front days, and multi-day cold-front events. Cold-front hours were determined by the mean number of hours with dew-point temperatures < 15.56 °C per summer with a potential range of 0–2208 h (i.e., 24 h × 92 summer days). Cold-front days were defined by the presence of dew-point temperatures < 15.56 °C for >12 h/day(s) of the event; thus, cold fronts that reduced dew-point temperatures for <12 h (i.e., <50% of a day) were excluded from the analysis. Cold-front days represented both single- and multi-day events associated with the passage of a cold front. Multi-day cold-front events were defined by consecutive days with >12 h of dew-point temperatures < 15.56 °C.

2.2. Mapping

We mapped cold-front hours, cold-front days, and multi-day cold-front events for the region using ArcMap 10.7 [11]. Each station was represented by graduated circles classified by natural breaks [12]. Values for the Southeastern USA region were interpolated using ordinary kriging with a spherical semivariogram model [13] and mapped as a field using nine equal-interval classifications. Stations with significant (p < 0.05) temporal trends determined by using simple linear regression for cold-front hours, cold-front days, and multi-day cold-front events were marked as open circles when using year as the dependent variable.

2.3. Synoptic Data

We evaluated 500-hPa geopotential height anomalies to assess synoptic conditions during years with above-average (>1.0 SD; n = 9) and below-average (<−1.0 SD; n = 8) regional (i.e., all 34 stations) cold-front hours. We used seasonal climate composites (https://psl.noaa.gov/cgi-bin/data/composites/printpage.pl (accessed on 30 May 2021)) to map the prevailing 500-hPa conditions during these years.

3. Results and Discussion

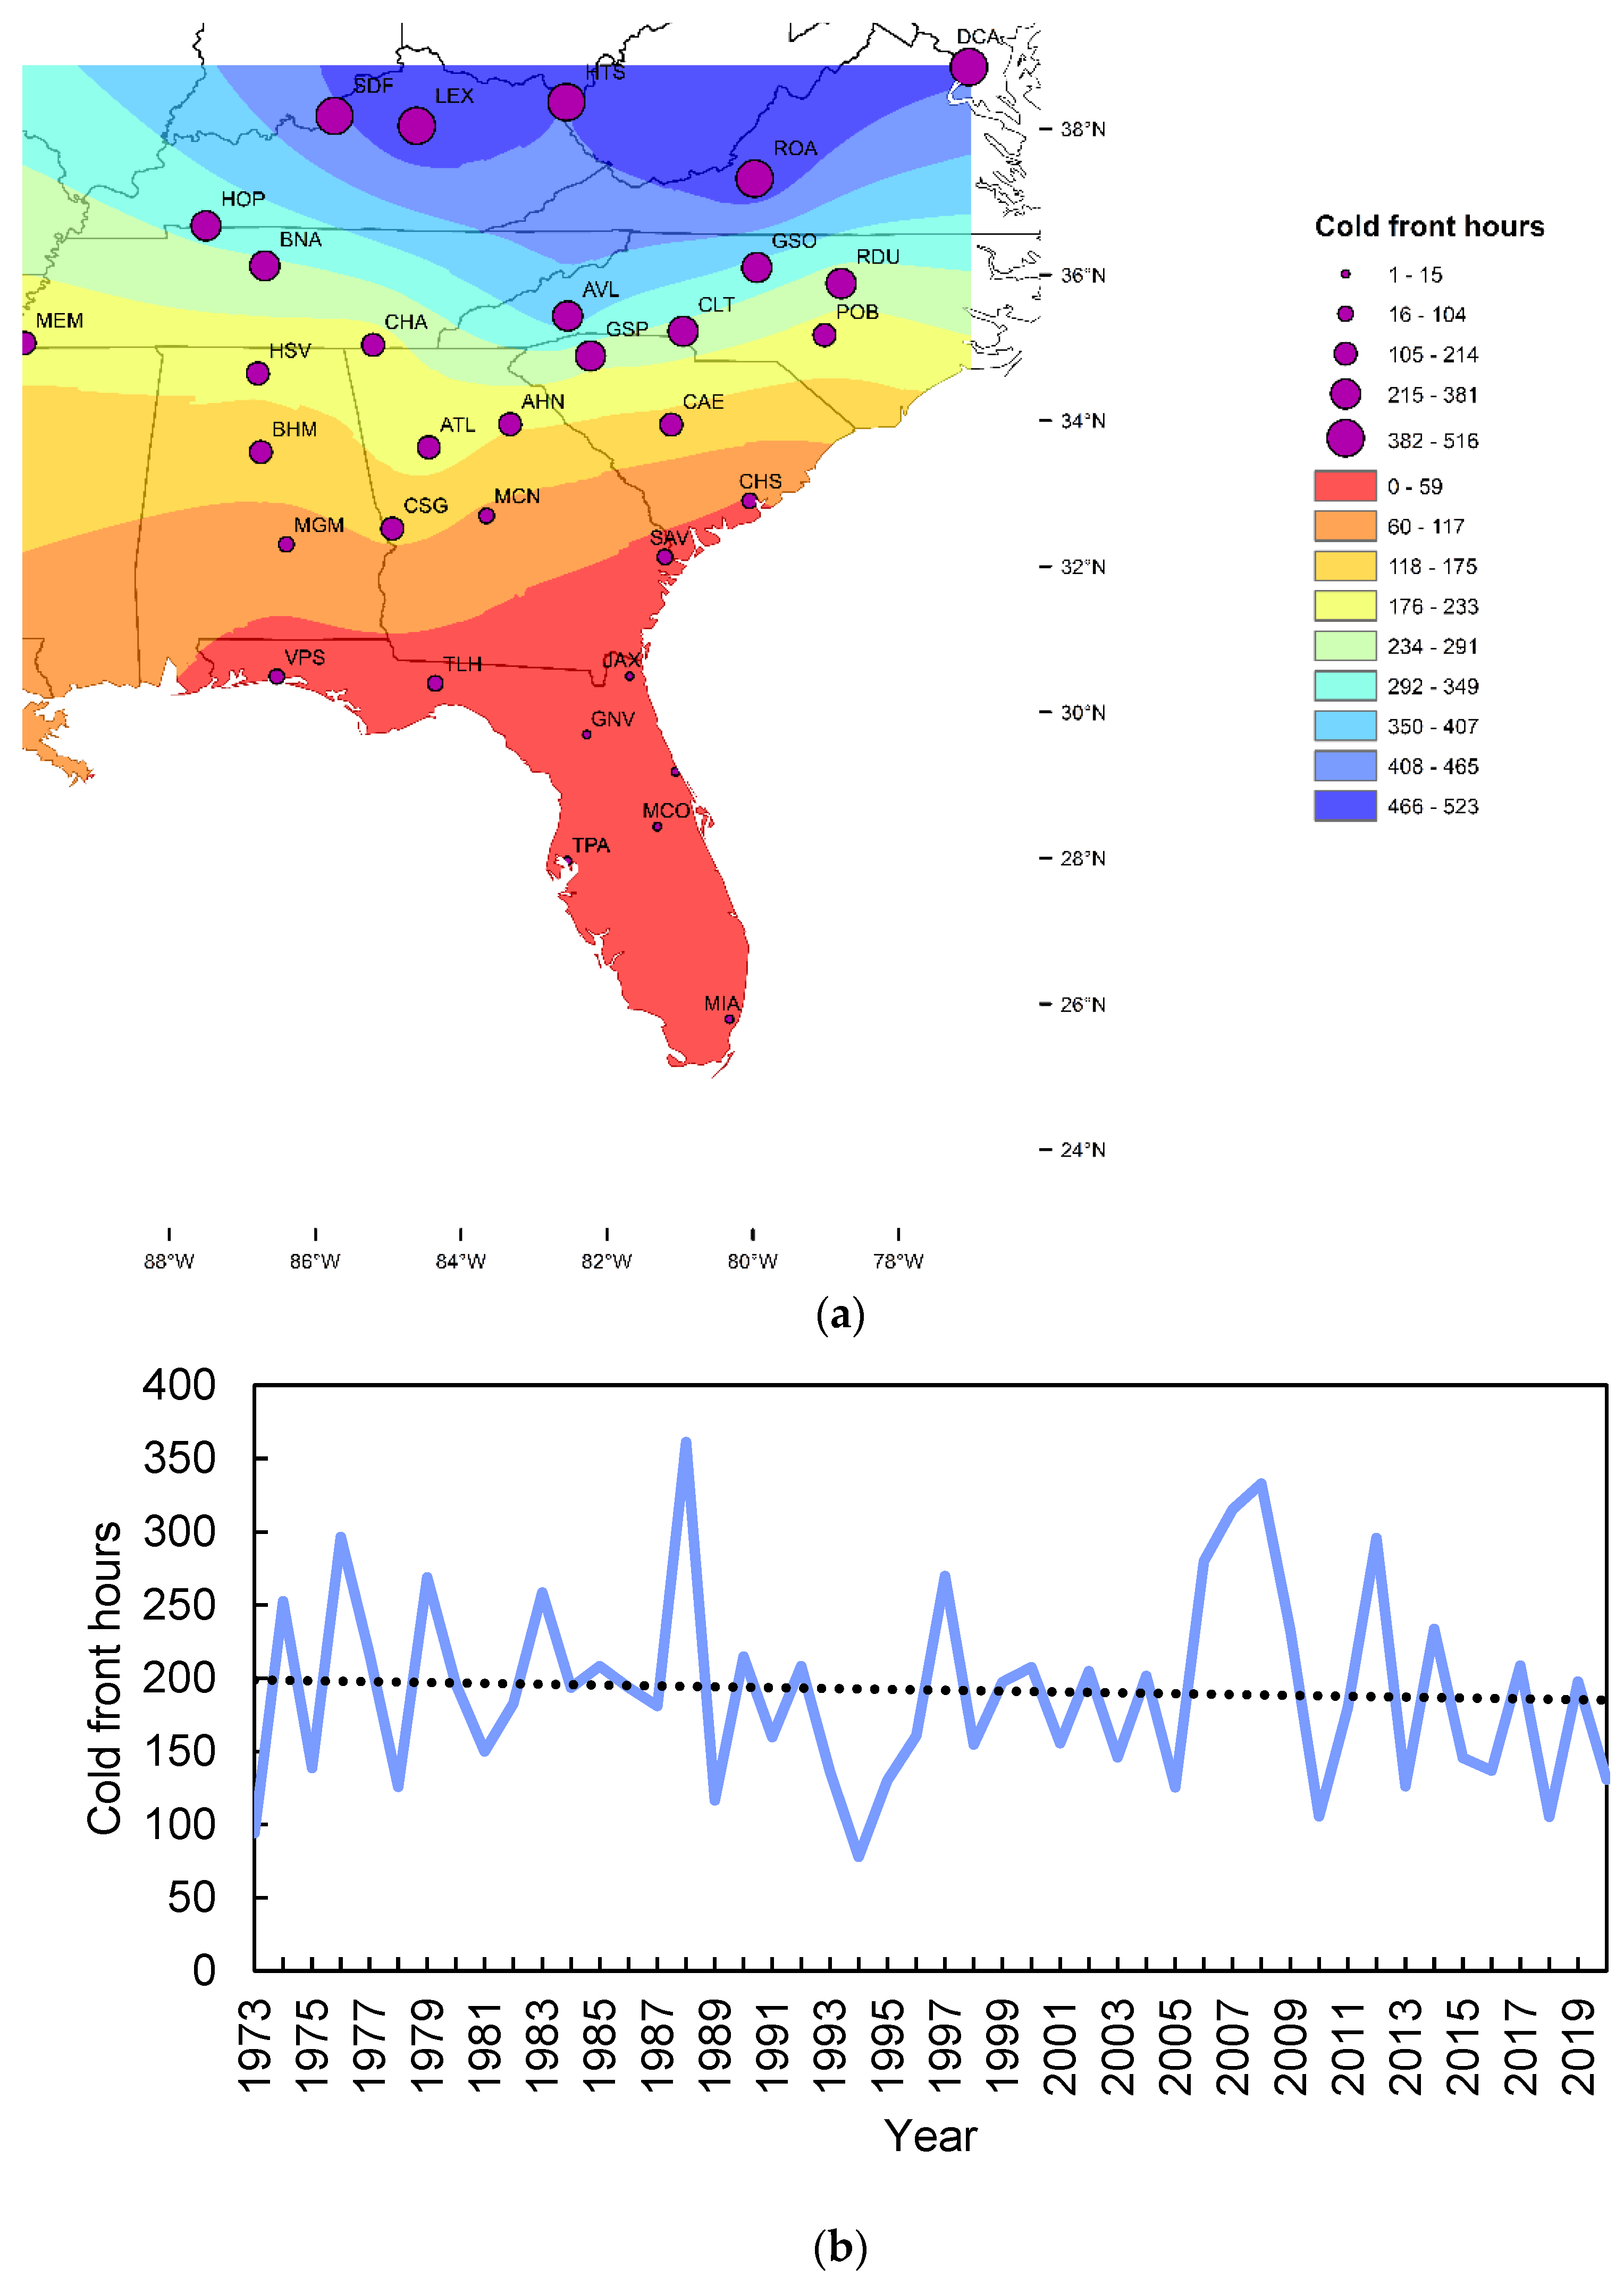
3.1. Cold Front Hours

The mean cold-front hours by station ranged from 1.1 (Key West, FL, USA) to 516.2 (Roanoke, VA, USA) hours each summer with a regional mean of 192.0 h (Figure 1a, Table 1, and Supplemental Figure S1). Thus, during the 48-year study period, the average number of hours that a station was impacted by the passage of a summertime cold front (i.e., a dew-point temperature < 15.56 °C) ranged from <1 day (7 stations) to >3 weeks (2 stations). The north–south latitudinal gradient is modified by higher cold-front hours on the east side of the Appalachians compared to comparable latitudes on the west side (Figure 1a, Table 1, and Supplemental Figure S1). This pattern is produced by the north–south advection of cold air along the east side of the Appalachians (i.e., a backdoor cold front; [14]) that is initiated by a strong short wave east of Hudson Bay, followed by the development of an anticyclone centered over the northeastern USA [15]. The cold-front hours were most common during the first two weeks of June, representing over half the observations for all the stations, but also occurred most years during July and August for stations north of 30°N.
There was no significant change in the regional mean of the cold front hours during 1973–2020 (Figure 1b). However, five stations (EYW, HOP, POB, DAB, and GNV; Figure 1a) experienced significant (p < 0.05) decreases with three of these stations located in Florida, where mean values are <15 h per summer (range 1.1–14.5). Thus, these changes are minor from a climatic perspective. The decreases at HOP and POB were not consistent with the other stations at similar latitudes that did not experience significant decreases (Figure 1a), suggesting an overall stability in the cold-front hours in the southeastern USA (Figure 1b).

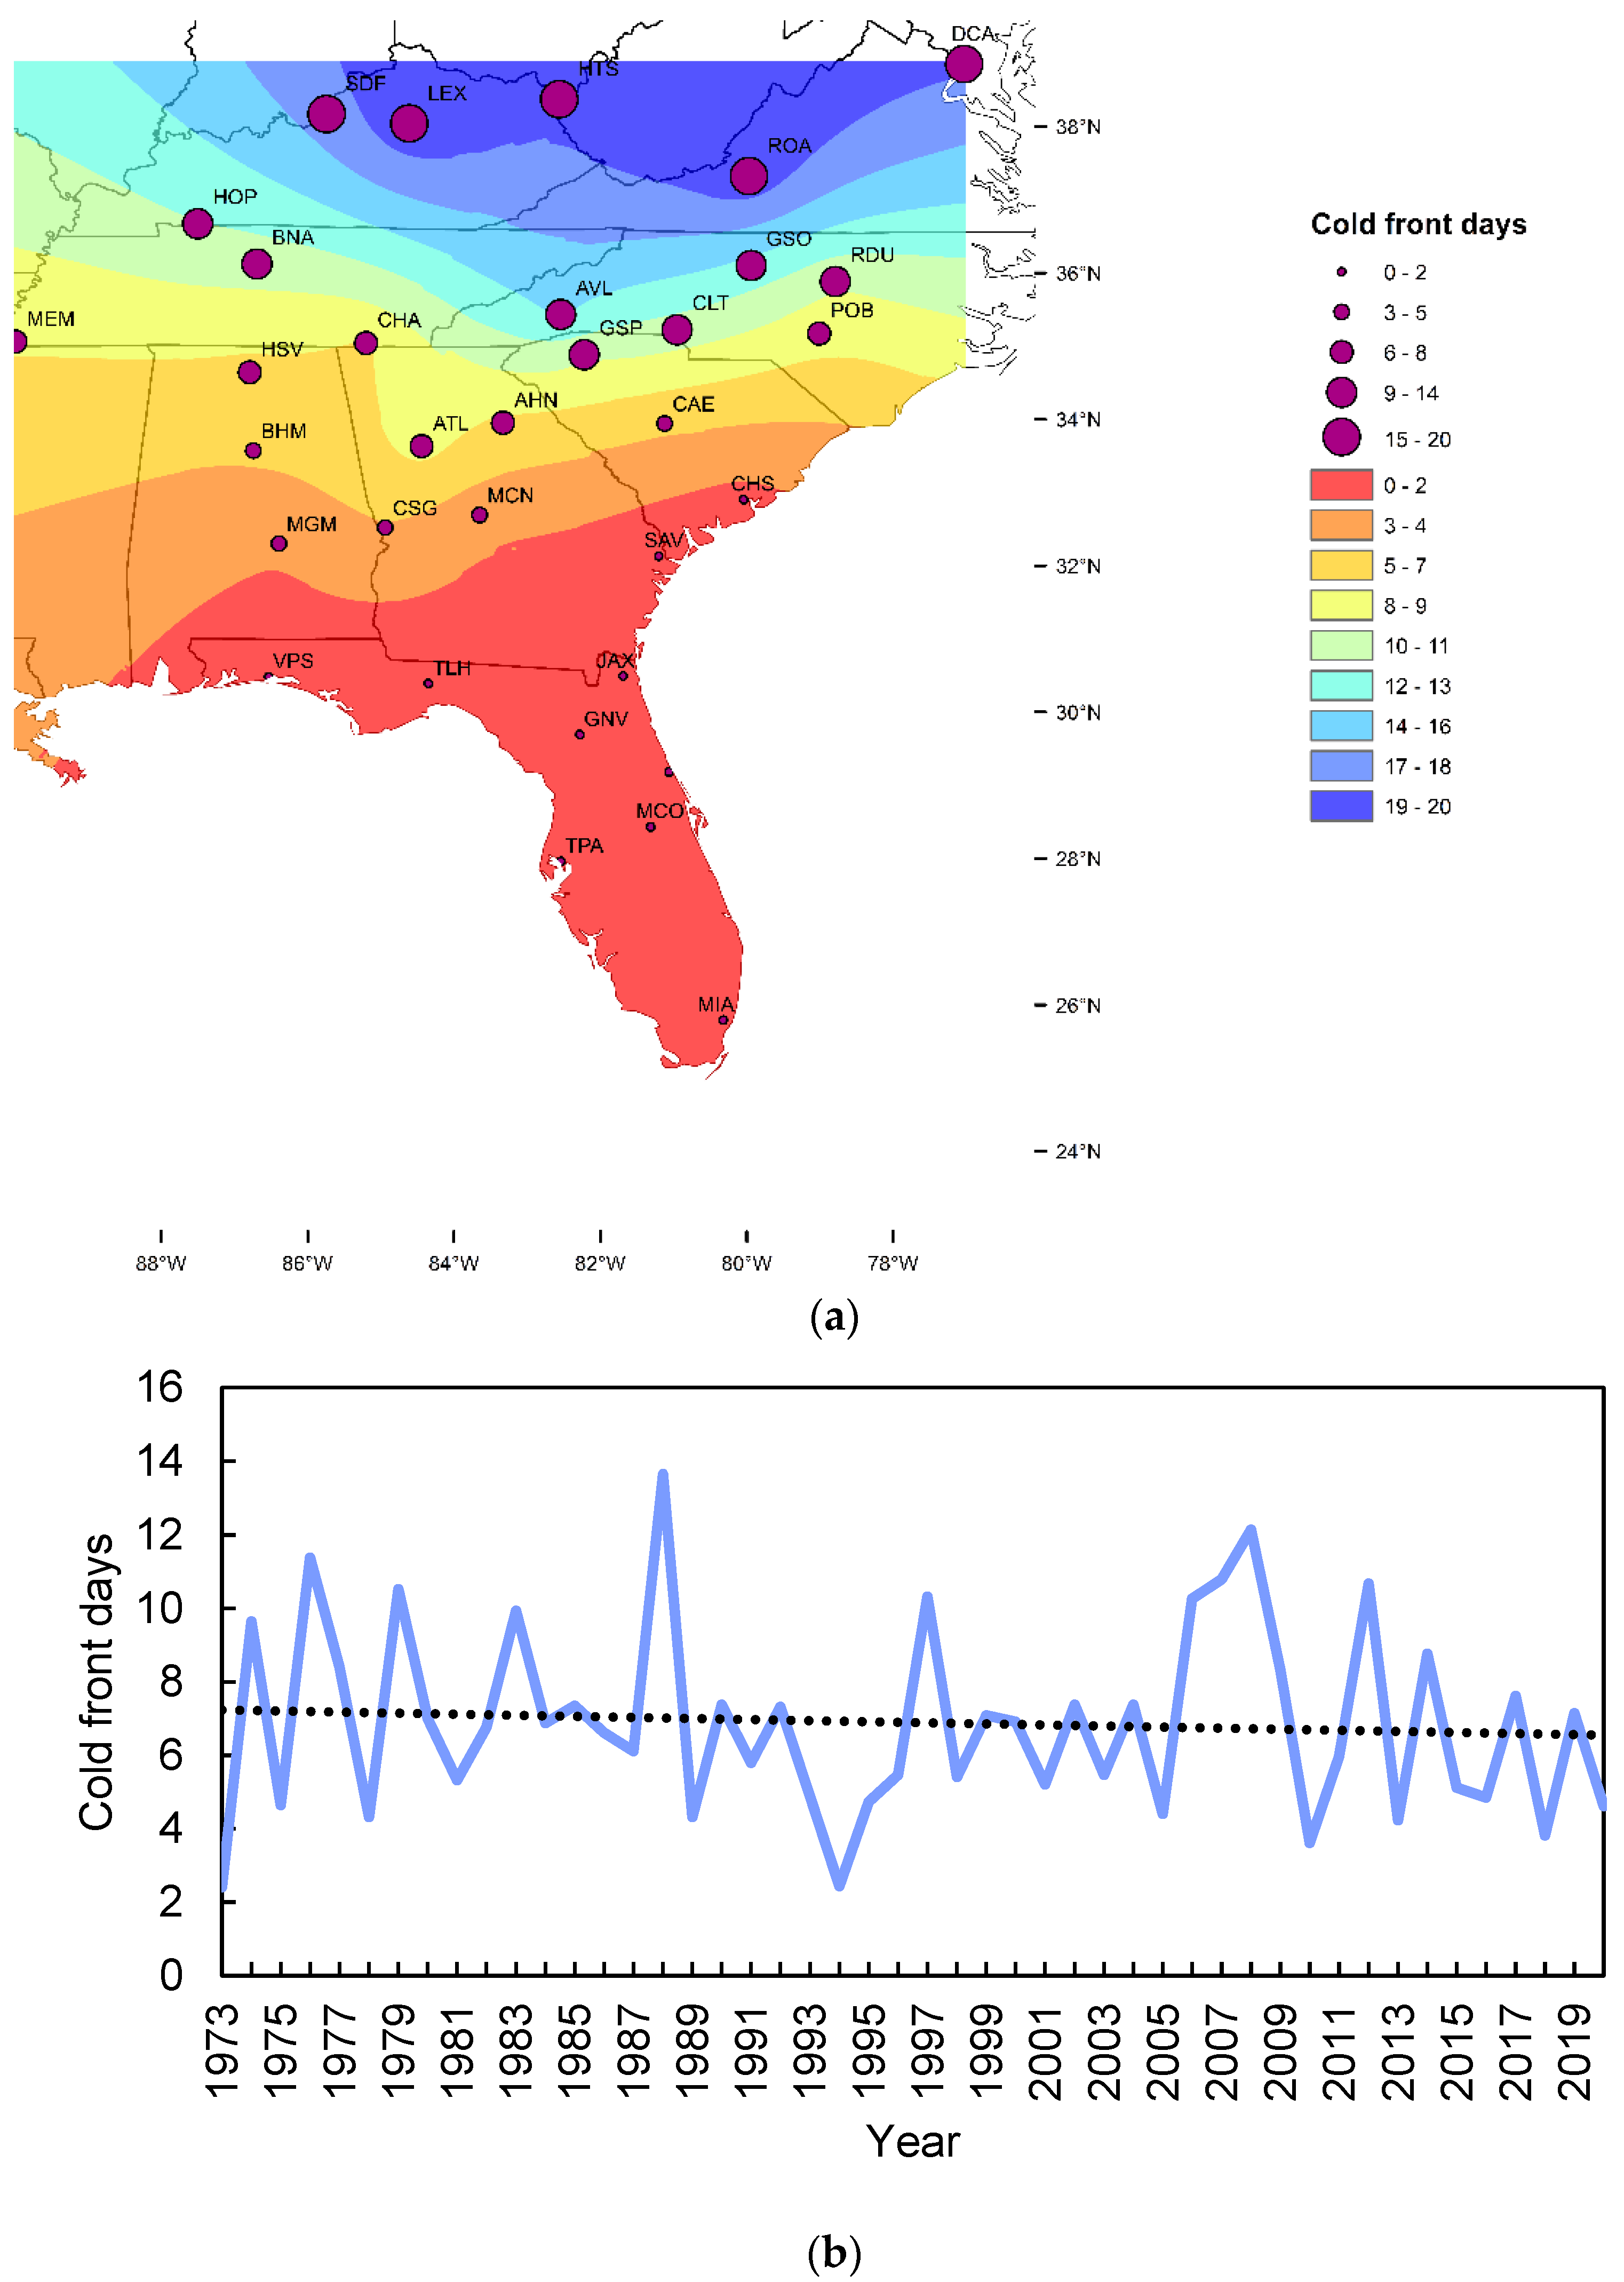
3.2. Cold-Front Days

During the 48-year study period, the average number of cold-front days by station ranged from 0 (Key West, FL, USA) to 19.7 (Roanoke, VA, USA) with a regional mean of 6.9 days (Figure 2a, Table 1, and Supplemental Figure S1). Similar to the cold-front hour geographic distribution, a cold-air advection on the east side of the Appalachians is prominent with an overall north-to-south orientation. Three stations (SAV, HOP, and POB) experienced significant decreases in cold-front days during the study period, but a geographical discontinuity (i.e., surrounding stations did not show significant decreases; Figure 2a) suggests stability in the cold-front days in the southeastern USA (Figure 2b).

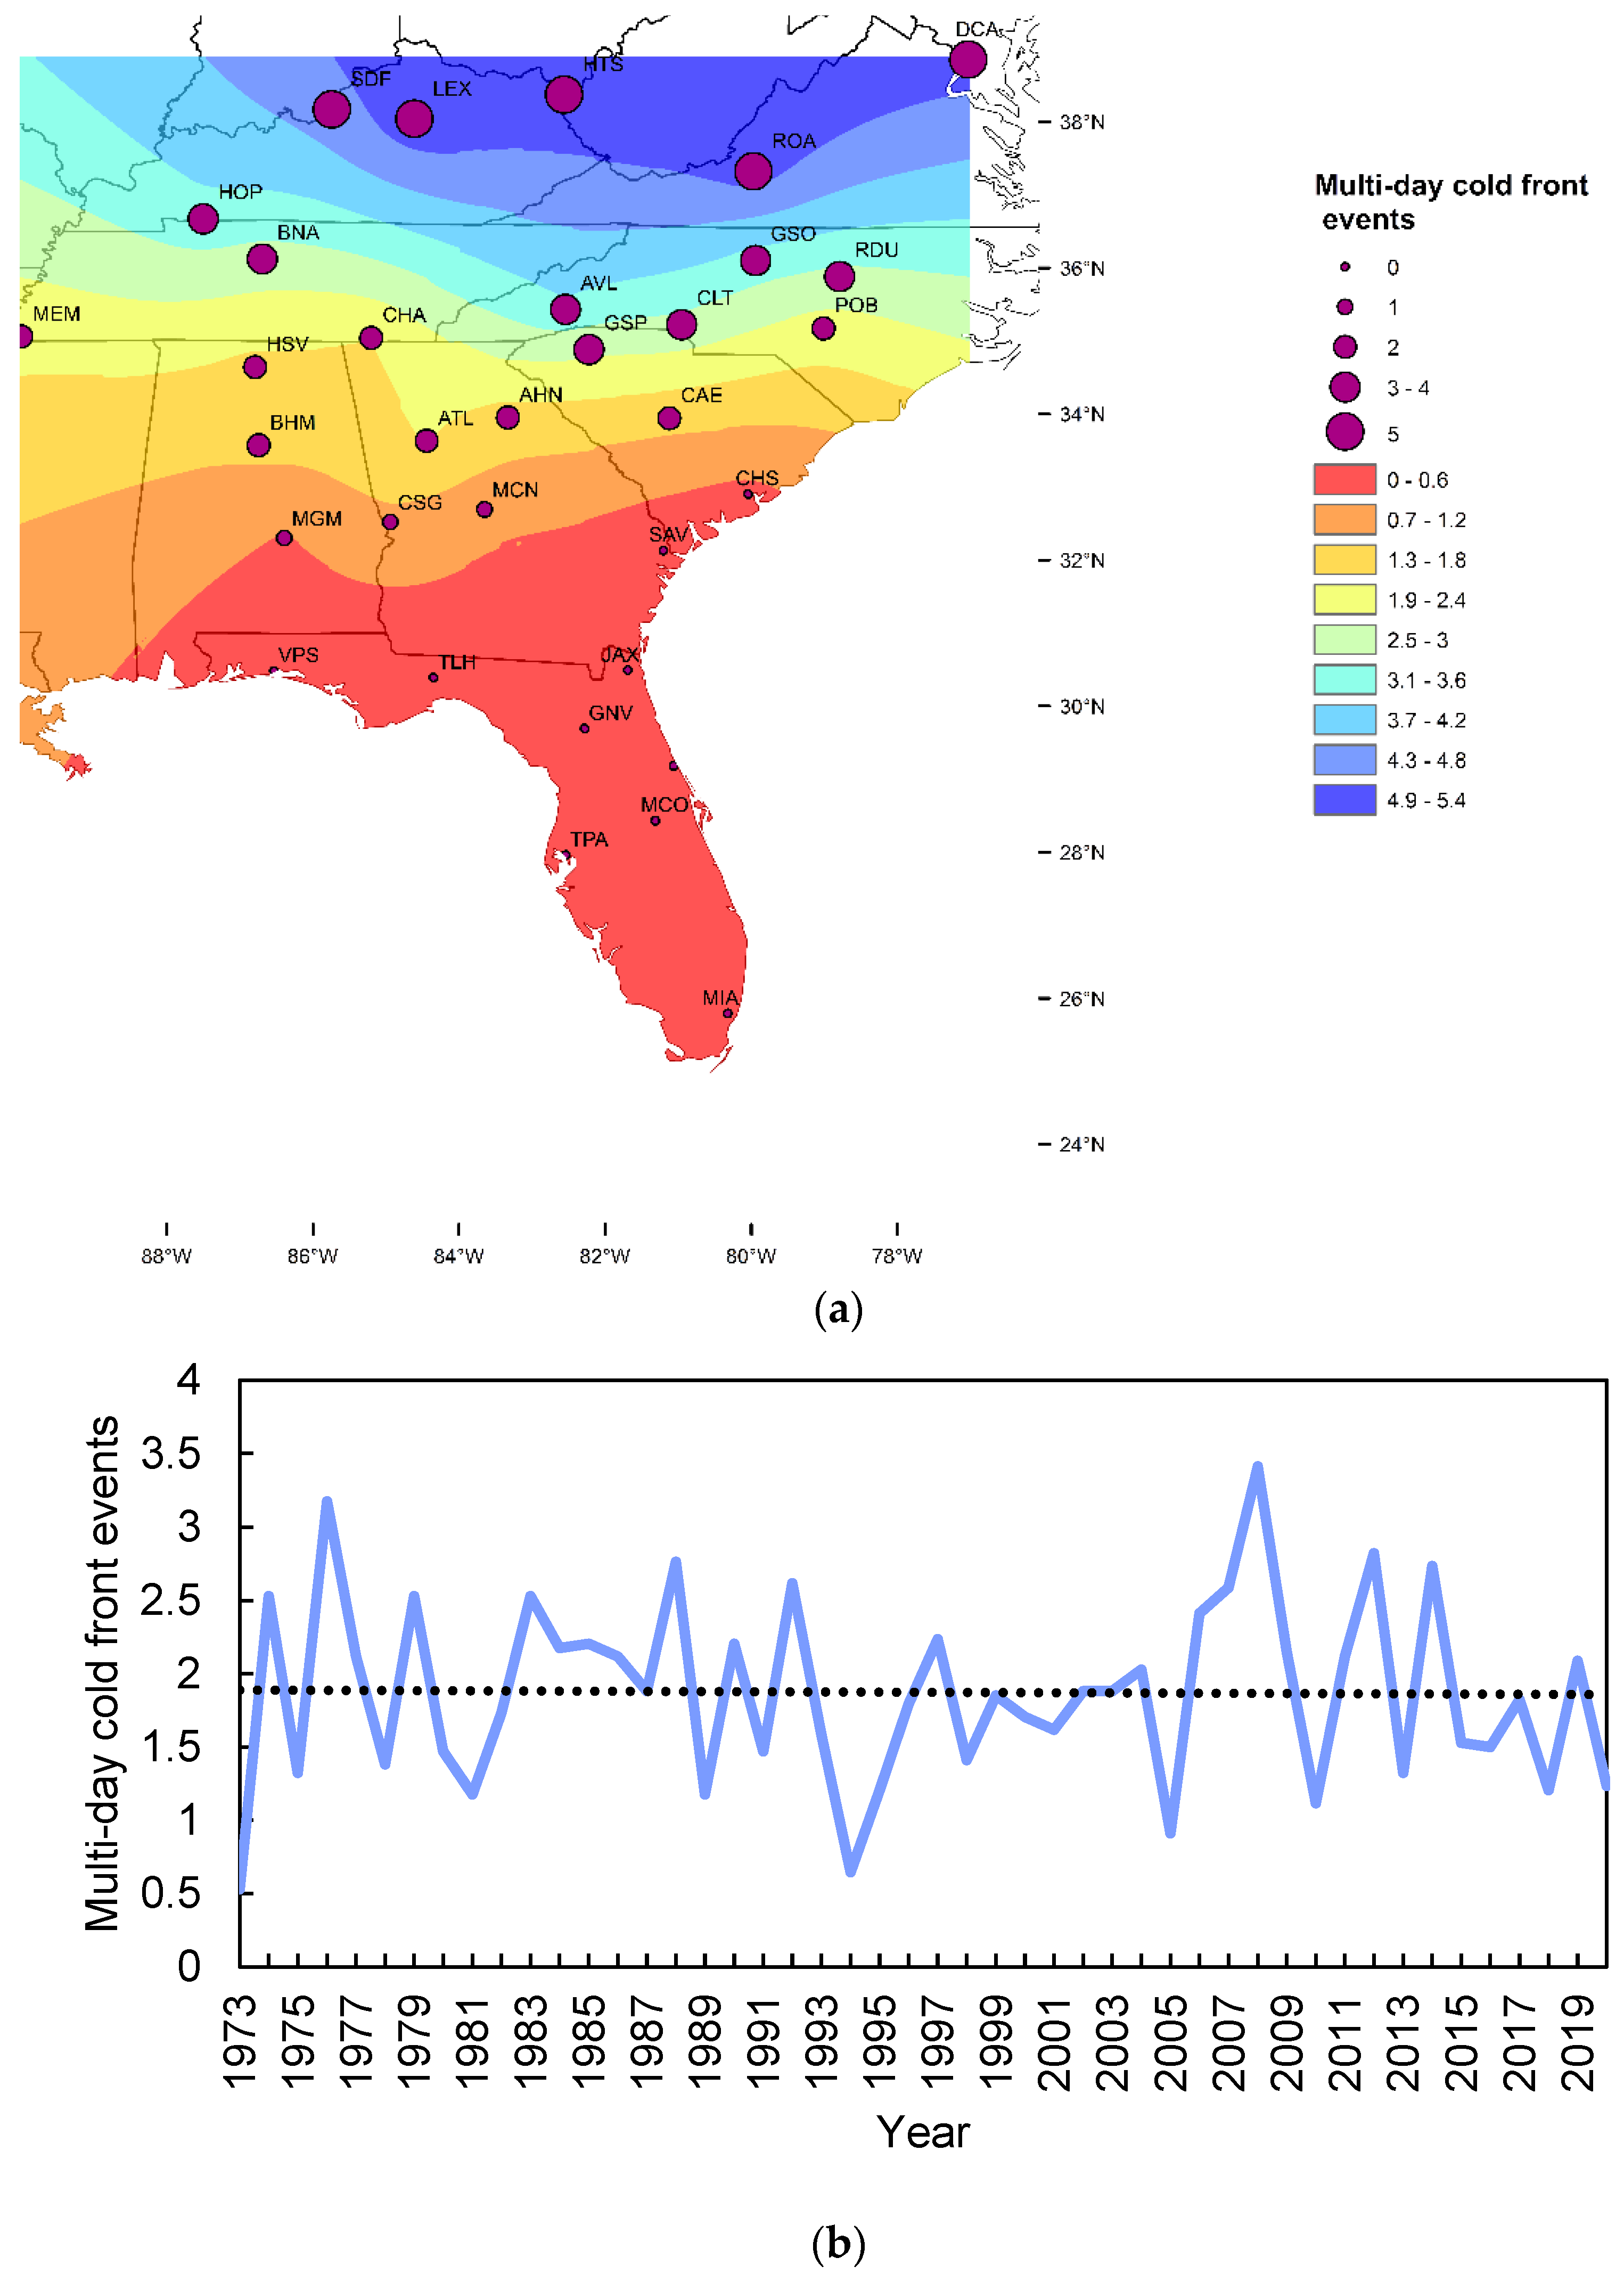
3.3. Multi-Day Cold-Front Events

The mean multi-day cold-front events (i.e., consecutive days with >12 h of dew-point temperatures < 15.56 °C) by station ranged from 0 (Key West, FL, USA) to 5.3 (Lexington, KY, USA) per year with a regional mean of 1.9 events (Figure 3a, Table 1, and Supplemental Figure S1). Five stations (MGM, VPS, SAV, POB, and CHS) experienced significant decreases in multi-day cold-front events. However, except for POB, these sites had low mean values, which experienced deviations from the mean of approximately −1.0 SD, and did not represent large absolute changes (i.e., >1 event per year). Conversely, stations with higher frequencies of multi-day cold fronts did not have significant changes, again suggesting stability for multi-day cold-front events in the southeastern USA (Figure 3b).

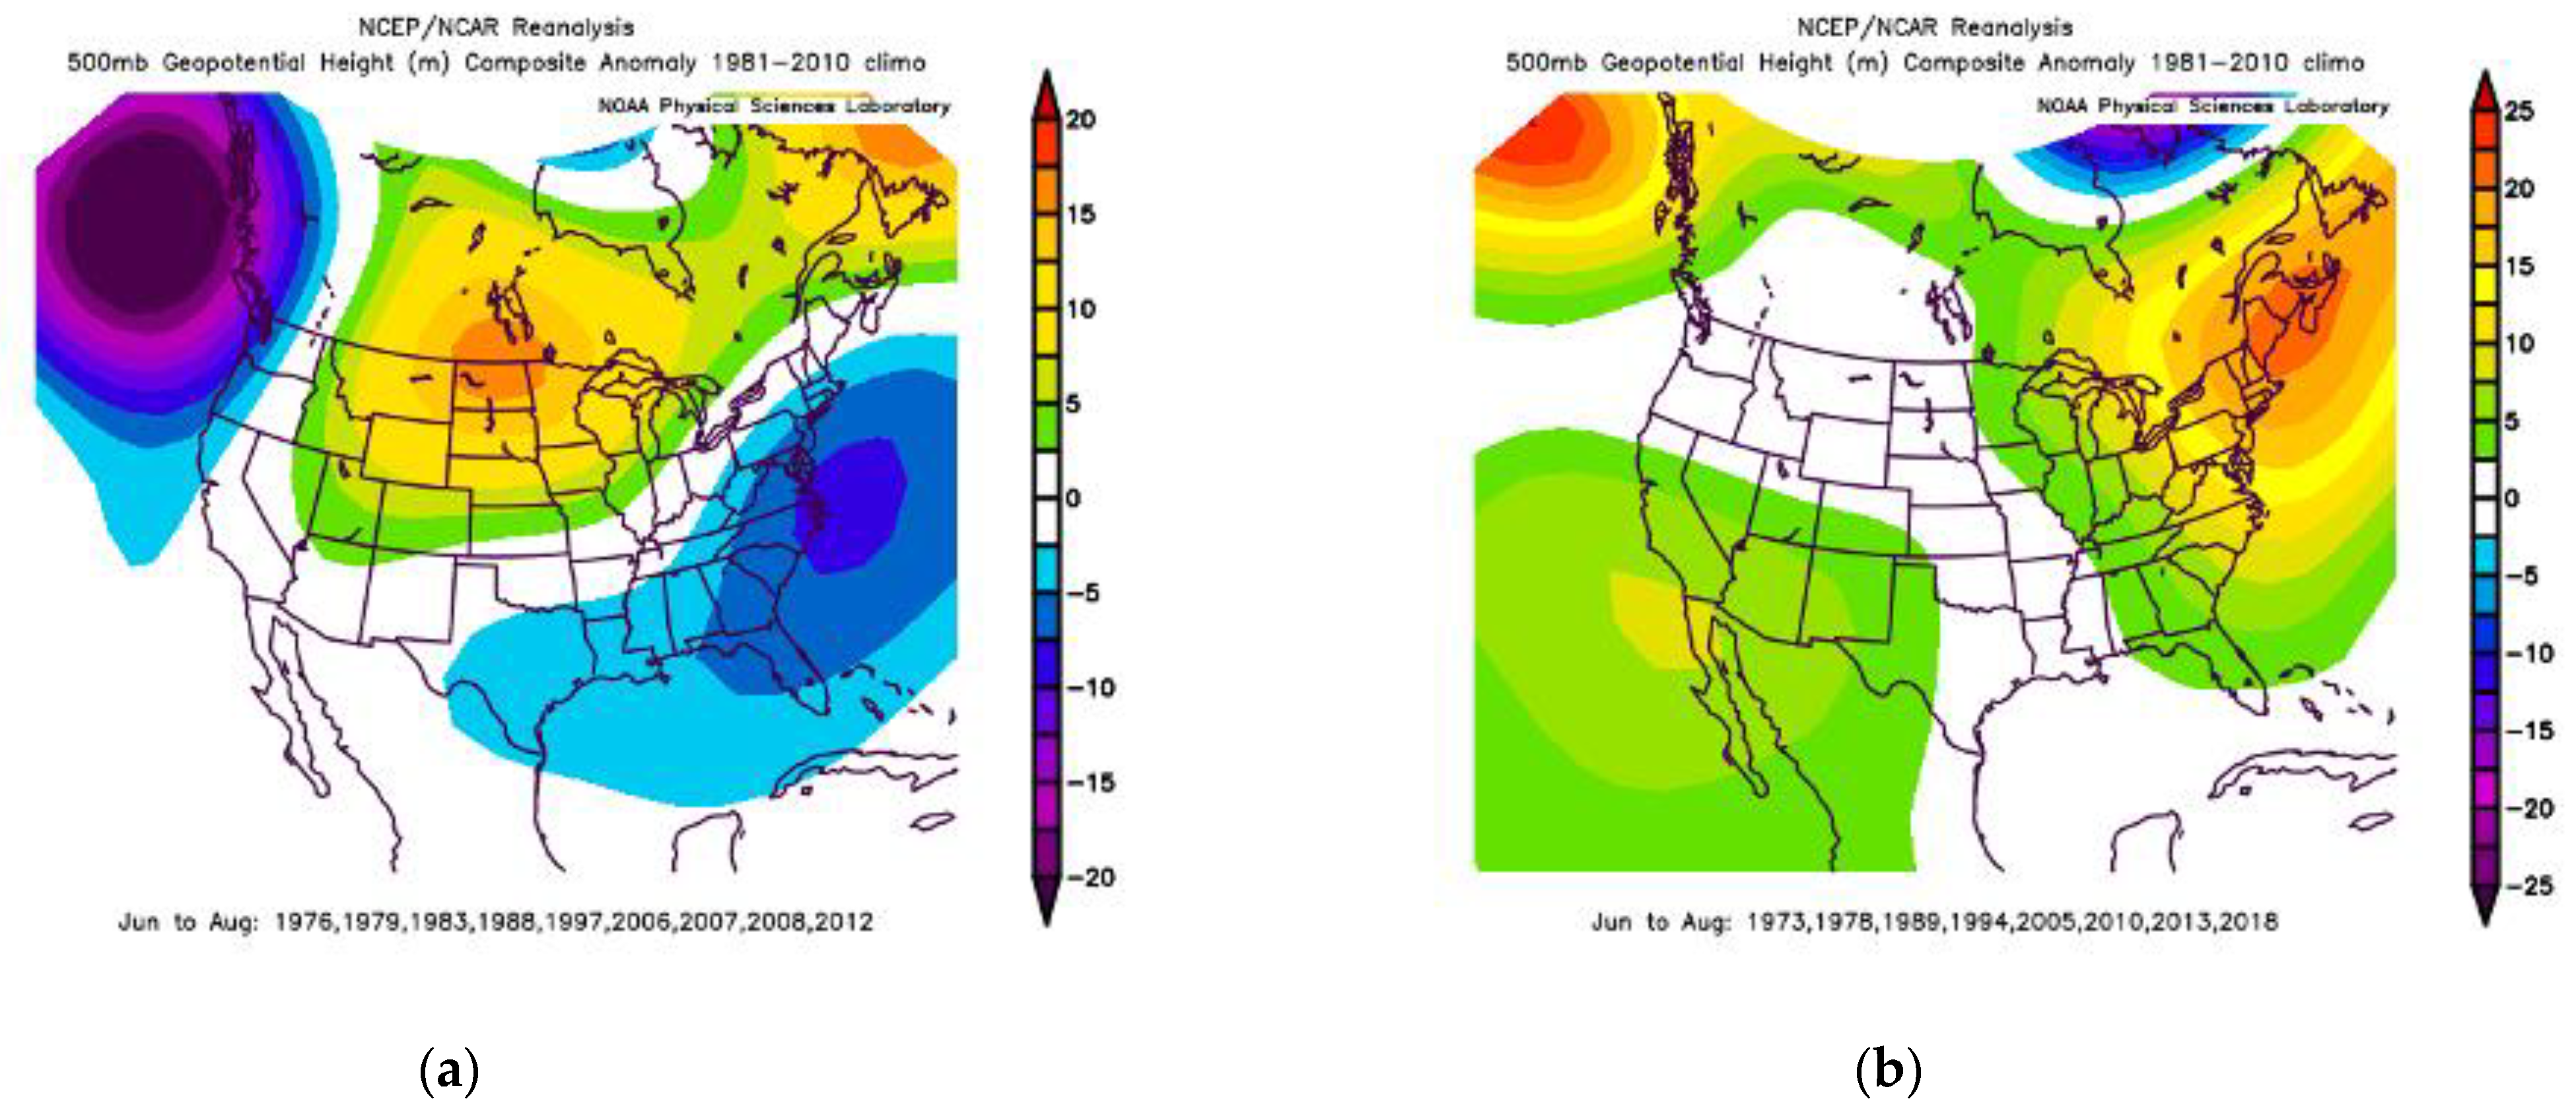
3.4. Synoptic Controls

An examination of the 500-hPa geopotential height data during years with above-average (>1.0 SD; n = 9) and below-average (<−1.0 SD; n = 8) regional cold-front hours demonstrates distinct synoptic patterns (Figure 4a,b). The years marked by above-average cold-front hours (1976, 1979, 1983, 1988, 1997, 2006, 2007, 2008, and 2012) experienced the hours when an anomalously deep low was centered off the western Canada coastline, ridging occurred in the northern Great Plains, and troughing occurred along the eastern USA coastline (Figure 4a). Conversely, summers with below-average cold-front hours (1973, 1978, 1989, 1994, 2005, 2010, 2013, and 2018) were marked by a high pressure centered over the North Pacific and the regions northeastern USA and southeastern Canada with a low pressure centered east of Hudson Bay, Canada (Figure 4b).
The synoptic pattern coincident with an increased summer cold-front activity in the study area is not a recognizable pattern associated with a low-frequency feature of the global atmospheric circulation. The pattern does resemble the short-term (days to weeks) positive phase of the wintertime Pacific North America (PNA) index. However, the summertime influence of PNA variability is minimal in our study area. The anomalous low pressure off of Mid-Atlantic USA and the upstream ridge over southern Canada and central USA (Figure 4a) and their associated circulations support the notion of a more frequent northerly airflow and cold advection in the study area. Similarly, the synoptic pattern associated with the least-active cold-front summers is not reflective of an obvious large-scale pattern forced by a known mechanism. Rather, the ridging in the interior of the continent appears to overlap with the spatial extent of the warming hole. This ridge position has been associated with the Atlantic Multidecadal Oscillation, modulated by possible interactions with the phase of the Pacific Decadal Oscillation (e.g., [16]).

4. Conclusions

Our results suggest that all three metrics of summertime cold-front activity (i.e., cold-front hours, cold-front days, multi-day cold-front events) remained stable at a regional scale during the 48-year study period. This regional-scale stability occurred during a period (i.e., 1973–2020) marked by significant increases in minimum, maximum, and average summertime temperatures in the southeastern USA. Trend analyses indicated that at the individual weather-station scale, the only significant changes in summer cold-front frequency/duration were decreases at a small number (i.e., three–five) of stations. These decreases, however, were unsupported by surrounding station data. Further, the majority of stations with significant decreases were those with the lowest total and mean annual cold-front activity throughout the study region (i.e., lower-latitude stations). Thus, the instances of observed significant decreases suggest minimal absolute decreases in cold-front weather. Additionally, the regional mean summer cold-front frequency and duration exhibited no significant trend during 1973–2020.
Among the range of explanations proposed for recent changes in the southeastern USA warming hole, variability in the warm-season cold-front activity has received little attention, despite evidence that the recent warming in the region is associated with changes in temperature extremes (reduced cool weather and increased warm weather; [4]). Specifically, increases in the daily minimum temperatures appear to have driven a recent warming in the southeastern USA. Thus, the near-absence of decreasing trends in the summer cool-weather frequency/duration in our results indicates that regional reductions in the summer cold-front activity are not key drivers of the observed regional-temperature trend. Although this raises an interesting question about the role of severe weather events in long-term climate trends, it also supports the notion that the warming hole arises from multiple forcings and may respond to different forcings by time period, season, and region, with anthropogenic aerosols as the primary driver of summer-temperature variability [3]. Based on our analyses, we posit that the observed weakening in the southeastern USA warming hole is the result of external and/or internal forcings unrelated to reductions in anomalously cool summer weather. Further research is needed to identify the specific forcing mechanisms related to the weakening of the warming hole and related to the anomalous synoptic-scale patterns identified here.

Supplementary Materials

The following supporting information can be downloaded at: https://www.mdpi.com/article/10.3390/meteorology1020014/s1, Figure S1: Data for cold front hours, cold front days, and multi-day cold front events for the 34 stations evaluated based on data from 1973–2020.

Author Contributions

Conceptualization, P.A.K. and J.T.O.; methodology, P.A.K., T.J.M. and J.T.O.; software, T.J.M.; validation, P.A.K., T.J.M. and J.T.O.; formal analysis, P.A.K. and T.J.M.; data curation, T.J.M., P.A.K. and J.T.O.; writing—original draft preparation, P.A.K., T.J.M. and J.T.O.; writing—review and editing, P.A.K., T.J.M. and J.T.O.; visualization, T.J.M. All authors have read and agreed to the published version of the manuscript.

Funding

This research received no external funding.

Acknowledgments

We thank the three reviewers for their constructive comments that improved the quality of the manuscript and we are grateful for the help of the Managing Editor.

Conflicts of Interest

The authors declare no conflict of interest.

References

  1. Neukom, R.; Steiger, N.; Gómez-Navarro, J.J.; Wang, J.; Werner, J.P. No evidence for globally coherent warm and cold periods over the preindustrial Common Era. Nature 2019, 571, 550–554. [Google Scholar] [CrossRef] [PubMed]
  2. Meehl, G.A.; Arblaster, J.M.; Chung, C.T. Disappearance of the southeast US “warming hole” with the late 1990s transition of the Interdecadal Pacific Oscillation. Geophys. Res. Lett. 2015, 42, 5564–5570. [Google Scholar] [CrossRef] [Green Version]
  3. Mascioli, N.R.; Previdi, M.; Fiore, A.M.; Ting, M. Timing and seasonality of the United States ‘warming hole’. Environ. Res. Lett. 2017, 12, 034008. [Google Scholar] [CrossRef] [Green Version]
  4. Fall, S.; Coulibaly, K.M.; Quansah, J.E.; El Afandi, G.; Ankumah, R. Observed Daily Temperature Variability and Extremes over Southeastern USA (1978–2017). Climate 2021, 9, 110. [Google Scholar] [CrossRef]
  5. Pan, Z.; Arritt, R.W.; Takle, E.S.; Gutowski, W.J., Jr.; Anderson, C.J.; Segal, M. Altered hydrologic feedback in a warming climate introduces a “warming hole”. Geophys. Res. Lett. 2004, 31, L17109. [Google Scholar] [CrossRef] [Green Version]
  6. Yu, S.; Alapaty, K.; Mathur, R.; Pleim, J.; Zhang, Y.; Nolte, C.; Eder, B.; Foley, K.; Nagashima, T. Attribution of the United States “warming hole”: Aerosol indirect effect and precipitable water vapor. Sci. Rep. 2014, 4, 1–10. [Google Scholar] [CrossRef] [PubMed] [Green Version]
  7. Partridge, T.; Winter, J.; Osterberg, E.; Hyndman, D.; Kendall, A.; Magilligan, F. Spatially distinct seasonal patterns and forcings of the US warming hole. Geophys. Res. Lett. 2018, 45, 2055–2063. [Google Scholar] [CrossRef]
  8. Meehl, G.A.; Arblaster, J.M.; Branstator, G. Mechanisms contributing to the warming hole and the consequent US east–west differential of heat extremes. J. Clim. 2012, 25, 6394–6408. [Google Scholar] [CrossRef]
  9. Lagerquist, R.; Allen, J.T.; McGovern, A. Climatology and variability of warm and cold fronts over North America from 1979 to 2018. J. Clim. 2020, 33, 6531–6554. [Google Scholar] [CrossRef]
  10. Robinson, P.J. Monthly variations of dew point temperature in the coterminous United States. Int. J. Climatol. A J. R. Meteorol. Soc. 1998, 18, 1539–1556. [Google Scholar] [CrossRef]
  11. ESRI. ArcGIS Desktop: Release 10.7; Environmental Systems Research Institute: Redlands, CA, USA, 2019. [Google Scholar]
  12. Chen, J.; Yang, S.; Li, H.; Zhang, B.; Lv, J. Research on geographical environment unit division based on the method of natural breaks (Jenks). Int. Arch. Photogramm. Remote. Sens. Spat. Inf. Sci. 2013, 3, 47–50. [Google Scholar] [CrossRef] [Green Version]
  13. O’Sullivan, D.; Unwin, D. Geographic Information Analysis; John Wiley & Sons: Hoboken, NJ, USA, 2010. [Google Scholar]
  14. Eichler, P.; Shulman, M.D. A note on the climatology of the backdoor cold fronts. Natl Weather Dig. 1987, 12, 14–16. [Google Scholar]
  15. Bosart, L.F.; Pagnotti, V.; Lettau, B. Climatological aspects of eastern United States back-door cold frontal passages. Mon. Weather. Rev. 1973, 101, 627–635. [Google Scholar] [CrossRef]
  16. Ortegren, J.T.; Maxwell, J.T. Spatiotemporal Patterns of Drought/Tropical Cyclone Co-occurrence in the Southeastern USA: Linkages to North Atlantic Climate Variability. Geogr. Compass 2014, 8, 540–559. [Google Scholar] [CrossRef]
Figure 1. (a) Mean summertime cold-front hours during 1973–2020 by station and interpolated for the southeastern USA. Circle size indicates magnitude while open circles indicate a significant decrease in cold-front hours. (b) Regional annual mean values of cold-front hours with trendline (p > 0.05).
Meteorology 01 00014 g001
Figure 2. (a) Summertime cold-front days as determined by the occurrence of dew-point temperatures < 15.56 °C for >12 h/day(s) per event by station (graduated circles) and interpolated for the southeastern USA. Stations with open circles indicate a significant decrease in cold-front days. (b) Regional annual mean values of cold-front days with trendline (p > 0.05).
Meteorology 01 00014 g002
Figure 3. (a) Multi-day cold-front frequency during June–August as defined by consecutive days with >12 h of dew-point temperatures < 15.56 °C by station (graduated circles) and interpolated for the southeastern USA. Stations with open circles each indicate a significant decrease in multi-day cold-front frequency. (b) Regional annual mean values of multi-day cold-front events with trendline (p > 0.05).
Meteorology 01 00014 g003
Figure 4. Geopotential height anomalies of 500 hPa during summers with above-average (n = 9); (a) and below-average (n = 8); (b) regional cold-front hours. Map source: NOAA Physical Sciences Laboratory.
Meteorology 01 00014 g004
Table 1. Yearly averaged data for cold-front hours, cold-front days, and multi-day cold-front events for the 34 stations evaluated based on data from 1973–2020.
ASOS Station CodeStation NameLatitudeLongitudeCold-Front HoursCold-Front DaysMulti-Day Cold-Front Events
AHNAthens, GA33.95−83.33179.466.291.58
ATLAtlanta, GA33.63−84.44208.067.461.83
AVLAsheville, NC35.43−82.54381.0013.713.50
BHMBirmingham, AL33.57−86.74150.944.831.35
BNANashville, TN36.12−86.69281.489.962.75
CAEColumbia, SC33.94−81.12155.814.981.40
CHAChattanooga, TN35.04−85.20201.816.561.81
CHSCharleston, SC32.90−80.0455.211.50.44
CLTCharlotte, NC35.22−80.95271.3510.192.83
CSGColumbia, GA32.52−84.94131.384.331.08
DABDaytona Beach, FL29.18−81.066.830.150.04
DCAArlington, VA38.85−77.03476.2518.215.04
EYWKey West, FL24.56−81.761.100.000.00
GNVGainesville, FL29.69−82.2814.540.190.06
GSOGreensboro, NC36.10−79.94331.4012.753.35
GSPGreenville, SC34.88−82.22249.159.292.48
HOPHopkinsville, KY36.67−87.50308.0411.133.42
HSVHuntsville, AL34.64−86.79185.676.151.65
HTSHuntington, WV38.37−82.56463.3318.215.08
JAXJacksonville, FL30.49−81.6911.900.210.21
LEXLexington, KY38.04−84.61512.6919.635.25
MCNMacon, GA32.69−83.65103.922.980.79
MCOOrlando, FL28.43−81.315.380.040.02
MEMMemphis, TN35.06−89.99193.316.962.00
MGMMontgomery, AL32.30−86.3982.942.480.56
MIAMiami, FL25.79−80.322.020.060.02
POBFayetteville, NC35.17−79.01214.277.582.15
RDURaleigh, NC35.88−78.79253.699.292.83
ROARoanoke, VA37.32−79.97516.2119.695.10
SAVSavannah, GA32.13−81.2042.060.940.23
SDFLouisville, KY38.17−85.74457.9216.674.50
TLHTallahassee, FL30.39−84.3536.440.810.21
TPATampa, FL27.96−82.544.150.040.02
VPSValparaiso, FL30.48−86.5337.901.150.27
Publisher’s Note: MDPI stays neutral with regard to jurisdictional claims in published maps and institutional affiliations.

