Abstract
On 15 September 2022, a flood affected the Marche region, an Italian region that faces the Adriatic Sea. Unlike previous floods that affected the same area, no typical weather system, such as cyclones or synoptic fronts, caused the recorded extreme precipitation. In fact, the synoptic situation was characterized by a zonal flow, which normally does not cause intense precipitation over that area. The aim of this study was to understand which ingredients led to extraordinary precipitation in the region. ERA5 and the Weather Research Forecast (WRF) model were used to describe the synoptic situation and to reproduce rainfall. While limited area models with a horizontal resolution of a few km failed to forecast the precipitation, as confirmed by a WRF simulation with a horizontal resolution of 3 km, reducing the horizontal grid spacing to about 500 m improved the rain’s reproducibility. Together with a zonal flow that interested most of Italy, an atmospheric river starting in the eastern Mediterranean Sea transported moisture over the region. The interaction between the zonal flow and orography resulted in frontogenesis in the Apennine Lee. This process deformed the thermal structures in the area and created conditions of convective instability, transforming the moisture into copious rainfall. Moreover, ERA5 and the time series of observed rainfall from 1959 to 2022 were used to explore whether similar events, in terms of geopotential height configuration and rainfall, occurred in the past. Three metrics were employed to compare the event’s 700 hPa geopotential height pattern with all the other patterns, and the result was that the event was unique in the sense that a zonal flow, like that observed during the event of 15 September 2022, had never produced such an amount of precipitation in the time range considered, while all the events with the highest rainfall were usually associated with cyclonic structures.
1. Introduction
Intense precipitation events in Italy can be divided into two broad categories: those caused by single storms, often supercells, such as the one that led to a flash flood in Tuscany in 1996 [1], and those caused by synoptic systems. Miglietta and Davolio (2022) [2] reviewed all types of systems leading to heavy precipitation and floods over Italy.
The synoptic systems can be divided into two categories: cyclones, both Atlantic and Mediterranean, and fronts. These weather systems collect and transport large amounts of water vapor, which, when uplifted in the atmosphere by the system itself or by orographic features, transforms into clouds and rain, sometimes leading to heavy precipitation. Occasionally, these systems produce intense rainfall locally due to their slow movement [3].
While Atlantic cyclones, originating over the Atlantic Ocean, are associated with intense precipitation that can affect all regions of Italy, they predominantly impact the northern and central parts of the country [3], but the southern region can be heavily affected [4]. When cyclogenesis takes place in the Mediterranean region, another class of synoptic weather occurs: the Mediterranean cyclones, which usually cause intense precipitation over Italy. The most well-known of these is the Genoa cyclone, which forms in the lee of the Alps over the Gulf of Genoa [5]. Once developed, these cyclones generally move eastward or southeastward. The specific location and persistence of a cyclone over a particular area can determine the likelihood of a flooding event. Even when a cyclone is located far north, for example, over the British Isles, and not directly over the Italian Peninsula, a prolonged trough drives the arrival of moist pre-frontal flows. These flows, when they encounter the orography of northern Italy, can produce very high rainfall rates over the Piedmont and Ligurian regions [6].
Two main synoptic systems that facilitate significant precipitation in Central Italy have been identified [2]. They are associated with precipitation systems affecting either the western or eastern regions, sustained by moist low-level currents flowing through the Tyrrhenian Sea or Adriatic Sea, respectively. The initial category encompasses an upper-level trough, sometimes associated with an orographic cyclone over the Gulf of Genoa, together with a cold front progressing across the Italian peninsula from the west. The second category pertains to a cut-off low situated over the Tyrrhenian Sea, which generates cyclonic circulation in the central Mediterranean, leading to a robust bora flow across the Adriatic Sea. This engagement with the Apennines results in significant precipitation. Despite being a relatively small and shallow basin, the Adriatic Sea plays a pivotal role during high-impact events that compromise critical infrastructure. This primarily occurs through air-sea interactions [7], which can be especially intense during bora events. A low-pressure system located over the central Mediterranean produces cyclonic bora [8] in the northern and central Adriatic basins, often leading to precipitation and high winds affecting the eastern portion of the Central Italy regions. For instance, on 14 September 2012, intense rainfall exceeding 150 mm within a few hours occurred primarily along the central Italian coastline, where convective systems in the middle Adriatic basin were triggered by low-level wind convergence between the cooler northeasterly bora and the moist, warm southeasterly sirocco, which were subsequently advected inland. Furthermore, orographic uplift on the eastern slopes of the Apennines produced stratiform precipitation, with its interaction with the mountains leading to intense rainfall.
A major and destructive flood affected the Marche region between 15 September and 16 September 2022. The Marche region is located between the Adriatic Sea to the east and bordered by the Apennine mountains to the west (Figure A1). The heaviest rainfall occurred on the afternoon of September 15, and within 12 h, several stations, particularly inland, recorded accumulated rainfall exceeding 100 mm/12 h. The flood claimed the lives of 13 people and caused damages estimated in the billions of euros. Since the critical rainfall period lasted for more than 6 h and affected several river basins, the 2022 Marche flood cannot be classified as a flash flood.
The Marche region had experienced other intense precipitation and flood events prior to 15 September 2022, although not all the events have garnered much attention in the scientific literature. The geomorphology of the Marche region includes many west–east rivers with torrential characteristics, making them particularly sensitive to rainfall intensity. For example, in 2014, a flood affected Senigallia and other localities along the Misa River on May 3 (https://emergency.copernicus.eu/mapping/list-of-components/EMSR083 (accessed on 30 October 2024)). That event was caused by intense rainfall associated with an isolated cyclone generated over the Gulf of Genoa, which moved over the central Italian regions.
The flood of 15 September 2022 also affected the Misa River area, but at that time, there was neither a cyclone nor a large-scale front driving water vapor over the region, and although an interaction with the orography was visible, the synoptic pattern does not fall in the two categories described by Miglietta and Davolio (2022) [2]. The synoptic situation indicated a typically large-scale zonal flow, which is not usually associated with intense precipitation. The aim of this work was to study the meteorological ingredients that led to the intense precipitation in that area, investigate the possible reasons for inaccurate forecasts, and assess whether this event was unique from a meteorological point of view.
2. Materials and Methods
The aim of this study is twofold. Firstly, the study wanted to investigate the ingredients that led to this exceptional event. The event led to the highest precipitation ever recorded in the region, according to available data from 1951. ERA5 reanalysis was used to focus on the synoptic patterns, and for dynamical downscaling, the Weather Research and Forecasting (WRF) model was employed to reproduce the rainfall pattern. It was set in two configurations: (1) a broad domain covering Europe with nested grids at 9 and 3 km resolutions, defined as WRF-CHAPTER, and (2) a high-resolution domain focused on the Marche region with a nested grid resolution of 9 km. Secondly, this study endeavored to investigate the uniqueness of this event compared to other synoptic situations, considering that its primary feature was a zonal flow, a feature typically not associated with high precipitation in the region. To achieve this, the ERA5 700 hPa geopotential of the event was used to compare all the events from 1951 to 2022, together with the rainfall recorded in the region. To compare the 700 geopotential height patterns, three metrics described below were used.
ERA5 [9] is a cutting-edge global climate reanalysis dataset generated by the ECMWF as part of the Copernicus Climate Change Service. This dataset represents the fifth generation of ECMWF reanalysis products, succeeding ERA-Interim. ERA5 improves on its predecessor with better horizontal spatial and temporal resolutions (0.25° and 1 h, respectively). ERA5 incorporates additional observational data, including ozone-sensitive infrared radiance and reprocessed datasets not previously used. In 2017, ERA5 released its data assimilation system, which operates in 12 h time windows and provides extensive coverage from 1940 to the present. It is continually updated with a two-month delay. ERA5 releases its initial evaluation, known as ERA5T, five days in advance of real time. The real ERA5 products (i.e., validated) are usually released after three months with respect to real time.
ERA5 was also used to run the WRF model in two configuration simulations, one with two nested domains at 9 and 3 km (WRF-CHAPTER), used to create a 42-year dataset available at the Leibniz Supercomputing Center [10], and another focused on the Marche region having a 0.55 km horizontal resolution for the innermost domain. Figure A2 shows the domains of these WRF simulations.
The WRF-CHAPTER version, with a 9 and 3 km horizontal resolution, had a large domain covering almost all of Europe [10], and its version was 4.1.1. The model has a finer grid spacing (3 km) that is well-suited for dynamical downscaling, covering a much greater area than earlier efforts [11,12]. The Yonsei University scheme [13] was used for planetary boundary layer turbulence closure, while the RRTMG shortwave and longwave radiation schemes [14,15] and the Rapid Update Cycle scheme for a multi-level soil model (six levels) with higher resolution in the upper soil layer (0, 5, 20, 40, 160, and 300) were employed. The grid spacing in the innermost domains (with a horizontal resolution of 3 km) allowed for the resolution of convection dynamics, so no cumulus scheme was used. The outer domain (with a grid spacing of 9 km) used the New Simplified Arakawa-Schubert (NewSAS) convection strategy [16]. The NewSAS mass flux scheme is based on the Pan and Wu model [17]. It has new entrainment and detrainment formulas that are based on simulations of large eddies. To enhance deep convection, the maximum permissible mass flux at the cloud base was increased.
The other WRF simulation focused on the Marche region with three nested domains (see Figure A2), starting from 8800 m horizontal resolution for the outermost domain to the finest grid resolution of 0.55 m for the innermost domain. The WRF version was 4.4.1. The microphysics scheme used was the WRF Single-Moment 3-class and 5-class Schemes [18], along with the Yonsei University Scheme for the Planetary Boundary Layer [13]. The outermost domain used the Tiedtke Scheme for convection parameterization [19,20]. As in the higher-resolution version described earlier, the RRTMG Shortwave and Longwave Schemes [14] were employed for radiation. The surface scheme was the Noah-MP Land Surface Model [21].
To determine the uniqueness of the event, the ERA5 700 hPa geopotential height was used to compare it with other events that shared similar patterns in the 700 hPa geopotential height. Additionally, we recorded the precipitation values in three localities, Arcevia, Frontone, and Cantiano, which have the longest time series. This allowed us to compare past events with the September 15 event. The time series considered ranged from 1959 to 2022.
Observed rainfall data used in this paper were extracted from SCIA, the Italian “National System for Climate Data Collection, Processing, and Dissemination”, at the Italian Institute for Environmental Protection and Research (ISPRA) [22], available at https://scia.isprambiente.it/servertsdailyutm/serietemporalidaily400.php (accessed on 30 October 2024), and from the rain gauges at Civil Protection of Marche, which are available at http://app.protezionecivile.marche.it/sol/indexjs.sol?lang=en (accessed on 30 October 2024). This dataset was used to show the amount of rainfall recorded during the event and to investigate whether similar synoptic situations led to high precipitation values.
The approach of comparing similarities between two events involves defining a few metrics. This task is as those defined in Tartaglione et al. (2009) [23] and Sato and Kusaka (2021) [24]. Specifically, three metrics related to the Euclidean norm, correlation, and the S1 score [25] were used to measure similarity of the geopotential heights at 700 hPa, of all events with the same field observed at 12 UTC on 15 September 2022.
As in Tartaglione et al. (2009) [23], the first metric, based on the Euclidean norm, is defined as
where denotes the value of the geopotential at 700 hPa for the n-th day from 1 January 1959 at the grid point j, where e is the event of 15 September 2022; the metric was computed over a domain shown in Figure A2.
It was transformed using a logarithmic scale with the following equation:
Finally, a normalization between 0 and 1 was applied. In this way, the score could be divided into ten classes, with values in the first class representing the events most similar to the 15 September event.
It has been demonstrated that among many metrics used to show similarity between two baric configurations, the S1 score is one of the most effective [24]. Therefore, the following equation defines the S1 score:
It was treated analogously to the metric M1. A logarithm was first applied:
followed by normalization to obtain the M2 metrics. The values lower than 0.1 define the events that are more similar to the target event of 15 September.
The Pearson correlation is the basis for the third metric:
Where is the 700 hPa geopotential average over the comparison domain Figure A2. Then, the correlation value is transformed using the following equation:
This transformation converts the range of −1 to 1 into a range of 0.1 to 1. Finally, this metric underwent normalization within the range of 0–1.
This approach has a limit, defined from the fact that it is needed to set a threshold in the metrics to define a number of similar events to that observed in September 2022. Thus, intense precipitation can occur with a similar configuration to that of September 2022 but not chosen by this method. Therefore, to show the converse relationship, i.e., that intense precipitation events are not associated with these configurations, the first twenty events where the rain gauge of Cantiano recorded more than 95 mm in 24 h were taken. The choice of 95 mm was due to the necessity to set a threshold in precipitation, considering that the highest value of rainfall recorded in Cantiano was 419 mm on 15 September 2022, a value that is three times the second highest value. The choice of 100 mm would have led to selecting less than 20 events, so the decision to have 20 events led to setting the threshold at 95 mm.
3. Results
3.1. Synoptic Description
The Marche region experienced devastating rainfall on the afternoon and evening of 15 September 2022, resulting in the rapid overflow of some rivers, including Cesano, Misa, Candigliano, Burano, and Sentino. Among the most severely impacted were the towns of Cantiano and Sassoferrato, where the Burano and Sentino rivers, respectively, breached their banks. The overflow of the Misa River led to widespread flooding in Barbara, a few villages along the river’s course, and the coastal town of Senigallia (Figure 1). The inundation left behind catastrophic damage to infrastructure and property, as well as tragic loss of life. A detailed mapping of the affected areas can be seen using synthetic aperture radar analysis [26]. This provides a comprehensive picture of how far-reaching and severe the flooding was.
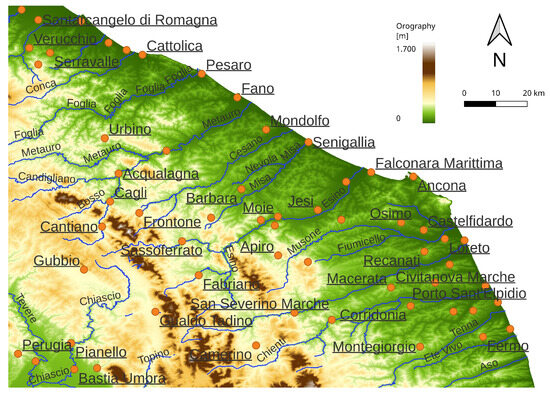
Figure 1.
Topographic map of the region affected by the flood of 15 September 2022 with locality names underlined, while the names of the rivers are not. Figure A1 shows the location of the Marche region in Europe.
Most of the precipitation fell upstream in the mountainous regions, compounding the downstream flooding. On 15 September, rain gauges in Frontone, Arcevia, and Sassoferrato recorded totals nearing 200 mm, while gauges within the Misa and Esino Valleys registered rainfall above 100 mm, whereas the highest rainfall was recorded in Cantiano, with 419 mm (Figure 2). This concentration of intense rainfall in upstream areas created conditions ripe for river overflow and flash flooding in the downstream valleys.
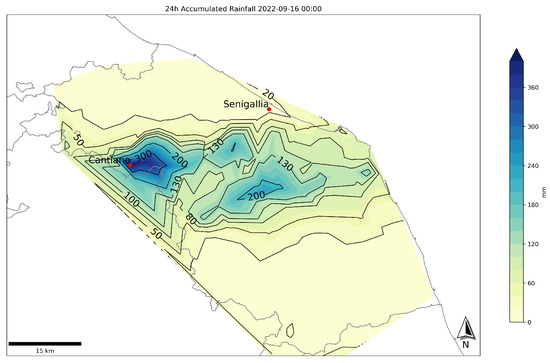
Figure 2.
The isohyet map for rainfall recorded on 15 September 2022 using Marche rain gauges.
The rainfall event was not anticipated by numerical weather prediction models, which particularly struggled to forecast the event’s intensity and resultant flooding accurately [27]. The event unfolded in the early afternoon, beginning with the triggering of several convective systems near Cantiano, at the western Marche border. Shortly thereafter, local atmospheric instability contributed to the formation of multicell line storms, which organized in a west-to-east orientation. This alignment of storms facilitated continuous, intense rainfall over the same areas, amplifying the severity of flooding as each successive cell contributed to the accumulating rainfall.
At 12 UTC on 15 September 2022, the geopotential height isolines at 500 and 700 hPa were almost perpendicular to the Apennine Mountains (Figure 3). This shows that there is a predominant zonal flow pattern (Figure 4). High specific humidity values at 850 hPa accompany this zonal flow, suggesting an abundant moisture supply. The configuration of these humidity values formed a long, narrow filament, a structure consistent with an atmospheric river, which appears to originate from approximately 5°East and 35°North, extending northeastward across the Mediterranean and into Eastern Europe. This moisture pathway point to a significant influx of water vapor from the Mediterranean’s southwestern regions, a critical factor in the intense rainfall observed in this case over the Marche region. It has been shown that atmospheric rivers can be a key ingredient to produce extraordinary precipitation in some Italian regions [28]. The Mediterranean Sea is a major moisture source, but remote moisture comes most of the time from the Atlantic Ocean [29].
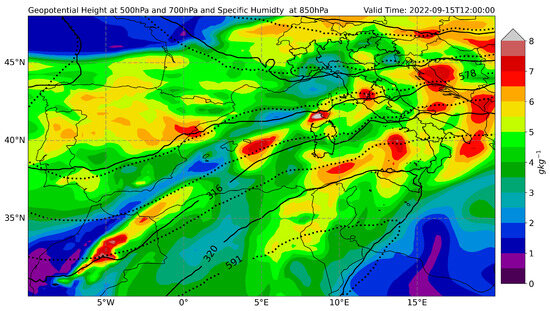
Figure 3.
The ERA5 specific humidity (g/kg) at 850 hPa (shaded) and the geopotential height (dam) at 500 hPa (dotted lines) and 700 hPa (solid lines) at 12 UTC on 15 September 2022.
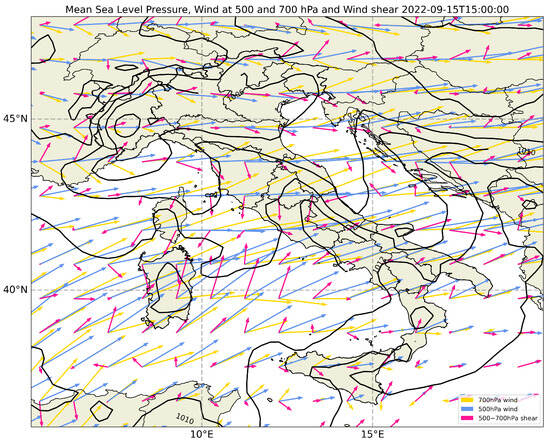
Figure 4.
The mean sea level pressure (contour), ERA5 wind at 500 hPa and 700 hPa, and wind shear at 12 UTC on 15 September 2022.
Figure 4 shows the geopotential heights at 500 and 700 hPa that remained nearly parallel over the western Mediterranean Sea, indicating minimal change in wind speed with height and resulting in weak vertical wind shear (Figure 4). This weak shear suggests a relatively stable stratification over the sea, which typically does not favor strong vertical mixing. However, as this flow approached Central Italy, the presence of the Apennine Mountains introduced substantial orographic effects. Over the mountainous terrain, the wind shear increased due to the curvature of isobars around the Apennines, causing variations in wind speed and direction that were more pronounced than over the adjacent western sea.
The orographic influence modified the pressure distribution, creating a barrier effect that effectively blocks the zonal flow upstream. As a result, a ridge formed at the mean sea level pressure upstream of the Apennines, supporting the zonal flow at 700 hPa over the western portion of Central Italy. Meanwhile, a trough extended from northern Italy into the Marche region, downstream of the zonal flow at 700 hPa (Figure 3). The interaction between the ridge and trough intensified local atmospheric instability, which, along with the significant moisture availability, fueled intense rainfall over the eastern slopes of the Apennines and adjacent areas.
The Apennine orography influenced not only the lower atmospheric layers but also extended to the 700 hPa level. The mountain range and the zonal flow changed the height contours, warping them to make the flow convergence better at the thermal gradient, which was roughly perpendicular to the flow direction. A warm air tongue at 700 hPa and cold air advection over the Marche region at 500 hPa made the convergence stronger, creating conditions that were favorable for convective instability (Figure 5).
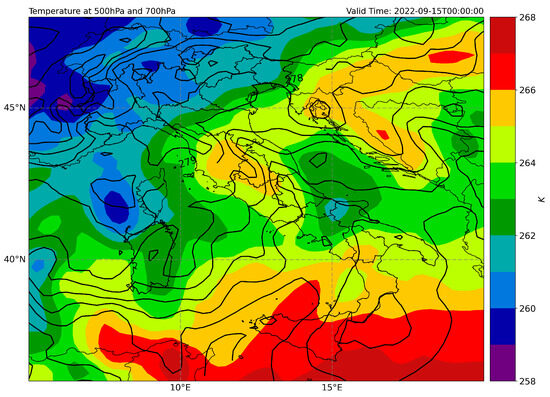
Figure 5.
The ERA5 temperature at 500 hPa (shaded) and 700 hPa (contour) at 12 UTC on 15 September 2022.
At the synoptic scale, warm advection originating from the western part of northern Africa moved toward Italy. The mountainous terrain modified this warm air influx, reshaping the temperature gradient’s orientation and strength, effectively setting up conditions for frontogenesis.
Frontogenesis is defined as the change in the magnitude of the horizontal potential temperature gradient:
Frontogenesis, which intensifies temperature gradients and often leads to cloud formation and precipitation, became apparent over the Marche region as early as 12 UTC on 15 September (Figure 6a). Initially, despite the strong frontogenetic forcing, the lack of substantial precipitable water prevented significant rainfall. During the day, this frontogenesis continued (Figure 6b,c), and it was not until 12 UTC, when the specific humidity level rose enough, that all the conditions were right to start convective cells that could bring heavy rain. In this scenario, as illustrated in Figure 6, frontogenesis occurred along the northern edge of a substantial thermal ridge that spanned from North Africa to the Italian Peninsula. An upper-level cold thermal trough extended from northern Europe to Spain, with the Marche region lying between the boundaries of these two thermal systems, with the Apennine orography blocking the zonal flow and creating favorable conditions for convective instability on the mountain slopes.
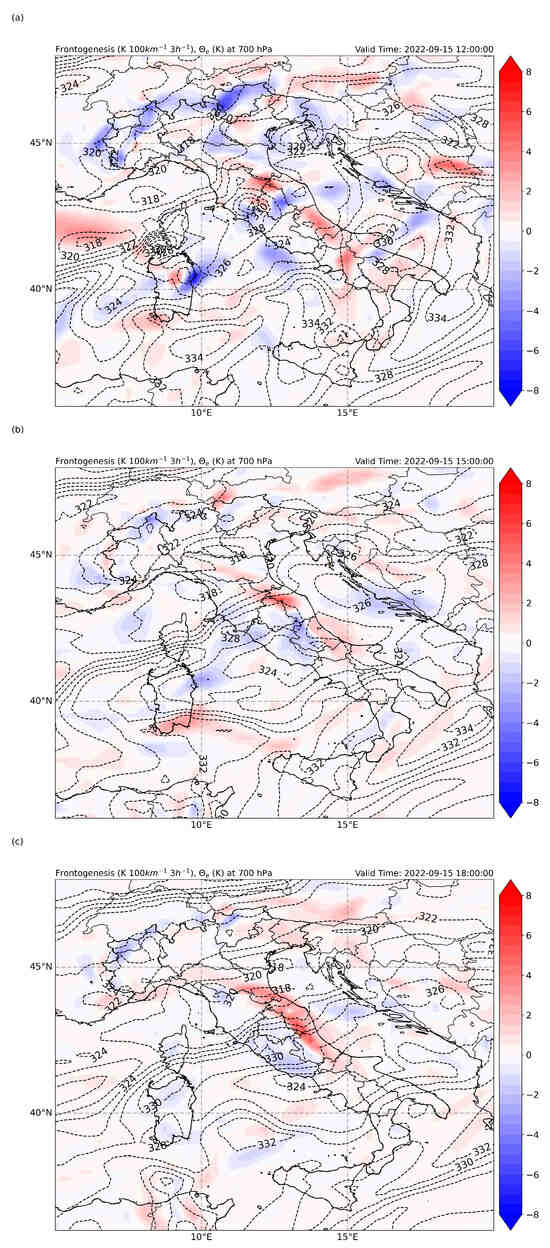
Figure 6.
Frontogenesis (k (100 km)−1 (3 h)−1); equivalent potential temperature (K) at 700 hPa at 12 (a), 15 (b), and 18 (c) UTC on 15 September 2022.
The zonal flow aligned with the corresponding potential temperature field, revealing a significant temperature gradient in the equivalent potential temperature field. The gradient, along with westerly moisture advection, created optimal conditions for convective activity as humidity levels increased when approaching the Apennine mountains.
During frontogenesis, the horizontal potential temperature differential intensifies, a phenomenon frequently associated with dynamic mechanisms that facilitate cloud formation and precipitation. The interaction between the zonal flow and the Apennine orography distorted the flow, enhancing frontogenesis. This, along with favorable atmospheric conditions, substantially contributed to the excessive precipitation in the Marche region. The Apennine mountains affected not only the lower atmospheric layers but also reached up to the 700 hPa pressure level. When the zonal flow encountered the mountain range, it altered the height contours, enabling the flow to converge near the thermal gradient, which was nearly perpendicular to the flow direction. A warm air tongue at the 700 hPa level and cold air advection over the Marche region at the 500 hPa level further enhanced convergence, fostering conditions favorable for convective instability (see Figure 5).
3.2. WRF Simulations
The Weather Research and Forecasting (WRF) model simulation, run at a coarse resolution of 3 km × 3 km over a large domain covering most of continental Europe and the entire Mediterranean region, indicated a maximum accumulated rainfall of only 80 mm over the event area within a 24 h period (Figure 7). This simulation significantly underestimated the intense rainfall that characterized the actual event, despite using hourly ERA-5 reanalysis data as initial and boundary conditions. This underestimation is consistent with other models that similarly missed the event’s magnitude, as documented in Bryant et al. (2023) [30].
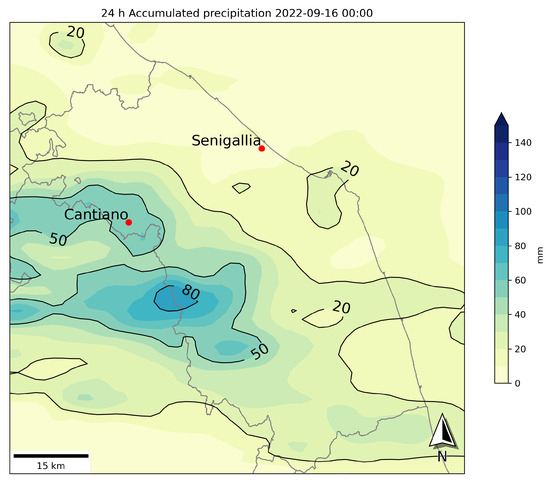
Figure 7.
Accumulated rainfall over 24 h on 15 September 2022, from the WRF simulation at a 3 km × 3 km grid resolution. The gray lines denote the administrative boundaries. The locations of Cantiano and Senigallia are also shown.
This WRF simulation was not able to reproduce the heavy rainfall recorded. It was able to capture the location of the rainfall above the mountains, which are upstream of the Misa and Esino valleys. However, the model predicted an absolute maximum of 80 mm over the region, which was further south than the observed precipitation. Similarly, over Cantiano, the model predicted a relative maximum that was almost one-tenth of the observed value, approximately 50 mm.
To try to improve the simulation, a second WRF simulation was run using a smaller domain and employing three nested grids, allowing to achieve a high spatial resolution of 0.55 km. The initial and boundary conditions were established using hourly ERA5 reanalysis. This finer-resolution simulation produced a maximum rainfall accumulation of 156 mm in 24 h (Figure 8). In general, the simulation was unable to predict the maximum rainfall. In the literature [31], there was an attempt to increase the maximum rainfall predicted by WRF by assimilating lightning. This attempt was successful in increasing the maximum predicted rainfall, albeit at a value less than half of the maximum recorded at Cantiano. The high-resolution simulation also captured the localization of rainfall over the Misa Valley, though it missed some precipitation in the southernmost part of the affected area. Therefore, this model accurately predicted most of the precipitation along an east–west line, just over the Misa Valley. However, this line was north of the observed line, and it did not predict the precipitation over the Esino Basin very well. Both simulations had explicit convection in the innermost domains; hence, this eliminated potential biases from convection schemes, which should represent the most impactful parameterization scheme.
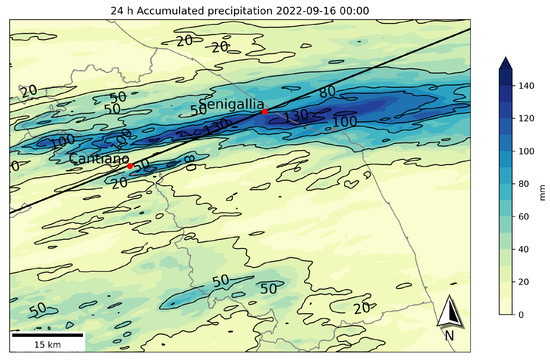
Figure 8.
Accumulated rainfall over 24 h on 15 September 2022, from the WRF simulation at a 0.55 km × 0.55 km grid resolution. The gray lines denote the administrative boundaries. The locations of Cantiano and Senigallia are also shown. The cross-sectional analysis took place on the black line.
The high-resolution WRF configuration reveals several important features of the event. Particularly between Cantiano and Senigallia, the precipitable water values rose, indicating a concentrated moisture supply near the Misa Valley. Over the next few hours, there was a gradual northward shift in the water vapor supply, contributing to sustained moisture availability over the affected areas.
However, there are some problems even with this simulation, where precipitation over Cantiano is small, although there is a relative maximum nearby.
In Figure 3, it is stressed that specific humidity aligned along the geopotential isolines may have contributed as an atmospheric river. Precipitable water is defined as water that integrates along the column.
This precipitable water inflow can also be seen in the equivalent potential temperature field, which shows an environment that is ready to become unstable, and in the reflectivity field from the WRF simulation (Figure 9). During the morning hours, cloud formation was apparent, though these clouds did not reach the stratosphere, and reflectivity values remained relatively low. At 13:00 UTC, though, areas with high reflectivity appeared in the north branch of the line between Cantiano and Senigallia. This showed that strong convective cells were starting to form (Figure 9a).
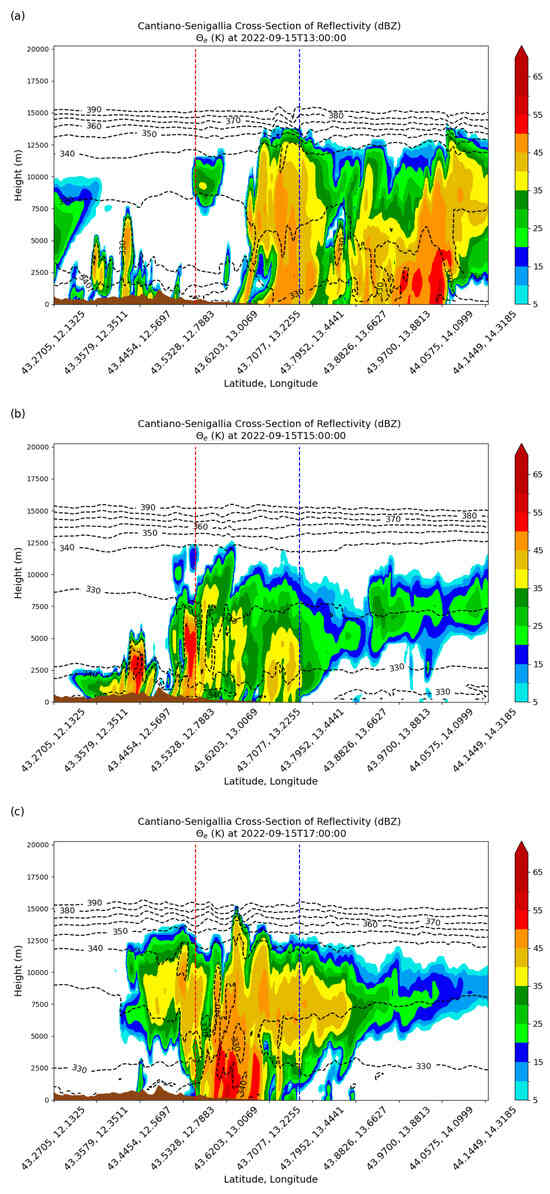
Figure 9.
Equivalent potential temperature (K) and simulated reflectivity at 13 (a), 15 (b), and 17 (c) UTC as simulated by WRF having a 0.55 km horizontal resolution. The cross section was taken along the black line in Figure 8. The red and blue vertical lines are the locations of Cantiano and Senigallia, respectively.
At 15:00 UTC (Figure 9b), convective clouds had formed both upstream and downstream of Cantiano, marking the intensification of the storm. At 17:00 UTC (Figure 9c), these convective systems persisted in the area of Cantiano, with rainfall impacting the Misa Valley throughout the remainder of the day. The Misa River, which flows into the Adriatic Sea at Senigallia, overflowed due to this persistent rainfall, leading to severe flooding in Senigallia and throughout the Misa Valley.
4. Searching for Similar Events
The Marche region has experienced some floods in the past. For instance, other flood events occurred in the Marche region in 2011 and in 2014. In both cases, distinct cyclones caused the flood. This time, the synoptic picture reveals an apparent zonal flow, which typically does not trigger such intense and destructive rainfall events over the Marche region, to the best of the author’s knowledge. This is due to the typically humid westerly flow, which usually results in intense rainfall in the western regions, but that downstream the Apennines becomes drier, with an absence of precipitation over the region. Actually, that day the rainfall was forecast over the regions that are to the west of the Apennines [30]. However, the intense precipitation primarily affected the eastern part. This raises the question of whether similar baric configurations caused previous heavy rains in the region. The geopotential height at 700 hPa at 12 UTC was selected over a region encompassing the Marche region between 1959 and 2021, and the metrics described in Section 2 were used to identify the events that are more similar to the event described here. It is known from the lesson of Lorenz (1969) [32] that finding similar configurations, or analogs, when using more variables and more than one level is practically impossible. Hence, the analysis was limited to a single level, also called soft analogs [23]. The area where the comparison was performed is represented by the pink polygon in Figure A2.
Table 1 shows the results using the metric defined by Equations (2) and (4) and using values that are lower than 0.1. The metric M1 has four events, and all of them appear in the results of M2, which has five. The events that are similar following the metric M3, which is related to correlation, are fourteen (Table 2). There is one event that appears in all the metrics; it occurred on 23 May 2021. The event that occurred on 6 July 1966 was among those selected by the metrics M2 and M3. Most of the events lacked rainfall, and when it did occur, the recorded amount was only a few millimeters.

Table 1.
Events with a geopotential height of 700 hPa, similar to that of 15 September 2022, with rainfall (in mm) recorded at the rain gauges of Arcevia, Frontone, and Cantiano using the metrics M1 and M2.
Table 2.
Events with a geopotential height of 700 hPa, similar to that of 15 September 2022, with rainfall (in mm) recorded at the rain gauges of Arcevia, Frontone, and Cantiano, using the metric M3.
In contrast to Table 1, which displays events with a metric value less than 0.1, Table 2 displays results with a metric value greater than 0.98. This choice was made to compare a limited number of cases with our reference event. Using a lower value, such as 0.9, would result in an excessive number of events (631). As it can be seen, many of the events in Table 1 and Table 2 occurred during the summer season, like that on 15 September 2022. This indicates that zonal flow is a common feature of the summer season in that region. However, based on the available data, these baric configurations, which bear a striking resemblance to the event under investigation in this paper, did not result in intense rainfall.
Figure 10 shows the 700 hPa geopotential height for all nineteen events, which have a more similar configuration to the event that occurred on 15 September 2022, together with the event itself, which is the first panel. The event from 6 July 1966 appears twice in Figure 10 for visual purposes. All the events clearly display a zonal flow. Not all the events present high values of specific humidity. The events that occurred on 31 January 2002 and 19 October 2011 had very low values of specific humidity at 850 hPa. Using an eyeball comparison, the event that occurred on 6 July 1966 exhibited a similar configuration of specific humidity to that of 15 September 2022, with the specific humidity filament extending from the southwest corner of North Africa toward Italy; however, the rainfall recorded at Arcevia, Frontone, and Cantiano was limited to 6.6 mm in 24 h. On 16 August 1963, there was another instance of zonal flow and water vapor transport. Arcevia, Frontone, and Cantiano recorded a rainfall of less than 5 mm in 24 h.
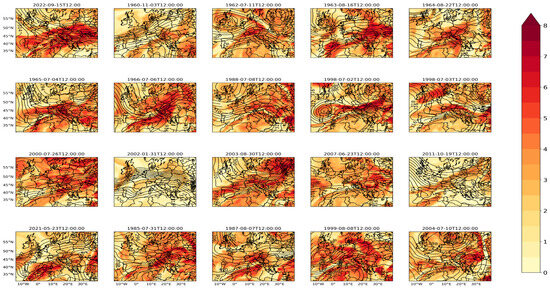
Figure 10.
ERA5 700 hPa geopotential height (contours, in dam) and specific humidity at 850 hPa (shading, in g/kg) of the events that resemble the event that occurred on 15 September 2022, using the metrics M1, M2, and M3 (see text). The bottom row displays the events that exhibit similarities based on the metrics M1 and M2. The event that took place on 23 May 2021 bears the greatest resemblance to the reference event.
Therefore, a zonal flow is not normally associated with heavy precipitation in the region. However, cyclonic structures are associated with all heavy precipitation events. The 700 hPa geopotential height and specific humidity at 850 hPa of the twenty events with the highest rainfall values recorded by the rain gauges of Cantiano are shown in Figure 11. The first panel of Figure 11 shows the 15 September 2022 event, which was the event with the most rainfall in absolute terms. None of the 19 events with rainfall exceeding 95 mm exhibits a 700 hPa geopotential height similar to that of 15 September 2022.
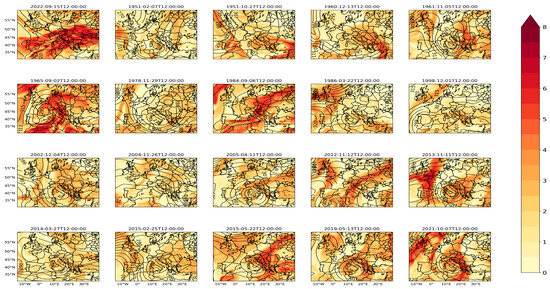
Figure 11.
The ERA5 700 hPa geopotential height (contours, in dam) and specific humidity at 850 hPa (shading, in g/kg) that contributed to precipitation exceeding 95 mm at the Cantiano station. On 15 September 2022, the station recorded 419 mm of rainfall. All the other events are arranged chronologically.
5. Discussion
While Atlantic and Mediterranean cyclones are known to trigger intense precipitation events in the Marche region, the 15 September event was unusual due to the predominance of a zonal flow at the synoptic scale across the region. Despite zonal flows generally being associated with minimal or no rainfall, this event produced over 100 mm of rainfall in less than 12 h, concentrated over the Central Apennines and along the Misa and Esino Rivers (Figure 1 and Figure 2).
This significant precipitation resulted from the convergence of several factors. The affected area lay at the boundary of a thermal ridge to the south, bringing warm air from North Africa, and a thermal trough to the north, drawing in colder air from Northern Europe. A zonal flow then transported additional humid air from the southwest sector of the Mediterranean Sea. Observing the narrow, localized pattern of rainfall suggests that an atmospheric river acted as a primary moisture source. The American Meteorological Society defines an atmospheric river as a long, narrow corridor of strong horizontal water vapor transport; in this case, moisture from the southwest Mediterranean supplied the atmospheric river with water vapor necessary for sustained precipitation.
The presence of the Apennines, which are perpendicular to the zonal flow, distorted the flow, resulting in frontogenesis, a phenomenon that modified the thermal configuration. This interaction generated a warm air tongue in the lower atmosphere and a cold air tongue aloft, establishing conditions for significant instability in the region. However, as illustrated in Figure 6, frontogenesis alone was inadequate to initiate the observed precipitation; the arrival of humid air in the early afternoon was necessary to achieve the event’s full intensity.
Comparing similar events with the 700 hPa geopotential height reveals that these types of geopotential patterns typically do not result in heavy rainfall over the Marche region. This highlights the exceptional nature of this event from a meteorological perspective.
6. Conclusions
This study presents an investigation of a significant precipitation event that transpired in the Marche region on 15 September 2022. This event was characterized by a few key ingredients, culminating in a catastrophic occurrence that resulted in the loss of life and damage to the environment, property, and infrastructure.
In summary, three primary elements contributed to the extreme rainfall in the Marche region. First, the thermal structure of the atmosphere featured warm air to the south and cold air to the north, creating a pronounced temperature gradient. Second, the zonal flow’s interaction with regional topography produced frontogenesis, which altered the boundary layer’s thermal structure. Third, humid air from the western Mediterranean, likely channeled through an atmospheric river, provided the moisture supply essential for intense precipitation.
The event was unique because a zonal flow usually does not produce intense precipitation, or even no rain at all. Except for September 2022, all events with intense precipitation (i.e., with rainfall higher than 95 mm) involved a cyclonic structure.
Funding
This research received no external funding.
Data Availability Statement
ERA5 can be downloaded from the climate data store https://cds.climate.copernicus.eu/ (accessed on 30 October 2024); WRF-CHAPTER rainfall can be downloaded from https://doi.org/10.25927/0ppk7-znk14 (accessed on 30 October 2024). The other WRF results can be provided by the author. Observed rainfall can be downloaded from the SCIA website (in Italian), https://scia.isprambiente.it/servertsdailyutm/serietemporalidaily400.php (accessed on 30 October 2024), and from the Civil Protection Department of the Marche region: http://app.protezionecivile.marche.it/sol/indexjs.sol?lang=it (accessed on 30 October 2024). The author can provided any data upon request.
Acknowledgments
The Italian Civil Protection is acknowledged for the rain gauge data.
Conflicts of Interest
The author declares no conflicts of interest.
Appendix A
In this appendix, there are two complementary figures.

Figure A1.
Topography of the European region and toponyms used in the article. The red line delimits Italy, the gray line delimits the Marche region, and the black line indicates the Line of the Apennines.
Figure A1.
Topography of the European region and toponyms used in the article. The red line delimits Italy, the gray line delimits the Marche region, and the black line indicates the Line of the Apennines.


Figure A2.
WRF domains, with green and orange boxes used in WRF having 9 km × 9 km and 3 km × 3 km horizontal resolutions; black, blue, and red are for the very high-resolution (8.8, 2.2, and 0.55 km horizontal resolutions) WRF and domain used for searching events similar to the one that occurred on 15 September 2022 in ERA5 data (pink box).

References
- Meneguzzo, F.; Pasqui, M.; Menduni, G.; Messeri, G.; Gozzini, B.; Grifoni, D.; Rossi, M.; Maracchi, G. Sensitivity of meteorological high-resolution numerical simulations of the biggest floods occurred over the Arno River basin, Italy, in the 20th century. J. Hydrol. 2005, 288, 37–56. [Google Scholar] [CrossRef]
- Miglietta, M.M.; Davolio, S. Dynamical forcings in heavy precipitation events over Italy: Lessons from the HyMeX SOP1 campaign. Hydrol. Earth Syst. Sci. 2022, 26, 627–646. [Google Scholar] [CrossRef]
- Tartaglione, N.; Speranza, A.; Dalan, F.; Nanni, T.; Brunetti, M.; Maugeri, M. The mobility of Atlantic baric depressions leading to intense precipitation over Italy: A preliminary statistical analysis. Nat. Hazards Earth Syst. Sci. 2006, 6, 451–458. [Google Scholar] [CrossRef]
- Avolio, E.; Federico, S. WRF simulations for a heavy rainfall event in southern Italy: Verification and sensitivity tests. Atmos. Res. 2018, 209, 14–35. [Google Scholar] [CrossRef]
- Tibaldi, S.; Buzzi, A.; Speranza, A. Orographic cyclogenesis. In Palmen Memorial Volume; Newton, C.W., Holopainen, E.O., Eds.; American Meteorological Society: Boston, MA, USA, 1990; pp. 107–127. [Google Scholar]
- Buzzi, A.; Tartaglione, N.; Malguzzi, P. Numerical Simulations of the 1994 Piedmont Flood: Role of Orography and Moist Processes. Mon. Wea. Rev. 1998, 126, 2369–2383. [Google Scholar] [CrossRef]
- Davolio, S.; Henin, R.; Stocchi, P.; Buzzi, A. Bora wind and heavy persistent precipitation: Atmospheric water balance and role of air–sea fluxes over the Adriatic Sea. Q. J. Roy. Meteor. Soc. 2017, 143, 1165–1177. [Google Scholar] [CrossRef]
- Horvath, K.; Ivatek-Šahdan, S.; Ivančan-Picek, B.; Grubišić, V. Evolution and structure of two severe cyclonic Bora events: Contrast between the northern and southern Adriatic. Weather Forecast. 2009, 24, 946–964. [Google Scholar] [CrossRef]
- Hersbach, H.; Bell, B.; Berrisford, P.; Hirahara, S.; Horányi, A.; Muñoz-Sabater, J.; Nicolas, J.; Peubey, C.; Radu, R.; Schepers, D.; et al. The ERA5 global reanalysis. Q. J. R. Meteorol. Soc. 2020, 146, 1999–2049. [Google Scholar] [CrossRef]
- Tartaglione, N.; Parodi, A.; Bernini, L.; Hachinger, S.; Kranzlmüller, D. CHAPTER: 3 × 3 km Meteorological Data 1981–2022 for Europe: 2D Extracted Fields [Data Set]; Leibniz Supercomputing Centre (LRZ): Garching, Germany, 2024. [Google Scholar] [CrossRef]
- Raffa, M.; Reder, A.; Marras, G.F.; Mancini, M.; Scipione, G.; Santini, M.; Mercogliano, P. VHR-REA_IT Dataset: Very High Resolution Dynamical Downscaling of ERA5 Reanalysis over Italy by COSMO-CLM. Data 2021, 6, 88. [Google Scholar] [CrossRef]
- Giordani, A.; Cerenzia, I.M.L.; Paccagnella, T.; Di Sabatino, S. SPHERA, a new convection-permitting regional reanalysis over Italy: Improving the description of heavy rainfall. Q. J. Roy. Meteorol. Soc. 2023, 149, 781–808. [Google Scholar] [CrossRef]
- Hong, S.Y.; Noh, Y.; Dudhia, J. A new vertical diffusion package with an explicit treatment of entrainment processes. Mon. Wea. Rev. 2006, 134, 2318–2341. [Google Scholar] [CrossRef]
- Iacono, M.J.; JDelamere, J.S.; Mlawer, E.J.; Shephard, M.W.; Clough, S.A.; Collins, W.D. Radiative forcing by long–lived greenhouse gases: Calculations with the AER radiative transfer models. J. Geophys. Res. 2008, 113, D13103. [Google Scholar] [CrossRef]
- Mlawer, E.J.; Taubman, S.J.; Brown, P.D.; Iacono, M.J.; Clough, S.A. Radiative transfer for inhomogeneous atmospheres: RRTM, a validated correlated–k model for the longwave. J. Geophys. Res. 1997, 102, 16663–16682. [Google Scholar] [CrossRef]
- Han, J.; Pan, H. Revision of Convection and Vertical Diffusion Schemes in the NCEP Global Forecast System. Weather Forecast. 2011, 26, 520–533. [Google Scholar] [CrossRef]
- Pan, H.-L.; Wu, W.-S. Implementing a Mass Flux Convective Parameterization Package for the NMC Medium-Range Forecast Model. NMC Office Note 409, 1995; p. 40. Available online: https://repository.library.noaa.gov/view/noaa/11429 (accessed on 20 October 2024).
- Hong, S.; Dudhia, J.; Chen, S. A Revised Approach to Ice Microphysical Processes for the Bulk Parameterization of Clouds and Precipitation. Mon. Weather Rev. 2004, 132, 103–120. [Google Scholar] [CrossRef]
- Tiedtke, M. A comprehensive mass flux scheme for cumulus parameterization in large–scale models. Mon. Weather Rev. 1989, 117, 177–1800. [Google Scholar] [CrossRef]
- Chunxi, Z.; Wang, Y.; Hamilton, K. Improved representation of boundary layer clouds over the southeast pacific in ARW–WRF using a modified Tiedtke cumulus parameterization scheme. Mon. Weather Rev. 2011, 139, 3489–3513. [Google Scholar] [CrossRef]
- He, C.; Valayamkunnath, P.; Barlage, M.; Chen, F.; Gochis, D.; Cabell, R.; Schneider, T.; Rasmussen, R.; Niu, G.Y.; Yang, Z.L.; et al. The Community Noah–MP Land Surface Modeleling System Technical Description, Version 5.0, No. NCAR/TN-575+STR; NCAR Publisher: Boulder, CO, USA, 2023. [Google Scholar] [CrossRef]
- Desiato, F.; Fioravanti, G.; Fraschetti, P.; Perconti, W.; Toreti, A. Climate indicators for Italy: Calculation and dissemination. Adv. Sci. Res. 2011, 6, 147–150. [Google Scholar] [CrossRef]
- Tartaglione, N.; Maugeri, M.; Dalan, F.; Brunetti, M.; Nanni, T.; Speranza, A. Searching for resemblance between large-scale sea level pressure patterns leading to “intense” precipitation events over Italy. Theor. Appl. Climatol. 2009, 95, 183–196. [Google Scholar] [CrossRef]
- Sato, T.; Kusaka, H. Statistical Intercomparison of Similarity Metrics in Sea Level Pressure Pattern Classification. J. Meteorol. Soc. Jpn. 2021, 99, 993–1001. [Google Scholar] [CrossRef]
- Teweles, S.H. Wobus Verification of prognostic charts. Bull. Amer. Meteor. Soc. 1954, 35, 455–463. [Google Scholar] [CrossRef][Green Version]
- Pulvirenti, L.; Squicciarino, G.; Fiori, E.; Candela, L.; Puca, S. Analysis and Processing of the COSMO-SkyMed Second Generation Images of the 2022 Marche (Central Italy) Flood. Water 2023, 15, 1353. [Google Scholar] [CrossRef]
- Marche, Centro Funzionale Regionale Regione. Rapporto di Evento Preliminare, Maltempo 15, 16 e 17 Septembre 2022. Available online: https://www.regione.marche.it/portals/0/Protezione_Civile/Manuali%20e%20Studi/Rapporto_Evento_preliminare_20220915.pdf (accessed on 16 October 2024).
- Davolio, S.; Vercellino, M.; Miglietta, M.M.; Pitura, L.D.; Laviola, S.; Levizzani, V. The Influence of an Atmospheric River on a Heavy Precipitation Event over the Western Alps. Weather Clim. Extrem. 2022, 39, 100542. [Google Scholar] [CrossRef]
- Duffourg, F.; Ducrocq, V. Origin of the moisture feeding the Heavy Precipitating Systems over Southeastern France. Nat. Hazards Earth Syst. Sci. 2011, 11, 1163–1178. [Google Scholar] [CrossRef][Green Version]
- Bryant, S.; Köhler, L.; Murdock, H.; Voit, P.; Wassmer, J. Marche Floods 2022. Available online: https://storymaps.arcgis.com/stories/2b53ae1dbde44cd19dae9ed3a22b8aed (accessed on 20 October 2024).
- Torcasio, R.C.; Papa, M.; Del Frate, F.; Dietrich, S.; Toffah, F.E.; Federico, S. Study of the Intense Meteorological Event Occurred in September 2022 over the Marche Region with WRF Model: Impact of Lightning Data Assimilation on Rainfall and Lightning Prediction. Atmosphere 2023, 14, 1152. [Google Scholar] [CrossRef]
- Lorenz, E.N. Atmospheric Predictability as Revealed by Naturally Occurring Analogues. J. Atmos. Sci. 1969, 26, 636–646. [Google Scholar] [CrossRef]


Disclaimer/Publisher’s Note: The statements, opinions and data contained in all publications are solely those of the individual author(s) and contributor(s) and not of MDPI and/or the editor(s). MDPI and/or the editor(s) disclaim responsibility for any injury to people or property resulting from any ideas, methods, instructions or products referred to in the content. |
© 2025 by the author. Licensee MDPI, Basel, Switzerland. This article is an open access article distributed under the terms and conditions of the Creative Commons Attribution (CC BY) license (https://creativecommons.org/licenses/by/4.0/).