

Dynamical Mechanisms of Rapid Intensification and Multiple Recurvature of Pre-Monsoonal Tropical Cyclone Mocha over the Bay of Bengal

 , , ,
, , ,
Abstract
:1. Introduction
2. Data and Methodology
3. Pre-Monsoon Season Tropical Storms Climatology and Landfall over BIMSTEC Countries During Recent Decades (2004–2023)
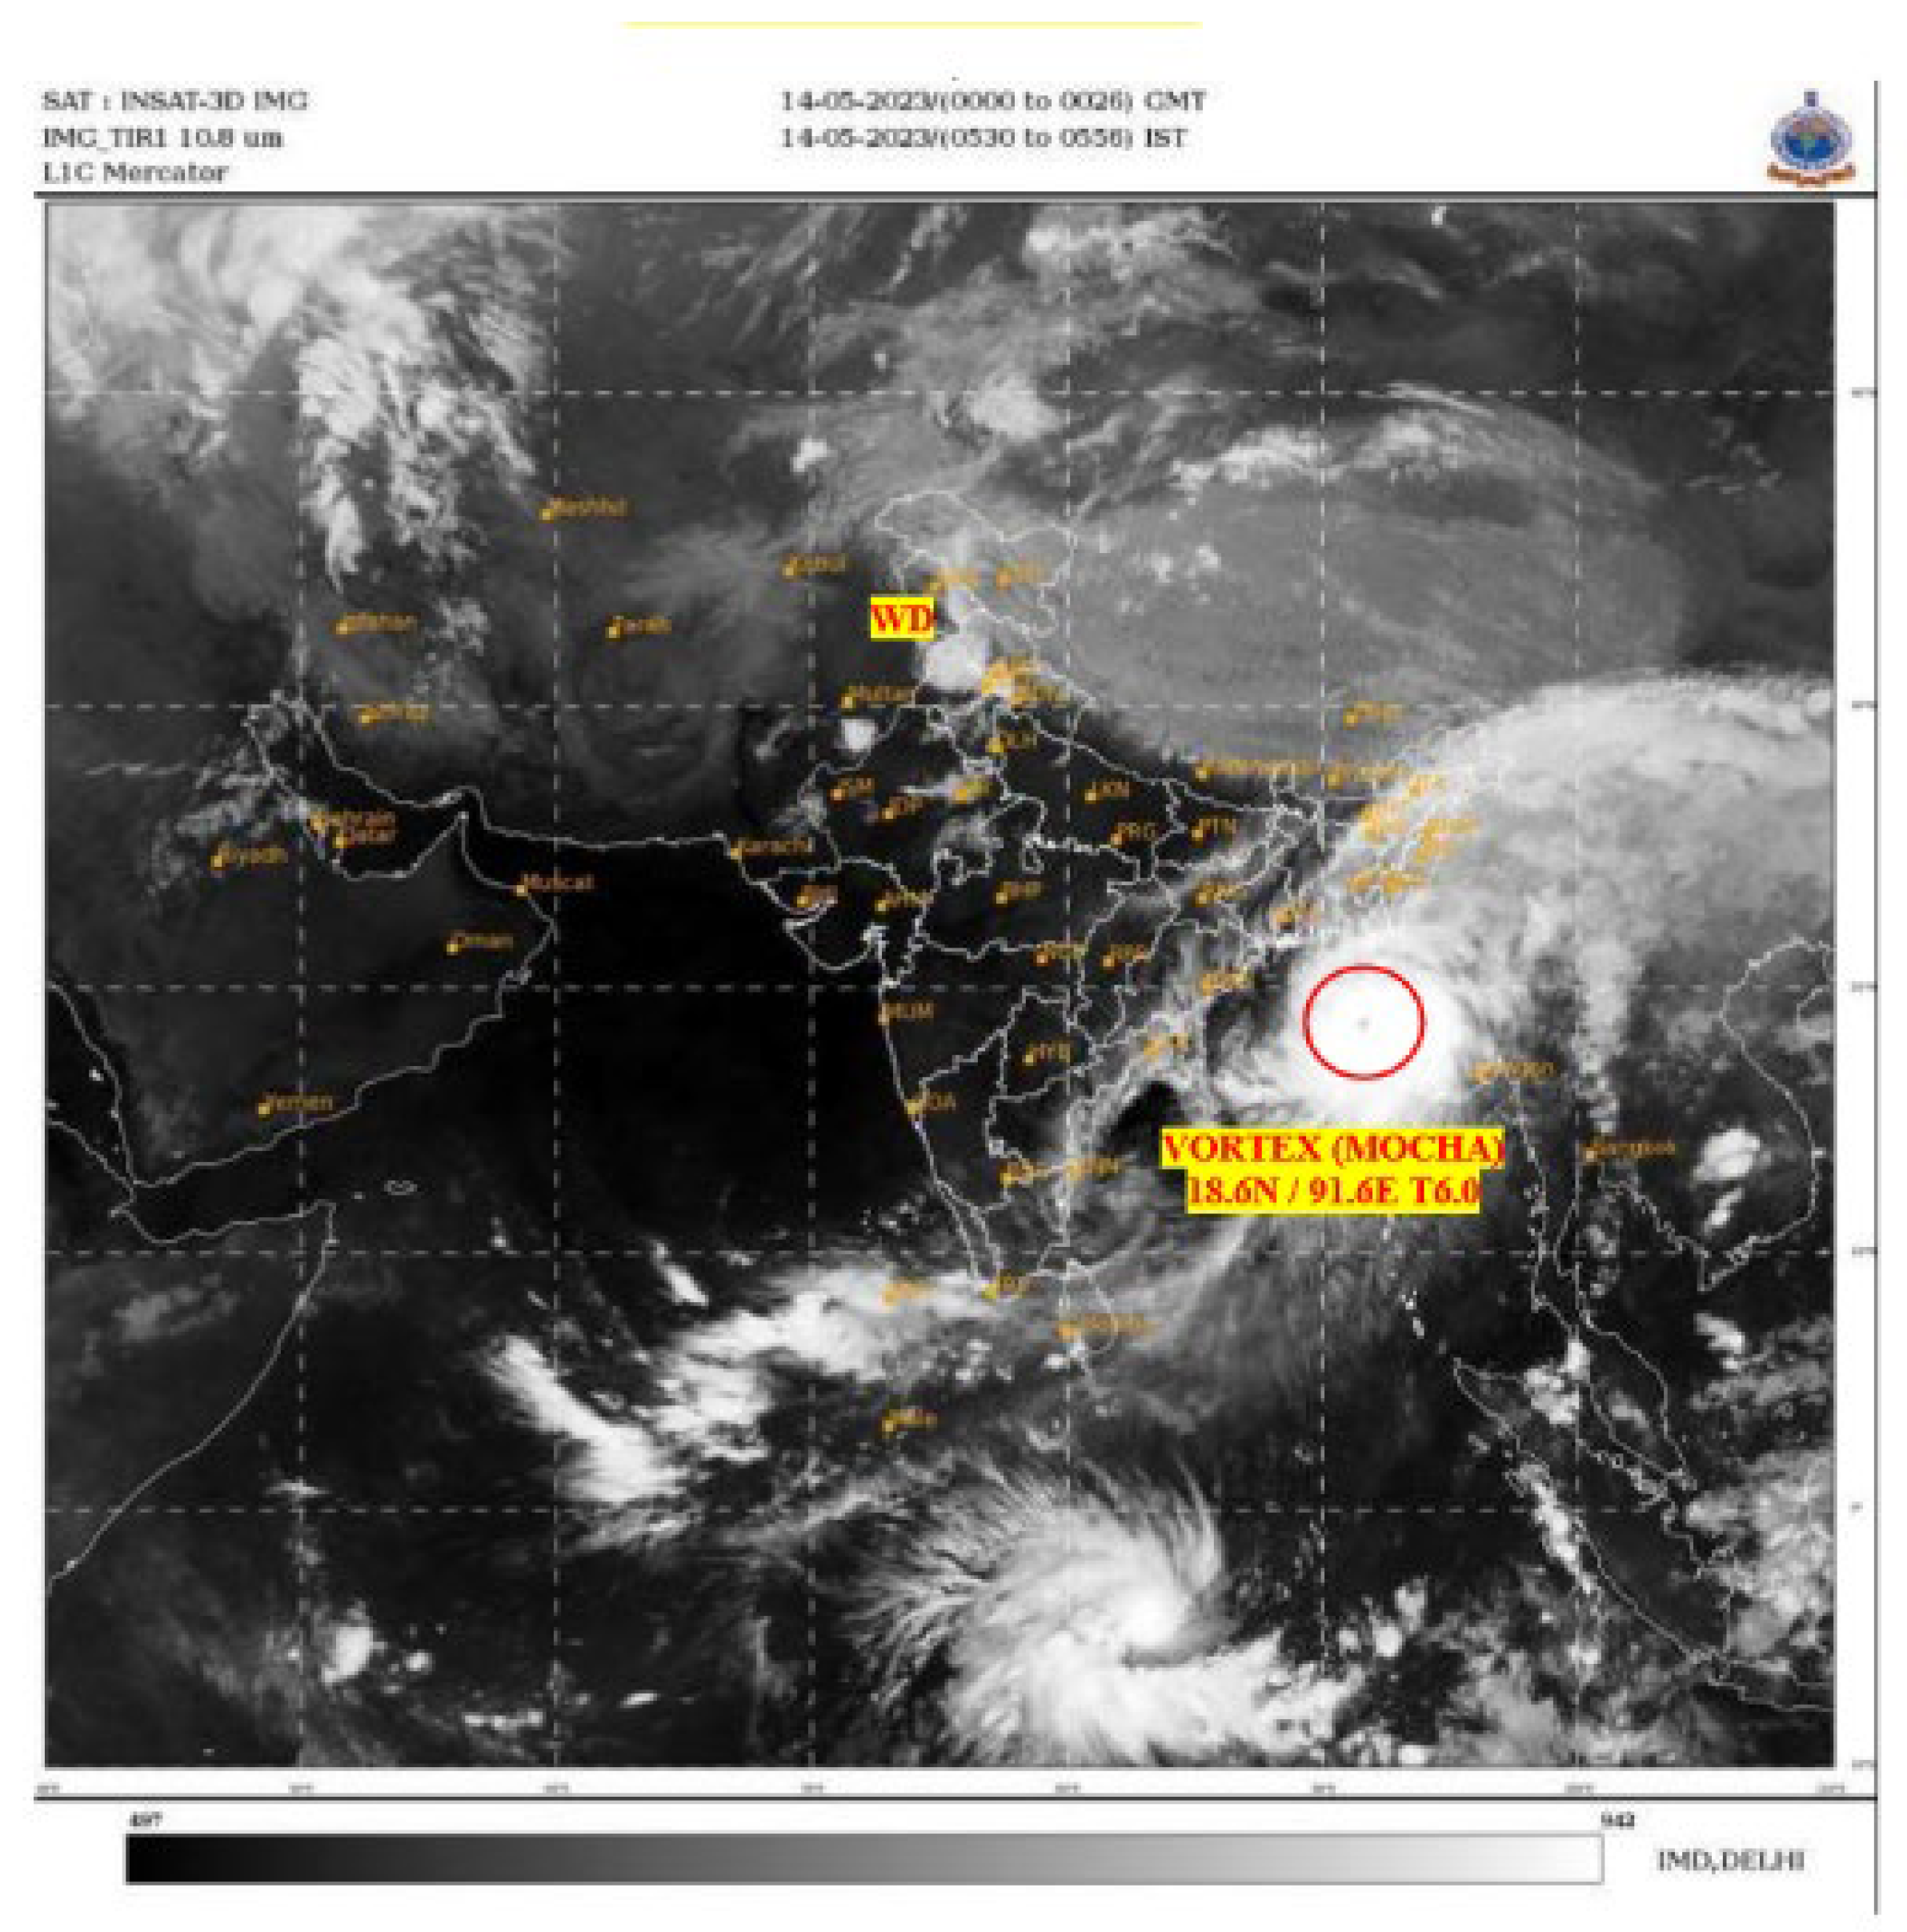
3.1. Favorable Condition for the Genesis of Mocha
- (a)
- Synoptic conditions
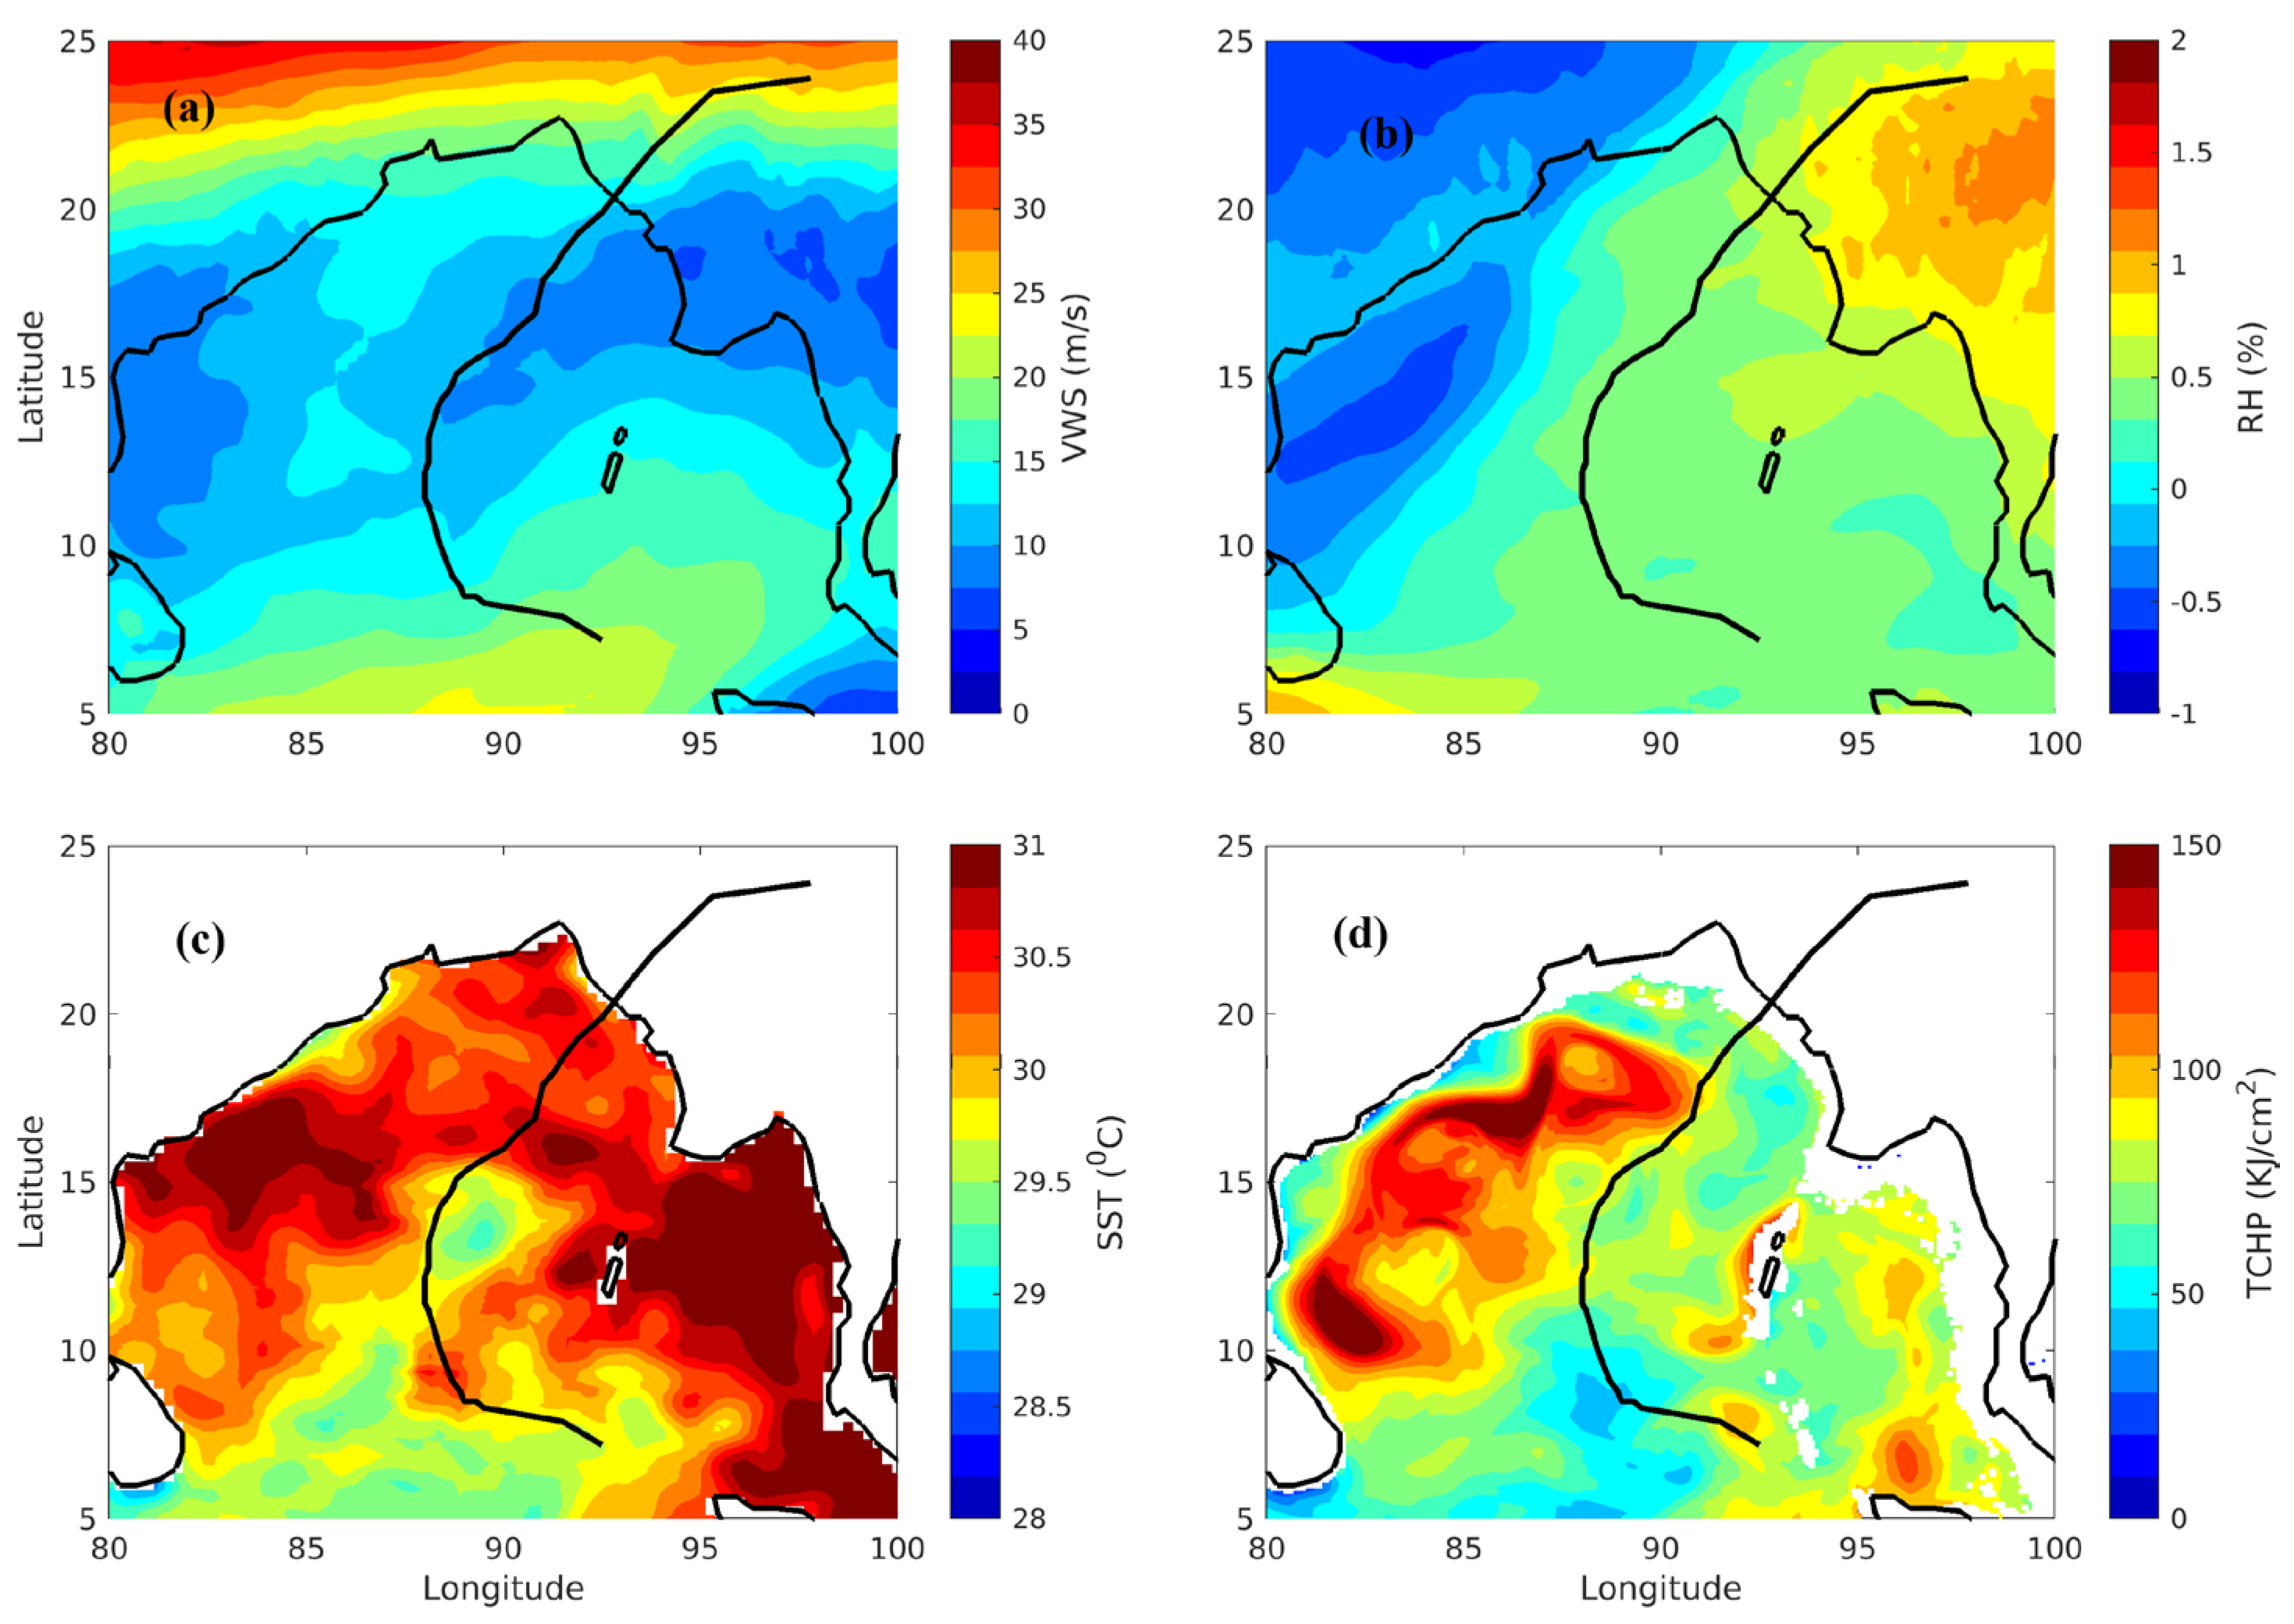
- (b)
- Ocean-atmospheric conditions
4. Performance of NCUM Analysis and Forecast for Mocha Cyclone at NCMRWF
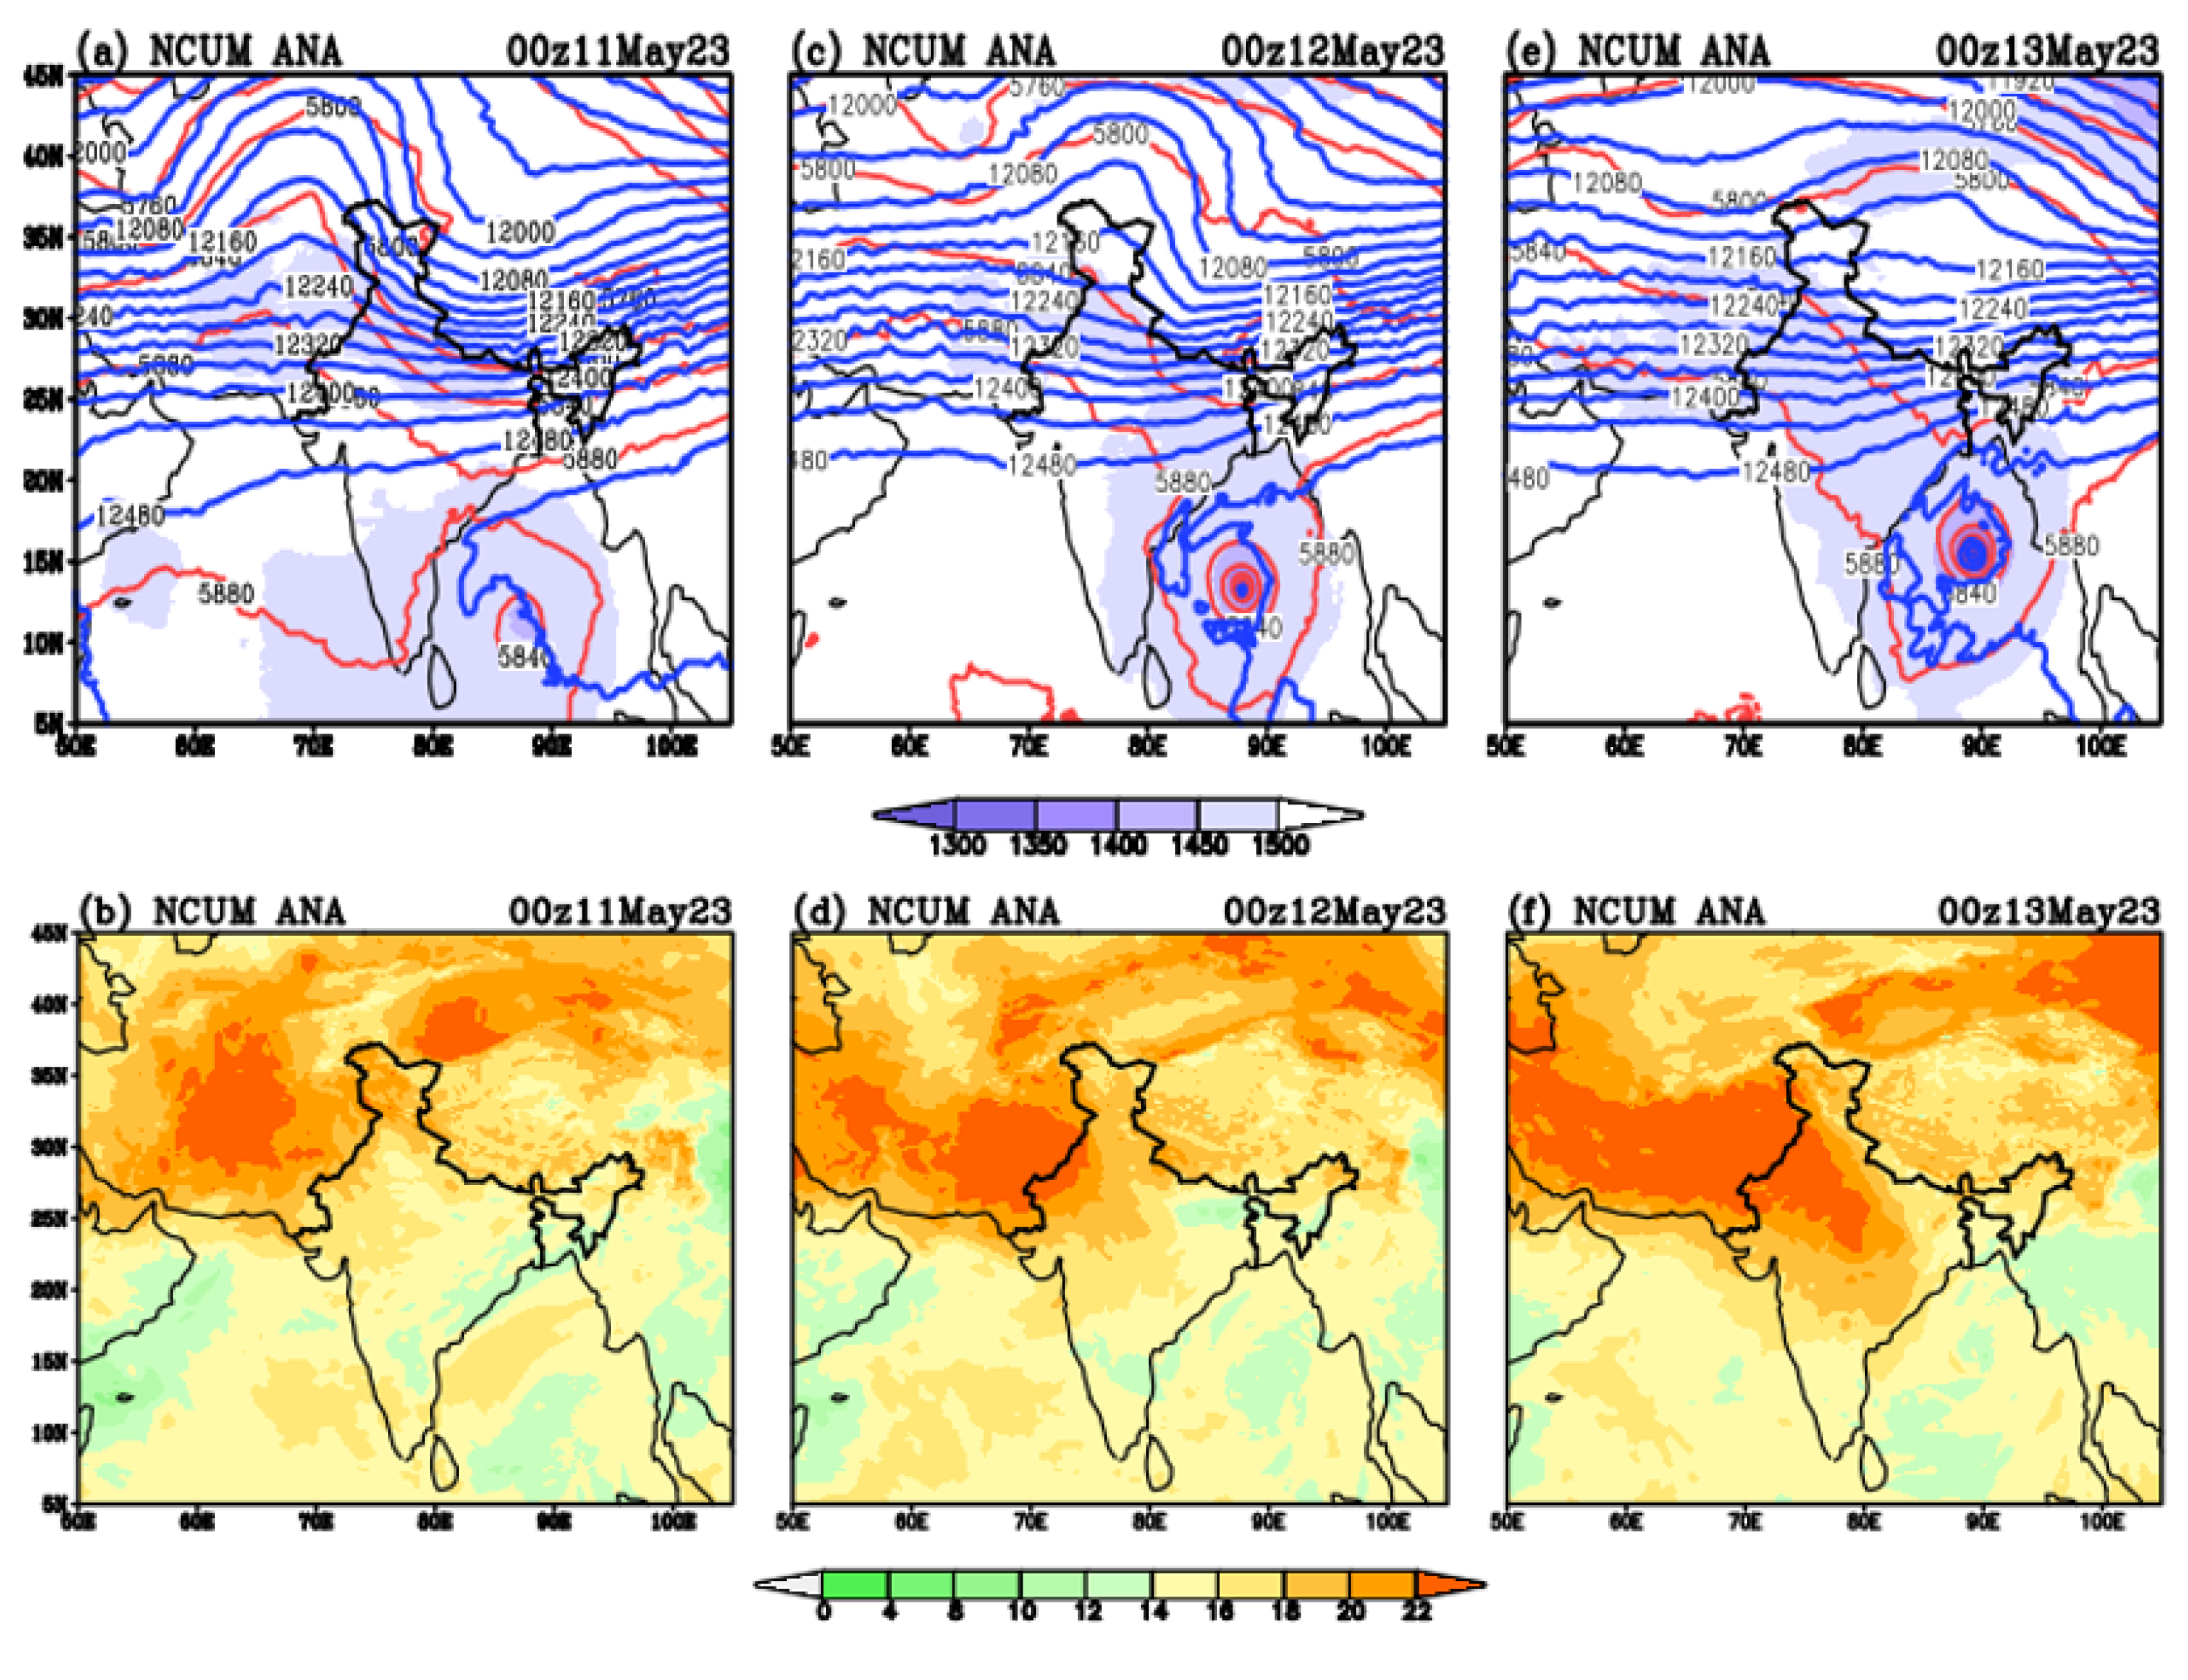
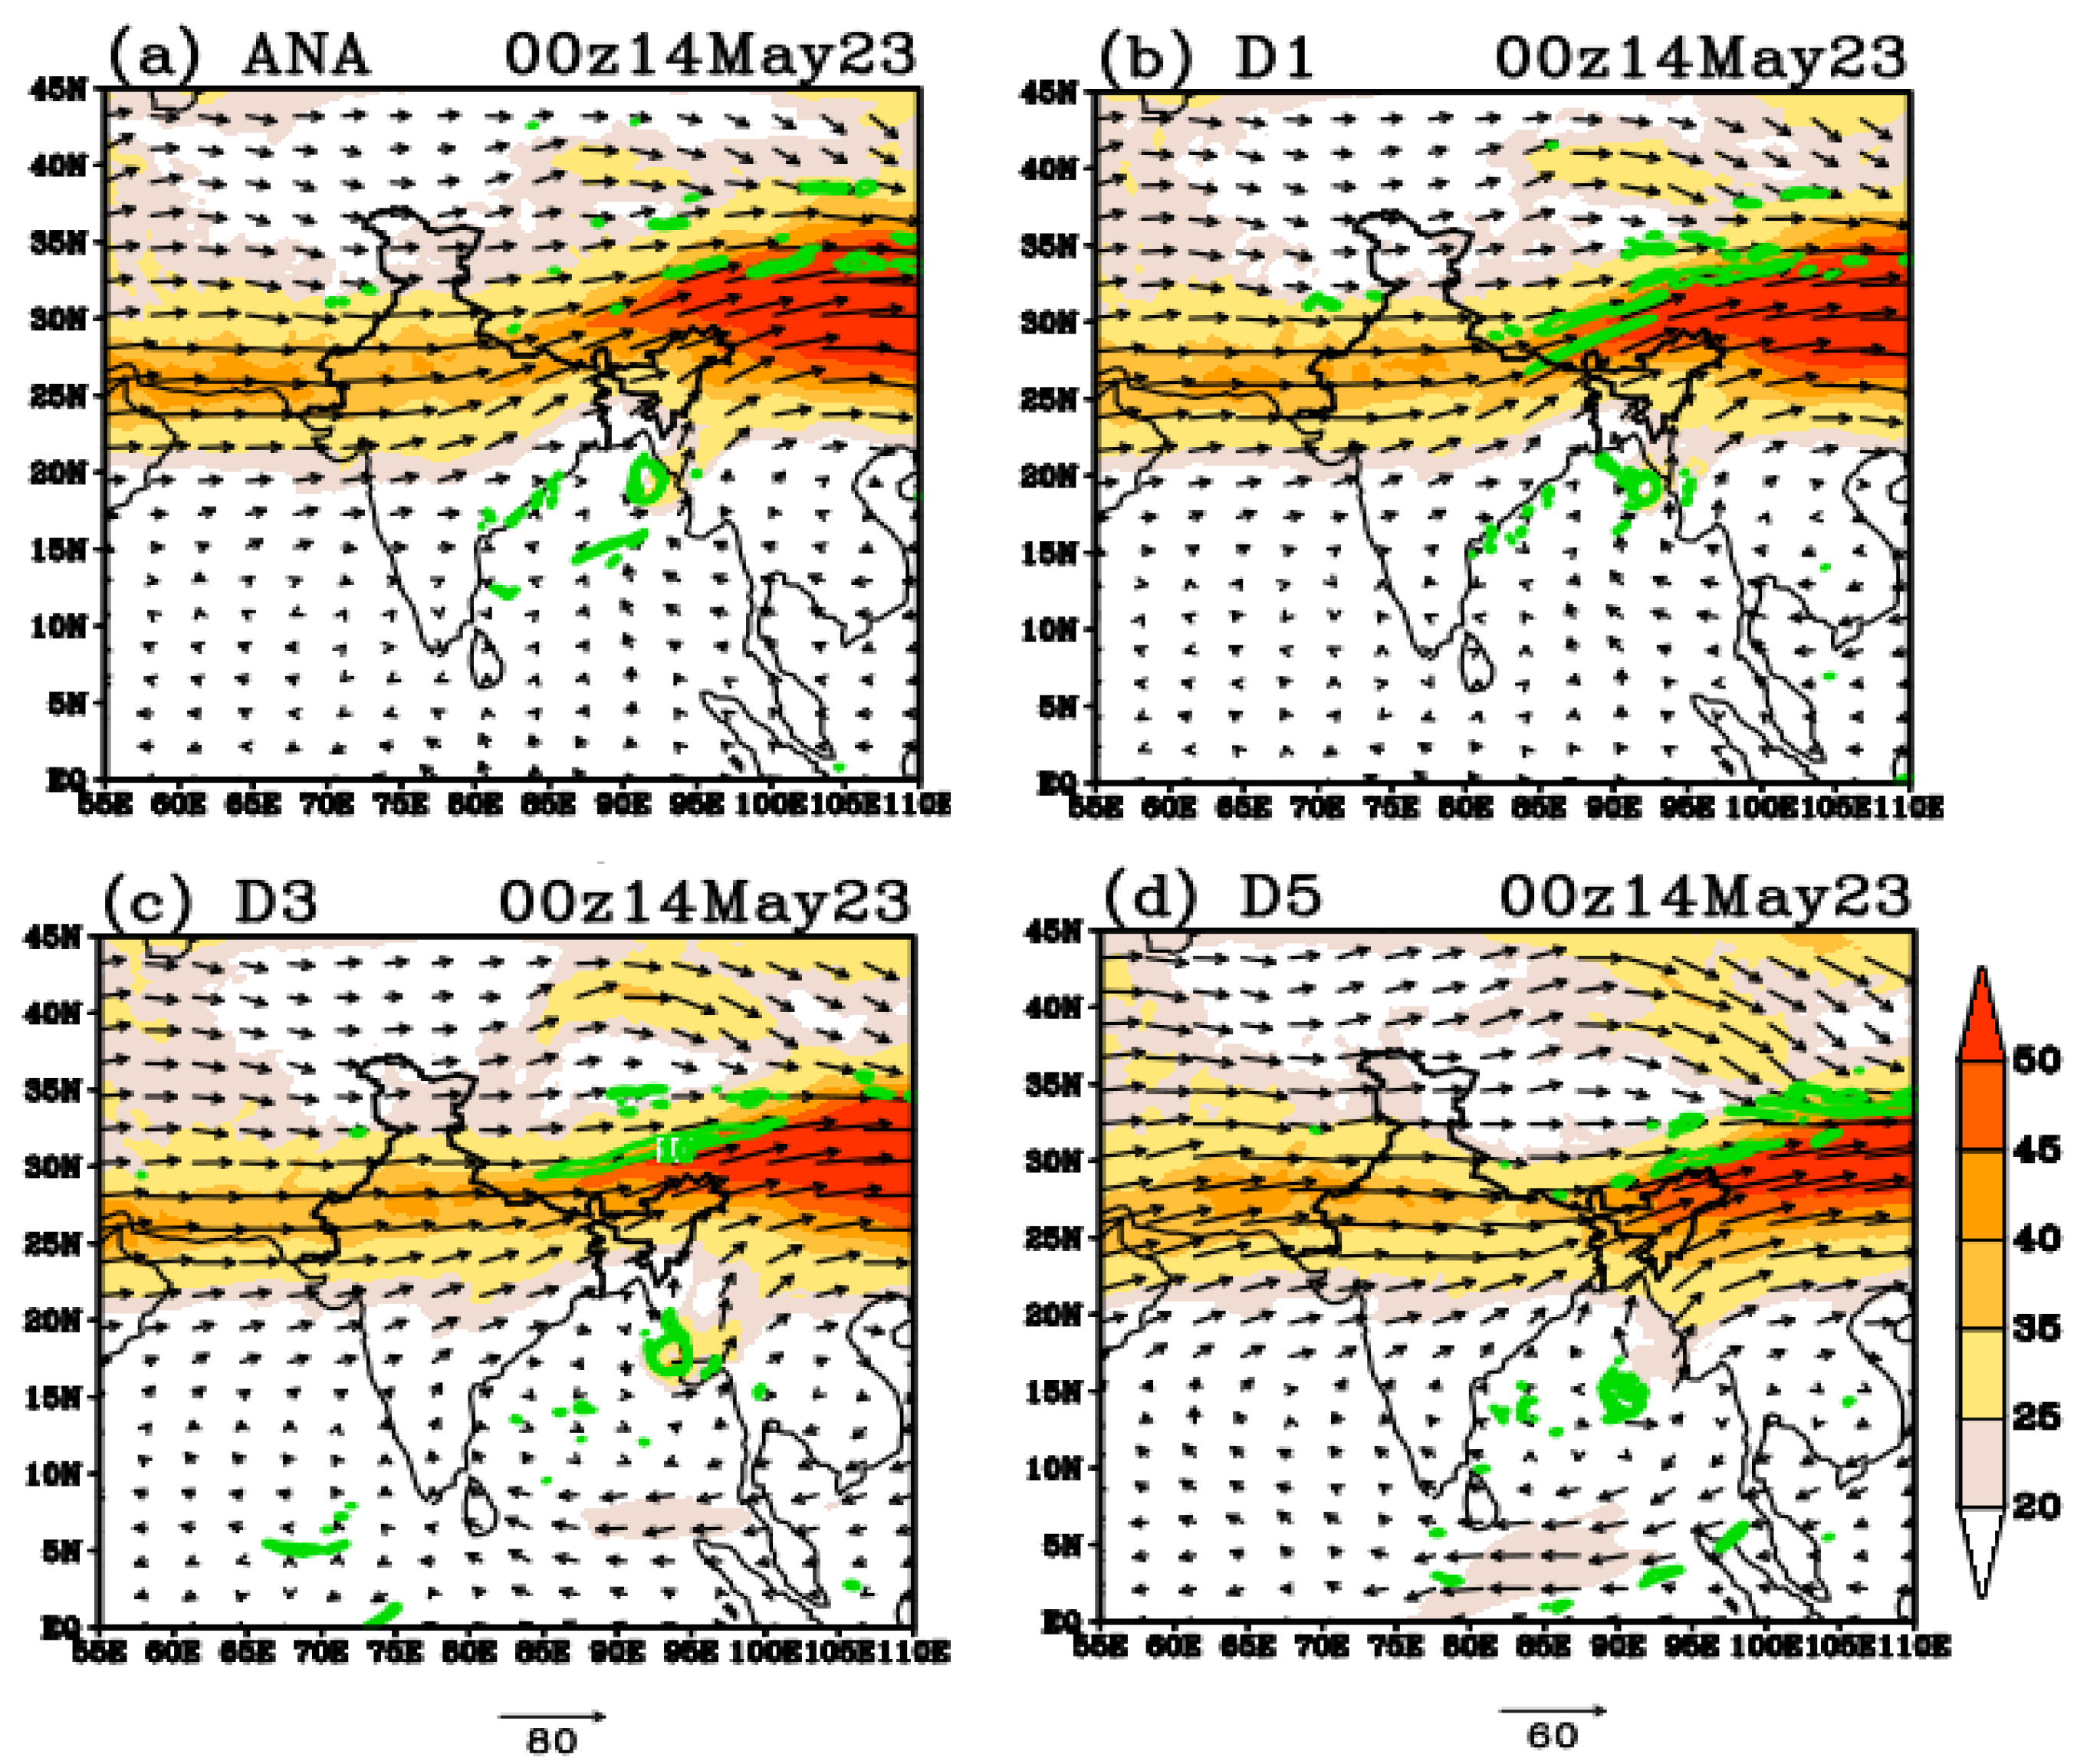
4.1. Role of WD and Recurvature
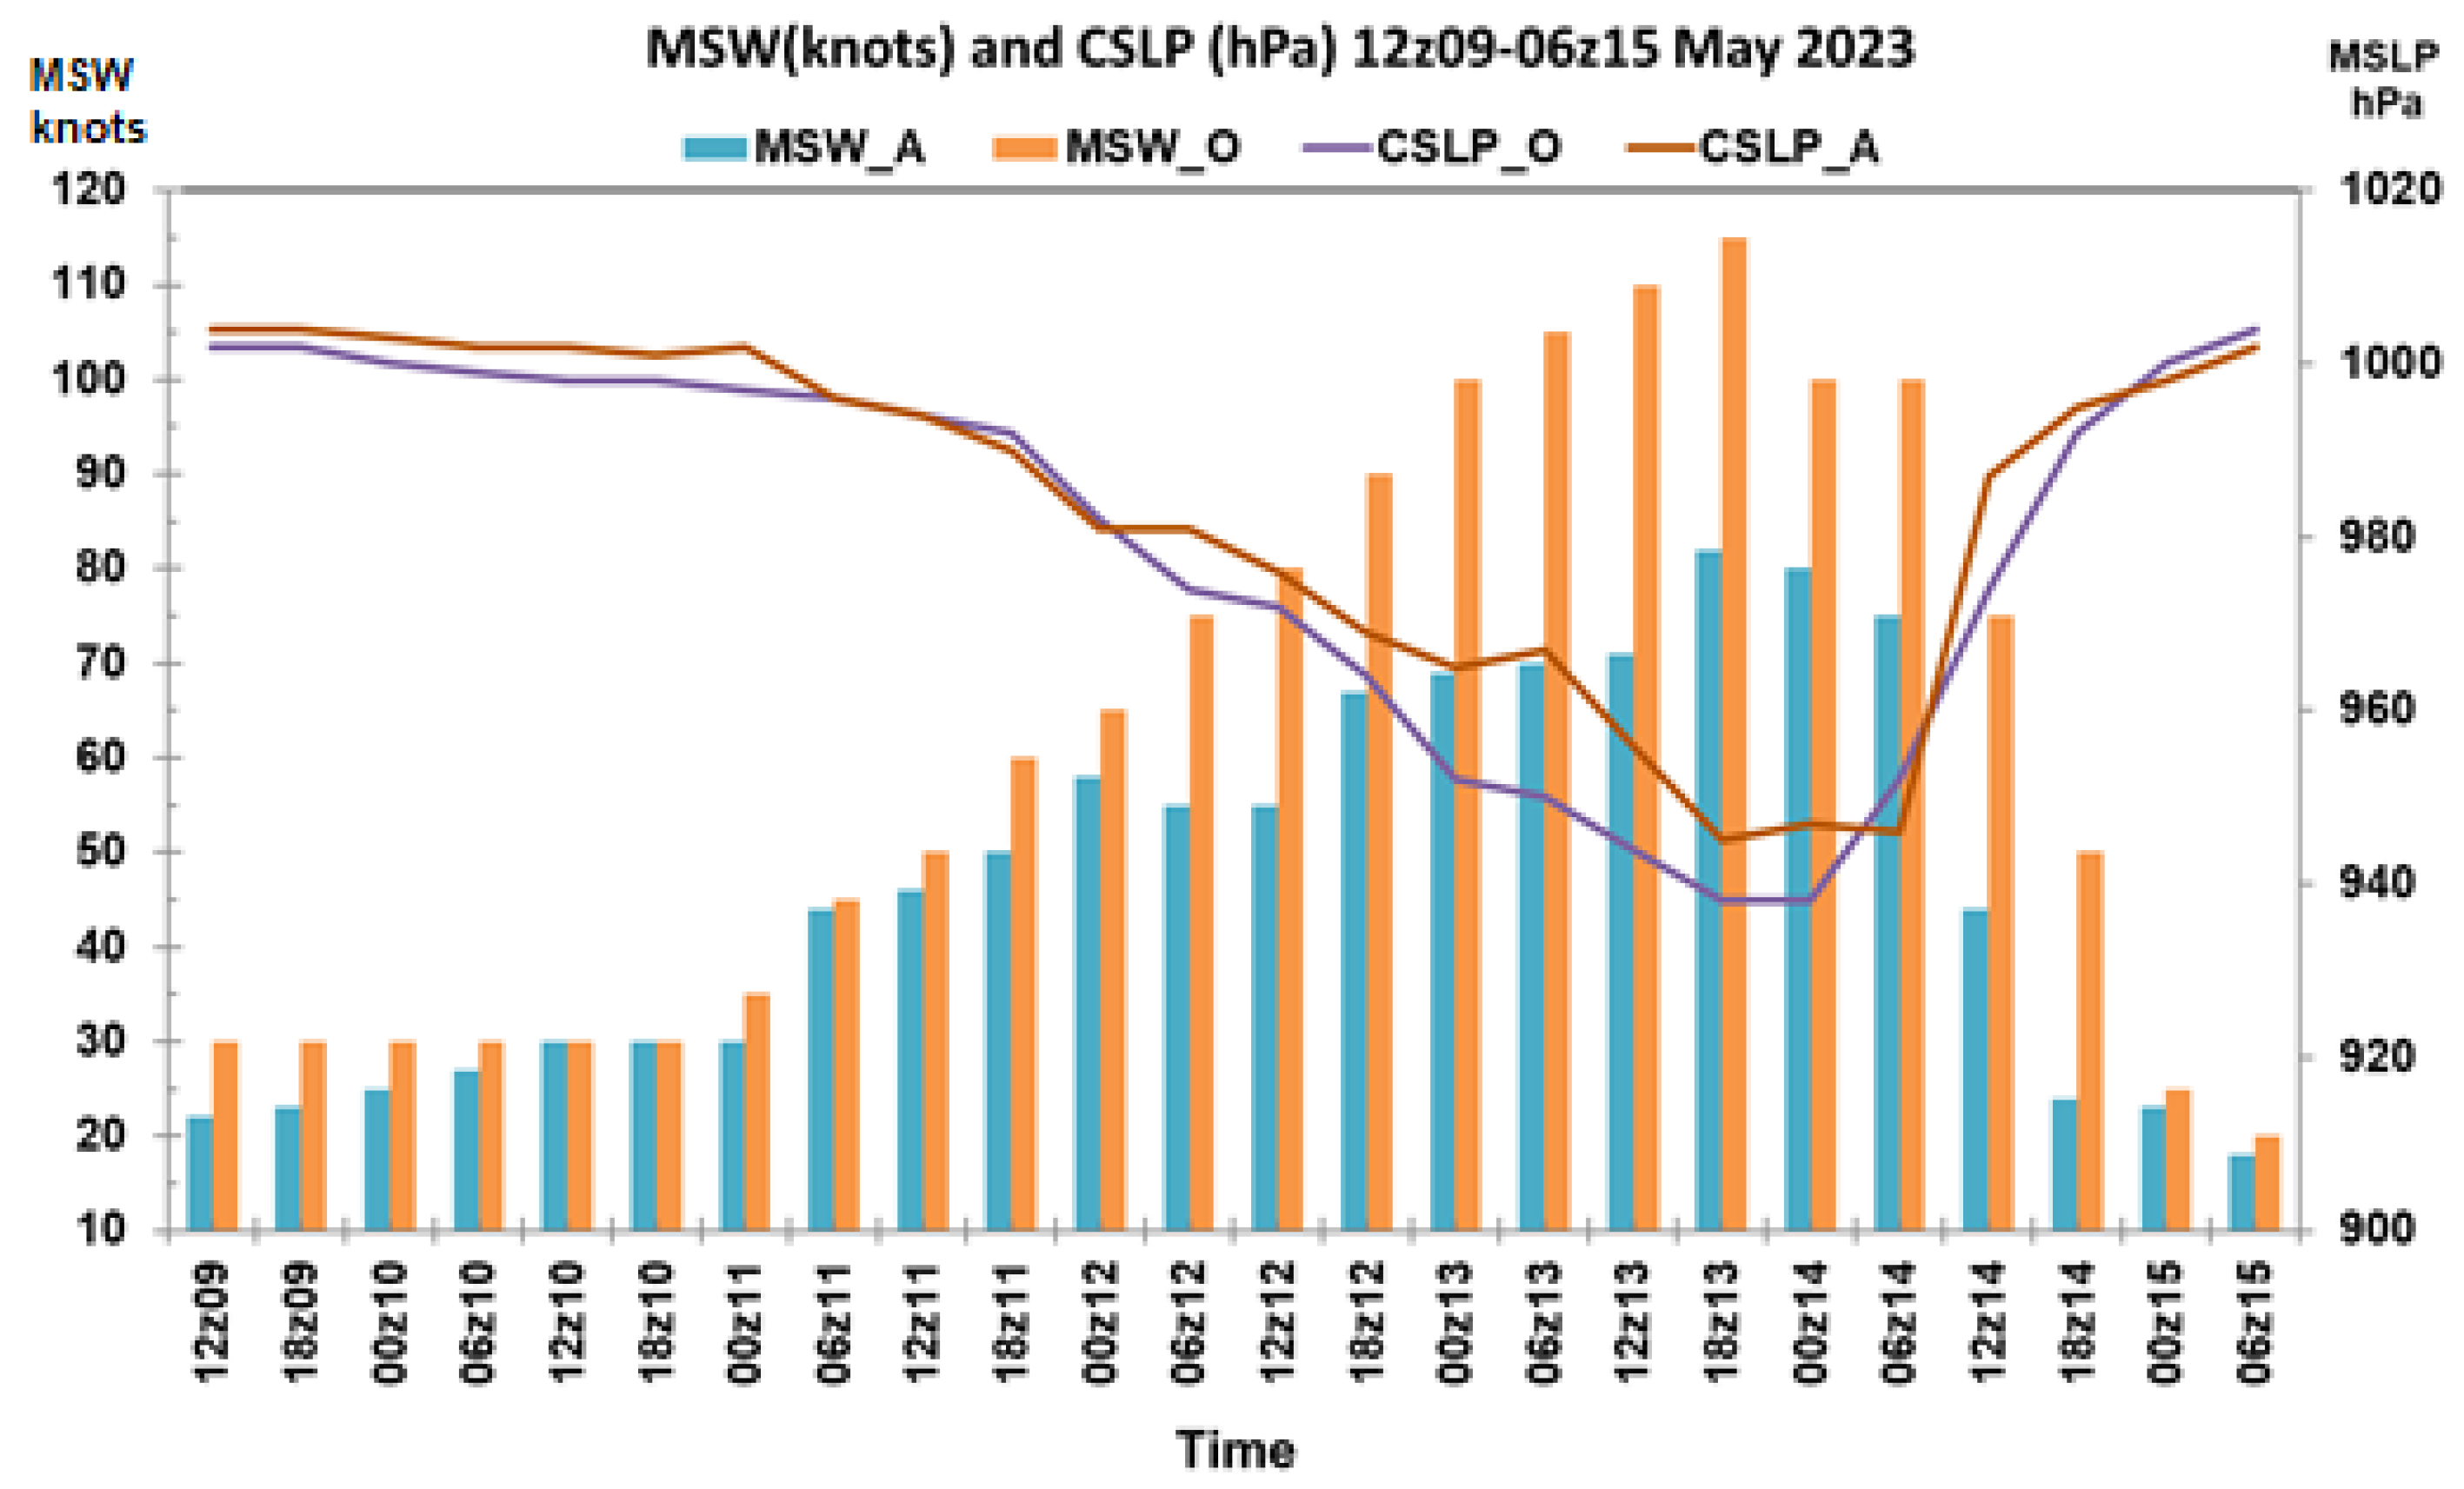
4.2. Intensity and Rate of Cyclogenesis
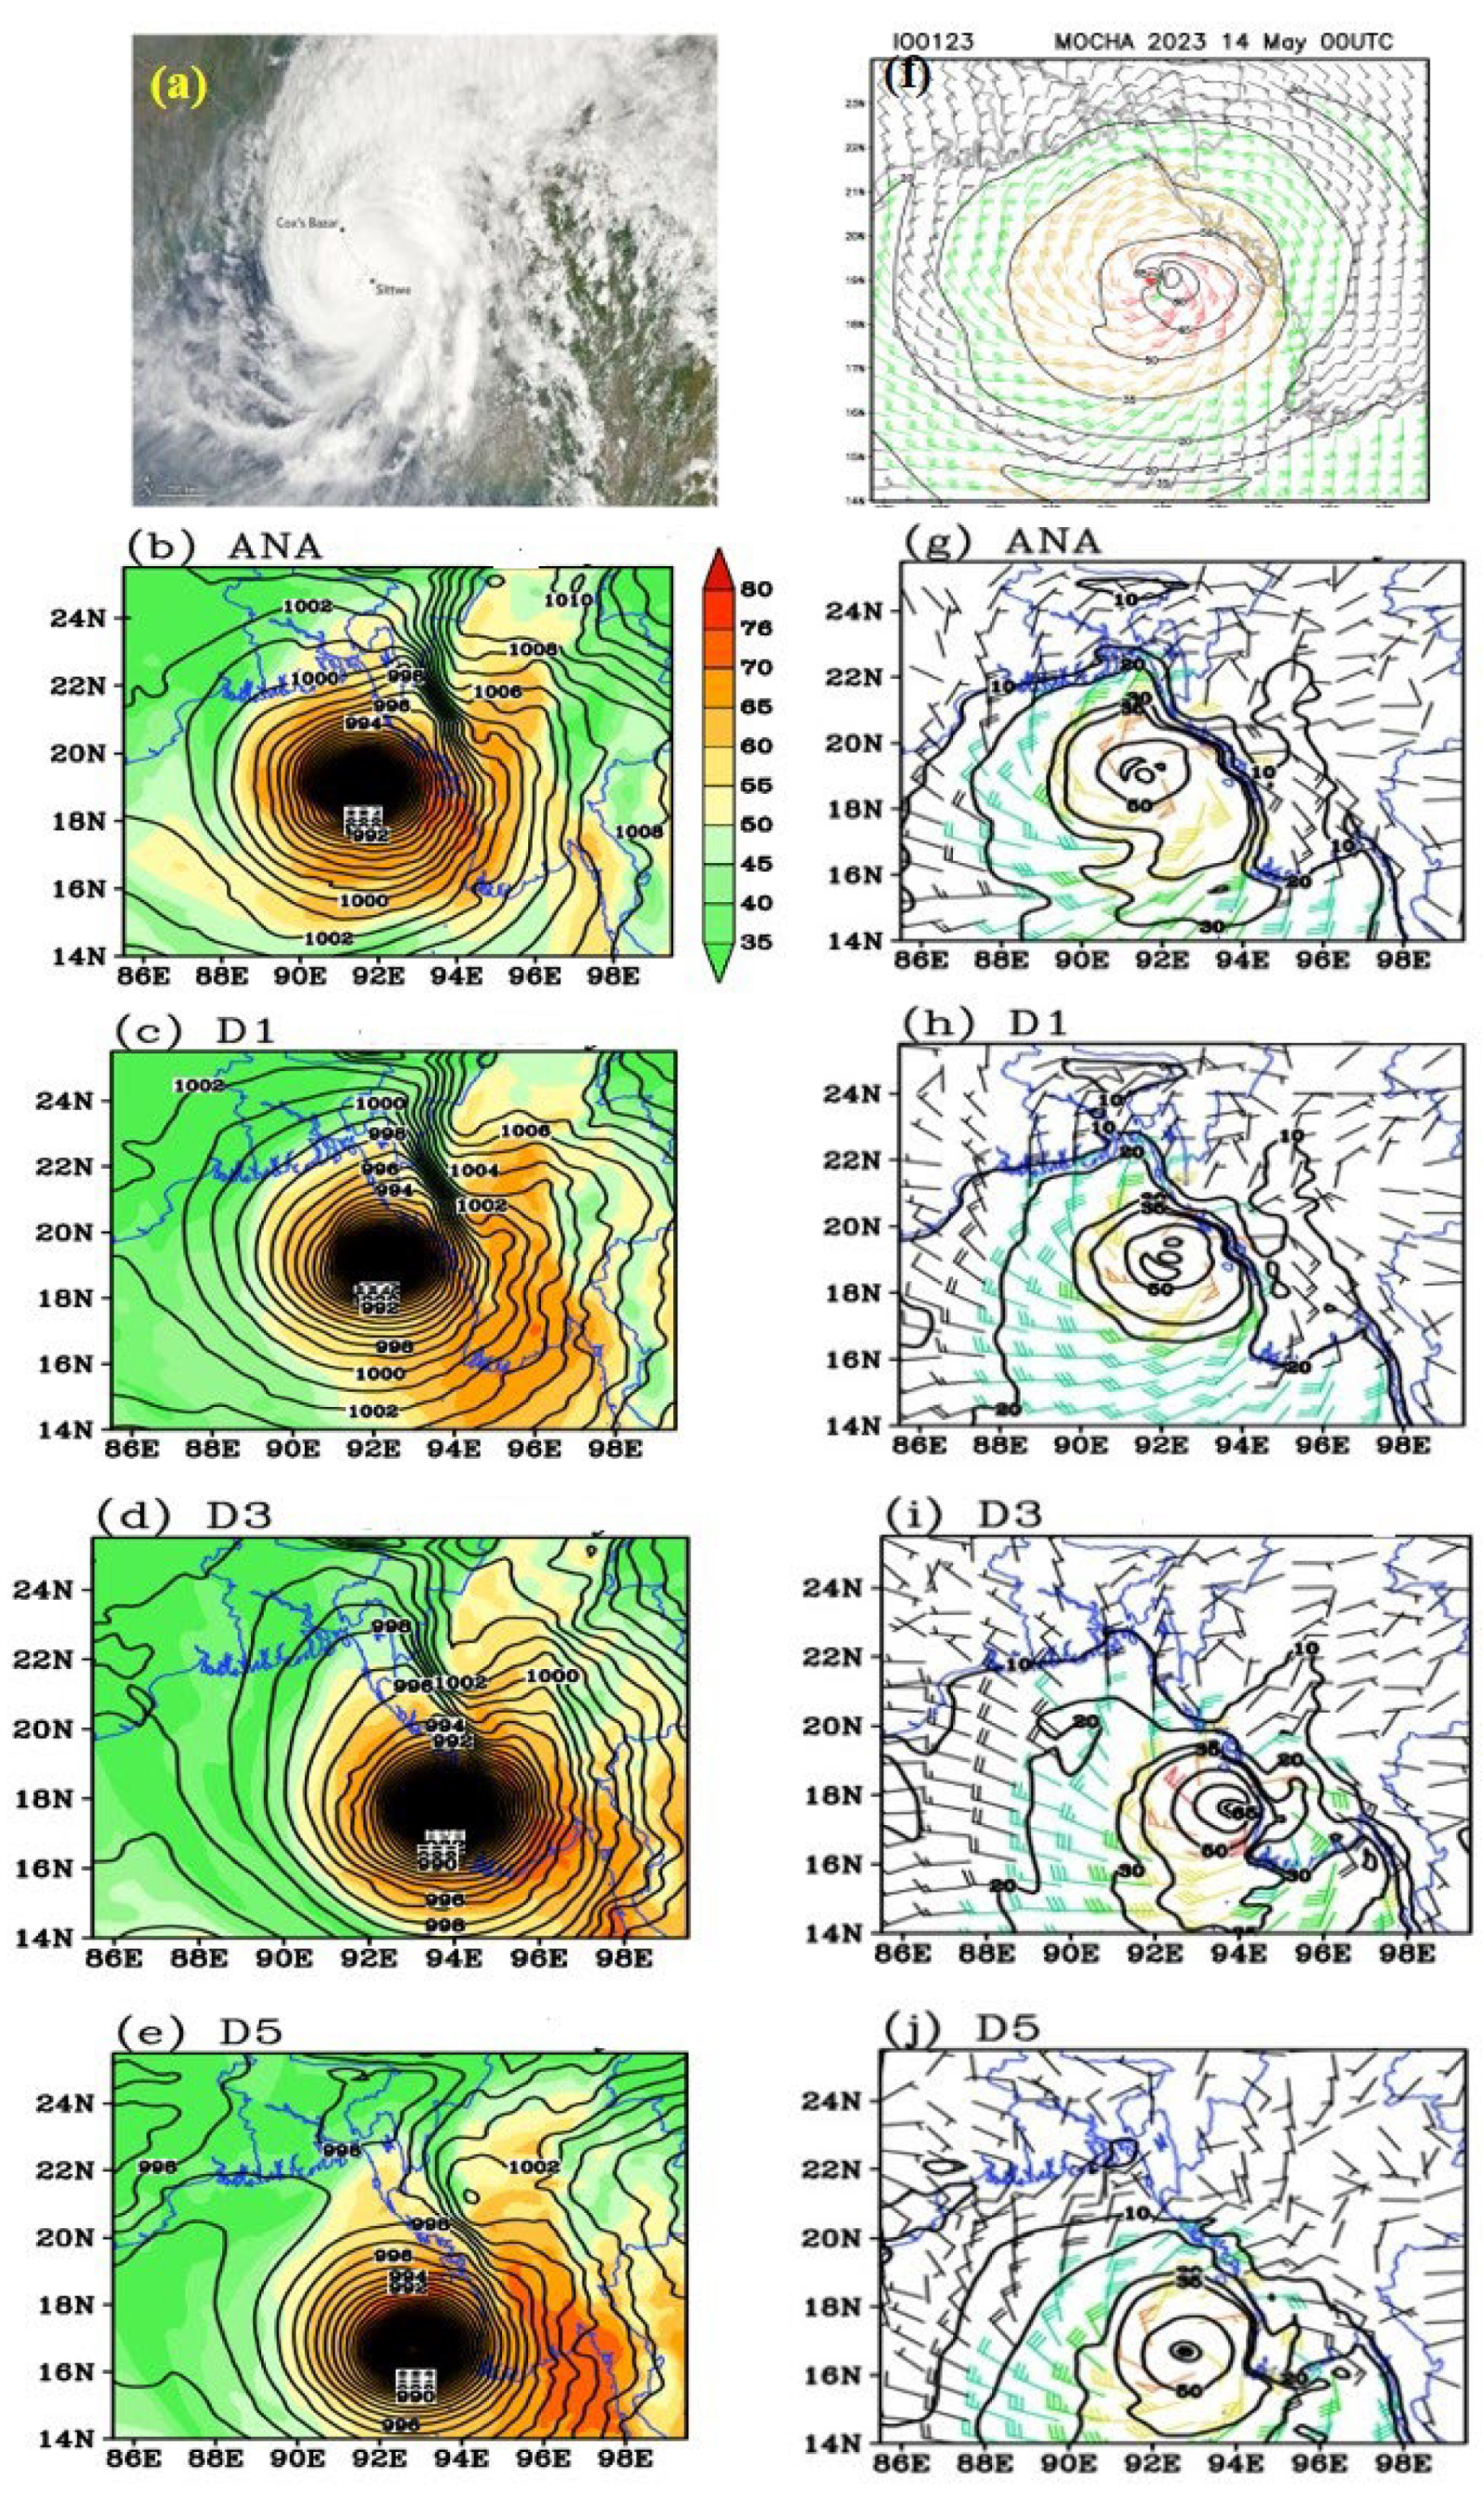
4.3. Circulation and Structure of Mocha During ESCS Stage
- (a)
- MSLP, precipitable water content, and 10 m wind field
- (b)
- Wind pattern at 850 and 200 hPa
- (c) Vertical structure
4.4. Dynamical Mechanism for Cyclogenesis and Multiple Recurvature
- (a)
- Q-vector analysis
- (b)
- Large-scale flow
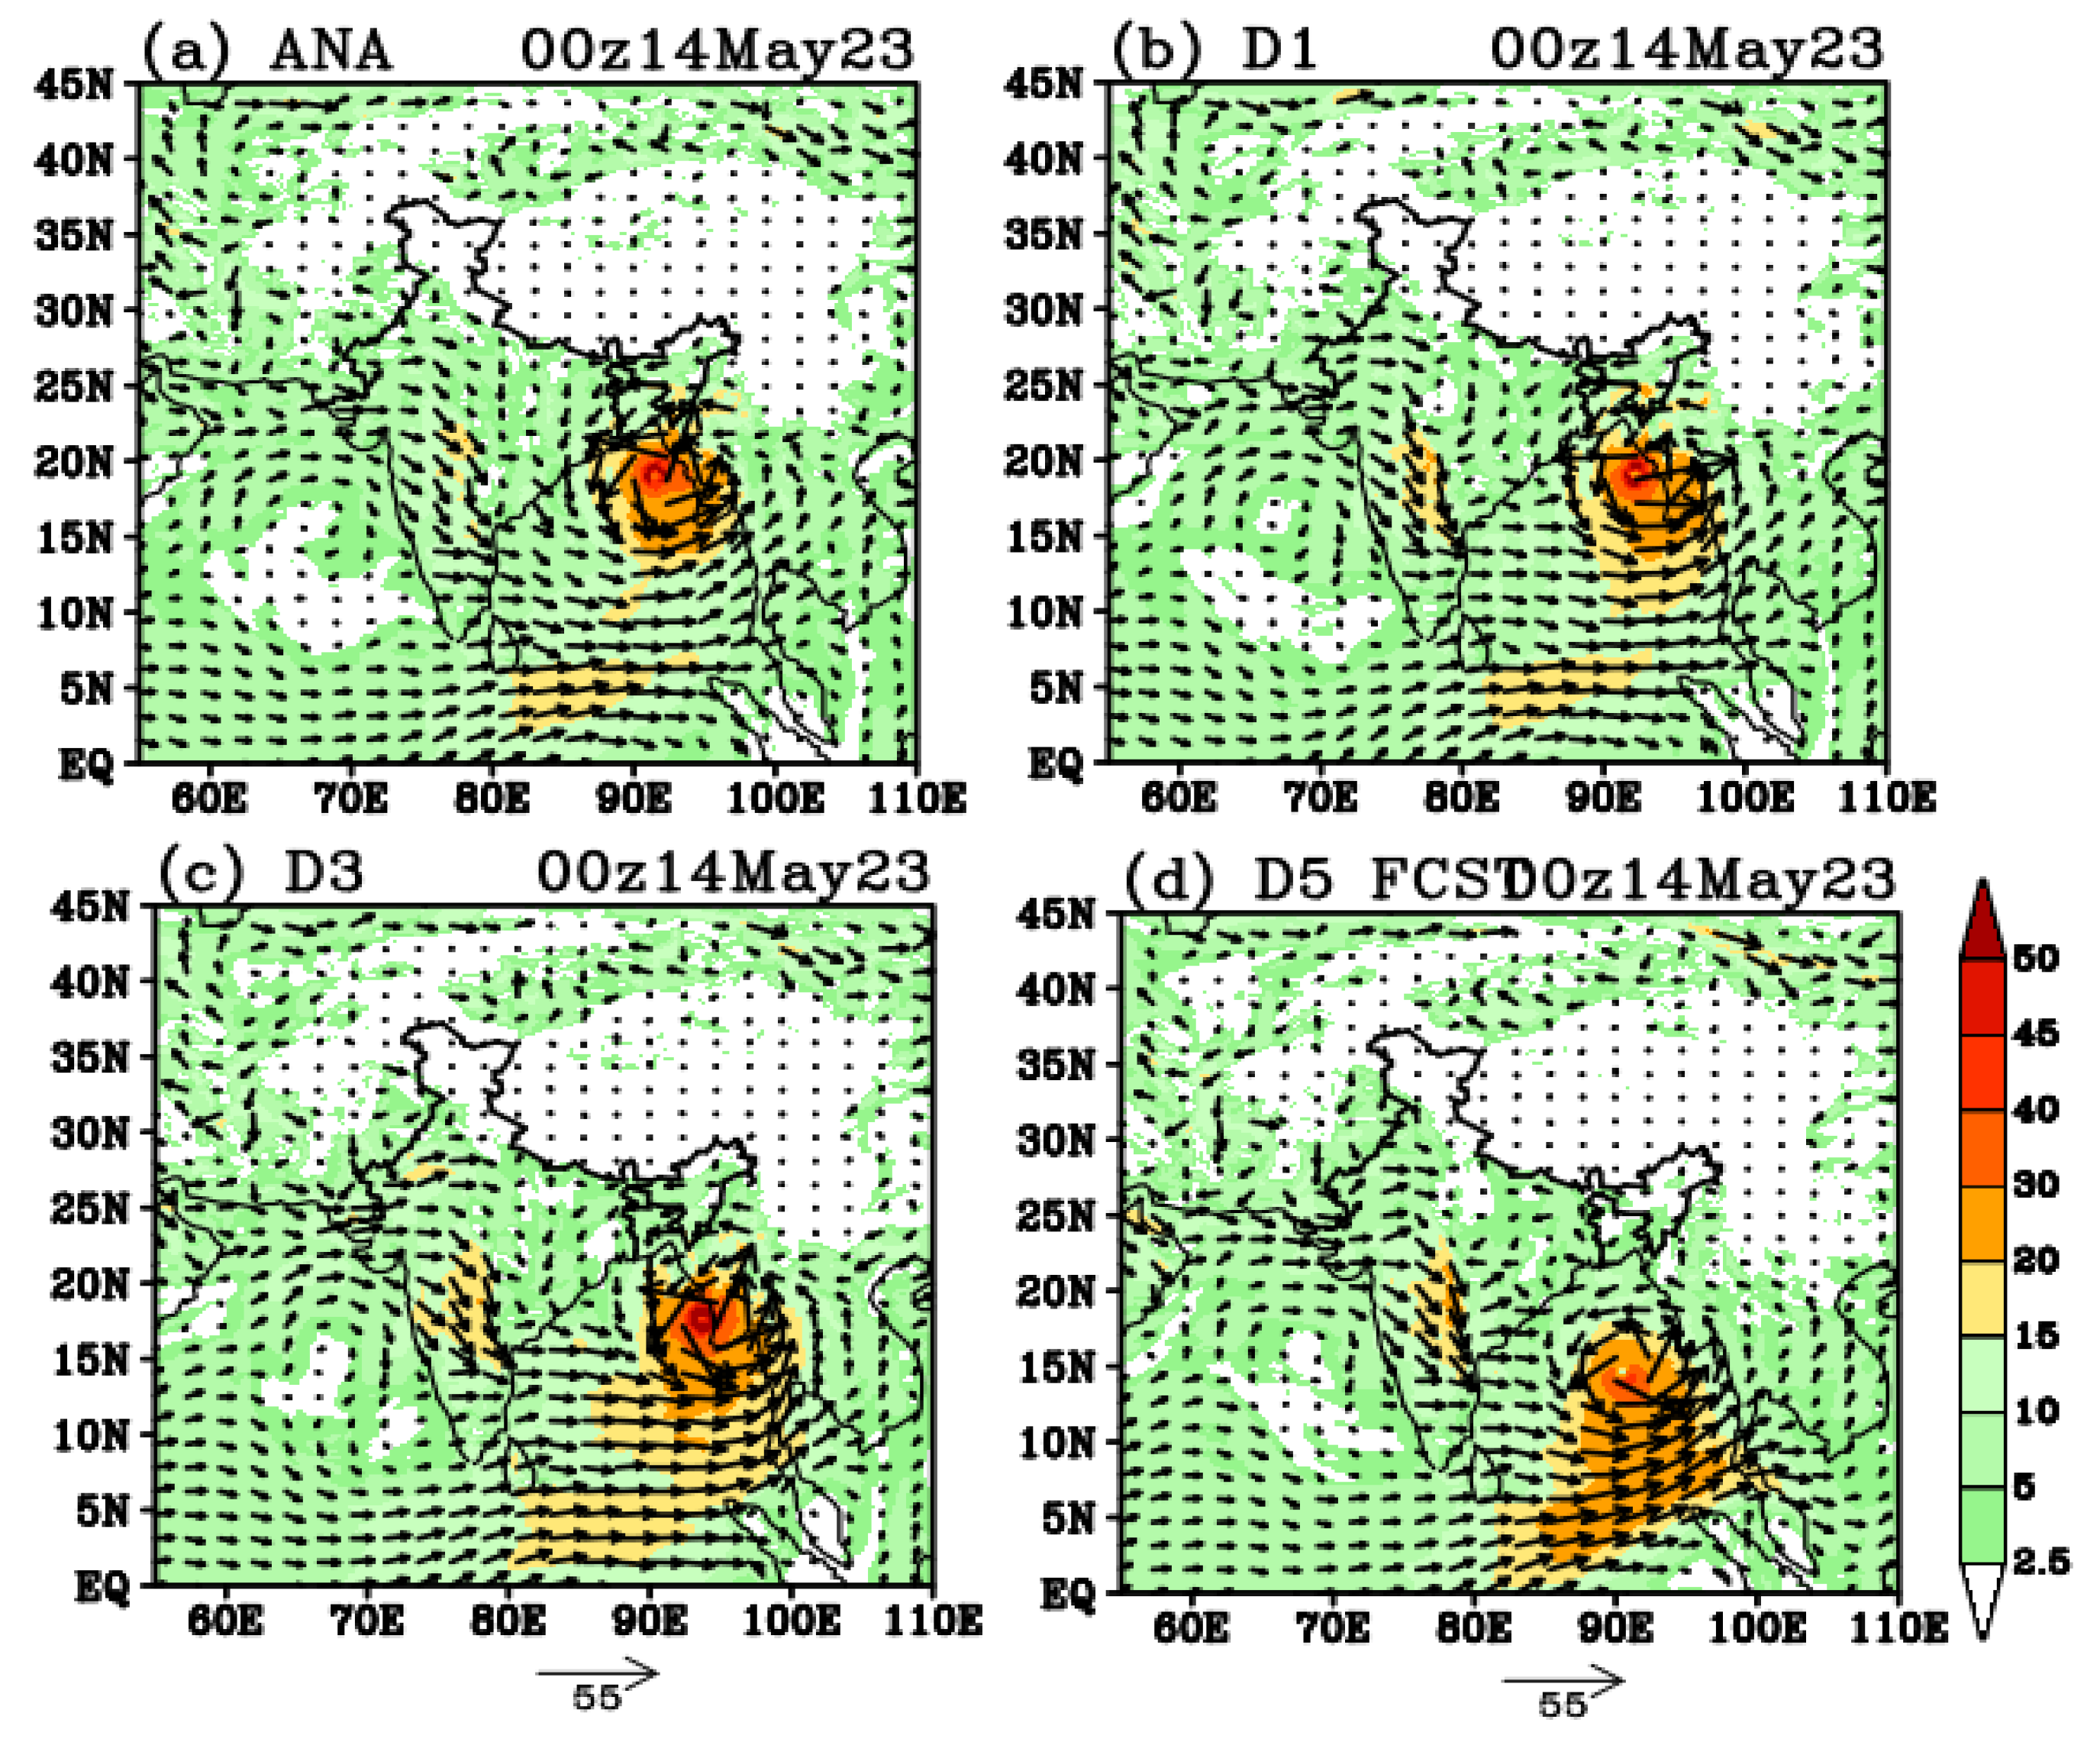
4.5. Track and Vertically Integrated Moisture Transport
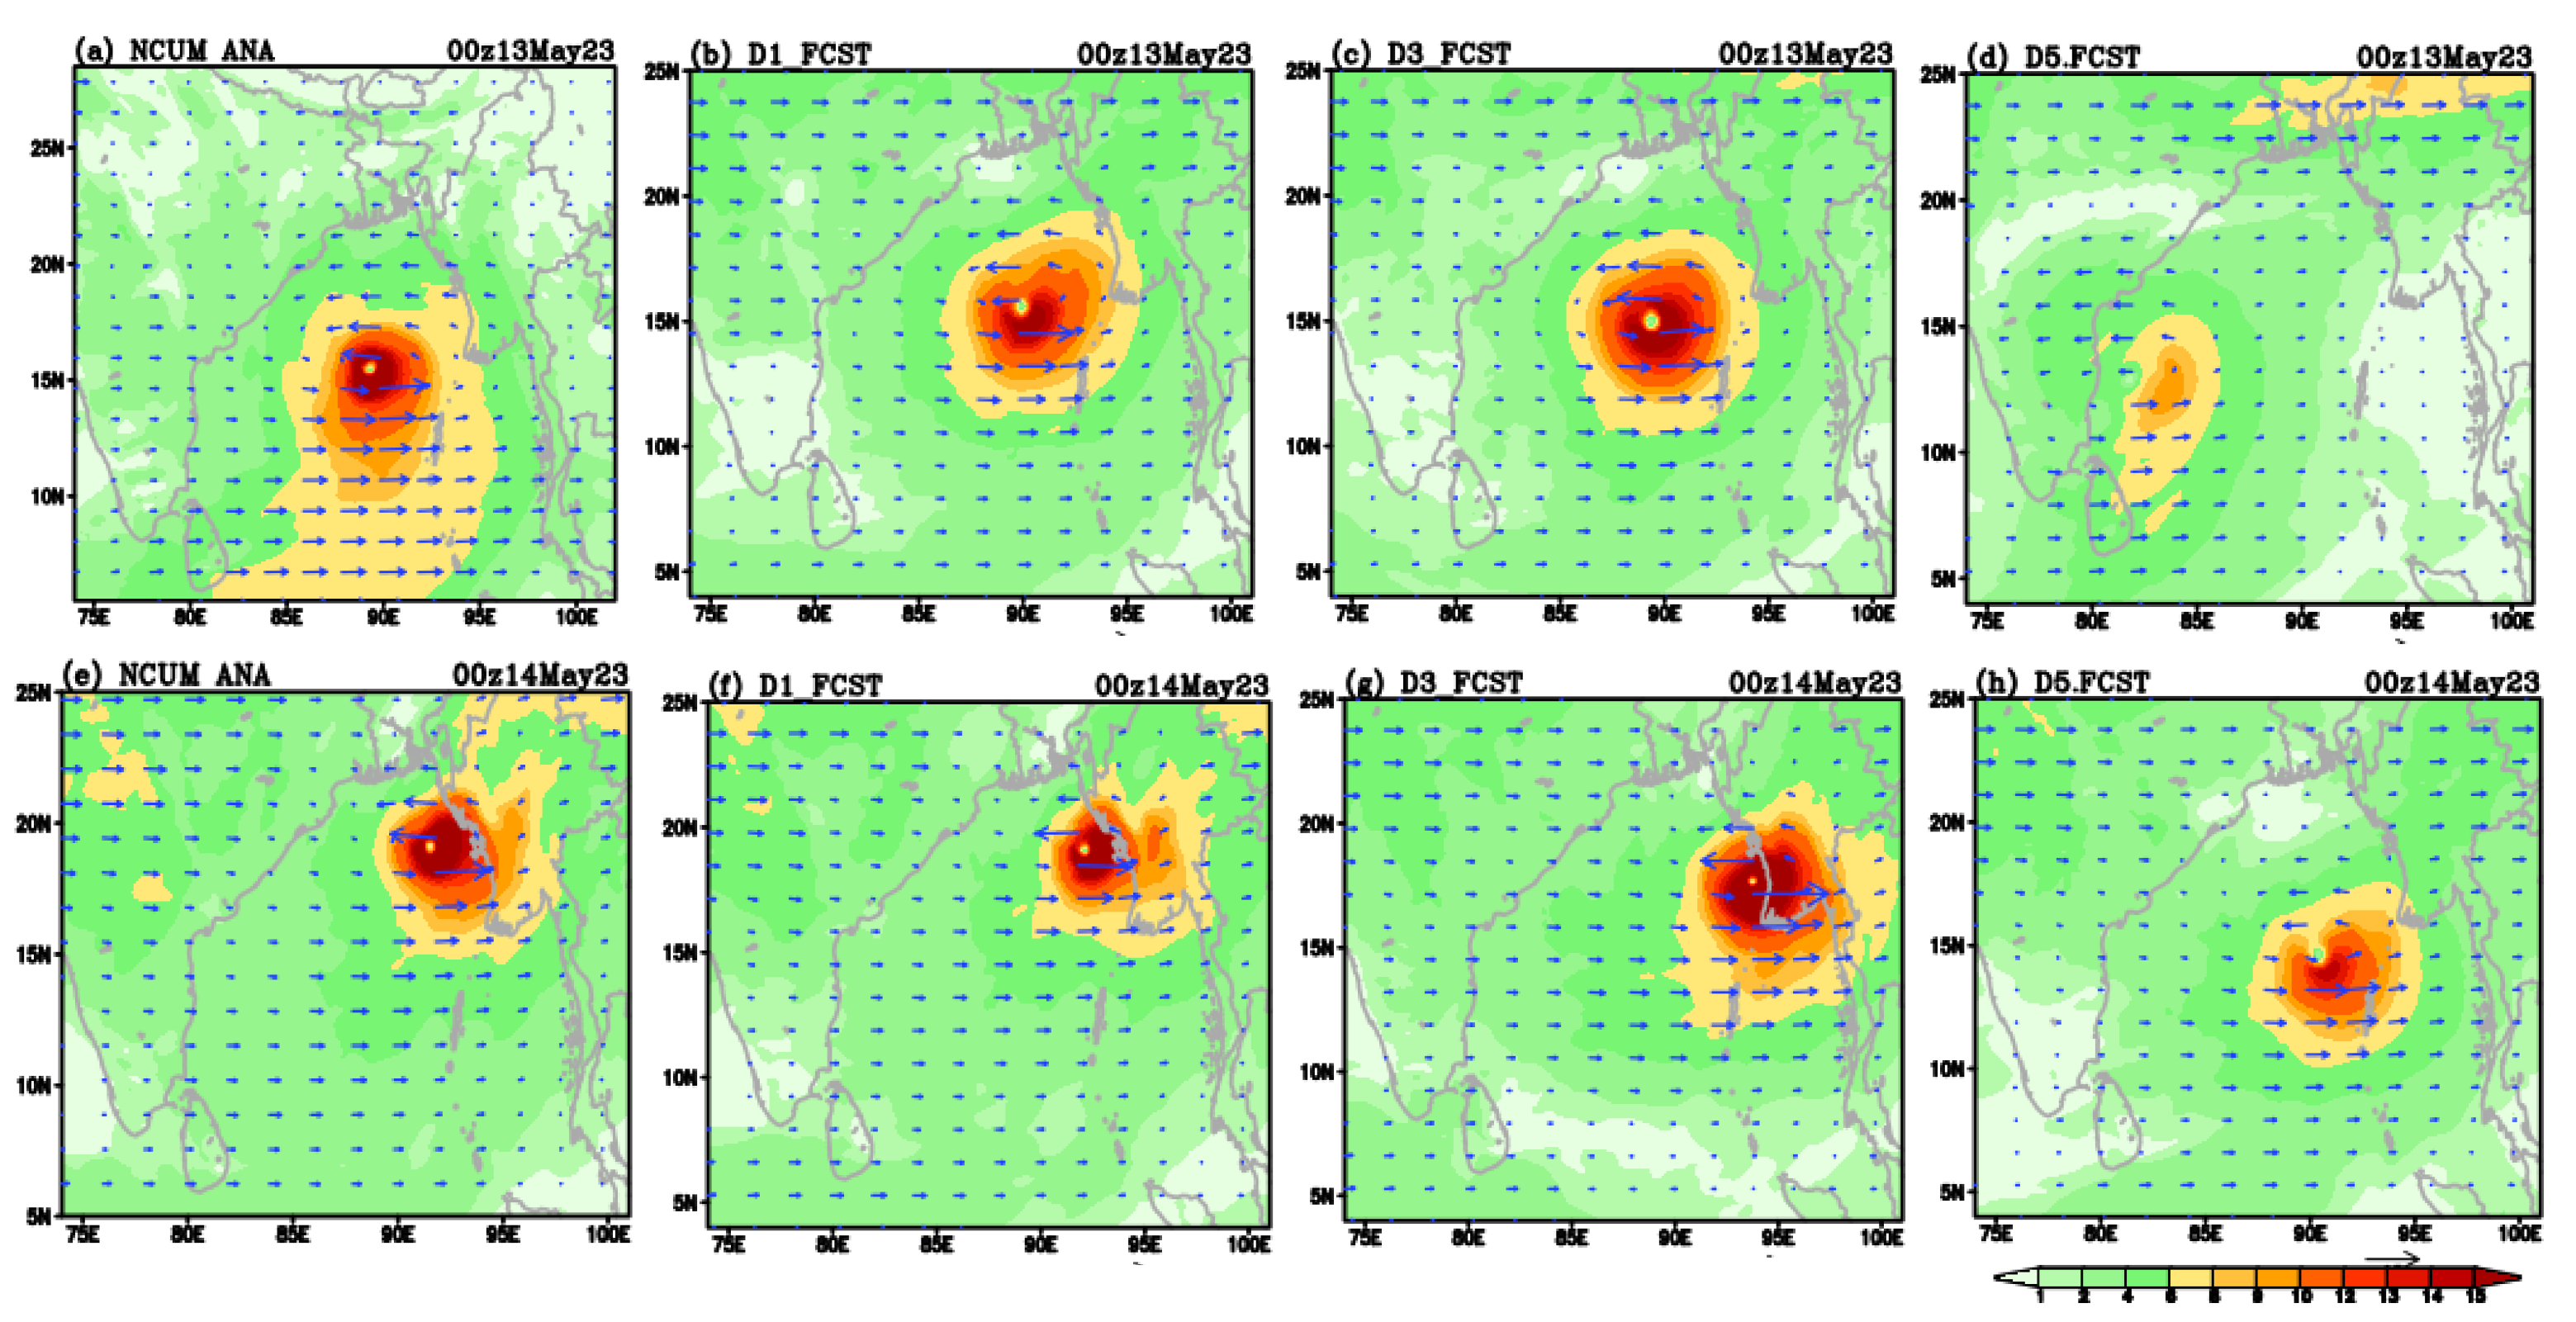
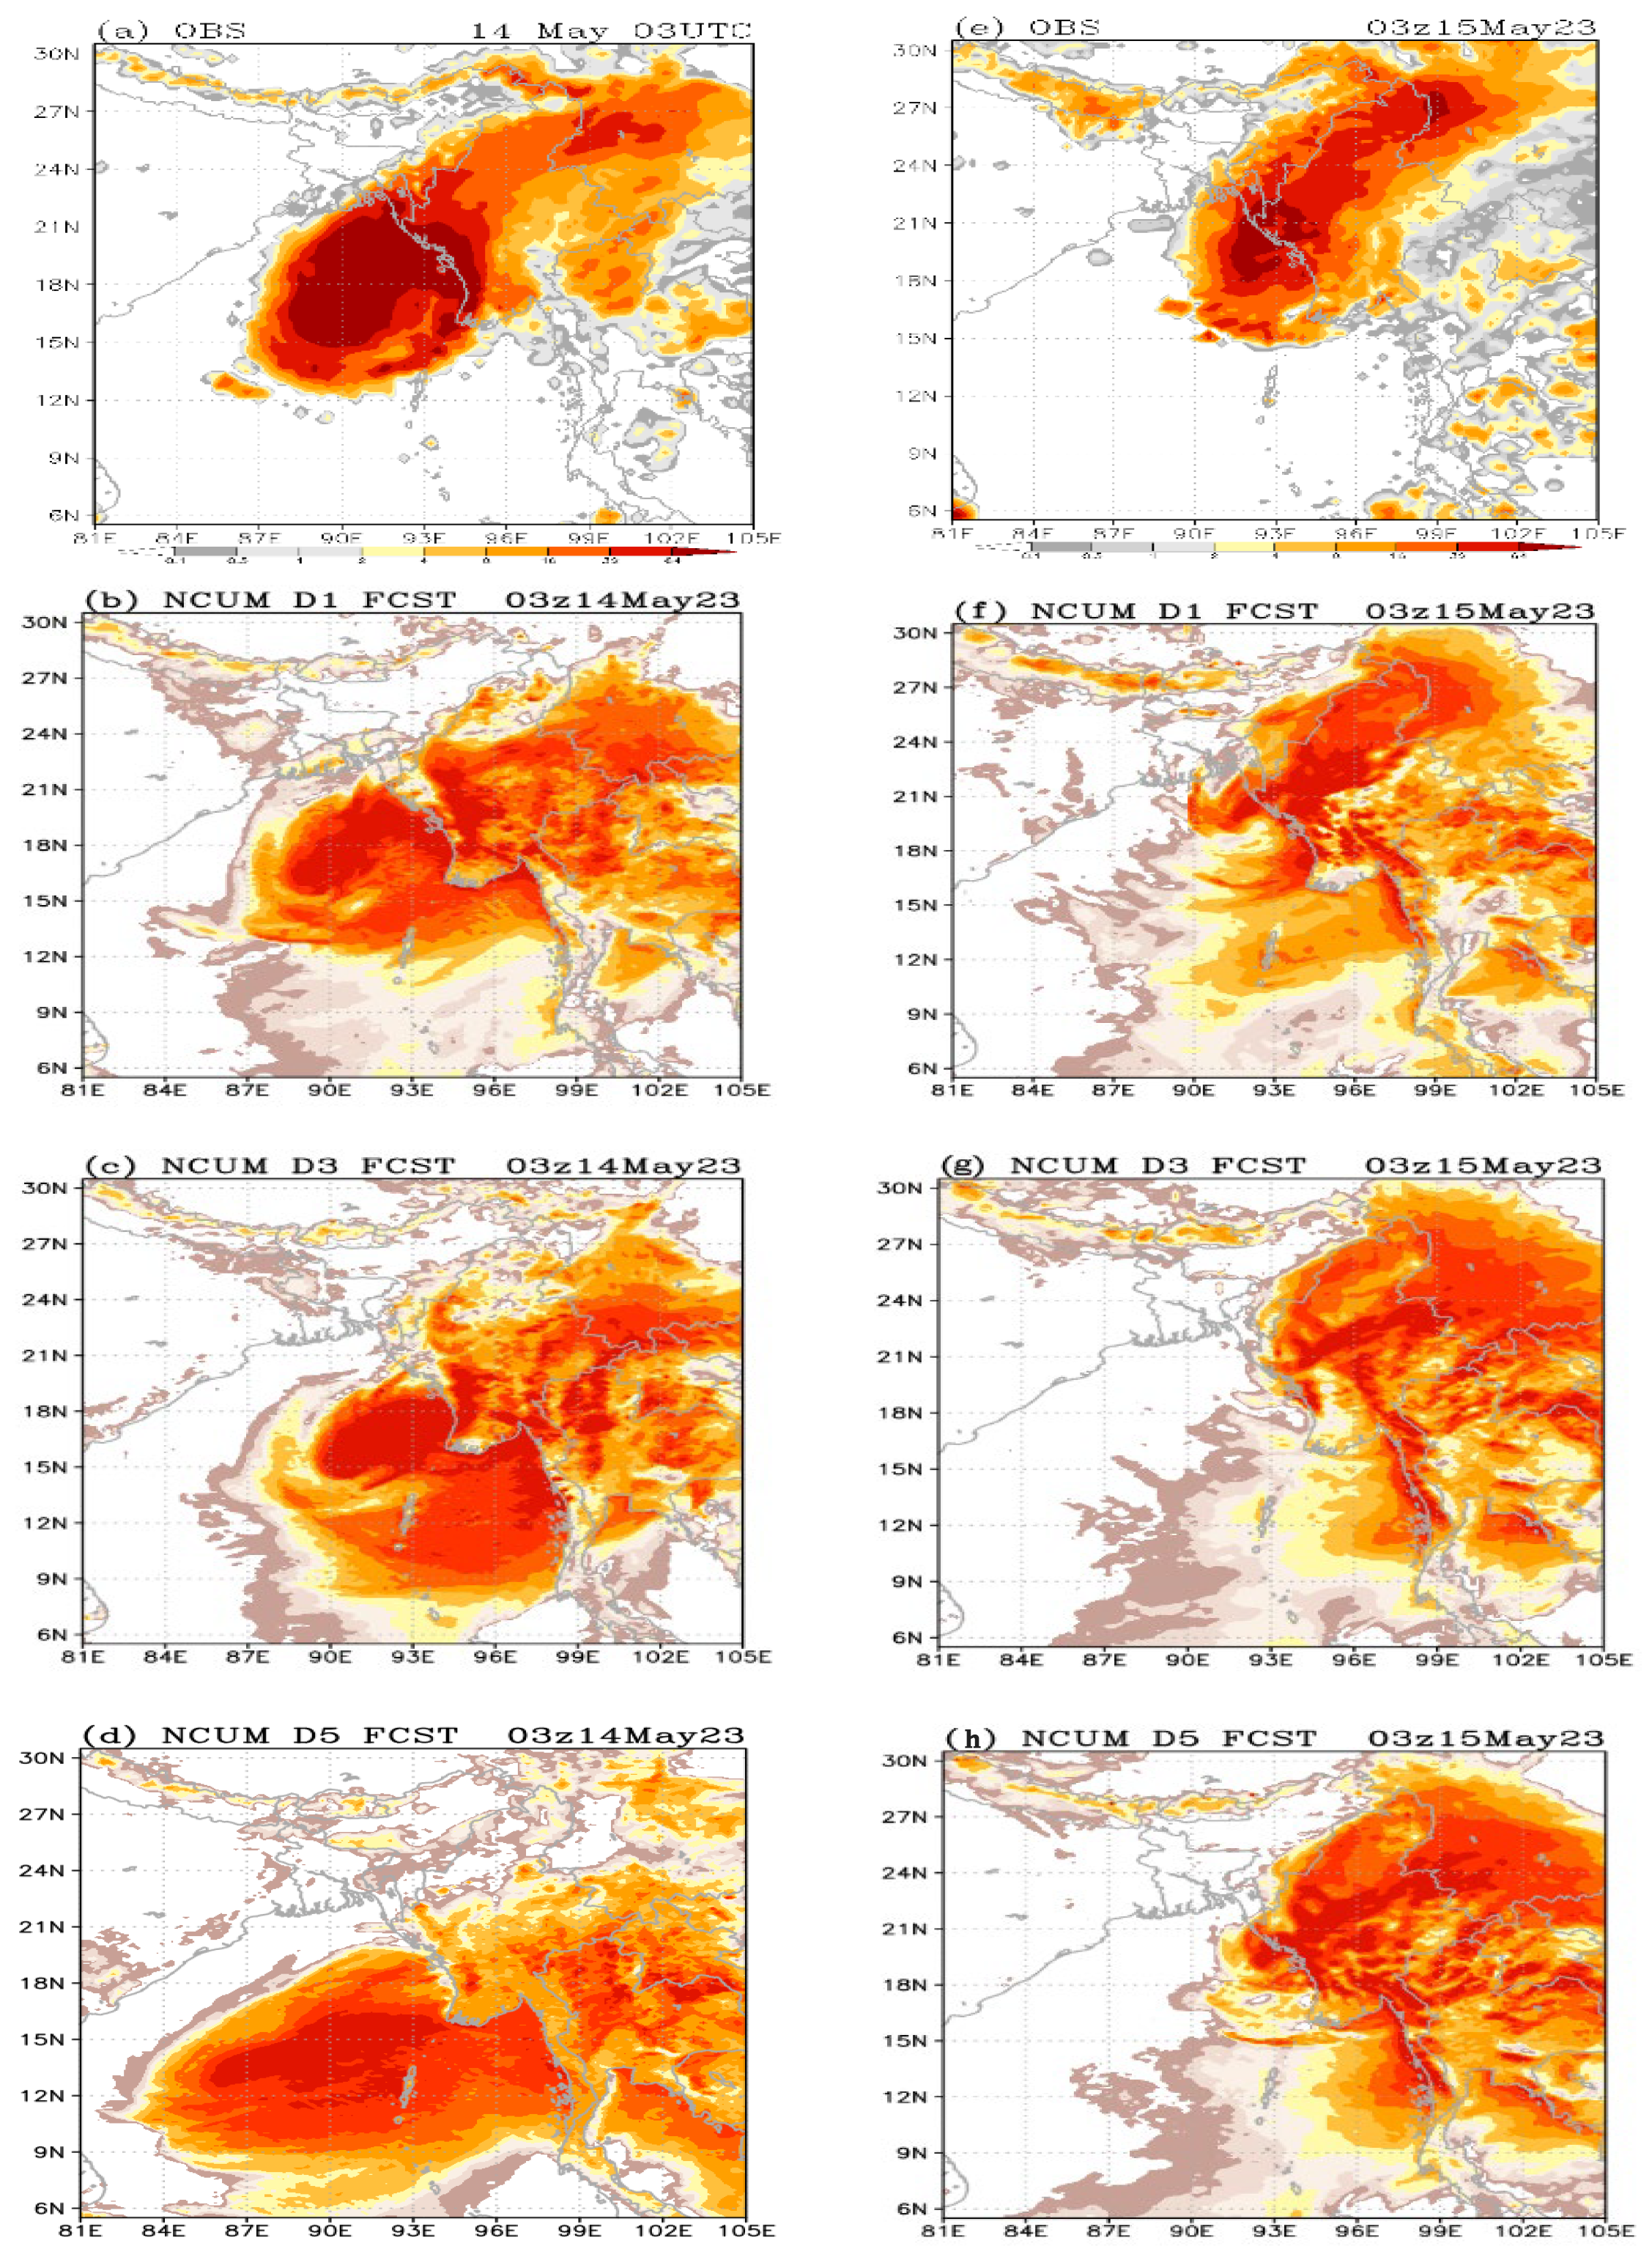
5. Rainfall
6. Conclusions
Supplementary Materials
Author Contributions
Funding
Institutional Review Board Statement
Informed Consent Statement
Data Availability Statement
Acknowledgments
Conflicts of Interest
References
- Krishnamurti, T.N.; Jana, S.; Krishnamurti, R.; Kumar, V.; Deepa, R.; Papa, F.; Bourassa, M.A.; Ali, M.M. Monsoonal intraseasonal oscillations in the ocean heat content over the surface layers of the Bay of Bengal. J. Mar. Syst. 2017, 167, 19–32. [Google Scholar] [CrossRef]
- Mohapatra, M. Tropical Cyclone Forecast Verification by India Meteorological Department for North Indian Ocean: A Review. Trop. Cyclone Res. Rev. 2014, 3, 14. [Google Scholar]
- Elsberry, R.L.; Lambert, T.D.B.; Boothe, M.A. Accuracy of Atlantic and Eastern North Pacific Tropical Cyclone Intensity Forecast Guidance. Weather Forecast. 2007, 22, 747–762. [Google Scholar] [CrossRef]
- Walsh, K.J.E.; McBride, J.L.; Klotzbach, P.J.; Balachandran, S.; Camargo, S.J.; Holland, G.; Knutson, T.R.; Kossin, J.P.; Lee, T.; Sobel, A.; et al. Tropical cyclones and climate change. WIREs Clim. Change 2016, 7, 65–89. [Google Scholar] [CrossRef]
- Sikka, D.R. Forecasting the movement of tropical cyclones in the Indian seas by non-divergent barotropic model. MAUSAM 1975, 26, 323–325. [Google Scholar] [CrossRef]
- George, J.E.; Gray, W.M. Tropical Cyclone Motion and Surrounding Parameter Relationships. J. Appl. Meteorol. 1976, 15, 1252–1264. [Google Scholar] [CrossRef]
- Gray, W.M. Global view of the origin of tropical disturbances and storms. Mon. Weather Rev. 1968, 96, 669–700. [Google Scholar] [CrossRef]
- DeMaria, M.; Knaff, J.A.; Connell, B.H. A Tropical Cyclone Genesis Parameter for the Tropical Atlantic. Weather Forecast. 2001, 16, 219–233. [Google Scholar] [CrossRef]
- Kotal, S.D.; Bhattacharya, S.K.; Bhowmik, S.R. Development of NWP based objective cyclone prediction system (CPS) for North Indian Ocean tropical cyclones—evaluation of performance. Trop. Cyclone Res. Rev. 2014, 3, 162–177. [Google Scholar]
- Ooyama, K.V. Conceptual Evolution of the Theory and Modeling of the Tropical Cyclone. J. Meteorol. Soc. Jpn. Ser II 1982, 60, 369–380. [Google Scholar] [CrossRef]
- Kimberlain, T.B.; Breman, M.J. Tropical cyclone motion. In Global Guide to Tropical Cyclone Forecasting; World Meteorological Organization: Geneva, Switzerland, 2017; pp. 63–125. [Google Scholar]
- Chan, J.C.L. Interannual and interdecadal variations of tropical cyclone activity over the western North Pacific. Meteorol. Atmospheric Phys. 2005, 89, 143–152. [Google Scholar] [CrossRef]
- Chen, T.-C.; Wang, S.-Y.; Yen, M.-C.; Clark, A.J. Impact of the Intraseasonal Variability of the Western North Pacific Large-Scale Circulation on Tropical Cyclone Tracks. Weather Forecast. 2009, 24, 646–666. [Google Scholar] [CrossRef]
- Akter, N.; Tsuboki, K. Recurvature and movement processes of tropical cyclones over the Bay of Bengal. Q. J. R. Meteorol. Soc. 2021, 147, 3681–3702. [Google Scholar] [CrossRef]
- Subramanyam Raju, A.; Basu Ray Chaudhury, A. (Eds.) BIMSTEC: Mapping Sub-Regionalism in Asia. Routledge: Abingdon, UK; New York, NY, USA, 2023. [Google Scholar] [CrossRef]
- Lin, G.; Chen, H.; Hovius, N.; Horng, M.; Dadson, S.; Meunier, P.; Lines, M. Effects of earthquake and cyclone sequencing on landsliding and fluvial sediment transfer in a mountain catchment. Earth Surf. Process. Landf. 2008, 33, 1354–1373. [Google Scholar] [CrossRef]
- McPhaden, M.J.; Foltz, G.R.; Lee, T.; Murty, V.S.N.; Ravichandran, M.; Vecchi, G.A.; Vialard, J.; Wiggert, J.D.; Yu, L. Ocean-Atmosphere Interactions During Cyclone Nargis. Eos Trans. Am. Geophys. Union 2009, 90, 53–54. [Google Scholar] [CrossRef]
- Das, S.; Ashrit, R.; Iyengar, G.R.; Mohandas, S.; Das Gupta, M.; George, J.P.; Rajagopal, E.N.; Dutta, S.K. Skills of different mesoscale models over Indian region during monsoon season: Forecast errors. J. Earth Syst. Sci. 2008, 117, 603–620. [Google Scholar] [CrossRef]
- Mohanty, U.C.; Nadimpalli, R.; Srivastava, A.; Das, A.K.; Osuri, K.K.; Routray, A.; Joseph, S.; Murty, P.L.N.; Pattanaik, D.R.; Gopalakrishnan, S.G.; et al. The History of Mesoscale Severe Weather Monitoring and Forecasting in India. MAUSAM 2025, 76, 79–102. [Google Scholar] [CrossRef]
- Srivast, A.; Kumar, P.; Panda, S.K.; Das, A.K.; Pattanaik, D.R. Development of India Meteorological Department—High Resolution Rapid Refresh (IMD-HRRR) Modeling System for Very Short Range Weather Forecasting 2022. Pure Applied Geophysics 2024, 181, 3393–3408. [Google Scholar] [CrossRef]
- Mohandas, S.; Ashrit, R.; Rajagopal, E.N. Modelling Activities for Forecasting Extreme Events. In Impact of Climate Change on Hydrological Cycle, Ecosystem, Fisheries and Food Security; CRC Press: London, UK, 2022; pp. 111–123. ISBN 978-1-003-29976-9. [Google Scholar]
- Kumar, S.; Dube, A.; Kumar, S.; Rani, S.I.; Sharma, K.; Karunasagar, S.; Mohandas, S.; Ashrit, R.; George, J.P.; Mitra, A.K. Improved skill of NCMRWF Unified Model (NCUM-G) in forecasting tropical cyclones over NIO during 2015–2019. J. Earth Syst. Sci. 2022, 131, 114. [Google Scholar] [CrossRef]
- Kumar, S.; Jayakumar, A.; Bushair, M.T.; Buddhi, P.; George, G.; Lodh, A.; Rani, S.I.; George, J.P. Implementation of New High Resolution NCUM Analysis-Forecast System in Mihir HPCS. NCMRWF, MoES: Noida, India, 2018. [Google Scholar]
- Yokoi, S.N.; Takayabu, Y. Environmental and External Factors in the Genesis of Tropical Cyclone Nargis in April 2008 over the Bay of Bengal. J. Meteorol. Soc. Jpn. Ser II 2010, 88, 425–435. [Google Scholar] [CrossRef]
- Mitra, A.K.; Bohra, A.K.; Rajeevan, M.N.; Krishnamurti, T.N. Daily Indian Precipitation Analysis Formed from a Merge of Rain-Gauge Data with the TRMM TMPA Satellite-Derived Rainfall Estimates. J. Meteorol. Soc. Jpn. Ser II 2009, 87A, 265–279. [Google Scholar] [CrossRef]
- Goni, G.J.; Trinanes, J.A. Ocean thermal structure monitoring could aid in the intensity forecast of tropical cyclones. Eos Trans. Am. Geophys. Union 2003, 84, 573–578. [Google Scholar] [CrossRef]
- Hersbach, H.; Bell, B.; Berrisford, P.; Hirahara, S.; Horányi, A.; Muñoz-Sabater, J.; Nicolas, J.; Peubey, C.; Radu, R.; Schepers, D.; et al. The ERA5 global reanalysis. Q. J. R. Meteorol. Soc. 2020, 146, 1999–2049. [Google Scholar] [CrossRef]
- Reynolds, R.W.; Smith, T.M.; Liu, C.; Chelton, D.B.; Casey, K.S.; Schlax, M.G. Daily High-Resolution-Blended Analyses for Sea Surface Temperature. J. Clim. 2007, 20, 5473–5496. [Google Scholar] [CrossRef]
- Bhatla, R.; Raj, R.; Singh, M. Climatology of recurvature of tropical cyclone over Bay of Bengal and Arabian Sea. MAUSAM 2018, 69, 437–442. [Google Scholar] [CrossRef]
- Mohapatra, M.; Sharma, M. Cyclone warning services in India during recent years: A review. Mausam 2019, 70, 635–666. [Google Scholar]
- Mohapatra, M.; Sharma, M.; Devi, S.S.; Kumar, S.V.J.; Sabade, B.S. Frequency of genesis and landfall of different categories of tropical cyclones over the North Indian Ocean. MAUSAM 2021, 72, 1–26. [Google Scholar] [CrossRef]
- Roose, S.; Ajayamohan, R.S.; Ray, P.; Mohan, P.R.; Mohanakumar, K. ENSO influence on Bay of Bengal cyclogenesis confined to low latitudes. Npj Clim. Atmospheric Sci. 2022, 5, 31. [Google Scholar] [CrossRef]
- Kaplan, J.; DeMaria, M.; Knaff, J.A. A Revised Tropical Cyclone Rapid Intensification Index for the Atlantic and Eastern North Pacific Basins. Weather Forecast. 2010, 25, 220–241. [Google Scholar] [CrossRef]
- Kaplan, J.; Rozoff, C.M.; DeMaria, M.; Sampson, C.R.; Kossin, J.P.; Velden, C.S.; Cione, J.J.; Dunion, J.P.; Knaff, J.A.; Zhang, J.A.; et al. Evaluating Environmental Impacts on Tropical Cyclone Rapid Intensification Predictability Utilizing Statistical Models. Weather Forecast. 2015, 30, 1374–1396. [Google Scholar] [CrossRef]
- Wang, Y.; Wu, C.-C. Current understanding of tropical cyclone structure and intensity changes? A review. Meteorol. Atmospheric Phys. 2004, 87, 257–278. [Google Scholar] [CrossRef]
- McTaggart-Cowan, R.; Davies, E.L.; Fairman, J.G., Jr.; Galarneau, T.J., Jr.; Schultz, D.M. Revisiting the 26.5 C sea surface temperature threshold for tropical cyclone development. Bull. Am. Meteorol. Soc. 2015, 96, 1929–1943. [Google Scholar]
- Bi, M.; Wang, R.; Li, T.; Ge, X. Effects of vertical shear on intensification of tropical cyclones of different initial sizes. Front. Earth Sci. 2023, 11, 1106204. [Google Scholar] [CrossRef]
- On the movement of tropical cyclones. Eos Trans. Am. Geophys. Union 1946, 27, 641–655. [CrossRef]
- Bhaskar Rao, D.V.; Srinivas, D.; Satyanarayana, G.C. Trends in the genesis and landfall locations of tropical cyclones over the Bay of Bengal in the current global warming era. J. Earth Syst. Sci. 2019, 128, 194. [Google Scholar] [CrossRef]
- Sanders, F.; Gyakum, J.R. Synoptic-Dynamic Climatology of the “Bomb. ” Mon. Weather Rev. 1980, 108, 1589–1606. [Google Scholar] [CrossRef]
- Bhowmik, S.K.R. An evaluation of cyclone genesis parameter over the Bay of Bengal using model analysis. MAUSAM 2003, 54, 351–358. [Google Scholar] [CrossRef]
- Kotal, S.D.; Roy Bhowmik, S.K.; Kundu, P.K.; Das Kumar, A. A statistical cyclone intensity prediction (SCIP) model for the Bay of Bengal. J. Earth Syst. Sci. 2008, 117, 157–168. [Google Scholar] [CrossRef]
- Mohapatra, M.; Nayak, D.P.; Sharma, R.P.; Bandyopadhyay, B.K. Evaluation of official tropical cyclone track forecast over north Indian Ocean issued by India Meteorological Department. J. Earth Syst. Sci. 2013, 122, 589–601. [Google Scholar] [CrossRef]
- Yoshida, A.; Asuma, Y. Structures and Environment of Explosively Developing Extratropical Cyclones in the Northwestern Pacific Region. Mon. Weather Rev. 2004, 132, 1121–1142. [Google Scholar] [CrossRef]
- Fu, S.; Sun, J.; Sun, J. Accelerating two-stage explosive development of an extratropical cyclone over the northwestern Pacific Ocean: A piecewise potential vorticity diagnosis. Tellus Dyn. Meteorol. Oceanogr. 2014, 66, 23210. [Google Scholar] [CrossRef]
- Ashrit, R.; Dube, A.; Sharma, K.; Singh, H.; Singh, S.K.A.; Mohandas, S.; Karunasagar, S. Forecasting of Severe Weather Events Over India. In Social and Economic Impact of Earth Sciences; Gahalaut, V.K., Rajeevan, M., Eds.; Springer Nature Singapore: Singapore, 2023; pp. 97–120. ISBN 978-981-19-6928-7. [Google Scholar]
- Hoskins, B.J.; Draghici, I.; Davies, H.C. A new look at the ω-equation. Q. J. R. Meteorol. Soc. 1978, 104, 31–38. [Google Scholar] [CrossRef]
- Martin, J.E.; Otkin, J.A. The Rapid Growth and Decay of an Extratropical Cyclone over the Central Pacific Ocean. Weather Forecast. 2004, 19, 358–376. [Google Scholar] [CrossRef]
- Holton, J.R. An Introduction to Dynamic Meteorology, 4th ed.; International Geophysics Series; Elsevier Academic Press: Burlington, MA, USA, 2004; ISBN 978-0-12-354015-7. [Google Scholar]
- Clark, P.A.; Gray, S.L. Sting jets in extratropical cyclones: A review. Q. J. R. Meteorol. Soc. 2018, 144, 943–969. [Google Scholar] [CrossRef]
- Velden, C.S.; Leslie, L.M. The Basic Relationship between Tropical Cyclone Intensity and the Depth of the Environmental Steering Layer in the Australian Region. Weather Forecast. 1991, 6, 244–253. [Google Scholar] [CrossRef]
- Heming, J.T. Met Office Unified Model Tropical Cyclone Performance Following Major Changes to the Initialization Scheme and a Model Upgrade. Weather Forecast. 2016, 31, 1433–1449. [Google Scholar] [CrossRef]
- Sharma, S.; Kumar, A.; Chakraborty, A. Intensification of heatwave conditions during Cyclone Mocha in 2023. Weather 2024, 79, 220–222. [Google Scholar]


| Forecast Lead Time | IC 13-05-2023 | IC 12-05-2023 | IC 11-05-2023 | IC 10-05-2023 | Average PDE (km) | Landfall PDE (km) |
|---|---|---|---|---|---|---|
| 0 | 24.17 | 22.26 | 22.26 | 28 | 24.2 | 9 |
| 12 | 15.4 | 22.26 | 34.49 | 26 | 24.5 | 9 |
| 24 | 71.49 | 99.08 | 44.53 | 59.8 | 68.7 | 9 |
| 36 | 178.78 | 115.34 | 113.8 | 99.15 | 126.8 | 8 |
| 48 | 224.41 | 141.62 | 35.11 | 133.7 | 7 | |
| 60 | 325.11 | 193.28 | 105.29 | 207.9 | 7 | |
| 72 | 262.96 | 61.88 | 162.4 | 5 | ||
| 84 | 328.16 | 56.67 | 192.4 | 5 | ||
| 96 | 257.22 | 87.29 | 172.3 | 4 | ||
| 108 | 187.21 | 187.2 | 3 | |||
| 120 | 196.31 | 196.3 | 1 |
| 03 UTC 14-05-2022 | 03 UTC 15-05-2022 | |||||||||
|---|---|---|---|---|---|---|---|---|---|---|
| Stations | Latitude | Longitude | Obs | 24 | 72 | 120 | Obs | 24 | 72 | 120 |
| Sittwe | 20.16 | 92.86 | 76.35 | 88.86 | 0.22 | 0.01 | 74.25 | 64.50 | 7.49 | 3.2 |
| Pauktaw | 20.18 | 93.07 | 96.17 | 125.92 | 0.80 | 0.02 | 70.17 | 12.84 | 28.95 | 2.9 |
| Kyaukpyu | 19.43 | 93.55 | 81.61 | 101.50 | 0.36 | 0.01 | 41.82 | 54.77 | 17.32 | 0.8 |
| Munaung | 18.86 | 93.73 | 64.07 | 157.02 | 6.61 | 0.00 | 45.88 | 47.11 | 94.00 | 2.5 |
| Buthidaung | 20.86 | 92.52 | 81.49 | 33.73 | 0.20 | 0.00 | 60.55 | 142.72 | 6.21 | 0.8 |
| Matupi | 21.61 | 93.45 | 47.62 | 2.98 | 0.97 | 0.00 | 71.19 | 83.40 | 10.20 | 3.6 |
| Paletwa | 21.31 | 92.85 | 56.99 | 3.31 | 0.11 | 0.04 | 84.73 | 93.40 | 2.76 | 1.3 |
| Hakha | 22.65 | 93.61 | 45.49 | 19.78 | 0.05 | 0.04 | 42.97 | 34.45 | 19.16 | 0.2 |
| Lasho | 22.95 | 97.75 | 10.40 | 11.95 | 26.70 | 9.41 | 9.08 | 1.59 | 111.63 | 4.5 |
| Yangon | 16.84 | 96.18 | 16.88 | 6.88 | 42.03 | 0.07 | 1.53 | 52.46 | 5.88 | 6.1 |
Disclaimer/Publisher’s Note: The statements, opinions and data contained in all publications are solely those of the individual author(s) and contributor(s) and not of MDPI and/or the editor(s). MDPI and/or the editor(s) disclaim responsibility for any injury to people or property resulting from any ideas, methods, instructions or products referred to in the content. |
© 2025 by the authors. Licensee MDPI, Basel, Switzerland. This article is an open access article distributed under the terms and conditions of the Creative Commons Attribution (CC BY) license (https://creativecommons.org/licenses/by/4.0/).
Share and Cite
Pradhan, P.K.; Kumar, S.; Pandey, L.K.; Desamsetti, S.; Thota, M.S.; Ashrit, R. Dynamical Mechanisms of Rapid Intensification and Multiple Recurvature of Pre-Monsoonal Tropical Cyclone Mocha over the Bay of Bengal. Meteorology 2025, 4, 9. https://doi.org/10.3390/meteorology4020009
Pradhan PK, Kumar S, Pandey LK, Desamsetti S, Thota MS, Ashrit R. Dynamical Mechanisms of Rapid Intensification and Multiple Recurvature of Pre-Monsoonal Tropical Cyclone Mocha over the Bay of Bengal. Meteorology. 2025; 4(2):9. https://doi.org/10.3390/meteorology4020009
Chicago/Turabian StylePradhan, Prabodha Kumar, Sushant Kumar, Lokesh Kumar Pandey, Srinivas Desamsetti, Mohan S. Thota, and Raghavendra Ashrit. 2025. "Dynamical Mechanisms of Rapid Intensification and Multiple Recurvature of Pre-Monsoonal Tropical Cyclone Mocha over the Bay of Bengal" Meteorology 4, no. 2: 9. https://doi.org/10.3390/meteorology4020009
APA StylePradhan, P. K., Kumar, S., Pandey, L. K., Desamsetti, S., Thota, M. S., & Ashrit, R. (2025). Dynamical Mechanisms of Rapid Intensification and Multiple Recurvature of Pre-Monsoonal Tropical Cyclone Mocha over the Bay of Bengal. Meteorology, 4(2), 9. https://doi.org/10.3390/meteorology4020009