Abstract
The antidiabetic drug metformin has a wide range of metabolic effects and may also reduce the risk of obesity-related diseases. The aim of the current study was to investigate if metformin could counteract meldonium-induced fatty liver. Four groups of male C57BL/6J mice were fed a low-fat control diet, or low-fat diets supplemented with metformin, meldonium, or metformin and meldonium for three weeks. Meldonium treatment led to 5.2-fold higher hepatic triacylglycerol (TAG) levels compared to control, and metformin lowered the meldonium-induced lipid accumulation insignificantly by 21%. Mice treated with metformin and meldonium demonstrated significantly lower weight gain, visceral adipose tissue weight and plasma levels of TAG compared to meldonium alone. The hepatic mRNA level of carnitine palmitoyl transferase 1 was increased 2-fold with combined meldonium and metformin treatment compared to meldonium treatment (p < 0.001). Increased hepatic expression of genes involved in fatty acid oxidation and lipid transport was observed in the combination group compared to control, and increased gene expression of the mitochondrial uncoupling protein UCP2 was observed compared to the meldonium group. In addition, the product of fatty acid oxidation, acetylcarnitine, increased in plasma in metformin-treated mice. Altogether, metformin treatment influenced hepatic lipid metabolism and lowered plasma TAG in meldonium-induced fatty liver in mice.
1. Introduction
Non-alcoholic fatty liver disease (NAFLD) is a condition caused by a combination of factors triggering disturbances in the lipid metabolism, resulting in lipid deposition in hepatocytes [1]. The condition is closely linked to the metabolic syndrome, dyslipidemia, diabetes and insulin resistance, and NAFLD is frequently observed in obesity-related morbidity and mortality [2]. Limited mitochondrial fatty acid oxidation is a common feature in NAFLD [3,4] and improper regulation of lipid oxidation and lipogenesis is suggested as a prime factor for the development of fatty liver, also called hepatic steatosis [5]. Several additional events, such as increased adipose tissue lipolysis, increased lipid uptake by the liver, and impaired synthesis of very-long density lipoprotein (VLDL) particles contribute to excessive intrahepatic accumulation of lipids. All these processes can give rise to oxidative stress and metabolically induced inflammation [6,7,8,9]. As metabolic dysfunction is important in the pathogenesis of NAFLD, the new name metabolic dysfunction associated with fatty liver disease (MAFLD) has been suggested [10].
Metformin is the first-line oral antidiabetic drug in the pharmacological treatment for patients with type 2 diabetes mellitus, and in addition to its well-documented effects on glucose metabolism and insulin sensitivity, studies have shown that mechanisms include effects on fatty acid metabolism, cellular respiration and anti-inflammatory processes [11]. Metformin has been suggested as a diabetes-preventive drug in high-risk populations [12], as well as in the treatment of NAFLD [13]. The insulin-sensitizing effect of metformin is of interest in the treatment of NAFLD [13,14,15], as insulin resistance is an almost universal finding in NAFLD patients [16]. One study reported that metformin significantly improved insulin resistance and reduced liver volume by 20% in patients with NAFLD [17], while others have reported the lowering of serum levels of lipids and glucose in patients with liver steatosis, thereby mediating an improvement in insulin sensitivity [18,19]. Metformin has been reported to improve fatty liver in rodents fed high-fat diets by reducing the inflammation and lipid deposition in the liver [20,21,22], and has even reversed severe NAFLD in mice [20].
Mitochondrial β-oxidation is the process by which fatty acid molecules are used to generate acetyl-CoA, NADH and FADH2 in the mitochondria, serving as the main energy provider when glucose levels are low. Carnitine is a molecule present in all cells that plays a crucial role in the transport of fatty acids across the mitochondrial membrane into the intermembrane space. Carnitine is predominantly obtained from the diet, in addition to endogenous biosynthesis from the amino acid lysine and methionine [23,24]. The carnitine shuttle is a rate-limiting step in β-oxidation of long-chain fatty acids in the mitochondria; thus, carnitine concentration potentially regulates the transport of fatty acids into the mitochondria [25]. A deficiency in carnitine can lead to a decreased ability for the tissue to utilize long-chain fatty acids as a source of energy as these will not be transported into the mitochondria. It has been suggested that the accumulation of medium- and long-chain acylcarnitine metabolites is a result of diminished mitochondrial function and a defect in fatty acid oxidation [26,27]. Consequently, measuring the plasma acylcarnitines enables the monitoring of metabolic status and alteration in mitochondrial β-oxidation [28].
Meldonium (3-(2,2,2-trimethylhydrazinium) propionate dehydrate) is an anti-ischemic drug with the ability to decrease the carnitine concentration by suppressing the carnitine biosynthesis [29,30]. Its mechanism of action is through inhibiting the enzyme γ-butyrobetaine hydroxylase, which catalyzes the last step in the biosynthesis of carnitine [31]. While the cardiovascular condition is improved by meldonium, the decrease in hepatic carnitine concentrations has been shown to result in fatty liver in rats fed a low-fat diet [32], and severe NAFLD in male mice fed a high-fat diet [33] due to the partial inhibition of fatty acid oxidation [34], and thus, meldonium treatment can be used as a model of fatty liver disease.
The aim of the present study was to investigate whether the antidiabetic drug metformin could facilitate improvement in hepatic mitochondrial function and attenuate the development of pharmacologically induced steatosis by the anti-ischemic drug meldonium.
2. Results
2.1. The Effect of Metformin on Weight Development in Mice with Meldonium-Induced Metabolic Disturbanses
There was no significant difference between the mean start weights and end weights of mice fed control, metformin, meldonium or metformin + meldonium diets (Table 1). However, the mice fed meldonium + metformin had a lower growth rate throughout the 3 weeks of feeding, resulting in a significantly lower weight gain (Table 1) than mice in the other feeding groups despite an identical feed intake. This did not lead to significant differences in the subcutaneous adipose tissue depot, but a reduction in the visceral adipose tissue depot was observed in metformin + meldonium-fed mice compared to the other feeding groups.

Table 1.
Weight data from C57BL/6 mice fed low-fat diets supplemented with metformin, meldonium, or metformin and meldonium for 21 days 1.
2.2. The Effect of Metformin on Meldonium-Induced Fatty Liver
Meldonium is associated with the development of fatty liver [32], and in the present study, the total hepatic lipid levels and hepatic TAG levels of the meldonium-fed mice were significantly increased compared to control and metformin fed mice (Figure 1A,B). Meldonium elevated the TAG levels seven-fold compared to control mice (p = 0.011). Whereas both hepatic total lipid and TAG levels in meldonium-treated mice were significantly higher than in control mice, total lipid and TAG levels in mice fed meldonium and metformin were increased; however, not significantly compared to control mice (Figure 1A,B). The hepatic cholesterol and phospholipid levels were unchanged by both meldonium and metformin (Figure 1B,C). Metformin alone did not significantly alter the hepatic TAG levels (Figure 1B). Oil red O histological staining of frozen liver samples showed that meldonium treatment led to a high number of very big lipid droplets (Figure 2). Although metformin treatment also led to increased lipid droplet size, the very big droplets were not observed in mice fed metformin together with meldonium.
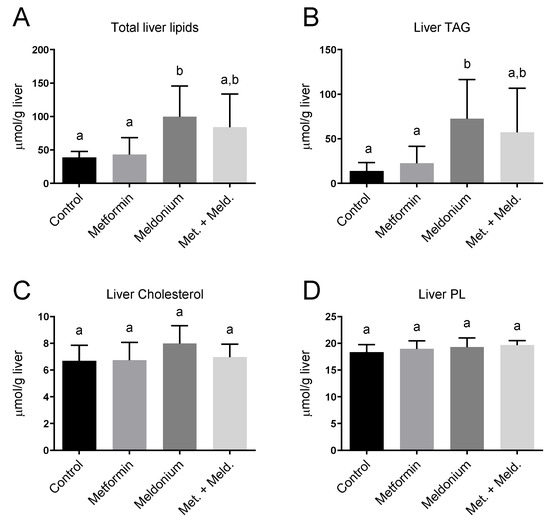
Figure 1.
Hepatic lipid levels in low-fat-diet-fed mice (control) and mice treated with metformin, meldonium or meldonium and metformin for 21 days. (A) Total liver lipids, (B) triacylglycerol (TAG), (C) Cholesterol, (D) Phospholipids (PL). Mean values with standard deviation are shown (n = 8). Statistical difference between mean values was determined by one-way ANOVA and Tukey’s post hoc test, and dissimilar letters indicate statistically significant mean difference between groups (p < 0.05).
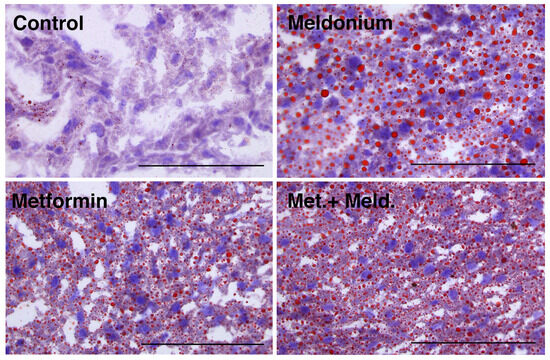
Figure 2.
Hepatic lipid droplets in low-fat-diet-fed mice (control) and mice treated with metformin, meldonium or meldonium and metformin for 21 days. Representative images of liver cryo-sections stained with Oil Red O and hematoxylin and captured at 40× magnification using a light microscope (n = 3–4). Scale bar indicates 100 μm.
2.3. Plasma Carnitine Levels in Response to Mildronate and Meldonium Treatment
The precursor for carnitine in the carnitine biosynthesis, trimethyllysine, showed no changes in plasma levels in any of the experimental feeding groups (Figure 3A). However, the downstream carnitine precursor, γ-butyrobetaine, was, as expected, significantly increased in the meldonium-fed group (Figure 3B). The γ-butyrobetaine level was further increased when metformin was included. In fact, the γ-butyrobetaine level was significantly higher in the combination of metformin and meldonium feeding group than with meldonium alone (p = 0.011). In contrast, free L-carnitine, palmitoylcarnitine and acetylcarnitine levels were significantly decreased by meldonium, and metformin neither attenuated nor exacerbated this effect (Figure 3C–E). The plasma level of acetylcarnitine was significantly increased by metformin monotherapy compared to control, whereas metformin did not alter the plasma levels of the other acylcarnitines or free L-carnitine.
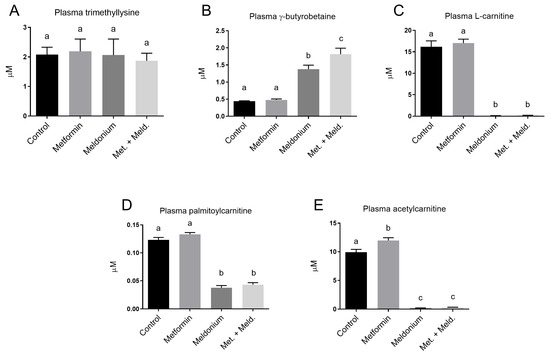
Figure 3.
Plasma levels of L-carnitine precursors, L-carnitine and acylcarnitines in low-fat-diet-fed mice (control) and mice treated with metformin, meldonium or meldonium and metformin for 21 days. (A) Trimethyllysine, (B) g-butyrobetaine, (C) free L-carnitine, (D) palmitoylcarnitine and (E) acetylcarnitine. Mean values with standard deviation are shown (n = 8–10). Statistical difference between mean values was determined by one-way ANOVA and Tukey’s post hoc test, and dissimilar letters indicate statistically significant mean difference between groups (p < 0.05).
2.4. Metformin Reduced TAG in Mice with Meldonium-Induced Fatty Liver
Increased hepatic mitochondrial fatty acid oxidation has been associated with lowering of plasma TAG [35,36]. Meldonium-fed mice displayed no significant changes in plasma lipid levels (Figure 4), but a reduced plasma TAG level was observed in the metformin + meldonium group compared to the control group (p = 0.002; Figure 4A). Additionally, mice fed metformin alone tended to have a lower TAG level compared to control (p = 0.069). Plasma total cholesterol and phospholipids were not influenced by the treatments (Figure 4B,C). The non-esterified fatty acid (NEFA) level was not significantly changed in the different feeding groups (Figure 4D).
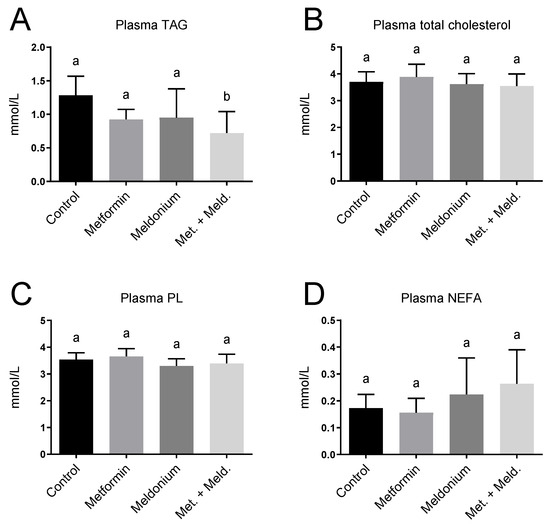
Figure 4.
Plasma lipid levels in low-fat-diet-fed mice (control) and mice treated with metformin, meldonium or meldonium and metformin for 21 days. (A) Triacylglycerol (TAG), (B) total cholesterol, (C) phospholipid (PL) and (D) non-esterified fatty acids (NEFAs). Mean values with standard deviation are shown (n = 8–10). Statistical difference between mean values was determined by one-way ANOVA and Tukey’s post hoc test, and dissimilar letters indicate statistically significant mean difference between groups (p < 0.05).
2.5. Effects of Meldonium and Metformin on Fatty Acid Metabolism in Liver
The observed increased plasma acetylcarnitine level in metformin-treated mice could be linked to effects on mitochondrial function and fatty acid oxidation. To further investigate this, in vitro palmitoyl-CoA oxidation was assayed as acid-soluble products in fresh liver samples, and no significant changes in the potential for mitochondrial β-oxidation were observed (Figure 5A). Interestingly, the mRNA level of the rate-limiting enzyme in mitochondrial fatty acid oxidation, Cpt1a, was increased 2.9-fold in the combination of meldonium + metformin compared to control (p < 0.0001) and 2-fold compared to the meldonium group (p = 0.0007; Table 2). Moreover, gene expression of the mitochondrial HMG-CoA synthase (Hmgcs2) was increased in the meldonium + metformin group compared to control (p = 0.008). Finally, of the different experimental groups, the highest gene expression of Cpt2 was found in the combination of meldonium and metformin (Table 2). Peroxisomes are also involved in the oxidation of fatty acids, especially long-chain fatty acids. Notably, the gene expression of Acox1 tended to be increased by metformin compared to control (p = 0.111) and was significantly increased in the combination group of metformin and meldonium vs. control (p = 0.005) and meldonium (p = 0.025). Hepatic ACOX1 enzyme activity was significantly increased by meldonium and tended to increase with metformin alone (p = 0.11; Figure 5B). The upregulation of these factors suggests PPAR activation. Indeed, the gene expression of PPARα and PPARγ tended to be increased after metformin and the combination of metformin and meldonium treatment (Table 2), and the PPAR cofactor Ppargc1a was significantly increased in the meldonium + metformin group compared to control and metformin alone. Altogether, these results show that metformin modifies the hepatic and peroxisomal β-oxidation in carnitine-depleted mice. The increase in mRNA levels of Cd36 both in the meldonium (1-fold increase) and in the combination of meldonium and metformin treatment (1.35-fold increase), suggested that a higher flux of fatty acid to the liver occurred, particularly in carnitine-depleted mice treated with metformin. In addition, gene expression of the mitochondrial uncoupling protein Ucp2 was increased in the combination of meldonium and metformin compared to meldonium alone (p = 0.049). The hepatic enzyme activity of fatty acid synthase (FAS) was not significantly altered by metformin or meldonium (Figure 5C), despite a tendency to reduced activity in meldonium compared to control (p = 0.071). The activity of glycerol 3-phosphate acyltransferase (GPAT), involved in TAG synthesis, was higher in the meldonium group compared to control and metformin, and tended to be lower in meldonium + metformin compared to meldonium alone (p = 0.079; Figure 5D).
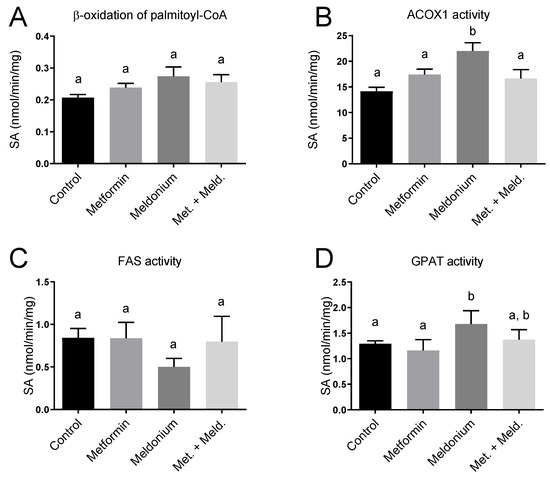
Figure 5.
Hepatic enzyme activities in control low-fat-diet-fed C57BL/6 mice, and mice treated with metformin, meldonium or meldonium and metformin for 21 days. (A) β-oxidation of palmitoyl-coenzyme A (CoA) analyzed in fresh liver homogenates. (B) ACOX1 activity, (C) fatty acid synthase (FAS) activity and (D) GPAT activity analyzed in frozen liver samples. Mean values with standard deviation are shown (n = 6). Statistical difference between mean values was determined by one-way ANOVA and Tukey’s post hoc test, and dissimilar letters indicate statistically significant mean difference between groups (p < 0.05).
Table 2.
Gene expression in livers of C57BL/6 mice fed low-fat diets supplemented with metformin, meldonium or metformin and meldonium for 21 days 1.
3. Discussion
This work demonstrates that metformin decreased plasma TAGs, reduced visceral adipose tissue depots and body weight gain, and partly protected against the accumulation of liver TAG in meldonium-treated male C57BL/6 mice. These improvements could be in part due to increased hepatic PPARα-induced gene activation and peroxisomal fatty acid oxidation by metformin, particularly in the presence of meldonium.
The liver is important in the regulation of plasma TAG levels and plasma TAG is determined by a delicate balance between hepatic TAG biosynthesis and secretion on the one hand and plasma TAG clearance on the other. In the present study, the clearance of lipoproteins was not studied, but metformin alone, and particularly in combination with meldonium, influenced several genes involved in TAG biosynthesis in the liver. Although metformin did not significantly stimulate the hepatic capacity of mitochondrial β-oxidation, an increased mRNA level of CPT1, the rate-limiting enzyme in mitochondrial fatty acid oxidation, was observed. This increased Cpt1a gene expression by metformin was more prominent in the presence of meldonium (p < 0.0001 vs. control). Increased gene expression of the PPARα response gene HMG-CoA synthase 2, a protein located to the mitochondria and rate-limiting in ketogenesis, was found in the combination group of metformin and meldonium compared to control (p = 0.025). Moreover, the plasma level of acetylcarnitine, involved in the transport of one of the end-products of mitochondrial and peroxisomal β-oxidation, acetyl-CoA [37,38], was increased by metformin treatment. Moreover, in carnitine-depleted mice, metformin increased gene expression of Ppargc1a, an important regulator of mitochondrial biogenesis [39]. Altogether, this shows that metformin could potentially modify mitochondrial function in carnitine-depleted mice. Peroxisomal fatty acid oxidation seemed to be influenced by metformin co-treatment, as the gene expression of Acox1 was increased in the combination of meldonium and metformin compared to control. These findings support the involvement of PPARα activation. Indeed, the gene expression of PPARα (p = 0.04) was increased in the metformin groups compared to the groups fed control and meldonium diets. The lack of effect of metformin on FAS and GPAT activity indicates that while metformin was previously shown to reduce expression of lipogenic markers in adipose tissue [40], effects in the liver are mainly through a PPARα-stimulated increase in β-oxidation.
The increased PPARα levels were accompanied by increased gene expression of Cd36; hence, metformin may drain fatty acids into the liver in carnitine-depleted mice accompanied with increased hepatic fatty acid oxidation capacity. This is supported by the loss of visceral adipose tissue and alterations in hepatic lipid droplets, indicating an effect of metformin on lipid turnover. Altogether, as carnitine-dependent mitochondrial β-oxidation would be inhibited in meldonium-treated mice (Figure 3C), other PPARα-induced processes, such as the induction of genes involved in lipid transport and peroxisomal β-oxidation, could have been important for the observed effect of metformin. In line with this, metformin only tended to reduce liver TAG in the presence of meldonium, reflecting the importance of mitochondrial β-oxidation in the regulation of liver lipid levels. A significant TAG lowering was observed in plasma, supporting that metformin influences TAG-regulating processes despite the meldonium-induced inhibition of mitochondrial β-oxidation.
Hepatic macrosteatosis with large lipid droplets is associated with severity in rodent models of fatty liver disease [41,42], and metformin and meldonium co-treatment noticeably reduced lipid droplet size compared to meldonium alone. This is in line with recent findings in rodents by Lin et al. demonstrating that metformin treatment reduced obesity-related NAFLD through AMPK/LXRα-induced downregulation of apolipoprotein A5, which is involved in hepatocyte lipid droplet formation [43]. UCP2 is another gene suggested to be strongly involved in the development of NAFLD, due to its role in lipid metabolism and oxidative stress [44]. Metformin almost doubled UCP2-gene expression compared to meldonium alone (Table 2), and thus, UCP2 may be a potential metformin target, as also supported by cell culture studies [45].
As the current mouse model partly inhibits carnitine-mediated fatty acid transport and mitochondrial β-oxidation, it will reflect the human NAFLD/MAFLD disease, particularly with regard to metabolic dysfunction involving mitochondrial function [3,4]. Thus, it is possible that treatments specifically directed at increasing β-oxidation may not reach their full potential in this mouse model. Another limitation of the current study was the short treatment period. As the early phase of fatty liver disease was the focus, long-term effects or potential side effects could not be elucidated. Moreover, as only male mice were included in the study, gender specific effects of metformin in this mouse model of meldonium-induced fatty liver requires further studies.
4. Materials and Methods
4.1. Animals and Treatment
Male C57BL/6J mice (Taconic, Denmark) at 10 weeks old were randomized to Makrolon III cages, 2 animals per cage, in an open system. They were kept under standard laboratory conditions with the temperature at 22 ± 1 °C, dark/light cycles of 12/12 h, relative humidity 55 ± 5% and 20 air changes per hour. The animal study was conducted according to the EU directive for animal experiments and complied with the ARRIVE guidelines, and the Norwegian Food Safety Authorities approved the protocol (project no. 5071).
Animal cages were further block-randomized into 4 groups of 10 mice, based on start/killing day and placement in the racks (www.random.org, accessed on 13 August 2013). After 7 days of acclimatization, all groups were given low-fat diets containing 7% (w/w) fat, 66% (w/w) carbohydrates, 19% (w/w) protein and 5% (w/w) micronutrients (Table 3). The diets differed in the drug(s) added to the intervention diets: metformin (0.17% w/w), meldonium (0.55% w/w), meldonium + metformin (0.55 + 0.17% w/w). The dose of metformin and meldonium was determined based on feed intake, and the obtained doses in the monotherapy and co-therapy groups were comparable. Metformin was purchased from Sigma (St. Louis, MO, USA), and meldonium (Mildronate®, trimethylhydrazinium propionate) was kindly provided by Grindex (Riga, Latvia). All groups had free access to tap water. Feed was provided in a fixed daily amount based on the previous week’s feed intake in the control group, and any left-over feed was removed and weighed daily during the 21-day experiment. A fixed daily amount was used to ensure freshness of the feed, and to minimize waste of drugs, as some drugs were limited. Weight gain was determined twice a week.
Table 3.
Composition of the experimental diets.
4.2. Tissue Harvesting
At sacrifice, mice were anesthetized by the inhalation of 2–5% sevoflurane (Abbott Laboratories Ltd., Berkshire, UK) after four hours of fasting. Blood was collected from the right ventricle of the heart into a tube containing 7.5% EDTA, the samples were chilled on ice for about 15 min, and plasma was separated by centrifugation and stored at −80 °C until further analysis. The liver was harvested, directly chilled on ice and weighed. Designated sections of the liver were selected for different types of analysis. The distal portion of the left central lobe was weighed and chilled on ice for use in β-oxidation analysis (6 mice from each group). The remaining liver was quickly sectioned, frozen in liquid nitrogen and stored at −80 °C until further processing; a piece of the left central lobe was reserved for determination of enzyme activities, and the distal portion of the orbital lobe was reserved for measuring hepatic lipids.
4.3. Plasma Lipids
Plasma lipids were measured enzymatically on a Hitachi 917 system (Roche Diagnostics GmbH, Mannheim, Germany) using the triacylglycerol (GPO-PAP) and cholesterol kit (CHOD-PAP) from Roche Diagnostics, and the phospholipids FS kit from DiaSys (Diagnostic Systems GmbH, Holzheim, Germany).
4.4. Hepatic Enzyme Activities and Hepatic Lipids
Fresh liver samples were homogenized as described earlier [46]. Briefly, 100 mg of liver was homogenized in 1 mL ice-cold sucrose medium, centrifuged and the post-nuclear fraction removed. Palmitoyl-CoA oxidation was measured in the post-nuclear fraction from liver as acid-soluble products, as described by Bremer et al. [47], with some modifications [48].
Liver lipids were extracted according to Bligh and Dyer [49], evaporated under nitrogen and redissolved in isopropanol before analysis. Kits used to determine liver TAG, cholesterol and phospholipids were the same as those used for the plasma lipids described above.
4.5. Gene Expression Analysis
Total cellular RNA was purified from frozen heart and liver samples, and cDNA was produced as previously described [35]. Real-time PCR was performed with Sarstedt 384 well multiply-PCR Plates (Sarstedt Inc., Newton, NC, USA) on the following genes, using probes and primers from Applied Biosystems (Foster City, CA, USA): acyl-coenzyme A oxidase (Acox1, Mm00443579), CD36 antigen (Cd36/Fat, Mm00432403), carnitine palmitoyltransferase 1 (Cpt1a, Mm00550438), Cpt2 (Mm00487202 HMG-CoA synthase (Hmgcs2, Mm00550050), Peroxisome proliferator-activated receptor α (Ppara, Mm00440939_m1), Peroxisome proliferator-activated receptor γ (Pparγ, Mm01184322_m1), Peroxisome proliferator-activated receptor gamma, coactivator 1 alpha (Ppargc1α, Mm01208835_m1), uncoupling protein 2 (Ucp2, Mn00627599_m1). Reference genes used in liver: 18s (Kit-FAM-TAMRA (Reference RT-CKFT-18 s)) from Eurogentech, Seraing, Belgium, ribosomal protein, large, P0 (Rplp0, AX-061958-00-0100) and TATA-box binding protein (Tbp, AX-041188-00) both from Thermo Fisher Scientific Inc. (Waltham, MA, USA). Normfinder was used to assess the optimal reference genes, and data normalized to Rplp0 were used (https://moma.dk/normfinder-software, accessed on 11 February 2017).
4.6. Measurements of Plasma Levels of Carnitine, Its Precursors and Acylcarnitines
Plasma levels of L-carnitine, its biosynthetic precursors trimethyllysine and γ-butyrobetaine, and short- (e.g., acetylcarnitine) and long-chain (e.g., palmitoylcarnitine) acylcarnitines were analyzed with a high-performance liquid chromatography/mass spectrometry method as previously described [50]. Briefly, the procedure included a solid-phase extraction for carnitine and short- and medium-chain acylcarnitines, and a liquid–liquid extraction for protein-bound long-chain acylcarnitines, followed by separation on a reversed-phase column in the presence of a volatile ion-pairing reagent. Detection was achieved using an ion-trap mass spectrometer run in the tandem mass spectrometry (MS/MS) mode. Intra- and inter-day precisions for the determination of carnitine were below 3.4% and accuracies were between 95.2 and 109.0%.
4.7. Histology
Cryo-sections from frozen liver samples were generated using a 1720 Cryostat (Leica Microsystems, Wetzlar, Germany) from 3–4 mice per group. The cryo-sections were fixed in 4% buffered formalin for 10 min, rinsed 3× in dH2O and stained in 0.7% (w/v) Oil Red O (Sigma) in propylene glycol for 10 min, and rinsed 3× dH2O and stained with hematoxylin (Thermo Fisher Scientific, Waltham, MA, USA) for 2 min. Finally, sections were rinsed 3× dH2O and mounted with ImmuMount (Thermo Fisher Scientific). Images were captured using an Olympus BX51 light microscope at 40× magnification with an Olympus DP25 digital color camera (Olympus Corporation, Tokyo, Japan). Three images per section were captured by a blinded investigator, and representative images were selected.
4.8. Statistical Analysis
Data sets were analyzed using Prism Software ver. 10 (GraphPad Software, San Diego, CA, USA) to create figures and to evaluate statistical significance. The results are shown as means of 10 animals per group with their standard deviations, unless otherwise stated. The Shapiro–Wilk test was used to estimate normal distribution, and one-way ANOVA with Tukey’s post hoc test was used to determine statistical significance between the feeding groups. p-values < 0.05 were considered significant.
5. Conclusions
We demonstrated that the antidiabetic drug metformin influenced genes involved in β-oxidation and lipid droplet size in liver, and lowered plasma TAG in a chemically induced model of fatty liver disease. Metformin treatment can potentially stimulate mitochondrial activity and beneficially influence metabolic disease through effects on lipid metabolism. Our findings support the potential use of metformin in the treatment of NAFLD in humans, and its combined effects on glucose response and lipid metabolism in the prevention and treatment of NAFLD should be further explored.
Author Contributions
Conceptualization, B.B. and R.K.B.; methodology, E.S., T.-M.T.L. and B.B.; formal analysis, B.B., T.-M.T.L., R.K.B. and L.M.; writing—original draft preparation, R.K.B. and B.B.; writing—review and editing, E.S. and L.M. All authors have read and agreed to the published version of the manuscript.
Funding
This research was funded by a grant from Bergen Research Foundation to R.K.B (funding no. 806364).
Institutional Review Board Statement
The animal study protocol was approved by the Norwegian State Board of Biological Experiments with Living Animals (Project no. 5071) and was conducted in accordance with the Guide for the Care and Use of Laboratory Animals.
Informed Consent Statement
Not applicable.
Data Availability Statement
The data presented in this study are available on request from the corresponding author.
Acknowledgments
The authors would like to thank Torunn Eide, Kari Williams, Kari Mortensen, Liv Kristine Øysæd, Svein Krüger, and Randi Sandvik for their excellent technical assistance. We also thank the staff at the UiB animal facility.
Conflicts of Interest
The authors declare no conflicts of interest. The funders had no role in the design of the study; in the collection, analyses, or interpretation of data; in the writing of the manuscript; or in the decision to publish the results.
References
- LaBrecque, D.; Abbas, Z.; Anania, F.; Ferenci, P.; Ghafoor Khan, A.; Goh, K.L.; Hamid, S.S.; Isakov, V.; Lizarzabal, M.; Mojica Pernaranda, M.; et al. Nonalcoholic fatty liver disease and nonalcoholic steatohepatitis. World Gastroenterol. Organ. Glob. Guidel. 2012. Available online: https://www.worldgastroenterology.org/guidelines (accessed on 12 January 2024).
- Younossi, Z.M.; Koenig, A.B.; Abdelatif, D.; Fazel, Y.; Henry, L.; Wymer, M. Global epidemiology of nonalcoholic fatty liver disease-Meta-analytic assessment of prevalence, incidence, and outcomes. Hepatology 2016, 64, 73–84. [Google Scholar] [CrossRef] [PubMed]
- Grattagliano, I.; de Bari, O.; Bernardo, T.C.; Oliveira, P.J.; Wang, D.Q.-H.; Portincasa, P. Role of mitochondria in nonalcoholic fatty liver disease--from origin to propagation. Clin. Biochem. 2012, 45, 610–618. [Google Scholar] [CrossRef] [PubMed]
- Serviddio, G.; Bellanti, F.; Vendemiale, G.; Altomare, E. Mitochondrial dysfunction in nonalcoholic steatohepatitis. Expert. Rev. Gastroenterol. Hepatol. 2011, 5, 233–244. [Google Scholar] [CrossRef] [PubMed]
- Byrne, C.D. Fatty liver: Role of inflammation and fatty acid nutrition. Prostaglandins Leukot. Essent. Fat. Acids 2010, 82, 265–271. [Google Scholar] [CrossRef] [PubMed]
- Heeren, J.; Scheja, L. Metabolic-associated fatty liver disease and lipoprotein metabolism. Mol. Metab. 2021, 50, 101238. [Google Scholar] [CrossRef] [PubMed]
- Ziolkowska, S.; Binienda, A.; Jabłkowski, M.; Szemraj, J.; Czarny, P. The interplay between insulin resistance, inflammation, oxidative stress, base excision repair and metabolic syndrome in nonalcoholic fatty liver disease. Int. J. Mol. Sci. 2021, 22, 11128. [Google Scholar] [CrossRef]
- Angelico, F.; Del Ben, M.; Conti, R.; Francioso, S.; Feole, K.; Fiorello, S.; Cavallo, M.G.; Zalunardo, B.; Lirussi, F.; Alessandri, C.; et al. Insulin resistance, the metabolic syndrome, and nonalcoholic fatty liver disease. J. Clin. Endocrinol. Metab. 2005, 90, 1578–1582. [Google Scholar] [CrossRef] [PubMed]
- Pais, R.; Charlotte, F.; Fedchuk, L.; Bedossa, P.; Lebray, P.; Poynard, T.; Ratziu, V. A systematic review of follow-up biopsies reveals disease progression in patients with non-alcoholic fatty liver. J. Hepatol. 2013, 59, 550–556. [Google Scholar] [CrossRef] [PubMed]
- Gofton, C.; Upendran, Y.; Zheng, M.H.; George, J. MAFLD: How is it different from NAFLD? Clin. Mol. Hepatol. 2023, 29, S17–S31. [Google Scholar] [CrossRef]
- Szymczak-Pajor, I.; Wenclewska, S.; Śliwińska, A. Metabolic Action of Metformin. Pharmaceuticals 2022, 15, 810. [Google Scholar] [CrossRef] [PubMed] [PubMed Central]
- Patel, D.; E Ayesha, I.; Monson, N.R.; Klair, N.; Patel, U.; Saxena, A.; Hamid, P.; Ayesha, I.E. The Effectiveness of Metformin in Diabetes Prevention: A Systematic Review and Meta-Analysis. Cureus 2023, 15, e46108. [Google Scholar] [CrossRef] [PubMed] [PubMed Central]
- Huang, Y.; Wang, X.; Yan, C.; Li, C.; Zhang, L.; Zhang, L.; Liang, E.; Liu, T.; Mao, J. Effect of metformin on nonalcoholic fatty liver based on meta-analysis and network pharmacology. Medicine 2022, 101, e31437. [Google Scholar] [CrossRef] [PubMed] [PubMed Central]
- Bugianesi, E.; Marzocchi, R.; Villanova, N.; Marchesini, G. Non-alcoholic fatty liver disease/non-alcoholic steatohepatitis (NAFLD/NASH): Treatment. Best. Pract. Res. Clin. Gastroenterol. 2004, 18, 1105–1116. [Google Scholar] [CrossRef] [PubMed]
- Pinyopornpanish, K.; Leerapun, A.; Pinyopornpanish, K.; Chattipakorn, N. Effects of Metformin on Hepatic Steatosis in Adults with Nonalcoholic Fatty Liver Disease and Diabetes: Insights from the Cellular to Patient Levels. Gut Liver. 2021, 15, 827–840. [Google Scholar] [CrossRef] [PubMed] [PubMed Central]
- Day, C.P. Pathogenesis of steatohepatitis. Best. Pract. Res. Clin. Gastroenterol. 2002, 16, 663–678. [Google Scholar] [CrossRef] [PubMed]
- Marchesini, G.; Bianchi, G.; Tomassetti, S.; Zoli, M.; Melchionda, N. Metformin in non-alcoholic steatohepatitis. Lancet 2001, 358, 893–894. [Google Scholar] [CrossRef] [PubMed]
- Haukeland, J.W.; Konopski, Z.; Eggesbø, H.B.; von Volkmann, H.L.; Raschpichler, G.; Bjøro, K.; Haaland, T.; Løberg, E.M.; Birkeland, K. Metformin in patients with non-alcoholic fatty liver disease: A randomized, controlled trial. Scand. J. Gastroenterol. 2009, 44, 853–860. [Google Scholar] [CrossRef] [PubMed]
- A Garinis, G.; Fruci, B.; Mazza, A.; De Siena, M.; Abenavoli, S.; Gulletta, E.; Ventura, V.; Greco, M.; Abenavoli, L.; Belfiore, A. Metformin versus dietary treatment in nonalcoholic hepatic steatosis: A randomized study. Int. J. Obes. 2010, 34, 1255–1264. [Google Scholar] [CrossRef] [PubMed]
- Hookman, P.; Barkin, J.S. Current biochemical studies of nonalcoholic fatty liver disease and nonalcoholic steatohepatitis suggest a new therapeutic approach. Am. J. Gastroenterol. 2003, 98, 2093–2097. [Google Scholar] [CrossRef] [PubMed]
- Lin, H.Z.; Yang, S.Q.; Chuckaree, C.; Kuhajda, F.; Ronnet, G.; Diehl, A.M. Metformin reverses fatty liver disease in obese, leptin-deficient mice. Nat. Med. 2000, 6, 998–1003. [Google Scholar] [CrossRef] [PubMed]
- Woo, S.-L.; Xu, H.; Li, H.; Zhao, Y.; Hu, X.; Zhao, J.; Guo, X.; Guo, T.; Botchlett, R.; Qi, T.; et al. Metformin Ameliorates Hepatic Steatosis and Inflammation without Altering Adipose Phenotype in Diet-Induced Obesity. PLoS ONE 2014, 9, e91111. [Google Scholar] [CrossRef] [PubMed] [PubMed Central]
- Bieber, L.L. Carnitine. Annu. Rev. Biochem. 1988, 57, 261–283. [Google Scholar] [CrossRef] [PubMed]
- Vaz, F.M.; Wanders, R.J. Carnitine biosynthesis in mammals. Biochem. J. 2002, 361 Pt. 3, 417–429. [Google Scholar] [CrossRef] [PubMed] [PubMed Central]
- Dambrova, M.; Liepinsh, E.; Kalvinsh, I. Mildronate: Cardioprotective action through carnitine-lowering effect. Trends Cardiovasc. Med. 2002, 12, 275–279. [Google Scholar] [CrossRef] [PubMed]
- Koves, T.R.; Ussher, J.R.; Noland, R.C.; Slentz, D.; Mosedale, M.; Ilkayeva, O.; Bain, J.; Stevens, R.; Dyck, J.R.; Newgard, C.B.; et al. Mitochondrial overload and incomplete fatty acid oxidation contribute to skeletal muscle insulin resistance. Cell Metab. 2008, 7, 45–56. [Google Scholar] [CrossRef] [PubMed]
- Mihalik, S.J.; Goodpaster, B.H.; Kelley, D.E.; Chace, D.H.; Vockley, J.; Toledo, F.G.S.; Delany, J.P. Increased levels of plasma acylcarnitines in obesity and type 2 diabetes and identification of a marker of glucolipotoxicity. Obesity 2010, 18, 1695–1700. [Google Scholar] [CrossRef]
- Bjørndal, B.; Burri, L.; Wergedahl, H.; Svardal, A.; Bohov, P.; Berge, R.K. Dietary supplementation of herring roe and milt enhances hepatic fatty acid catabolism in female mice transgenic for hTNFalpha. Eur. J. Nutr. 2012, 51, 741–753. [Google Scholar] [CrossRef] [PubMed]
- Klusa, V.; Beitnere, U.; Pupure, J.; Isajevs, S.; Rumaks, J.; Svirskis, S.; Dzirkale, Z.; Kalvinsh, I. Mildronate and its neuroregulatory mechanisms: Targeting the mitochondria, neuroinflammation, and protein expression. Medicina 2013, 49, 301–309. [Google Scholar] [CrossRef] [PubMed]
- Liepinsh, E.; Vilskersts, R.; Skapare, E.; Svalbe, B.; Kuka, J.; Cirule, H.; Pugovics, O.; Kalvinsh, I.; Dambrova, M. Mildronate decreases carnitine availability and up-regulates glucose uptake and related gene expression in the mouse heart. Life Sci. 2008, 83, 613–619. [Google Scholar] [CrossRef] [PubMed]
- Spaniol, M.; Brooks, H.; Auer, L.; Zimmermann, A.; Solioz, M.; Stieger, B.; Krähenbühl, S. Development and characterization of an animal model of carnitine deficiency. Eur. J. Biochem. 2001, 268, 1876–1887. [Google Scholar] [CrossRef] [PubMed]
- Degrace, P.; Demizieux, L.; Du, Z.-Y.; Gresti, J.; Caverot, L.; Djaouti, L.; Jourdan, T.; Moindrot, B.; Guilland, J.-C.; Hocquette, J.-F.; et al. Regulation of lipid flux between liver and adipose tissue during transient hepatic steatosis in carnitine-depleted rats. J. Biol. Chem. 2007, 282, 20816–20826. [Google Scholar] [CrossRef] [PubMed]
- Du, Z.-Y.; Ma, T.; Liaset, B.; Keenan, A.H.; Araujo, P.; Lock, E.-J.; Demizieux, L.; Degrace, P.; Frøyland, L.; Kristiansen, K.; et al. Dietary eicosapentaenoic acid supplementation accentuates hepatic triglyceride accumulation in mice with impaired fatty acid oxidation capacity. Biochim. Biophys. Acta 2013, 1831, 291–299. [Google Scholar] [CrossRef] [PubMed]
- Simkhovich, B.Z.; Shutenko, Z.V.; Meirēna, D.V.; Khagi, K.B.; Mežapuķe, R.J.; Molodchina, T.N.; Kalvlņš, I.J.; Lukevics, E. 3-(2,2,2-Trimethylhydrazinium)propionate (THP)—A novel gamma-butyrobetaine hydroxylase inhibitor with cardioprotective properties. Biochem. Pharmacol. 1988, 37, 195–202. [Google Scholar] [CrossRef] [PubMed]
- Berge, R.K.; Flatmark, T.; Osmundsen, H. Enhancement of long-chain acyl-CoA hydrolase activity in peroxisomes and mitochondria of rat liver by peroxisomal proliferators. Eur. J. Biochem. 1984, 141, 637–644. [Google Scholar] [CrossRef] [PubMed]
- Bremer, J. The effect of fasting on the activity of liver carnitine palmitoyltransferase and its inhibition by malonyl-coa. Biochim. Biophys. Acta 1981, 665, 628–631. [Google Scholar] [CrossRef] [PubMed]
- Vik, R.; Bjørndal, B.; Bohov, P.; Brattelid, T.; Svardal, A.; Nygård, O.K.; Nordrehaug, J.E.; Skorve, J.; Berge, R.K. Hypolipidemic effect of dietary water-soluble protein extract from chicken: Impact on genes regulating hepatic lipid and bile acid metabolism. Eur. J. Nutr. 2015, 54, 193–204. [Google Scholar] [CrossRef] [PubMed]
- Bligh, E.G.; Dyer, W.J. A rapid method of total lipid extraction and purification. Can. J. Biochem. Physiol. 1959, 37, 911–917. [Google Scholar] [CrossRef] [PubMed]
- Vigerust, N.F.; Cacabelos, D.; Burri, L.; Berge, K.; Wergedahl, H.; Christensen, B.; Portero-Otin, M.; Viste, A.; Pamplona, R.; Berge, R.K.; et al. Fish oil and 3-thia fatty acid have additive effects on lipid metabolism but antagonistic effects on oxidative damage when fed to rats for 50 weeks. J. Nutr. Biochem. 2012, 23, 1384–1393. [Google Scholar] [CrossRef] [PubMed]
- Berge, R.K.; Bjørndal, B.; Strand, E.; Bohov, P.; Lindquist, C.; Nordrehaug, J.E.; Svardal, A.; Skorve, J.; Nygård, O. Tetradecylthiopropionic acid induces hepatic mitochondrial dysfunction and steatosis, accompanied by increased plasma homocysteine in mice. Lipids Health Dis. 2016, 15, 24. [Google Scholar] [CrossRef] [PubMed] [PubMed Central]
- Berge, R.; Tronstad, K.; Berge, K.; Rost, T.; Wergedahl, H.; Gudbrandsen, O.; Skorve, J. The metabolic syndrome and the hepatic fatty acid drainage hypothesis. Biochimie 2005, 87, 15–20. [Google Scholar] [CrossRef] [PubMed]
- Wang, Y.; Yang, H.; Geerts, C.; Furtos, A.; Waters, P.; Cyr, D.; Wang, S.; Mitchell, G.A. The multiple facets of acetyl-CoA metabolism: Energetics, biosynthesis, regulation, acylation and inborn errors. Mol. Genet. Metab. 2023, 138, 106966. [Google Scholar] [CrossRef] [PubMed]
- Reuter, S.E.; Evans, A.M. Carnitine and acylcarnitines: Pharmacokinetic, pharmacological and clinical aspects. Clin. Pharmacokinet. 2012, 51, 553–572. [Google Scholar] [CrossRef] [PubMed]
- Sanchis-Gomar, F.; Garcia-Gimenez, J.L.; Gomez-Cabrera, M.C.; Pallardo, F.V. Mitochondrial biogenesis in health and disease. Molecular and therapeutic approaches. Curr. Pharm. Des. 2014, 20, 5619–5633. [Google Scholar] [CrossRef] [PubMed]
- Santana, K.N.d.O.; Lelis, D.F.; Mendes, K.L.; Lula, J.F.; Paraíso, A.F.; Andrade, J.M.O.; Feltenberger, J.D.; Cota, J.; da Costa, D.V.; de Paula, A.M.B.; et al. Metformin Reduces Lipogenesis Markers in Obese Mice Fed a Low-Carbohydrate and High-Fat Diet. Lipids 2016, 51, 1375–1384. [Google Scholar] [CrossRef] [PubMed]
- Zhou, L.; Xu, L.; Ye, J.; Li, D.; Wang, W.; Li, X.; Wu, L.; Wang, H.; Guan, F.; Li, P. Cidea promotes hepatic steatosis by sensing dietary fatty acids. Hepatology 2012, 56, 95–107. [Google Scholar] [CrossRef] [PubMed]
- Orlicky, D.J.; Roede, J.R.; Bales, E.; Greenwood, C.; Greenberg, A.; Petersen, D.; McManaman, J.L. Chronic ethanol consumption in mice alters hepatocyte lipid droplet properties. Alcohol. Clin. Exp. Res. 2011, 35, 1020–1033. [Google Scholar] [CrossRef] [PubMed] [PubMed Central]
- Lin, M.-J.; Dai, W.; Scott, M.J.; Li, R.; Zhang, Y.-Q.; Yang, Y.; Chen, L.-Z.; Huang, X.-S. Metformin improves nonalcoholic fatty liver disease in obese mice via down-regulation of apolipoprotein A5 as part of the AMPK/LXRalpha signaling pathway. Oncotarget 2017, 8, 108802–108809. [Google Scholar] [CrossRef] [PubMed] [PubMed Central]
- Hao, L.; Li, S.; Chen, G.; Hu, X. Regulation of UCP2 in nonalcoholic fatty liver disease: From mechanisms to natural product. Chem. Biol. Drug Des. 2024, 103, e14461. [Google Scholar] [CrossRef]
- Buczyńska, A.; Sidorkiewicz, I.; Krętowski, A.J.; Adamska, A. Examining the clinical relevance of metformin as an antioxidant intervention. Front. Pharmacol. 2024, 15, 1330797. [Google Scholar] [CrossRef]


Disclaimer/Publisher’s Note: The statements, opinions and data contained in all publications are solely those of the individual author(s) and contributor(s) and not of MDPI and/or the editor(s). MDPI and/or the editor(s) disclaim responsibility for any injury to people or property resulting from any ideas, methods, instructions or products referred to in the content. |
© 2024 by the authors. Licensee MDPI, Basel, Switzerland. This article is an open access article distributed under the terms and conditions of the Creative Commons Attribution (CC BY) license (https://creativecommons.org/licenses/by/4.0/).