Communication

Expression of Immune Genes and Leukocyte Population in the Conjunctiva, Harderian Gland and Trachea of Chickens Inoculated with a Live Vaccine and a Field Strain Infectious Laryngotracheitis Virus

by
Thanh Tien Tran
1,2,
Nicholas Andronicos
3 and
Priscilla F. Gerber
1,4,*
1
School of Environmental and Rural Science, University of New England, Armidale, NSW 2351, Australia
2
Faculty of Animal Science and Veterinary Medicine, Nong Lam University, Ho Chi Minh City 700000, Vietnam
3
School of Science and Technology, University of New England, Armidale, NSW 2351, Australia
4
Department of Infectious Diseases and Public Health, City University of Hong Kong, Kowloon, Hong Kong SAR, China
*
Author to whom correspondence should be addressed.
Poultry 2024, 3(4), 399-408; https://doi.org/10.3390/poultry3040030
Submission received: 10 August 2024 / Revised: 11 October 2024 / Accepted: 5 November 2024 / Published: 12 November 2024

Abstract

:
Changes in leukocyte populations and immune gene expression associated with attenuated vaccine (SA2) or field (Class 9) strains of infectious laryngotracheitis virus in chicken pullets were observed primarily in the trachea and conjunctiva, while no substantial changes were detected in the Harderian gland. Although there were no significant differences in cellular infiltration in the tissues exposed to Class 9 and SA2, Class 9 induced greater changes in immune gene expression than SA2 in the trachea and conjunctiva and significantly upregulated CD4, CD8A, IRF1, STAT4 and downregulated CXCL12 expression in the trachea. Meanwhile, SA2 significantly upregulated CD14 and downregulated MPO, CCR6 and RAG1 expression in the conjunctiva. In conclusion, gene expression in pullets infected with SA2 and Class 9 were mostly related to inflammatory and tissue-repairing responses in the trachea and conjunctiva. Compared to SA2, Class 9 inoculation was associated with a more robust gene expression of immune markers; however, a larger infiltration of Kul01+, Bu1+ and CD8a+ cells was observed in trachea and conjunctiva after SA2 inoculation.

1. Introduction

Infectious laryngotracheitis (ILT), caused by Gallid herpesvirus 1, also known as infectious laryngotracheitis virus (ILTV), is a disease of the upper respiratory and ocular tracts of birds that causes severe economic losses for poultry producers due to mortality, reduction in body weight gain and egg production [1]. Strict biosecurity practices and vaccination are most commonly used to reduce the economic impact of ILT outbreaks, which pose a significant burden to the global poultry industry [2,3,4,5]. Cell-mediated immunity rather than humoral immunity is critical in protecting chickens from disease [6,7,8,9,10]. More recent studies on the immune responses after virulent ILTV intratracheal challenge of chickens vaccinated with ILTV live vaccines indicate that minor CD8+ infiltration in the trachea is associated with clinical protection against disease, while partially protected birds display significant infiltration of natural killer, CD4+, CD8+ and γδ T cells [11,12]. Vaccination with a chicken embryo origin vaccine led to an early increase in the percentage of CD3+CD8+ T cells at one day post-challenge with ILTV virulent strain 1874C5 and is associated with decreases in clinical scores, mortality, virus replication and lesions in the trachea at four days post-challenge compared to unvaccinated birds [11]. Furthermore, expansion of CD8+ cells expressing granzyme A is associated with ILTV clearance from the conjunctiva [13]. A few studies have investigated the host gene expression in chicken embryo lung cells and chickens after infection with ILTV [14,15,16,17]; however, the tissue tropism and protective immunity against ILTV varies with the virus strain [18,19]. Moreover, there is a paucity of information on the Australian ILTV vaccine and field strains. It has been shown that different ILTV live vaccines provide various degrees of protection against challenges with ILTV virulent isolates, but the mechanisms of these differences remain unclear. In addition, it is known that different ILTV strains have different affinities toward the upper respiratory tract and the conjunctiva [20], and these differences may influence host immune responses within the trachea and conjunctiva (the target tissues of ILTV). Therefore, we predict that the field Class 9 strain will cause a more robust inflammatory response as determined by clinical signs of disease with greater infiltration of immune cells in the conjunctiva, Harderian gland and trachea than the chicken embryo origin vaccine SA2 strain. This pilot study evaluated the gene expression of immune markers and cell populations in the conjunctiva, Harderian gland and trachea of chickens inoculated with a chicken embryo origin vaccine (SA2) and a virulent ILTV field Class 9 strain to correlate these responses against clinical signs of disease and virus DNA load. The findings in this study elucidated the differences in the profile of the key immune components stimulated by the Australian vaccine and field strains.

2. Materials and Methods

2.1. Experimental Design, Clinical Sign Scoring and Sample Collection

This research was approved by the Animal Ethics Committee (AEC20-054) of the University of New England (UNE) and was performed in PC2 temperature-controlled isolators with HEPA-filtered air. The twenty 5-week-old ISA Brown layer pullets used in this study were part of another experiment (unpublished data). The birds had free access to age-appropriate commercial feed and water. To mimic the vaccination program in the field, at 5 weeks of age, the birds were inoculated with a dose of a 104.1 plaque-forming unit (pfu) of an ILTV chicken embryo origin commercial ILTV vaccine (Poulvac Laryngo SA2, Zoetis, Rhodes, Australia, 8 birds) or with a dose of a 103 median tissue culture infectious dose (TCID50) of a field Class 9 strain (8 birds) [21]. Additionally, 4 birds received a sham inoculation with a sterile cell culture medium and served as controls. Individual birds were evaluated at day post-inoculation (dpi) 5 and 10 for lesions on respiratory and ocular tissues and general demeanor clinical signs using a scoring system previously described [20,22] (Figure S1). To determine the viral loads on dpi 5 and 10, choanal cleft swabs were collected. The birds were euthanized by CO2 inhalation, and at necropsy, the conjunctiva, trachea and cloaca tissues were collected and processed. Half of each tissue sample was embedded in an optimal cutting temperature compound (OCT) (Sakura Finetek, Torrance, CA, USA), snap-frozen in liquid nitrogen and stored at −80 °C until used for histology. The remaining portion of each tissue was stored in in-house-prepared RNALater at 4 °C overnight and then at −20 °C until used for RNA purification. The spleens were collected in the OCT and used as the positive control for histological analyses. The experimental design is described in Figure 1.

2.2. ILTV DNA Extraction and Quantification

The ILTV DNA was extracted from 200 μL of choanal swab wash using the Bioline Isolate II Genomic DNA kit (Bioline, Redfern, Australia) as previously described [22]. Genome copies of ILTV were quantified using a qPCR targeting the glycoprotein C gene [23] and the data reported as log10 (genomic copies (GCs) +1) per reaction.

2.3. Total RNA Extraction and Quality Control

The total RNA was extracted from 25–30 mg of tissue using the Isolate II RNA Mini Kit (Bioline, Australia) following the manufacturer’s instructions with modifications to the tissue homogenization time and the addition of a 3 mm metal bead to each microtube. The Harderian gland, conjunctiva and trachea were homogenized for two, three and five minutes, respectively, using a Tissuelyser II (Qiagen, Hilden, Germany) at the frequency of 30 Hz. The RNA integrity and concentration were determined using a 2100 Bioanalyzer (Agilent Technologies, Waldbronn, Germany). The total RNA samples with an RNA integrity number (RIN) ≥ 7 and a concentration ≥40 ng/µL were used for the RT2 profiler PCR array analysis.

2.4. RT2 Profiler PCR Array

The RT2 profiler™ PCR array chicken innate and adaptive immune responses (Format E, GeneGlobe Id: PAGG-052ZE-4, Qiagen, Germantown, MD, USA), a gene expression analysis tool based on SYBR Green quantitative PCR assaying the expression of 84 genes related to chicken innate and adaptive immune responses and 5 housekeeping genes (Table S1), was used according to the manufacturer’s instructions. Unexpectedly, none of the samples gave a positive signal for the CD8a gene using the RT2 profiler array primers. Therefore, alternative primer pairs for the detection of the CD8a gene (Fw: AATGGTGTCTCCTGGATTCG; Rv: CAGCATCTGGTTGATGTTGG) [24] and ribosomal protein L4 (RPL4) housekeeping gene (Fw: TTATGCCATCTGTTCTGCC; Rv: GCGATTCCTCATCTTACCCT) [25] were tested in separate qRT-PCR assays. All the amplifications were performed in a BioRad CFX384.
The RT2 profiler data that passed the assay quality controls were analyzed using Qiagen’s GeneGlobe data analysis center web resource (https://www.qiagen.com/us/shop/genes-and-pathways/data-analysis-center-overview-page/, accessed on 16 October 2022) for fold change (FC) determination. For each tissue type, the gene expression data were normalized using Hexose-6-phosphate dehydrogenase (H6PD) and RPL4 housekeeping genes. The stability of the selected housekeeping genes evaluated by the above Qiagen’s online tool and Qbase+ (version 3.4) had an average M-value less than 0.474 and a coefficient of variation less than 0.165. Then, the 2−ΔΔCT method was used to calculate the relative FC in gene expression from the SA2 or Class 9 ILTV-inoculated groups versus the sham-inoculated group.

2.5. Fluorescence Microscopy

The fluorescence microscopy for quantification of CD4+, CD8a+, Kul01+ (monocytes/macrophages) and Bu1+ (B cell and subsets of monocytes and macrophages) cells were performed as described [26]. All the antibodies were purchased from Southern Biotech, Birmingham, USA. For each tissue, sections were incubated with mouse anti-chicken CD4-FITC (CT-4); mouse anti-chicken CD8a-FITC (CT-8); mouse anti-chicken monocyte/macrophage-FITC (KUL01); and mouse anti-chicken Bu1-AF647 (AV20), respectively. For detecting non-specific staining, a section stained with isotype control mouse IgG1-FITC (15H6) and mouse IgG1-AF647 (15H6) was used [27]. Antibodies conjugated with FITC were diluted in 40 µL of immune fluorescence (IF) buffer (PBS containing 1% BSA and 2% fetal bovine serum) at a dilution of 1:200 while antibodies conjugated with AF647 were diluted in IF buffer at dilution of 1:50. Spleen sections were used as a positive control for each staining batch (Figure S2).

2.6. Histological Tissue Image Analysis

The stained sections were scanned through multiple channels under fluorescence microscopy (Olympus, Tokyo, Japan) using the Stereo Investigator software (version 2022.2.3; MBF Bio-science, Williston, ND, USA) at a magnification of 20×. The total area of the region of interest (ROI) in each section was estimated using the Cavalieri estimator software function. The stained area of positive cells in the ROIs was estimated using the Qupath software (version 0.4.2) [28] and presented as the percentage of the stained area of positive cells measured in specific antibody-stained sections to the area of the ROI after subtracting the percentage of the non-specific stained area detected in the corresponding isotype control section. Measuring cell levels in entire tissue sections allows for large-scale histological evaluations with high precision across the whole section [29]. Across tissue types, the non-specific stained area in sections stained with the IgG1-AF647 isotype control had a median of 0.008% (0 to 0.648%), while those stained with the IgG1-FITC isotype control had a median of 0.005% (0 to 0.112%).

2.7. Statistical Analysis

The analyses were performed using JMP 17 (SAS Institute Inc., Cary, NC, USA) at the significance level of p < 0.05. The gene expression data of different routes of inoculation (oral and eye-drop) and different time points (dpi 5 and 10) were combined due to their small effect sizes tested by multivariate analysis of variance (MANOVA), while the effect of the inoculum (SA2 or Class 9) was retained for further analysis (Figure 1). The significance of the change in gene expression between the SA2 and Class 9 groups and the sham-inoculated group were evaluated by the unpaired Student t-test for each gene. The ILTV GC in choanal swabs were log transformed [log10 (GC + 1)] before analysis. All the data, including the gene expression, total clinical score, ILTV GC and stained area, were assessed for normality using the Shapiro–Wilk normality test.
The one-way analysis of variance and t-test were used to assess the differences in the ILTV GC in the choanal swabs and the gene FC in the conjunctiva and trachea between the inoculated groups. Moreover, the non-parametric Kruskal–Wallis one-way analysis of variance and Wilcoxon test were used to assess the differences in the total clinical score, in the gene FC in the Harderian gland and in the tissue stained area between the inoculated groups. The correlation of the choanal ILTV GC and total clinical score and gene expression level in each tissue type were investigated using Spearman’s rank correlation. The genes with an FC associated with SA2 and/or Class 9 inoculation compared with those in the sham-inoculated groups (p < 0.05) were selected to evaluate their correlations with the total clinical score and choanal ILTV GC.

3. Results

3.1. Virulent ILTV Inoculation Elicited Greater Innate and Adaptive Immune Gene Expression Response in the Trachea and Conjunctiva than ILTV Vaccination but Lower Cell Infiltration

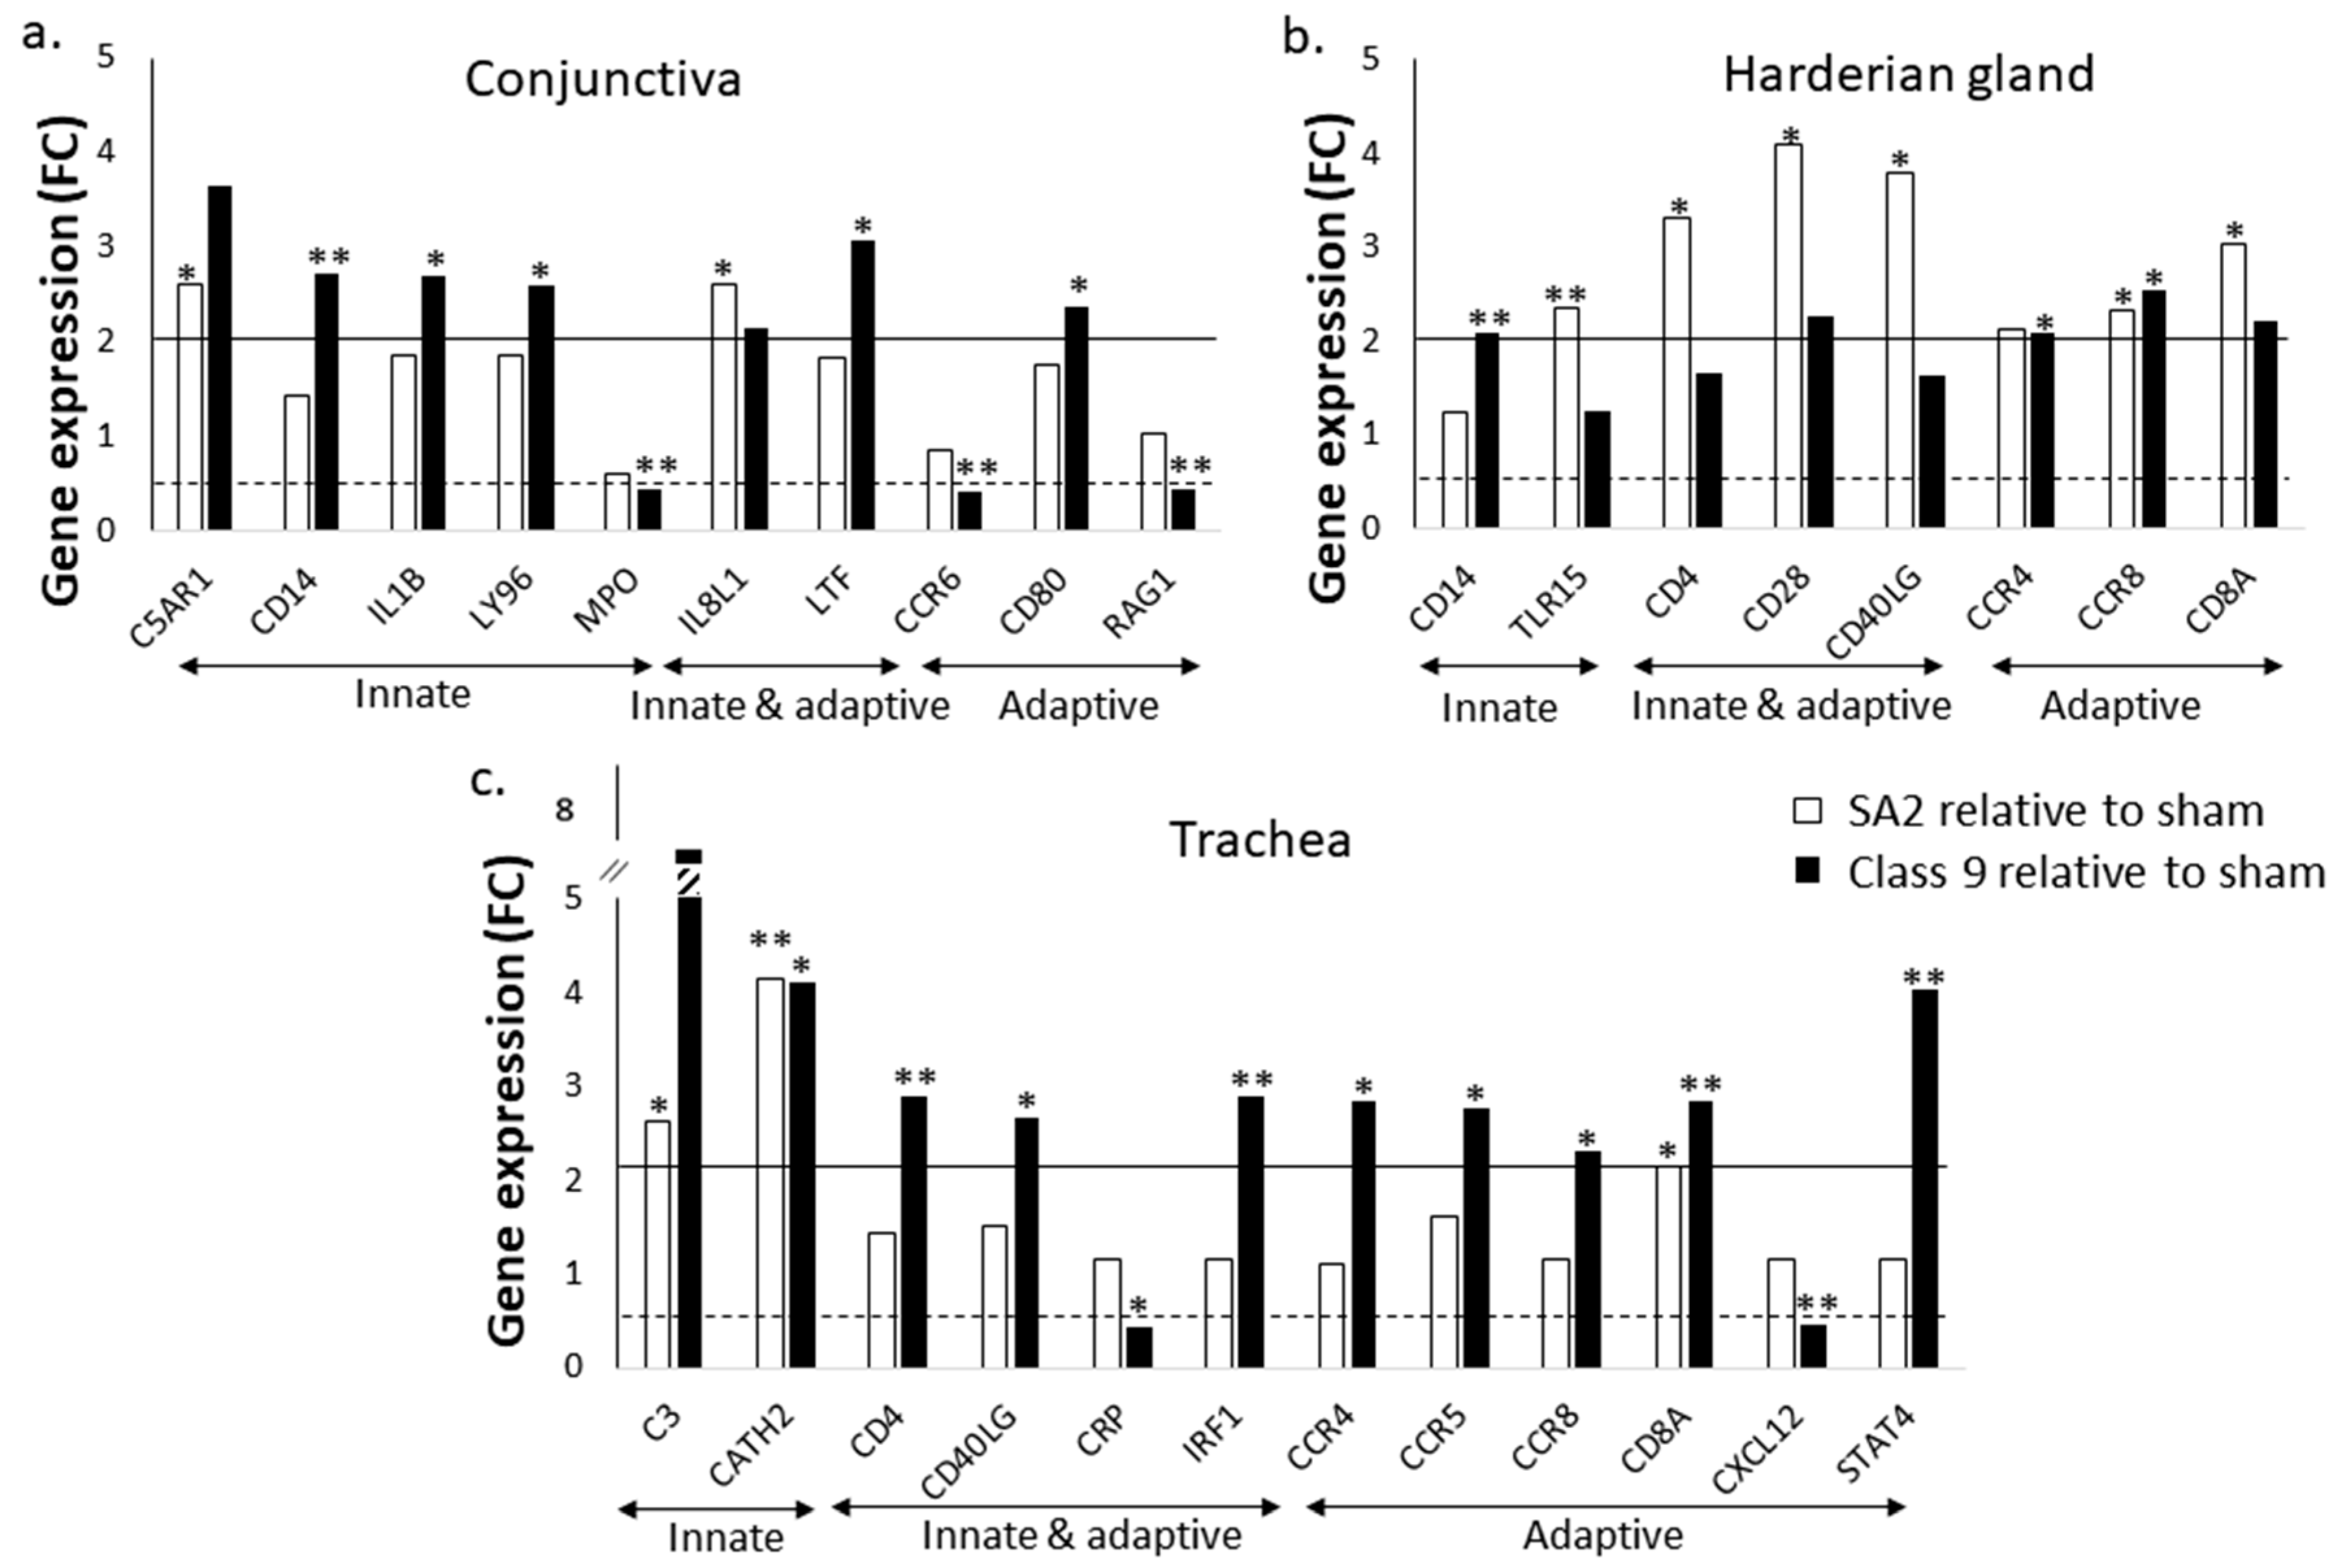
Figure 2 and Figure 3 show the differences in the levels of major leukocyte cell populations and the expression levels of the genes stimulated by virulent Class 9 and SA2 vaccine inoculation, respectively.
After SA2 inoculation, the stained area of the CD8a+, Kul01+ and Bu1+ cells in the trachea were significantly larger than those of the sham-inoculated birds (1.75 ± 0.50 vs. 0.16 ± 0.10, p = 0.01; 0.95 ± 0.50 vs. 0.02 ± 0.10, p = 0.02; and 0.34 ± 0.50 vs. 0.01 ± 0.10, p = 0.02), with concomitant upregulation of the genes CATH2 (FC = 4.15; p = 0.03), C3 (FC = 2.64; p = 0.05) and CD8A (FC = 2.16; p = 0.06) with no detected gene downregulation. After Class 9 inoculation, there was no significant increase in the stained area for the immune cells in the trachea, with the upregulation of nine genes, CD4, CD8A, IRF1, STAT4 (FC > 2; p < 0.05), CATH2, CCR4, CCR5, CCR8 and CD40LG (FC > 2; 0.05 ≤ p ≤ 0.10), and significant downregulation of two genes, CXCL12 (FC = 0.45; p = 0.02) and CRP (FC = 0.44; p = 0.09).
In the conjunctiva, there was no significant difference in the stained area between the groups. In the conjunctiva of the SA2-inoculated birds, there was an upregulation of the C5AR1 (FC = 2.60; p = 0.06) and IL8L1 (FC = 2.62; p = 0.09) genes, while for the Class 9-inoculated birds, there was upregulation of CD14 (FC = 2.73; p = 0.03), CD80, IL1B, TF and LY96 (FC > 2; 0.05 ≤ p ≤ 0.10) and downregulation of CCR6, MPO and RAG1 (FC < 0.5; p < 0.05).
In the Harderian gland, there was a larger stained area of Bu1+ cells in the SA2-inoculated birds than in the sham-inoculated birds (0.06 ± 0.21 vs. 0.02 ± 0.03; p = 0.03). The upregulation of the CD14 (FC = 2.09; p = 0.01), CCR4 (FC = 2.09; p = 0.10) and CCR8 (FC = 2.54; p = 0.08) genes was associated with Class 9 inoculation, while the upregulation of TLR15 (FC = 2.35; p = 0.02), CCR8, CD28, CD4, CD40LG and CD8A (FC > 2; 0.05 ≤ p ≤ 0.10) was associated with SA2 inoculation.

3.2. The Correlations of Total Clinical Score and Choanal ILTV GC with Gene Expression Level Varied with the Virus Strain

The correlations of the clinical score, ILTV GC in the choanal swab and gene expression levels in the different tissues collected at dpi 5 and 10 are shown in Table S2.
In the trachea of the Class 9-inoculated birds, the expression level of IRF1 was positively correlated with the ILTV GC in the choanal swabs (ρ = 0.79; p = 0.02), while for the SA2-inoculated birds, a positive correlation of CCR5 expression was detected (ρ = 0.81; p = 0.01). There was no correlation between the clinical score and gene expression in the trachea of the SA2- or Class 9-inoculated birds.
In the conjunctiva of the Class 9-inoculated birds, there were negative correlations between CCR6 expression and the clinical score (ρ = −0.84; p = 0.01) and RAG1 expression and the ILTV GC in the choanal swab (ρ = −0.79; p = 0.02). Similarly, there was a negative correlation between the RAG1 expression level and the ILTV GC in the choanal swab (ρ = −0.76; p = 0.02) in the conjunctiva of the SA2-inoculated birds. There was no correlation of the clinical score or ILTV GC in the choanal swab with gene expression in the Harderian gland of the inoculated birds.

4. Discussion

This study aimed to compare the immune responses in birds vaccinated against ILTV using the chicken embryo vaccine SA2 and a virulent field Class 9 in the respiratory and ocular organs. It has been suggested that the Harderian gland is an important site for virus uptake and potentially for mounting immune response against ILTV after ocular vaccination [13,19]. In this current study, there were no detectable increases in Bu1+ and CD4+ cells in the conjunctiva and Harderian glands of birds ocularly or orally challenged with ILTV SA2 or Class 9 strains. There was, however, a significant increase in CD8a+ and Kul01+ cells in the trachea of SA2-inoculated birds compared to sham-inoculated birds, while Class 9-inoculated birds presented an intermediary increase in these cell populations in the trachea. These results are unexpected, as the Class 9 strain caused clinical signs while SA2 did not (p < 0.05; Table S2) and, therefore, was expected to induce more tissue damage and, consequently, increased immune cell infiltration compared to the vaccine. However, tissue samples were not collected for histology in this study, and thus, it was not possible to directly correlate the tissue damage with leukocyte infiltration.
The higher infiltration of immune cells in the trachea of vaccinated birds in the current study is in a disagreement with a previous study, which reported that a chicken embryo origin vaccine (Laryngo-Vac, Zoetis, Parsippany, NJ, USA) caused no difference in the infiltration level of CD4+ and CD8a+ cells compared to the control at dpi 4, but the field strain 1874C5 caused a significant increase in CD4+ cells compared to the control from dpi 3 to 7. Another study from the same group reported no significant differences in the percentages of CD4+ and CD8+ cells in the conjunctiva and Harderian gland between birds inoculated with the chicken embryo origin vaccine (Trachivax®, Rahway, Merck Animal Health) and the ILTV field strain 63140, except at dpi 7, in which there was a higher percentage of CD4+ cells in the conjunctiva and Harderian gland in the field ILTV-inoculated birds [13]. The differences in virus strain, inoculation dose and time points of detection used may explain the differences in findings between the US and Australian studies because these factors would affect the level of infection and, consequently, the level of immune responses.
Although Class 9 stimulated less infiltration of CD4+, CD8a+ and Kul01+ cells in the trachea and conjunctiva than the SA2 vaccine, the latter group had a higher gene expression level of CD14 (macrophage marker) in the conjunctiva and CD4 and CD8A in the trachea. The immune gene expression response to Class 9 and SA2 ILTV strains was mostly related to inflammatory and tissue-repairing pathways (Figure 3). The discrepancy between the gene expression levels and the cell counts were not completely unexpected as the transcript level is neither a predictor nor a clear indicator of the protein level in its functional form. This is because the correlation between the protein level and corresponding transcript level is influenced by mRNAs’ spatial and temporal variations and the local availability of protein biosynthesis resources [30].
In addition to the differences in the cell infiltration level and the magnitude of gene expression, more genes were regulated in the trachea and conjunctiva compared to those in the Harderian gland (Figure 3) after Class 9 or SA2 inoculation, suggesting that the trachea and conjunctiva, in which ILTV produces lytic infection, have a higher immune response than the Harderian gland that does not support lytic infection of the virus, as it has been previously reported [13].
The limitations of this pilot study include using a low number of birds per treatment, which reduced the statistical power of the study and limited the ability to detect small effects of inoculation routes and time points observed on the gene expression level and leukocyte populations. This also precluded the evaluation of the effect of time post-infection (dpi 5 and 10) and the route of inoculation (oral and ocular). Further studies evaluating the association of the expression level of genes associated with SA2 and Class 9 strains with the clinical score and choanal ILTV GC over time are required.

5. Conclusions

In conclusion, this pilot study provides insight into the gene expression levels of immune markers and cell populations in chickens after inoculation with an ILTV CEO vaccine (SA2) and a field strain (Class 9). Compared to SA2, Class 9 led to a more robust regulation of the immune markers; however, there was a larger infiltration of Kul01+, Bu1+ and CD8a+ cells for the SA2. Further studies are needed to confirm these findings. The gene expression responses elicited by SA2 and Class 9 inoculation were mostly related to inflammatory and tissue-repairing responses and were found mainly in the trachea and conjunctiva.

Supplementary Materials

The following supporting information can be downloaded at: https://www.mdpi.com/article/10.3390/poultry3040030/s1, Figure S1: ILTV genomic copies (GC) [log10 (GC + 1)/reaction] in choanal swabs (A) and clinical score (B) observed in birds inoculated with Class 9 or SA2 at dpi 5 and 10; Figure S2: Representative photomicrographs of CD4+, CD8a+, Kul01+ and Bu1+ cells in spleen (positive control) acquired at a magnification of 20× under fluorescence microscopy; Figure S3: Representative photomicrographs of CD4+, CD8a+, Kul01+ and Bu1+ cells in tissues of birds inoculated with Class 9 ILTV acquired at a magnification of 20× under fluorescence microscopy; Table S1: Gene panel designed in RT2 profiler™ PCR array chicken innate and adaptive immune responses (Format E, GeneGlobe Id: PAGG-052ZE-4, Cat. 330231, Qiagen, Germantown, USA) and gene function classification obtained from Qiagen’s website; Table S2: The correlations of the total clinical score (LSM ± SE) and ILTV copies (LSM log10 [GC + 1] ± SE) in the choanal cleft swab with the gene expression level (LSM fold change ± SE) of the statistically significant upregulation and downregulation genes associated with SA2 and/or Class 9 inoculation detected in the conjunctiva, Harderian gland and trachea collected at dpi 5 and 10.

Author Contributions

Conceptualization, P.F.G.; methodology, P.F.G., N.A. and T.T.T.; software, T.T.T. and N.A.; validation, T.T.T., P.F.G. and N.A.; formal analysis, T.T.T. and P.F.G.; investigation, P.F.G. and T.T.T.; data curation, T.T.T.; writing—original draft preparation, T.T.T.; writing—review and editing, P.F.G., N.A. and T.T.T.; visualization, T.T.T.; supervision, P.F.G. and N.A.; project administration, P.F.G.; funding acquisition, P.F.G. All authors have read and agreed to the published version of the manuscript.

Funding

This research was funded by the Australian Research Council’s Discovery Early Career Award funding scheme, project number DE200101832 (PFG). T.T.T received the Research Training Program (RTP) scholarship funded by the Australian Commonwealth Government and the support through Destination Australia, an Australian Government initiative.

Institutional Review Board Statement

This study was approved by the Animal Ethics Committee of the University of New England (approval number AEC20-054 on 6 August 2020).

Informed Consent Statement

Not applicable.

Data Availability Statement

The data are included in the manuscript and Supplementary Files.

Acknowledgments

We thank Danielle Smith and Stephen Walkden-Brown for the assistance with the animal trial and Danielle Smith for the assistance with the ILTV PCRs.

Conflicts of Interest

The authors declare no conflicts of interest.

References

  1. García, M.; Spatz, S. Infectious Laryngotracheitis. In Diseases of Poultry, 14th ed.; Swayne, D.E., Boulianne, M., Eds.; John Wiley & Sons, Inc.: Hoboken, NJ, USA, 2020; Volume 1, pp. 189–209. [Google Scholar] [CrossRef]
  2. Garcia, M. Current and future vaccines and vaccination strategies against infectious laryngotracheitis (ILT) respiratory disease of poultry. Vet. Microbiol. 2017, 206, 157–162. [Google Scholar] [CrossRef] [PubMed]
  3. Kirkpatrick, N.C.; Mahmoudian, A.; O’Rourke, D.; Noormohammadi, A.H. Differentiation of infectious laryngotracheitis virus isolates by restriction fragment length polymorphic analysis of polymerase chain reaction products amplified from multiple genes. Avian Dis. 2006, 50, 28–34. [Google Scholar] [CrossRef] [PubMed]
  4. Neff, C.; Sudler, C.; Hoop, R.K. Characterization of Western European field isolates and vaccine strains of avian infectious laryngotracheitis virus by restriction fragment length polymorphism and sequence analysis. Avian Dis. 2008, 52, 278–283. [Google Scholar] [CrossRef]
  5. Ojkic, D.; Swinton, J.; Vallieres, M.; Martin, E.; Shapiro, J.; Sanei, B.; Binnington, B. Characterization of field isolates of infectious laryngotracheitis virus from Ontario. Avian Dis. 2006, 35, 286–292. [Google Scholar] [CrossRef]
  6. Chen, H.Y.; Cui, P.; Cui, B.A.; Li, H.P.; Jiao, X.Q.; Zheng, L.L.; Cheng, G.; Chao, A.J. Immune responses of chickens inoculated with a recombinant fowlpox vaccine coexpressing glycoprotein B of infectious laryngotracheitis virus and chicken IL-18. FEMS Immunol. Med. Microbiol. 2011, 63, 289–295. [Google Scholar] [CrossRef]
  7. Fahey, K.J.; York, J.J.; Bagust, T.J. Laryngotracheitis herpesvirus infection in the chicken. II. The adoptive transfer of resistance with immune spleen cells. Avian Pathol. 1984, 13, 265–275. [Google Scholar] [CrossRef]
  8. Honda, T.; Okamura, H.; Taneno, A.; Yamada, S.; Takahashi, E. The role of cell-mediated immunity in chickens inoculated with the cell-associated vaccine of attenuated infectious laryngotracheitis virus. J. Vet. Med. Sci. 1994, 56, 1051–1055. [Google Scholar] [CrossRef] [PubMed]
  9. Fahey, K.J.; Bagust, T.J.; York, J.J. Laryngotracheitis herpesvirus infection in the chicken: The role of humoral antibody in immunity to a graded challenge infection. Avian Pathol. 1983, 12, 505–514. [Google Scholar] [CrossRef]
  10. Honda, T.; Taneno, A.; Sakai, E.; Yamada, S.; Takahashi, E. Immune response and in vivo distribution of the virus in chickens inoculated with the cell-associated vaccine of attenuated infectious laryngotracheitis (ILT) virus. J. Vet. Med. Sci. 1994, 56, 691–695. [Google Scholar] [CrossRef]
  11. Maekawa, D.; Riblet, S.M.; Whang, P.; Hurley, D.J.; Garcia, M. Activation of cytotoxic lymphocytes and presence of regulatory T cells in the trachea of non-vaccinated and vaccinated chickens as a recall to an infectious laryngotracheitis virus (ILTV) challenge. Vaccines 2021, 9, 865. [Google Scholar] [CrossRef]
  12. Maekawa, D.; Whang, P.; Riblet, S.M.; Hurley, D.J.; Guy, J.S.; García, M. Assessing the infiltration of immune cells in the upper trachea mucosa after infectious laryngotracheitis virus (ILTV) vaccination and challenge. Avian Pathol. 2021, 50, 540–556. [Google Scholar] [CrossRef] [PubMed]
  13. Beltrán, G.; Hurley, D.J.; Gogal, R.M., Jr.; Sharif, S.; Read, L.R.; Williams, S.M.; Jerry, C.F.; Maekawa, D.A.; García, M. Immune responses in the eye-associated lymphoid tissues of chickens after ocular inoculation with vaccine and virulent strains of the respiratory infectious laryngotracheitis virus (ILTV). Viruses 2019, 11, 635. [Google Scholar] [CrossRef]
  14. Lee, J.Y.; Song, J.J.; Wooming, A.; Li, X.; Zhou, H.; Bottje, W.G.; Kong, B. Transcriptional profiling of host gene expression in chicken embryo lung cells infected with laryngotracheitis virus. BMC Genom. 2010, 11, 445. [Google Scholar] [CrossRef] [PubMed]
  15. Coppo, M.J.C.; Devlin, J.M.; Legione, A.R.; Vaz, P.K.; Lee, S.W.; Quinteros, J.A.; Gilkerson, J.R.; Ficorilli, N.; Reading, P.C.; Noormohammadi, A.H.; et al. Infectious laryngotracheitis virus viral chemokine-binding protein glycoprotein G alters transcription of key inflammatory mediators in vitro and in vivo. J. Virol. 2017, e01534-17. [Google Scholar] [CrossRef]
  16. Vagnozzi, A.; Riblet, S.; Zavala, G.; Ecco, R.; Afonso, C.L.; García, M. Evaluation of the transcriptional status of host cytokines and viral genes in the trachea of vaccinated and non-vaccinated chickens after challenge with the infectious laryngotracheitis virus. Avian Pathol. 2016, 45, 106–113. [Google Scholar] [CrossRef] [PubMed]
  17. Vagnozzi, A.E.; Beltran, G.; Zavala, G.; Read, L.; Sharif, S.; Garcia, M. Cytokine gene transcription in the trachea, Harderian gland, and trigeminal ganglia of chickens inoculated with virulent infectious laryngotracheitis virus (ILTV) strain. Avian Pathol. 2018, 47, 497–508. [Google Scholar] [CrossRef]
  18. Thilakarathne, D.S.; Noormohammadi, A.H.; Browning, G.F.; Quinteros, J.A.; Underwood, G.J.; Hartley, C.A.; Coppo, M.J.; Devlin, J.M.; Diaz-Méndez, A. Pathogenesis and tissue tropism of natural field recombinants of infectious laryngotracheitis virus. Vet. Microbiol. 2020, 243, 108635. [Google Scholar] [CrossRef] [PubMed]
  19. Beltran, G.; Williams, S.M.; Zavala, G.; Guy, J.S.; García, M. The route of inoculation dictates the replication patterns of the infectious laryngotracheitis virus (ILTV) pathogenic strain and chicken embryo origin (CEO) vaccine. Avian Pathol. 2017, 46, 585–593. [Google Scholar] [CrossRef]
  20. Kirkpatrick, N.C.; Mahmoudian, A.; Colson, C.A.; Devlin, J.M.; Noormohammadi, A.H. Relationship between mortality, clinical signs and tracheal pathology in infectious laryngotracheitis. Avian Pathol. 2006, 35, 449–453. [Google Scholar] [CrossRef]
  21. Nazir, S.; Yegoraw, A.A.; Charlesworth, R.P.G.; Williamson, S.; Sharpe, S.; Walkden-Brown, S.W.; Gerber, P.F. Marked differences in virulence of three Australian field isolates of infectious laryngotracheitis virus in meat and layer chickens. Avian Pathol. 2020, 49, 600–661. [Google Scholar] [CrossRef]
  22. Yegoraw, A.A.; Assen, A.M.; Gerber, P.F.; Walkden-Brown, S.W. Transmission of infectious laryngotracheitis virus vaccine and field strains: The role of degree of contact and transmission by whole blood, plasma and poultry dust. Vet. Res. 2021, 52, 91. [Google Scholar] [CrossRef] [PubMed]
  23. Callison, S.A.; Riblet, S.M.; Oldoni, I.; Sun, S.; Zavala, G.; Williams, S.; Resurreccion, R.S.; Spackman, E.; García, M. Development and validation of a real-time Taqman PCR assay for the detection and quantitation of infectious laryngotracheitis virus in poultry. J. Virol. Methods 2007, 139, 31–38. [Google Scholar] [CrossRef] [PubMed]
  24. Kim, D.K.; Lillehoj, H.; Min, W.; Kim, C.H.; Park, M.S.; Hong, Y.H.; Lillehoj, E.P. Comparative microarray analysis of intestinal lymphocytes following Eimeria acervulina, E. maxima, or E. tenella infection in the chicken. PLoS ONE 2011, 6, e27712. [Google Scholar] [CrossRef]
  25. Yang, F.; Lei, X.; Rodriguez-Palacios, A.; Tang, C.; Yue, H. Selection of reference genes for quantitative real-time PCR analysis in chicken embryo fibroblasts infected with avian leukosis virus subgroup J. BMC Res. Notes. 2013, 6, 402. [Google Scholar] [CrossRef]
  26. Nazir, S.; Charlesworth, R.P.G.; Moens, P.; Gerber, P.F. Evaluation of autofluorescence quenching techniques on formalin- fixed chicken tissues. J. Immunol. Methods 2021, 496, 113097. [Google Scholar] [CrossRef] [PubMed]
  27. Hewitt, S.M.; Baskin, D.G.; Frevert, C.W.; Stahl, W.L.; Rosa-Molinar, E. Controls for immunohistochemistry: The Histochemical Society’s standards of practice for validation of immunohistochemical assays. J. Histochem. Cytochem. 2014, 62, 693–697. [Google Scholar] [CrossRef]
  28. Bankhead, P.; Loughrey, M.B.; Fernández, J.A.; Dombrowski, Y.; McArt, D.G.; Dunne, P.D.; McQuaid, S.; Gray, R.T.; Murray, L.J.; Coleman, H.G.; et al. QuPath: Open source software for digital pathology image analysis. Sci. Rep. 2017, 7, 16878. [Google Scholar] [CrossRef]
  29. Halama, N.; Zoernig, I.; Spille, A.; Westphal, K.; Schirmacher, P.; Jaeger, D.; Grabe, N. Estimation of immune cell densities in immune cell conglomerates: An approach for high-throughput quantification. PLoS ONE 2009, 4, e7847. [Google Scholar] [CrossRef]
  30. Liu, Y.; Beyer, A.; Aebersold, R. On the dependency of cellular protein levels on mRNA abundance. Cell 2016, 165, 535–550. [Google Scholar] [CrossRef]
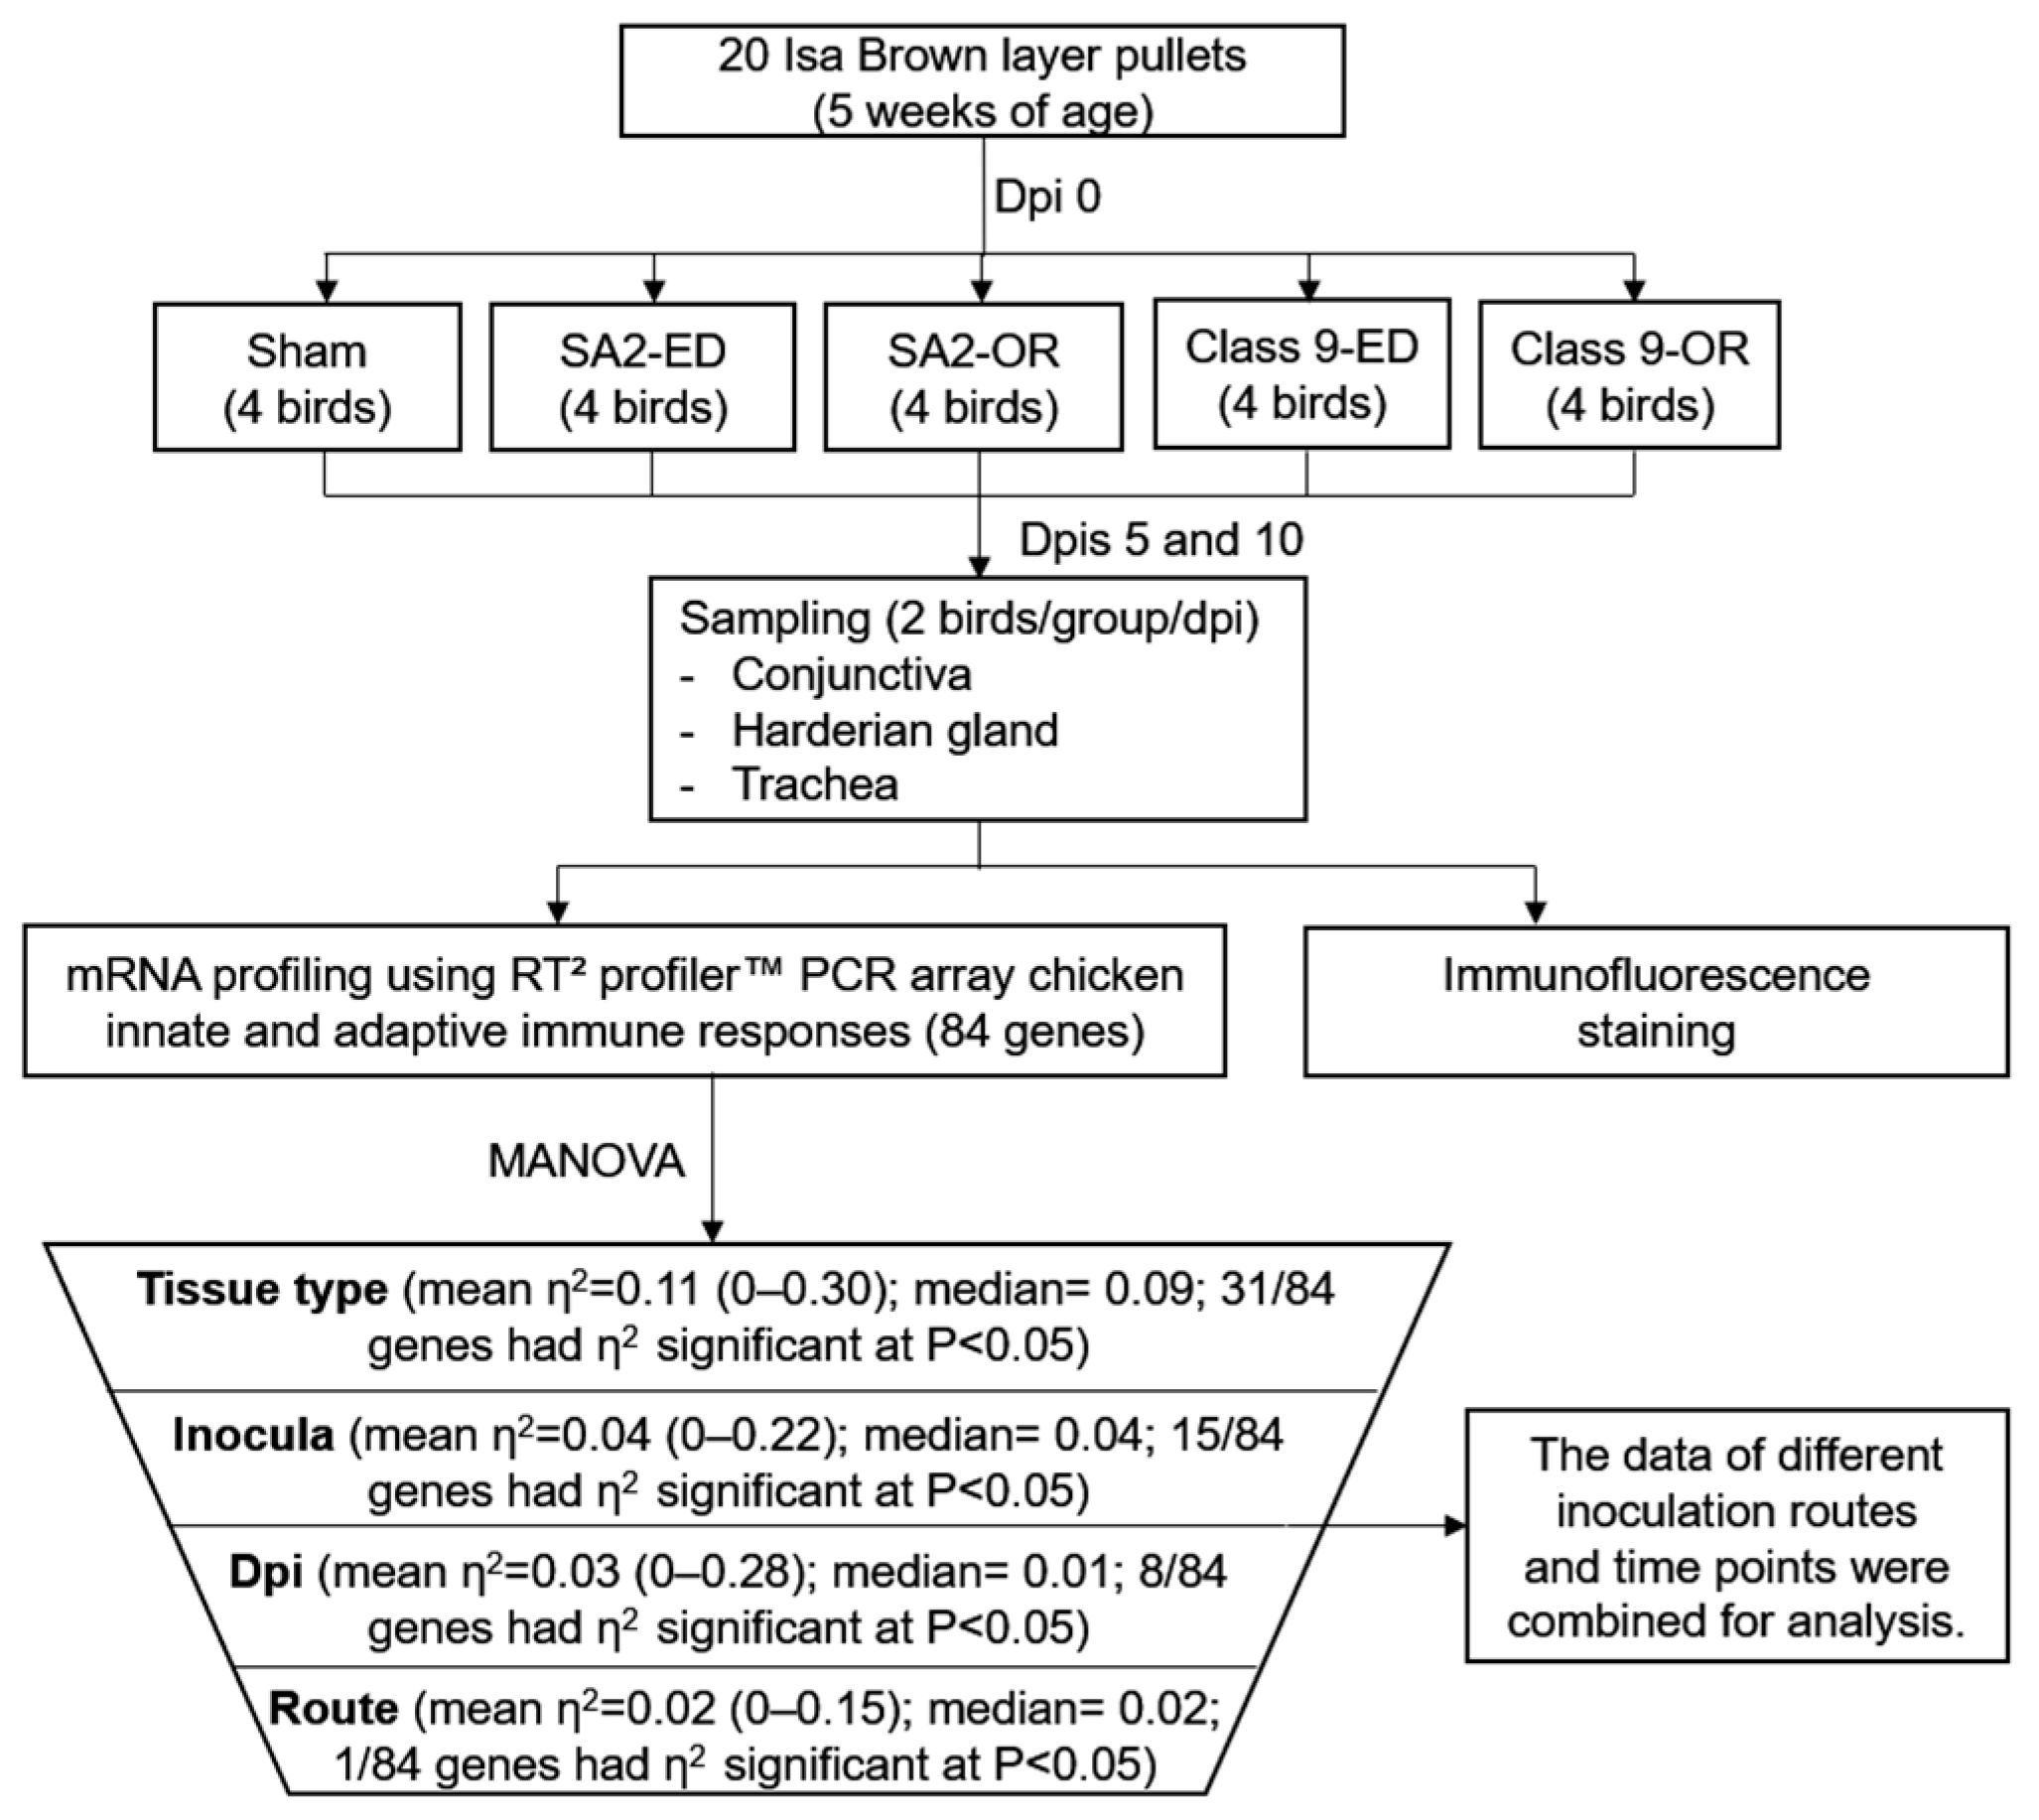
Figure 1. Flow chart describes the experimental designs and the combination of data. Birds were inoculated with ILTV vaccine strain (SA2, 104.1 pfu) or ILTV field strain (Class 9, 103 TCID50) by eye-drop (ED, 30 µL delivered in each eye) or oral inoculation (OR, 200 µL). Birds were euthanized for sample collection at 5 and 10 days post-inoculation (dpi).
Poultry 03 00030 g001
Figure 2. The CD4+, CD8a+, Bu1+ and Kul01+ cell quantification in the conjunctiva, Harderian gland and trachea of the birds collected at dpi 5 and 10 after inoculation with SA2 vaccine, Class 9 virulent ILTV or sterile cell culture medium (sham). (a): Photomicrographs of the region of interest (ROI, area inside the white contour) in each tissue type were used to estimate the total and stained areas. (b): The stained area (%) of the CD8a+, CD4+, Bu1+ and Kul01+ cells in the tissues of the individual birds inoculated with SA2 (blue triangle), Class 9 ILTV (orange circle) or sham (green rhombus). The bold lines indicate the mean of the stained area (%) of the cells stimulated by SA2 (blue), Class 9 (orange) or sham inoculation (green). The levels not connected by the same letter are significantly different (p < 0.05). (c): Representative photomicrographs of the CD4+, CD8a+, Kul01+ and Bu1+ cells in the tissues inoculated with SA2 ILTV acquired at a magnification of 20× under fluorescence microscopy. The white scale bar indicates 20 µm in length. The cell subsets were identified by direct immunofluorescence staining using mouse anti-chicken monoclonal antibodies conjugated with FITC (CD8a, CD4 and Kul01) or Alexa Fluor 647 (Bu1). The representative photomicrographs of the cells in the tissues inoculated with Class 9 ILTV are presented in Figure S3.
Poultry 03 00030 g002
Figure 3. Differentially expressed genes after ILTV inoculation of chickens in conjunctiva (a), Harderian gland (b) and trachea (c). Gene expression level is presented as fold change (FC) of ILTV-inoculated birds (SA2, Class 9) relative to the sham group. FC values greater than 2 (full line) indicate upregulation, while FC values less than 0.5 (dashed line) indicate downregulation. * signifies a trend towards statistical difference (0.05 ≤ p ≤ 0.10) between groups. ** signifies statistical difference (p < 0.05) between groups. p values were calculated using Student’s t-test of the replicate 2−ΔCt values for each gene in the sham-inoculated and ILTV-inoculated groups.
Poultry 03 00030 g003
Disclaimer/Publisher’s Note: The statements, opinions and data contained in all publications are solely those of the individual author(s) and contributor(s) and not of MDPI and/or the editor(s). MDPI and/or the editor(s) disclaim responsibility for any injury to people or property resulting from any ideas, methods, instructions or products referred to in the content.