Article

Three-Dimensional Assessment of the Pharyngeal Airway in Growing versus Non-Growing Subjects with/without Cleft Lip and Palate

by
Ahmed Z. Abdelkarim
1,*,
Ayman R. Khalifa
2,
Mohamed G. Hassan
3,4,
Ahmed Abdou
5,
Suayip Burak Duman
6,
Nader N. Rezallah
7,
Abdelrahman Elsaid Abdraboh
8 and
Ahmed Ghoneima
9
1
Division of Oral and Maxillofacial Radiology, College of Dentistry, The Ohio State University, Columbus, OH 43210, USA
2
Department of Community Dentistry, College of Dentistry, Gulf Medical University, Ajman 4181, United Arab Emirates
3
Department of Orthodontics, Faculty of Dentistry, Assiut University, Assiut 71515, Egypt
4
Division of Bone and Mineral Diseases, Department of Medicine, School of Medicine, Washington University in St. Louis, St. Louis, MO 98195, USA
5
Department of Prosthetic Dentistry, Biomaterials Division, Faculty of Dentistry, King Salman International University, El Tur 16949, Egypt
6
Department of Oral and Maxillofacial Radiology, Faculty of Dentistry, Inonu University, 44280 Malatya, Turkey
7
Division of Oral and Maxillofacial Radiology, College of Dentistry, City University Ajman, Ajman P.O. Box 18484, United Arab Emirates
8
Department of Removable Prosthodontics, Faculty of Dentistry, Beni Suef University, Beni Suef 62521, Egypt
9
Department of Orthodontics, College of Dental Medicine, MBRU, Dubai 505055, United Arab Emirates
*
Author to whom correspondence should be addressed.
Anatomia 2023, 2(3), 192-205; https://doi.org/10.3390/anatomia2030018
Submission received: 20 May 2023 / Revised: 18 June 2023 / Accepted: 3 July 2023 / Published: 5 July 2023

Abstract

:
Clefts of the lip or palate (CLPs) are the most common craniofacial birth defect, with a worldwide incidence of ~1 in 700 live births. The objective of this study is to assess the characteristics of the nasopharyngeal airway in growing vs. non-growing cleft lip/palate subjects and compare them with normal subjects. This retrospective study analyzed eighty-seven scans of three groups from cone beam computed tomography (CBCT). The cone beam computed tomography (CBCT) scans were coded and landmarks were identified using a Dolphin three-dimensional (3D) imaging software server (version 11.7; Patterson Dental Supply, Chatsworth, Calif). All values showed strong measurement reliability (>80), except for the nasopharynx measurement. Regarding gender difference, for the nasopharynx, female subjects (1261.32 ± 713.94) showed the lowest significant values in non-growing unilateral compared to males (6496.8 ± 2987) at p = 0.008. For oropharynx, in the growing bilateral cleft group, male subjects (13,046.79 ± 5521.89) showed a significant difference (p = 0.046) compared to females (8468.98 ± 4279.99). MP-SN, B, A, SNA., SN.B., and ANS-ME showed significant differences for cephalometric parameters (p < 0.05). Despite significant differences in linear and angular measurements, volumetric airway measurements showed no significant differences in the growing groups. For non-growing cleft subjects, the cleft anomaly significantly affected the nasal cavity and left maxillary sinus volumes.

1. Introduction

Clefts of the lip or palate (CLPs) occur in approximately 1 in 700 live births, varying across geographic origin, race, ethnicity, environmental exposures, and socioeconomic status. Prevalence rates are highest among Asian and Native American populations (1 in 500), intermediate among European-derived populations (1 in 1000), and lowest among African-derived populations (1 in 2500) [1]. Orofacial clefts represent a complex interplay between genetic predisposition and environmental risk factors [2]. Patency between the oral and nasal regions causes the most significant morbidity in patients, compromising feeding and breathing.
Pharyngeal size plays a vital role in speech and respiratory function, despite smaller airway dimensions in patients with nocturnal snoring, their pharyngeal measurements did not show significant differences. The intensity of bruxism does not significantly affect sleep quality [3,4]. Many CLP patients retain speech problems after the surgical correction of cleft defects (e.g., palatoplasty) [5]. Previous studies have demonstrated significant differences in craniofacial structures in CLP patients compared with normal subjects [6]; CLP patients have diminished upper airway volume compared with normal controls [1]. Therefore, children with CLP are at high risk for sleep disorders [7]. Sleep-disordered breathing is a spectrum of conditions that frequently impact the person’s ability to get enough sleep. In children, CLP increases the risk of sleep-disordered breathing due to the dysfunction of the muscles that control the soft palate in conjunction with structural abnormalities of the maxilla and the mandible [8].
Furthermore, CLP patients are at increased risk for hypertension, cardiovascular and cerebrovascular diseases, and excessive daytime sleepiness [7,9]. The associated craniofacial features in CLP patients include midface deficiency, retrognathic mandible, and increased vertical dimensions. Patients with CLP were found to have a reduced pharyngeal airway volume [8]. Several reports have indicated that the condition and size of the upper airway are closely related to different types of malocclusion. Therefore, morphometric evaluation of the pharyngeal airway in patients with CLP is essential [10].
Previous studies evaluated the pharyngeal airway by identifying landmarks on two-dimensional lateral cephalograms; some have measured the lengths and areas of the pharyngeal region [8,11,12]. 2D cephalometric analysis is most commonly used by orthodontists to measure the size and relative proportions of the pharyngeal airway, but 2D measurements are inaccurate and prone to errors, especially in the 2D interpretation of 3-dimensional (3D) structures [13]. Furthermore, previous studies showed that 2D lateral cephalograms could not diagnose airway constriction from only the sagittal plane [14]. Cross-sectional and coronal planes might be essential to illustrate the possibility of airway constriction, and they require 3D imaging techniques rather than conventional 2D images, although 2D diagnostics are still the most accessible to all doctors [14].
Technological advances in imaging have led to accurate, 3D, and high-resolution digital records of hard and soft tissues. These imaging technologies include spiral or helical computed tomography (CT) and dental cone-beam computed tomography (CBCT). They act as diagnostic and research instruments in orthodontics and craniofacial surgeries [15]. Published studies about CBCT accuracy showed that CBCT magnification is negligible with isotropic resolution and a 1:1 ratio in all three planes [16,17]. There is increasing agreement on the reliability of a CBCT 3D assessment of the pharyngeal airway volume [16,18,19,20,21]. Using CBCT technologies, investigators studying airway patency, function, and disorders provided promising preliminary data, including dimensions of airway anatomy in normal adults [14], differences in airway morphology in subjects with sleep-disordered breathing, and the effects of orthognathic surgery on airway dimensions [15].
Three-dimensional CBCT images accurately represent the airway [8]. In addition, the option provided by some software for detecting and measuring the most constricted area in the airway provides reliable and essential diagnostic clinical information in CLP patients [17]. To date, several available imaging software are used daily in clinical and research practices to analyze CBCT DICOM files.
Several open sources or commercial three-dimensional CBCT software programs [18] provide advanced features, such as airway segmentation with 3D rendered images, model construction, smoothing filters, exporting models, airway volume measurements, and the ability to find the most constricted area of the airway [22].
Using CBCT, several studies have demonstrated the differences in the nasopharyngeal airway volume with CLP growing subjects compared to normal subjects [14,15,23,24,25]. However, the non-growing CLP patients were excluded from those studies for ethical reasons. Cheung and Oberoi investigated the pharyngeal airway in preadolescent individuals with uni- and bilateral cleft lip and palate [26]. Celikoglu et al. found statistical significance between adolescent patients with bilateral CLP in the oropharyngeal and total airway volumes [27]. Al-Fahdawi et al. utilized CBCT for CLP patients aged 9 to 12 years old [24].
Therefore, the primary purpose of this study is to establish the characteristics of the pharyngeal airway in growing vs. non-growing CLP subjects and to compare them with well-matching control groups of normal subjects using CBCT, in addition to investigating the gender differences between groups.

2. Materials and Methods

2.1. Subjects

The Department of Community Dentistry, the College of Dentistry, and the Gulf Medical University recruited the subjects and developed this retrospective study. All patients and their caregivers signed an informed consent form allowing the use of their data for scientific purposes. We obtained the ethical committee approval to use de-identified CBCT scans from patients both with and without CLP. We included the patients who had undergone preoperative CBCT imaging at the department of oral radiology. The experimental group included 57 CLP patients (23 males and 34 females), while the control group included 30 non-CLP subjects. The exclusion criteria included a history of orthognathic surgical repair, airway abnormalities, or pathosis such as laryngomalacia, severe asthma, chronic obstructive pulmonary disease (COPD), or known or suspected craniofacial syndromes associated with airway abnormalities that may have confounded the assessment of cleft lip and palate (Pierre–Robin sequence). The control group consisted of subjects without any syndrome or craniofacial anomalies. None of the individuals with CLP had preoperative orthodontic intervention.
A trained radiologist investigated the CBCT data of the CLP sample. The sample was classified into four groups according to the cleft type (unilateral or bilateral cleft) and subject age (growing or non-growing). For the growing cleft group, 36 subjects (with an age range between 6–17 years) were subdivided into unilateral growing (UGCLP) and bilateral growing (BGCLP) groups (15 and 21 subjects, respectively). The age range for the non-growing cleft (NGCLP) subjects was between 18–50 years for 21 subjects (14 unilateral and 7 bilateral subjects). The non-CLP sample had age ranges of 15 growing (age range between 6–17 years) and 15 non-growing (age range between 18–27 years).

2.2. Volumetric Analysis

An ILUMA Ultra CT Scanner system, KODAK 9000 3D System, and IMTEC (Imaging Corporation, Ardmore, OK, USA) were used to obtain CBCT images. Each scan (0.023 mm voxel size) took 40 s and had a 16 bit Grayscale (31,744–45,811 shades of gray). It provided 1:1 scale images and a CT slice thickness of 0.28 mm.
Using a Dolphin 3D imaging software server, CBCT images were uploaded (version 11.7; Patterson Dental Supply, Chatsworth, Calif) then measured and viewed on the same computer and monitor. The software coded all CBCT images and information based on age and sex. All images were oriented in the sagittal, axial, and coronal planes, before taking measurements by adjusting the midsagittal plane, and were passed through the face’s skeletal midline (Nasion–Subnasale). The sagittal plane was adjusted with the Frankfort horizontal plane (Porion–Orbitale), and the coronal plane was modified to pass through the level of the furcation point of the maxillary right first molar. Measurements taken using the Dolphin 3D imaging software server, by trained and calibrated examiners, were used to record and anonymize the subjects’ information. These methods ensured accurate and consistent measurements of the craniofacial structures and maintained the confidentiality of the subjects’ data.
This study investigated the airway in CLP patients and compared it with normal subjects. The tables and figures (Table 1 and Table 2 and Figure 1) list a group of volumetric and cephalometric parameters. All CBCT scans were coded and measured by two well-trained operators, one orthodontist (AZA), and a radiologist (ARK). The CBCT images identified landmarks and the Dolphin 3D imaging software calculated the airway volumes.

2.3. Statistical Analysis

A sample size calculation was performed based on data from a pilot study with 5 patients in the control growing and growing unilateral groups, the mean difference in the nasal cavity = 10,856 and the SD (4019 and 5517) will result in effect size (d = 2.19); therefore, a minimum sample size of 7 patients was sufficient to detect a power of 80%. A random sample of 10 de-identified cases was selected, and two observers (A.Z. and A.K.) performed the analysis to assess the intra- and inter-rater reliability of the measurements. It was repeated 5 times, with a week as a washout period. The intraclass correlation coefficient (ICC) based on volumetric measurement tested the reliability of the observations. The goal was to achieve an ICC greater than or equal to 0.80 through process repetition.
Regarding the statistical analysis of the dataset, the Kolmogorov–Smirnov test showed a nonparametric data distribution for tested parameters, the Kruskal–Wallis test compared tested groups, and the Mann–Whitney U test was used for pairwise comparison. The Mann–Whitney test compared male and female groups (α = 0.05).
The nasal cavity, nasopharynx, oropharynx, and hypopharynx were classified as the volumetric parameters of the airway and maxillary sinuses. Four types of boundaries of these parameters are presented in Table 1: anterior boundary, posterior boundary, superior boundary, and inferior boundary, which show the positions and limits of the line extensions of each parameter.
Cephalometric parameters are classified into different forms based on their position in the skull. There are different positions in the skull, such as the SN plane, A-point, B-point, GO, ANS, ME, SNA, SNB, CV1, CV2ia, etc. The definitions of Cephalometric parameters with their respective positions are presented in Table 2.
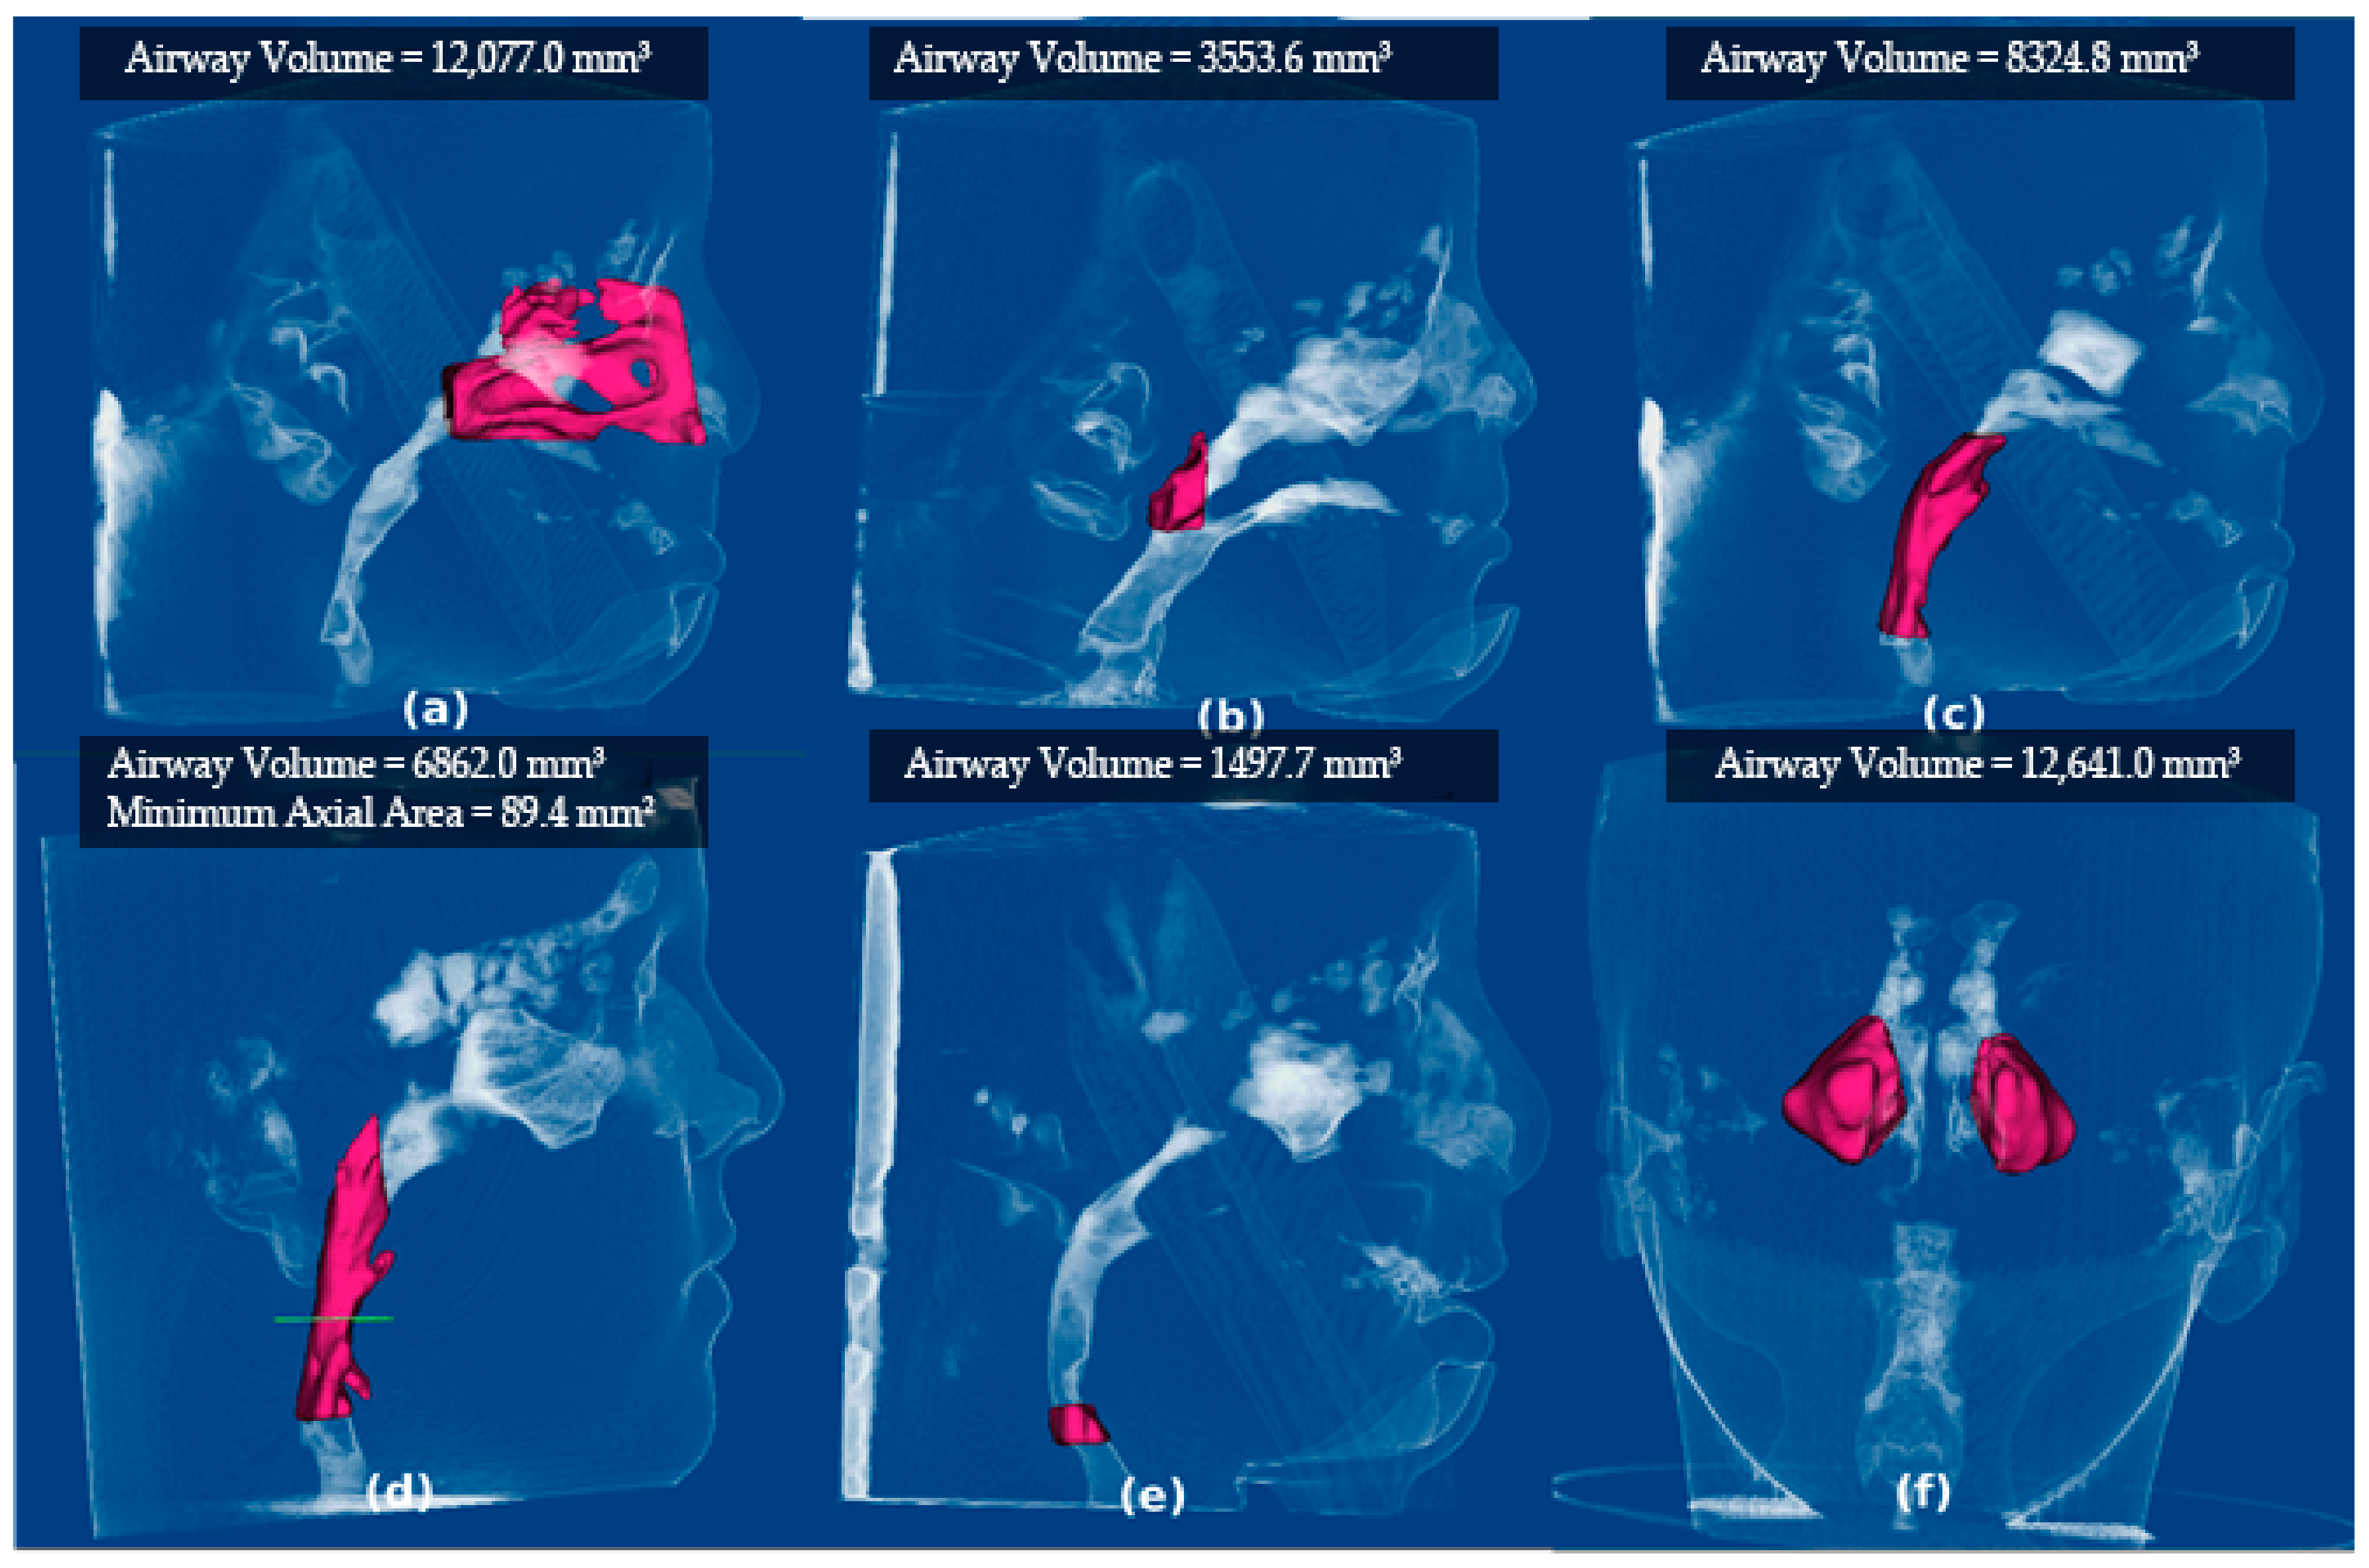
Using the Dolphin 3D imaging software server, CBCT images were uploaded, then measurements of nasal cavity, nasopharynx and oropharynx with minimal axial area and hypopharynx were taken and viewed on the same computer and monitor. All images were oriented in the sagittal, axial, and coronal planes before taking measurements by adjusting the midsagittal plane passed through the face’s skeletal midline (Nasion–Subnasale), as presented in Figure 1.

3. Results

3.1. Reliability

For the reliability test, all reliability values showed a correlation coefficient greater than 0.80, except for the nasopharynx measurement (observer 1), which had too much variability to accept the readings. Observer 1 repeated the measurements till the correlation coefficient became greater than 0.80, as presented in Table 3.

3.2. Test Significance between Cleft Groups and Control Groups

The growing group was further categorized into (i) growing bilateral, (ii) growing unilateral, and (iii) control growing, as well the non-growing group. For growing groups, all the volumetric measurements showed no significant difference (p < 0.05) besides the minimal axial area. For cephalometric parameters, all measurements showed significant differences (p < 0.05) except for B, A, BS-S-N, and CV1. The significant difference between growing groups and the control for all measured parameters is presented in Table 4.
For non-growing groups, none of the volumetric measurements were significant except for left sinus volume and nasal cavity. In cephalometric parameters, MP-SN, B, A, SNA, SNB, and ANS-ME showed significant differences (Table 5).

3.3. Gender Difference

The difference in pharyngeal airway volume was calculated for all groups (growing and non-growing) between males and females. For nasopharynx, female subjects (1261.32 ± 713.94) showed the lowest significant values in non-growing unilateral compared to males (6496.8 ± 2987) at p = 0.008. For all groups, Nasopharynx values (mean, min, max, SD, with p values) are presented in Table 6.
For the oropharynx, in the growing bilateral cleft group, male subjects (13,046.79 ± 5521.89) showed a significant difference compared to females (8468.98 ± 4279.99) at p = 0.046. Values (mean, min, max, SD, and p-values) among males and females for all groups are presented in Table 7.
For the hypopharynx, all group volume differences between males and females are given in Table 8. There was no significant difference between males and females in all groups for the hypopharynx, with the least non-significance value for the control growing.
There was no significant difference between males and females in all groups for the minimal axial area. Among all groups, the difference between minimum axial areas is presented in Table 9. All the values shown are non-significant with p > 0.05.

4. Discussion

This study aimed to evaluate the pharyngeal airway dimensions using 3D CBCT images in subjects with CLP and compare the findings to a non-CLP control group matched for age and sex, using CBCT. The classification of samples into four groups was based on cleft type (unilateral or bilateral cleft) and subject age (growing or non-growing). Previous studies used CBCT to investigate the oropharyngeal airway in children with class III malocclusion, age-related changes in airway dimensions in children and adults, and the pharyngeal airway volume in healthy children with a retrognathic mandible. These were compared to those with normal growth patterns [28,29,30]. However, we aimed to compare the pharyngeal airway dimensions between children with CLP and those without CLP in the control group. Our findings indicated no significant differences between the two groups in the pharyngeal airway volume and the smallest cross-sectional area. Nonetheless, we observed that the airway dimensions were significantly longer in children with CLP than in those without it. This highlights the importance of evaluating airway dimensions in children with CLP to optimize their management and treatment outcomes [26].
Few studies have evaluated pharyngeal airway volumes in patients with CLP, considering age and gender [6,7,9]. Some of these studies had limitations like the usage of post-orthodontic CBCT images, [9] small sample size [6,7,9], and the combination of unilateral cleft lip or palate (UCLP) and bilateral cleft lip or palate (BCLP) patients affected by both UCLP and BCLP. The exclusion criteria included the drawbacks of previous studies. For ethical reasons, we used CBCT data of adults without CLP who had no congenital anomalies but were submitted for other non-syndromic abnormalities or lesions (impacted canines, periapical lesions, etc.).
Hermann et al., (2002) [31] proposed the hypothesis that individuals with a cleft palate may have a smaller midface and retruded jaw, leading to a reduced pharyngeal airway space. Palatal surgery may prevent forward displacement and anteroposterior formulation of the maxillary dentoalveolus but not the maxilla’s downward displacement or palatal remodeling [32]. Astani S. (2018) [33] reported that patients with a cleft palate have a smaller nasopharyngeal airway space than those without a cleft palate. Additionally, Holst et al. (2009) [34] reported that maxillary retrognathism becomes more pronounced as patients age. Our study observed significantly smaller FH-NA and FHN-A values in CLP patients during their juvenile and adolescent years than in their control counterparts, indicating an increase in existing maxillary retrognathism during adolescence, consistent with earlier studies [25].
Paradowska et at. (2014) [35] reported that a congenital absence of tooth buds was identified in 20% of patients diagnosed with bilateral cleft lip and palate (BCLP). Among patients with unilateral clefts, 37.84% of males and 47.73% of females exhibited this condition. In comparison to healthy individuals, patients with unilateral clefts displayed a higher prevalence of Class III malocclusions, with rates exceeding 30% in CLP-R (right-sided cleft) and 20% in CLP-L (left-sided cleft), whereas the control group of boys had less than 10% prevalence. The most commonly observed issue among cleft patients was transverse malocclusions, specifically partial crossbites that primarily affected the side of the cleft. Isolated dental anomalies with normal occlusion were absent in cleft patients, whereas they were present in 35% of healthy patients. Deep bites were frequently observed in patients with bilateral cleft lip and palate, with a prevalence exceeding 25% of the cases.
Kim et al. (2010) [30] reported a total airway volume of 20.96 cm3 with an SD of 3.6 cm3 in children aged 10.50–12.92 years. Our study found a mean airway volume of 11,637.02 mm3 for the bilateral cleft palate group, 12,910.18 mm3 for the unilateral group, and 9508.63 mm3 for the non-cleft palate group, with a mean smallest cross-sectional area of 128.99 mm2 for the controls, 189.65 mm2 for the unilateral CLP patients, and 160.58 mm2 for the bilateral group. The wide range of patient ages and growth rates may account for the significant variation in cross-sectional area values. Abramson et al. (2009) reported an average smallest cross-sectional area of 82.9 mm2 (SD = 16.5 mm2) for children aged 6 to 11 and 122.2 mm2 (SD = 39.3 mm2) for teenagers aged 12 to 16, with no apparent gender differences in airway volume or minimum cross-sectional area. Our study observed longer airway lengths in both the CLP group and in CLP boys than in non-CLP boys, with no discernible changes in airway length between genders within the age range under investigation.
In cephalogram, the comparison of the previous studies found much larger interindividual variations of the volume and area of the upper airway than with CT [16]. Cone beam computed tomography can three-dimensionally assess the morphology of the airway space, which is more accurate than conventional 2D radiography [36]. CBCT was more accurate and reproducible than cephalometric techniques because it provided 3D images for evaluating pharyngeal airways. On the other hand, similar quality images by CBCT technology can be offered using much lower doses of radiation [5].
Many researchers have proposed the utilization of cone-beam computed tomography (CBCT) for the assessment of airway conditions, highlighting its justified potential in various stages of therapy. These stages include the verification of patient position and target volume localization prior to treatment, assessment of non-rigid misalignments (e.g., spinal flexion or anatomical changes in soft tissue), and the confirmation of stable patient positioning throughout or after the treatment procedure. In order to align bony structures before treatment, it is recommended to employ low-dose CBCT protocols [4,5,7,37].
Our allometric 2D results support the work of investigators who investigated the pharyngeal airway characteristics in children with CLP and compared the findings to non-CLP children. Cheung et al. (2012) found no significant difference in pharyngeal airway volume but that the airway length was significantly longer in CLP children when compared to non-CLP children [26].
Our study found no significant differences in the airway volume between CLP and non-CLP patients in growing subjects, despite significant anteroposterior pharyngeal dimensions. This could be explained due to the instability of the hyoid bone position in cleft subjects. These volumetric findings contradict prior work published by Karia et al. (2017), who compared the anteroposterior dimensions of the oropharyngeal airway, the height of the oropharyngeal column, and the volume of the oropharyngeal airway in subjects with and without CLP [38]. The authors found that the oropharyngeal airway volume was lower in CLP patients than in non-CLP patients. However, their sample consisted of CLP and non-CLP subjects with Angle Class I malocclusion with a mean age of 15 years old, unlike our study which included growing and non-growing with a mean age. Between non-growing groups, the nasal cavity and left maxillary sinus showed significantly smaller volumes in the CLP subjects. This confirms the effect of the cleft anomaly on the normal growth of these structures. In addition, in our sample, most of the unilateral CLP subjects had a cleft on the left side, which directly affects the growth of the ipsilateral sinus.
Our results support the outcomes of previous reports which studied age-related airway changes [26]. Comparisons of the total oropharyngeal volume showed that it increased from the prepubertal to the postpubertal stages in both unilateral and bilateral CLP groups. Furthermore, we found that men tended to have bigger airways than women. Ronen et al. reported a differential growth in airways between boys and girls during puberty, resulting in significantly longer airways in boys [39].
Previous studies have examined the morphological changes in the pharyngeal airway following mandibular setback surgery, showing that it may exacerbate obstructive sleep apnea syndrome (OSAS) in some cases [40]. The narrowing of the oropharyngeal level is the primary site of constriction in OSAS patients, and mandibular setback surgery often affects this area. Individuals with CLP also have a narrower pharyngeal airway due to mandibular retrognathism at the soft palate and base of the tongue [41]. However, there is no significant difference in the pharyngeal airway dimensions between juvenile CLP patients and control groups due to the identical mandibular size and position in all juvenile participants reported by Valiathan et al. in (2010) [42]. On the other hand, teenagers with CLP show reduced oropharyngeal airway dimensions, including superior anteroposterior and lateral widths, heights, and volumes, as well as smaller Co-Me, FH-NB, and FHN-B measurements, compared to the control group [43,44]. These differences can be attributed to the smaller mandible size and retrognathic position in adolescent CLP patients. However, the total pharyngeal airway capacity is not significantly different between the adolescent CLP and control groups, indicating a compensatory mechanism that increases airway volume in patients with CLP [45].
In individuals with CLP, the mandibular retrognathism at the soft palate and base of the tongue can lead to a narrower pharyngeal airway space, which may increase the risk of developing OSAS. Additionally, smaller airway dimensions in patients with CLP, particularly in the nasopharynx region, can contribute to the development of OSAS [41].
There were limitations in the study, such as the small sample size of previously obtained scans of children with CLP, the retrospective nature of the study, and the unregulated respiratory cycle during image acquisition, which may have affected the accuracy of the static 3D images. Another limitation is the lack of control over variables such as head position, tongue position, and breathing during the CBCT scans. Additionally, the static nature of the CBCT imaging technique used in this study may not capture dynamic changes that could occur in real-time. Furthermore, inadvertent variations in tongue positioning during the CBCT scans may have influenced the obtained measurements. Additionally, the scans performed after maxillary expansion could have contributed to the greater airway volume observed in the clefts of the children’s lip or palate. Future research could investigate the variations in airway volume in different pharynx regions, such as the nasopharynx, oropharynx, and hypopharynx. It should also examine the differences in airway length between individuals with and without CLP. It is important to note that simple maxillary and mandibular expansion may not be the most effective treatment option for individuals with CLP and sleep-disturbed breathing, as it may worsen nasopharyngeal insufficiency. Therefore, new surgical techniques and adjustments to orthopedic growth are necessary to improve treatment options for patients with CLP.
In cases of less severe CLP, where the maxillary and mandibular hypoplasia are mild, the impact on the airway dimensions may not be as significant. However, even minor malocclusions can contribute to airway narrowing, and patients with CLP should be monitored for any signs of sleep-disordered breathing. Overall, the severity of CLP and resulting malocclusion can significantly impact the dimensions of the pharyngeal airway and may contribute to the development of OSAS in affected individuals.
Future research could investigate the variations in airway volume in different pharynx regions, such as the nasopharynx, oropharynx, and hypopharynx on a larger sample size.

5. Conclusions

The findings of this study indicate that the presence of a cleft anomaly has a minor notable impact on the volumes of the nasal cavity and the maxillary sinus on the same side, particularly during the growth stage. The analysis of linear and angular measurements revealed significant differences between individuals with CLP and those without CLP, both in groups that were still growing and in those that had completed their growth. However, no significant differences were observed in volumetric measurements. Furthermore, this study did not identify any discernible differences between males and females within the CLP and non-CLP groups.

Author Contributions

Conceptualization, A.Z.A., A.R.K. and A.G.; Methodology, A.Z.A., A.R.K., S.B.D. and A.G.; Statistical Analysis, A.A.; Writing—Original Draft Preparation, A.Z.A., M.G.H., A.E.A. and A.R.K.; Writing—Review and Editing, A.Z.A., M.G.H., N.N.R. and A.G.; Supervision, A.G.; Project Administration, A.G. All authors have read and agreed to the published version of the manuscript.

Funding

This research received no external funding.

Institutional Review Board Statement

The study was conducted in accordance with the Declaration of Helsinki and approved by the Institutional Review Board of Gulf Medical University (IRB-COD-FAC-62-APRIL-2023).

Informed Consent Statement

Informed consent was obtained from all subjects involved in the study.

Data Availability Statement

The data presented in this study are available on request from the corresponding author. The data are not publicly available due to privacy.

Acknowledgments

We would like to acknowledge our friend Ahmad Farouk Abdelazim for all his scientific contributions and dedication toward cleft lip/palate patients.

Conflicts of Interest

The authors declare no potential conflict of interest for this article’s research, authorship, and/or publication.

References

  1. Dixon, M.J.; Marazita, M.L.; Beaty, T.H.; Murray, J.C. Cleft lip and palate: Understanding genetic and environmental influences. Nat. Rev. Genet. 2011, 12, 167–178. [Google Scholar] [CrossRef]
  2. Ahluwalia, M.; Brailsford, S.R.; Tarelli, E.; Gilbert, S.C.; Clark, D.T.; Barnard, K.; Beighton, D. Dental caries, oral hygiene, and oral clearance in children with craniofacial disorders. J. Dent. Res. 2004, 83, 175–179. [Google Scholar] [CrossRef] [PubMed]
  3. Tofangchiha, M.; Esfehani, M.; Eftetahi, L.; Mirzadeh, M.; Reda, R.; Testarelli, L. Comparison of the pharyngeal airway in snoring and non-snoring patients based on the lateral cephalometric study: A case–control study. Dent. Med. Probl. 2023, 60, 121–126. [Google Scholar] [CrossRef] [PubMed]
  4. Smardz, J.; Martynowicz, H.; Wojakowska, A.; Winocur-Arias, O.; Michalek-Zrabkowska, M.; Mazur, G.; Wieckiewicz, M. A polysomnographic study on the relationship between sleep bruxism intensity and sleep quality. Cranio 2022, 40, 107–112. [Google Scholar] [CrossRef]
  5. Fu, Z.; Lin, Y.; Ma, L.; Li, W. Effects of maxillary protraction therapy on the pharyngeal airway in patients with repaired unilateral cleft lip and palate: A 3-dimensional computed tomographic study. Am. J. Orthod. Dentofac. Orthop. 2016, 149, 673–682. [Google Scholar] [CrossRef]
  6. Shkoukani, M.A.; Chen, M.; Vong, A. Cleft lip—A comprehensive review. Front. Pediatr. 2013, 1, 53. [Google Scholar] [CrossRef] [PubMed]
  7. MacLean, J.E.; Hayward, P.; Fitzgerald, D.A.; Waters, K. Cleft lip and/or palate and breathing during sleep. Sleep Med. Rev. 2009, 13, 345–354. [Google Scholar] [CrossRef] [PubMed]
  8. Oosterkamp, B.C.; Remmelink, H.J.; Pruim, G.J.; Hoekema, A.; Dijkstra, P.U. Craniofacial, Craniocervical, and Pharyngeal morphology in bilateral cleft lip and palate and obstructive sleep apnea patients. Cleft Palate. Craniofac. J. 2007, 44, 1–7. [Google Scholar] [CrossRef]
  9. Marcus, C.L. Clinical and pathophysiological aspects of obstructive sleep apnea in children. Pediatr. Pulmonol. Suppl. 1997, 16, 123–124. [Google Scholar] [CrossRef]
  10. Smith, T.; Ghoneima, A.; Stewart, K.; Liu, S.; Eckert, G.; Halum, S.; Kula, K. Three-dimensional computed tomography analysis of airway volume changes after rapid maxillary expansion. Am. J. Orthod. Dentofac. Orthop. 2012, 141, 618–626. [Google Scholar] [CrossRef]
  11. Imamura, N.; Ono, T.; Hiyama, S.; Ishiwata, Y.; Kuroda, T. Comparison of the sizes of adenoidal tissues and upper airways of subjects with and without cleft lip and palate. Am. J. Orthod. Dentofac. Orthop. 2002, 122, 189–194. [Google Scholar] [CrossRef]
  12. Martin, O.; Muelas, L.; Viñas, M.J. Nasopharyngeal cephalometric study of ideal occlusions. Am. J. Orthod. Dentofac. Orthop. 2006, 130, 436.e1–436.e9. [Google Scholar] [CrossRef]
  13. Baumrind, S.; Frantz, R.C. The reliability of head film measurements: 1. landmark identification. Am. J. Orthod. 1971, 60, 111–127. [Google Scholar] [CrossRef]
  14. Ghoneima, A.; Kula, K. Accuracy and reliability of cone-beam computed tomography for airway volume analysis. Eur. J. Orthod. 2013, 35, 256–261. [Google Scholar] [CrossRef]
  15. Shaheen, E.; Shujaat, S.; Saeed, T.; Jacobs, R.; Politis, C. Three-dimensional planning accuracy and follow-up protocol in orthognathic surgery: A validation study. Int. J. Oral Maxillofac. Surg. 2019, 48, 71–76. [Google Scholar] [CrossRef]
  16. Aboudara, C.; Nielsen, I.B.; Huang, J.C.; Maki, K.; Miller, A.J.; Hatcher, D. Comparison of airway space with conventional lateral headfilms and 3-dimensional reconstruction from cone-beam computed tomography. Am. J. Orthod. Dentofac. Orthop. 2009, 135, 468–479. [Google Scholar] [CrossRef]
  17. Patcas, R.; Müller, L.; Ullrich, O.; Peltomäki, T. Accuracy of cone-beam computed tomography at different resolutions assessed on the bony covering of the mandibular anterior teeth. Am. J. Orthod. Dentofac. Orthop. 2012, 141, 41–50. [Google Scholar] [CrossRef]
  18. Grauer, D.; Cevidanes, L.S.; Styner, M.A.; Heulfe, I.; Harmon, E.T.; Zhu, H.; Proffit, W.R. Accuracy and landmark error calculation using cone-beam computed tomography–generated cephalograms. Angle Orthod. 2010, 80, 286–294. [Google Scholar] [CrossRef]
  19. El, H.; Palomo, J.M. Measuring the airway in 3 dimensions: A reliability and accuracy study. Am. J. Orthod. Dentofac. Orthop. 2010, 137, S50.e1–S50.e9. [Google Scholar] [CrossRef]
  20. Nur, M.; Kayipmaz, S.; Bayram, M.; Celikoglu, M.; Kilkis, D.; Sezgin, O.S. Conventional frontal radiographs compared with frontal radiographs obtained from cone beam computed tomography. Angle Orthod. 2012, 82, 579–584. [Google Scholar] [CrossRef]
  21. Xu, Y.; Zhao, S.; Shi, J.; Wang, Y.; Shi, B.; Zheng, Q.; Lo, L.-J. 3-dimensional computed tomographic analysis of the pharynx in adult patients with unrepaired isolated cleft palate. J. Oral Maxillofac. Surg. 2013, 71, 1424–1434. [Google Scholar] [CrossRef]
  22. Grauer, D.; Cevidanes, L.S.; Proffit, W.R. Working with DICOM craniofacial images. Am. J. Orthod. Dentofac. Orthop. 2009, 136, 460–470. [Google Scholar] [CrossRef]
  23. Gandedkar, N.H.; Chng, C.K.; Basheer, M.A.; Chen, P.Y.; Leng Yeow, V.K. Comparative evaluation of the pharyngeal airway space in unilateral and bilateral cleft lip and palate individuals with noncleft individuals: A cone beam computed tomography study. Cleft Palate Craniofac. J. 2017, 54, 509–516. [Google Scholar] [CrossRef] [PubMed]
  24. Al-Fahdawi, M.A.; Farid, M.M.; El-Fotouh, M.A.; El-Kassaby, M.A. Cone-beam computed tomography analysis of the nasopharyngeal airway in nonsyndromic cleft lip and palate subjects. Cleft Palate Craniofac. J. 2017, 54, 202–209. [Google Scholar] [CrossRef] [PubMed]
  25. Yoshihara, M.; Terajima, M.; Yanagita, N.; Hyakutake, H.; Kanomi, R.; Kitahara, T.; Takahashi, I. Three-dimensional analysis of the pharyngeal airway morphology in growing japanese girls with and without cleft lip and palate. Am. J. Orthod. Dentofac. Orthop. 2012, 141, S92–S101. [Google Scholar] [CrossRef] [PubMed]
  26. Cheung, T.; Oberoi, S. Three dimensional assessment of the pharyngeal airway in individuals with non-syndromic cleft lip and palate. PLoS ONE 2012, 7, e43405. [Google Scholar] [CrossRef] [PubMed]
  27. Celikoglu, M.; Ucar, F.I.; Sekerci, A.E.; Buyuk, S.K.; Ersoz, M.; Sisman, Y. Assessment of pharyngeal airway volume in adolescent patients affected by bilateral cleft lip and palate using cone beam computed tomography. Angle Orthod. 2014, 84, 995–1001. [Google Scholar] [CrossRef]
  28. Abramson, Z.; Susarla, S.; Troulis, M.; Kaban, L. Age-related changes of the upper airway assessed by 3-dimensional computed tomography. J. Craniofac. Surg. 2009, 20, 657–663. [Google Scholar] [CrossRef]
  29. Iwasaki, T.; Hayasaki, H.; Takemoto, Y.; Kanomi, R.; Yamasaki, Y. Oropharyngeal airway in children with class iii malocclusion evaluated by cone-beam computed tomography. Am. J. Orthod. Dentofac. Orthop. 2009, 136, 318.e1–318.e9. [Google Scholar] [CrossRef]
  30. Kim, Y.-J.; Hong, J.-S.; Hwang, Y.-I.; Park, Y.-H. Three-dimensional analysis of pharyngeal airway in preadolescent children with different anteroposterior skeletal patterns. Am. J. Orthod. Dentofac. Orthop. 2010, 137, 306.e1–306.e11. [Google Scholar] [CrossRef]
  31. Hermann, N.V.; Kreiborg, S.; Darvann, T.A.; Jensen, B.L.; Dahl, E.; Bolund, S. Early craniofacial morphology and growth in children with unoperated isolated cleft palate. Cleft Palate Craniofac. J. 2002, 39, 604–622. [Google Scholar] [CrossRef] [PubMed]
  32. Liao, Y.-F.; Mars, M. Long-term effects of lip repair on dentofacial morphology in patients with unilateral cleft lip and palate. Cleft Palate Craniofac. J. 2005, 42, 526–532. [Google Scholar] [CrossRef] [PubMed]
  33. Astani, S.A.; Yilmaz, H.N.; Nevzatoglu, S.; Demirkaya, A.A.; Acar, Z.A. Evaluation of Airway Volume in Cleft Lip and Palate Following Nasoalveolar Molding. J. Craniofacial Surg. 2018, 29, 2143–2147. [Google Scholar] [CrossRef] [PubMed]
  34. Paradowska-Stolarz, A.; Kawala, B. Occlusal disorders among patients with total clefts of lip, alveolar bone, and palate. Biomed Res. Int. 2014, 2014, 583416. [Google Scholar] [CrossRef]
  35. Vidal-Manyari, P.A.; Arriola-Guillén, L.E.; Jimenez-Valdivia, L.M.; Dias-Da Silveira, H.L.; Boessio-Vizzotto, M. Effect of the application of software on the volumetric and cross-sectional assessment of the oropharyngeal airway of patients with and without an open bite: A CBCT study. Dent. Med. Probl. 2022, 59, 397–405. [Google Scholar] [CrossRef]
  36. Holst, A.I.; Holst, S.; Nkenke, E.; Fenner, M.; Hirschfelder, U. Vertical and sagittal growth in patients with unilateral and bilateral cleft lip and palate—A retrospective cephalometric evaluation. Cleft Palate. Craniofac. J. 2009, 46, 512–520. [Google Scholar] [CrossRef]
  37. Agarwal, A.; Marwah, N. Assessment of the airway characteristics in children with cleft lip and palate using cone beam computed tomography. Int. J. Clin. Pediatr. Dent. 2016, 9, 5. [Google Scholar] [CrossRef]
  38. Karia, H.; Shrivastav, S.; Karia, A.K. Three-dimensional evaluation of the airway spaces in patients with and without cleft lip and palate: A digital volume tomographic study. Am. J. Orthod. Dentofac. Orthop. 2017, 152, 371–381. [Google Scholar] [CrossRef]
  39. Ronen, O.; Malhotra, A.; Pillar, G. Influence of gender and age on upper-airway length during development. Pediatrics 2007, 120, e1028–e1034. [Google Scholar] [CrossRef]
  40. Kitahara, T.; Hoshino, Y.; Maruyama, K.; In, E.; Takahashi, I. Changes in the pharyngeal airway space and hyoid bone position after mandibular setback surgery for skeletal class iii jaw deformity in japanese women. Am. J. Orthod. Dentofac. Orthop. 2010, 138, 708.e1–708.e10. [Google Scholar] [CrossRef]
  41. Jena, A.K.; Singh, S.P.; Utreja, A.K. Sagittal mandibular development effects on the dimensions of the awake pharyngeal airway passage. Angle Orthod. 2010, 80, 1061–1067. [Google Scholar] [CrossRef] [PubMed]
  42. Valiathan, M.; El, H.; Hans, M.G.; Palomo, M.J. Effects of extraction versus non-extraction treatment on oropharyngeal airway volume. Angle Orthod. 2010, 80, 1068–1074. [Google Scholar] [CrossRef]
  43. Muto, T.; Yamazaki, A.; Takeda, S. A cephalometric evaluation of the pharyngeal airway space in patients with mandibular retrognathia and prognathia, and normal subjects. Int. J. Oral Maxillofac. Surg. 2008, 37, 228–231. [Google Scholar] [CrossRef]
  44. Kuang, W.; Zheng, J.; Li, S.; Yuan, S.; He, H.; Yuan, W. Three-dimensional analysis of the pharyngeal airway volume and craniofacial morphology in patients with bilateral cleft lip and palate. Cleft Palate. Craniofac. J. 2021, 58, 332–339. [Google Scholar] [CrossRef] [PubMed]
  45. Rehani, M.M.; Gupta, R.; Bartling, S.; Sharp, G.C.; Pauwels, R.; Berris, T.; Boone, J.M. ICRP Publication 129: Radiological Protection in Cone Beam Computed Tomography (CBCT). Ann. ICRP 2015, 44, 7–127. [Google Scholar] [CrossRef] [PubMed]
Figure 1. Measurements of Airway segmentation, volume, and minimal area. Screenshots from Dolphin software show the segmentation and volume measurement of the airway space, as shown in Table 1. (a) The nasal cavity; (b) nasopharynx; and (c) oropharynx are segmented and measured from the top left to right. From bottom left to right, (d) minimal axial area; (e) hypopharynx; and (f) maxillary sinuses are shown.
Anatomia 02 00018 g001
Table 1. Volumetric parameters of the airway and the maxillary sinuses. The prevertebral soft-tissue thickness was measured as the distance parallel to the Frankfort horizontal plane from 3 points on the CV 2 and CV 4 to the posterior wall of the airway. Bony structure and soft tissue transposed on each other in the midsagittal plane with the 3D Dolphin imaging system. Odp (Odontoid): The apex of the odontoid process of the second cervical vertebra. C4sp: most superior and posterior border of 4th cervical vertebra. C4ip: most inferior and posterior border of the cervical vertebra. Hyoid (H): middle of the anterior part of the Hyoid body.
Anterior BoundaryPosterior BoundarySuperior BoundaryInferior Boundary
Nasal cavityLine connecting the anterior nasal spine (ANS) to the tip of the nasal bone to nasion (N)Line extending from sella (S) to the posterior nasal spine (PNS)Line connecting N to SLine extending from the ANS to the PNS
NasopharynxLine extending from sella (S) to the posterior nasal spine (PNS)Line extending from S to the tip of the odontoid process (Odp) Line extending from the PNS to tip of the odontoid process (Odp)
OropharynxLine extending from the posterior nasal spine (PNS) to the body of hyoid boneLine extending from the tip of the odontoid process to the posterior-superior border of CV 4Line extending from the PNS to the tip of the odontoid processLine extending from the body of hyoid bone to the posterior-superior border of CV 4
HypopharynxLine extending from the body of hyoid bone (H) to the inferior border of the symphysisLine extending from (C4sp) the posterior-superior corner of CV 4 to (C4ip) the posterior-inferior corner of CV 4Line extending from the body of hyoid bone to (C4sp) the posterior-superior corner of CV 4Line extending from (C4ip) the posterior-inferior corner of CV 4 to the inferior border of the symphysis
Table 2. The definitions of Cephalometric parameters.
ParametersDefinitions
SN Plane
S-N
This plan represents the anterior cranial base and is formed by connecting Sella to Nasion
Mandibular Plane (MP)
Go-Gn
This plane is formed by connecting the point Gonion to Gnathion at the inferior border of the mandible
A point (subspinale)The most concave point of anterior maxilla
B point supramentaleThe most concave point on mandibular symphysis
Basion (Ba)The most anterior point on foramen magnum
Gnathion (Gn)Point located perpendicular on mandibular symphysis midway between pogonion and menton
Gonion (GO)The most posterior inferior point on the angle of mandible. Can also be constructed by bisecting the angle formed by the intersection of mandibular plane and ramus of mandible
Anterior Nasal Spine (ANS)Anterior point on maxillary bone
Menton Me)Lowest point on mandibular symphysis
SNA (°)Sella-Nasion to A Point Angle
SNB (°)Sella-Nasion to B Point Angle
N verticalThe line extended from Nasion perpendicular to Frankfurt horizontal plane FH
N-ANSThe linear measurement from Nasion to ANS
A point measurement The linear measurement from A point to N vertical
B point measurementThe linear measurement from B point to N vertical
MP-SNThe angle between Mandibular plane MP and Sella-Nasion Plane SN
BS-S-NThe angle between Basion Ba, Sella S, and Nasion N
ANS-MeThe linear measurement between Anterior Nasal Spine ANS and Menton Me
CV1The linear measurement between Posterior Nasal Spine SP and C1 (The most anterior point on the anterior arch of C1)
CV2iaThe linear measurement between H (middle of the anterior part of the Hyoid body) and CV2ia (most inferior and anterior border of 2nd cervical vertebra).
CV3saLinear measurement between H (middle of the anterior part of the Hyoid body) and CV3sa(most superior and anterior border of 3rd cervical vertebra
CV3iaLinear Measurement between H (middle of the anterior part of the Hyoid body) and CV3ia (most inferior and anterior border of 3rd cervical vertebra
Table 3. ICC result on various patients (identified by Pt Code) and their corresponding age and measurements in different regions of the nasal cavity, nasopharynx, oropharynx, and hypopharynx. The measurements are presented as Read1 (R1) and Read2 (R2) values.
Pt CodeAgeNasal CavityNasopharynxOropharynxHypopharynx
R1R2R1R2R1R2R1R2
AAA0016598949940.631743846.511,093.514,472.11919.81721.3
AAA0027012,257.910,758.51540.42181.16952.97825.91323.51213.7
AAA003443692.74064.2 13,306.215,224.7
AAA0043220,886.721,498.51328.91788.616,938.917,198.9
AAA0052113,290.514,082856.91263.511,340.113,467.92566.22164.5
AAA0061115,698.514,115.35195.65885.311,933.613,162.8
AAA007888633.78780.62076.32348.16397.16866.7
AAA008951131.410,841.43206.33294.617,102.317,170.23781.33873.2
AAA009636713.86554377.72767.57290.849101392.81409
AAA0105519,686.717,309.529.143.615,269.716,295.8
CC. 0.86 0.91 0.94 0.98
Table 4. Difference between growing cleft groups and controls. Values are expressed as mean and standard deviations (SD). Means with (*) are significant at p < 0.05.
Groupsp-Value
Growing BilateralGrowing UnilateralControl Growing
MeanSDMeanSDMeanSD
Nasal Cavity10,651.115935.859941.335038.6414,843.795586.220.524
Nasopharynx1656.611401.001843.351541.981262.63719.570.453
Oropharynx10,212.905181.9011,032.624023.028248.932336.740.196
Hypopharynx1516.26946.832350.932861.071331.29512.040.273
total11,637.025718.9512,910.184621.529508.632779.410.161
Minimum Axial Area160.5878.39189.65170.32128.9959.680.329
Right sinus6671.375280.598240.843569.418866.923305.360.309
Left sinus8119.443739.808405.274094.0613,610.5814,380.290.158
MP-SN41.14 b8.6347.24 a8.2832.81 c4.35≤0.001 *
B−2.6010.54−6.217.66−1.473.590.273
A5.057.620.435.682.621.940.084
ANB8.52 a5.883.17 b4.022.49 b2.71≤0.001 *
SNA82.72 a7.1476.43 b5.2280.57 a2.940.007 *
SNB74.60 b5.3973.25 b4.7678.08 a3.280.019 *
GO-GN70.47 ab8.4875.43 a7.6668.54 b4.470.034 *
BS-S-N128.937.16128.858.73132.134.910.343
N-ANS52.46 ab7.4655.81 a7.5448.82 b2.490.017 *
ANS-ME69.45 a12.9774.57 a10.7060.93 b5.290.003 *
CV17.413.576.732.706.733.220.762
CV2ia5.89 a1.545.15 ab1.194.51 b0.830.008 *
CV3sa7.60 a2.996.13 ab1.265.50 b1.000.013 *
CV3ia7.56 a3.356.06 ab2.684.32 b0.740.003 *
a, b, c, ab Means with the same letter within each row are not significant at p ≥ 0.05.
Table 5. Difference between non-growing cleft and control non-growing groups. Means with (*) are significant at p < 0.05.
Non-Growing BilateralNon-Growing UnilateralControl Non-Growingp-Value
MeanSDMeanSDMeanSD
Nasal Cavity9489.00 b3336.929404.78 b6048.2624,375.82 a4599.70≤0.001 *
Nasopharynx2757.172890.292750.392032.224378.422826.670.186
Oropharynx12,812.517737.7816,678.428522.9719,984.319542.560.213
Hypopharynx2091.861107.725357.197838.063008.85953.310.277
total15,126.177871.4038,343.6270,925.3424,412.4010,751.180.502
Minimum Axial Area165.41125.94218.51133.59268.57138.560.244
Right sinus9413.075472.1117,891.005843.1416,480.733948.870.429
Left sinus10,981.50 b6115.8411,496.13 ab5709.7816,147.78 a4625.620.044 *
MP-SN50.14 a7.6946.00 a7.2930.34 b5.44≤0.001 *
B−9.34 b10.35−4.86 b6.964.54 a5.90≤0.001 *
A−4.19 b7.68−0.24 ab5.584.58 a5.830.010 *
ANB1.675.371.783.091.403.250.961
SNA77.07 b8.6776.94 b5.4482.55 a4.580.029 *
SNB75.40 b6.1075.16 b5.6981.15 a2.680.003 *
GO-GN80.835.8378.648.6583.213.230.167
BS-S-N127.916.62128.194.80130.356.690.542
N-ANS59.404.9654.929.2358.155.900.333
ANS-ME90.40 a10.8684.08 a8.8770.48 b7.35≤0.001 *
CV15.111.135.242.585.111.970.985
CV2ia6.373.214.931.485.090.860.191
CV3sa6.841.686.071.516.180.930.442
CV3ia6.713.015.282.254.910.980.158
a, b, ab Means with the same letter within each row are not significant at p ≥ 0.05.
Table 6. Nasopharynx volume differences between all groups. Values are expressed as mean, minimum, maximum, and standard deviations.
Genderp-Value
MaleFemale
MeanSDMin.Max.MeanSDMin.Max.
NasopharynxGrowing bilateral2080.541615.93533.705195.601409.311267.4629.103543.000.328
Growing Unilateral1884.581322.70131.703808.001796.231871.36194.805458.500.917
Non-Growing bilateral6496.802987.674384.208609.401261.32713.94257.802240.200.008 *
Non-Growing Unilateral2058.141055.59575.803474.403134.982384.96449.707142.700.363
Control Growing928.82673.40190.102069.801485.17695.27473.202875.800.148
Control Non-Growing5849.873097.963164.0011,736.603397.462297.35316.208641.600.101
* p < 0.05 showed a significant difference.
Table 7. Oropharynx volume differences between all groups. Values are expressed as mean, minimum, maximum, and standard deviations.
Genderp-Value
MaleFemale
MeanSDMin.Max.MeanSDMin.Max.
OropharynxGrowing bilateral13,046.795521.896952.9024,484.508468.984279.993497.9017,102.300.046 *
Growing Unilateral12,795.034203.468709.5020,358.108976.482866.814640.8011,726.600.087
Non-Growing bilateral11,770.402936.619693.9013,846.9013,229.369321.698376.6029,871.100.844
Non-Growing Unilateral21,476.3512,407.666563.9036,633.2014,546.005882.568379.1026,881.700.187
Control Growing7098.521695.094742.608888.909015.872470.945263.1012,527.200.123
Control Non-Growing25,725.3012,451.4515,510.4048,961.2016,156.994610.648680.9024,904.700.053
* p < 0.05 showed a significant difference.
Table 8. Hypopharynx volume difference between all groups. Values are expressed as mean, minimum, maximum, and standard deviations, and p-values.
Genderp-Value
MaleFemale
MeanSDMin.Max.MeanSDMin.Max.
HypopharynxGrowing bilateral1856.18748.43893.202578.201346.301024.35400.503781.300.344
Growing Unilateral1641.13574.501044.002394.803060.734058.25840.4011,177.300.417
Non-Growing bilateral1420.45465.771091.101749.802360.421212.761069.804085.300.356
Non-Growing Unilateral9876.9312,780.531383.0024,575.302645.341151.85831.103804.900.231
Control Growing1010.34404.32570.101527.101509.59494.13580.902117.700.079
Control Non-Growing3216.60851.942070.204581.702870.361040.591287.404177.500.511
Table 9. Minimum axial area difference between all groups. Values are expressed as mean, minimum, maximum, and standard deviations.
Genderp-Value
MaleFemale
MeanSDMin.Max.MeanSDMin.Max.
Minimum Axial AreaGrowing bilateral193.5192.8581.00327.80140.3163.6059.00246.800.134
Growing Unilateral171.5474.2190.30278.80210.77249.0313.90701.000.697
Non-Growing bilateral155.4527.08136.30174.60169.40153.4275.90442.100.908
Non-Growing Unilateral275.53244.2131.30611.20193.1745.35117.00253.900.326
Control Growing94.3761.1731.60210.40152.0748.9488.10218.100.064
Control Non-Growing349.25179.16207.30700.10214.7873.46120.30327.900.062
Disclaimer/Publisher’s Note: The statements, opinions and data contained in all publications are solely those of the individual author(s) and contributor(s) and not of MDPI and/or the editor(s). MDPI and/or the editor(s) disclaim responsibility for any injury to people or property resulting from any ideas, methods, instructions or products referred to in the content.

