Abstract
Synthetic opioids such as fentanyl are key drivers of the opioid crisis, contributing to approximately 68% of the nearly 108,000 deaths linked to drug overdose in 2022 (CDC). Though fentanyl is a μ opioid receptor agonist, it demonstrates enhanced lipophilicity, heightened potency to induce respiratory depression, and more rapid central nervous system entry compared to certain other opioids, i.e., morphine. However, there are relatively few biodistribution comparison studies of fentanyl and classical opioids like morphine in mice, despite the use of mice as preclinical models of opioid effects, i.e., respiratory depression. Therefore, the current study compared acute fentanyl (0.3 mg/kg) and morphine (30 mg/kg) biodistribution in blood and 12 tissues at doses causing respiratory depression in male Swiss Webster mice. Whole-body plethysmography was used to select fentanyl and morphine doses producing comparable respiratory depression, and an LC/MS-MS protocol was developed to quantify fentanyl, morphine, and metabolites in diverse tissue samples. Drug distribution time courses varied by tissue, with fentanyl and morphine displaying similar time courses in the lung, stomach, and small intestine, but differing in the brain and spleen. Fentanyl exhibited greater distribution out of the blood and into the brain, liver, lung, and heart than morphine early after administration and out of the blood into fat at later time points after administration. The ratios of total drug distribution (area under the curve) in tissue–blood over time suggest that fentanyl accumulation in tissue relative to blood in several areas, such as lung, heart, kidney, spleen, fat, and small intestine, is greater than morphine. These findings indicate that fentanyl administration may affect several organs to a larger degree than morphine.
1. Introduction
The synthetic opioid fentanyl was first produced by Janssen in 1960 as part of an initiative to develop high-potency, rapidly acting analgesics serving as viable alternatives to morphine [1,2,3]. Since 2013, however, fentanyl and other synthetic opioids have emerged as key drivers of the ongoing opioid crisis, playing an increasing role in the rise in overdose fatalities [1,4]. Out of the nearly 108,000 drug overdose deaths reported by the CDC in 2022, around 68% (73,838 deaths) were linked to synthetic opioids other than methadone, primarily fentanyl, constituting a 7.5-fold increase from 2015 [5]. Clearly, there is an urgent need to gain a better understanding of fentanyl’s physiological and pharmacological properties.
Notably, fentanyl possesses several distinctive characteristics compared to other, more traditional μ opioid receptor agonists such as morphine, a natural alkaloid whose isolation from opium, a product of the opium poppy (Papaver somniferum), in the nineteenth century is generally credited to German apothecary Friedrich Sertürner [6]. For instance, fentanyl’s elongated chemical structure and rotatable bonds confer greater flexibility than morphine’s interconnected rings [7]. Moreover, in contrast to most other opioids, fentanyl’s protonated nitrogen (which interacts with Asp1473.32 within the μ opioid receptor) is positioned in the middle of the molecule [7]. This may permit multiple binding poses for fentanyl within the orthosteric binding pocket of the μ opioid receptor [8,9,10,11], while morphine only appears to adopt one binding pose within the μ opioid receptor [12]. Structural differences between fentanyl and morphine are illustrated in Figure 1.
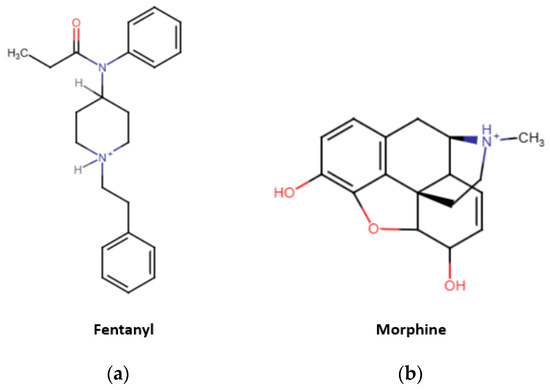
Figure 1.
Chemical structures of fentanyl and morphine. Made with Marvin software version 24.3.0 (Chemaxon).
Fentanyl also exhibits greater lipophilicity than morphine [7,13]. This could contribute to fentanyl’s rapid central nervous system entry (thus, the rapid onset of centrally mediated effects) compared to morphine [14] and also supports intriguing findings in silico which suggest that fentanyl may penetrate the cell membrane to a greater depth than morphine and enter the μ opioid receptor orthosteric binding pocket through a lipid route (the cell membrane) as well as the conventional aqueous route [15].
Studies in mice have found other pharmacokinetic differences between fentanyl and morphine, including lower absorption rate constant and brain equilibration half-life for fentanyl [16]. In contrast to morphine, a two-compartment model was required to adequately describe fentanyl systemic pharmacokinetics based on brain and serum data [16].
Moreover, several characteristics of fentanyl enhance its impact on respiratory depression, contributing to its increased lethality. For instance, fentanyl is 50–100 times more potent than morphine [17]. As stated above, fentanyl also enters the brain more quickly, driving the rapid onset of central nervous system effects such as respiratory depression [14]. Fentanyl overdose death can, depending on the route, occur within 2 min after administration [2], leaving a dangerously narrow window of intervention. This problem is further compounded by fentanyl’s reduced sensitivity to naloxone antagonism [14,18,19,20,21,22], which impedes responders’ ability to reverse an overdose. In addition, subjects that have been rendered tolerant to other opioids, such as chronic morphine, exhibit reduced cross-tolerance to fentanyl-induced respiratory depression [14]. Yet another unique attribute of fentanyl is its ability to promote skeletal muscle rigidity [23,24], including sustained diaphragm/intercostal muscle contractions [25] and the obstruction of the glottic and supraglottic airway [26,27]. This phenomenon, dubbed ‘wooden chest syndrome,’ exacerbates fentanyl-induced respiratory depression [7].
Mice are a common model for studying fentanyl-induced respiratory depression [14,28,29], but little extensive research has been carried out on widespread fentanyl distribution in murine tissue at doses relevant to respiratory depression or comparing said distribution with that of traditional opiates. Although one whole-body radiography study reported greater fentanyl distribution in the central nervous system, gallbladder, and intestines relative to dihydromorphine in mice [30], mouse research comparing equipotent doses of fentanyl and morphine typically limits sample collection to the blood and brain [16].
As summarized in Table 1, various analytical methods have been developed to quantify fentanyl and morphine in mouse blood and tissue. However, these protocols are often intended to measure either fentanyl or morphine rather than both opioids simultaneously and may not include their metabolites. Also, barring a few exceptions [31,32,33], these analytical methods only quantify fentanyl and/or morphine in a limited number of matrices, such as the blood and brain. Thus, the development of a bioanalytical protocol quantifying both fentanyl and morphine in multiple murine tissues would represent a useful contribution to the literature.

Table 1.
Analytical methods for quantifying fentanyl and morphine in mice.
It is worth noting that fentanyl biodistribution studies across multiple tissues have been performed in rats. Fentanyl infusion in male rats resulted in higher concentrations being observed in fat compared to the kidney, liver, and muscle [50], as well as higher steady-state tissue–blood partition coefficients in fat compared to the brain, heart, and lungs [51]. Meanwhile, time-course autoradiography [52] and high-performance thin-layer chromatography studies [53] on the biodistribution of fentanyl infusions in female rats showed that fentanyl concentration was highest in the brain, heart, and lungs shortly after administration, while fentanyl redistribution into the stomach, intestines [52,53], and/or fat [53] occurred at later time points. However, besides the species difference between rats and mice, these studies did not compare fentanyl biodistribution with the biodistribution of equivalent doses of traditional opioids such as morphine. Some of these experiments also used routes of administration, i.e., continuous infusion [50,51] more in line with fentanyl’s clinical use as an anesthetic than abuse within the context of recreational drug seeking [54].
Thus, there is a need for a more comprehensive examination of fentanyl and morphine biodistribution in multiple tissues within a preclinical mouse model at doses inducing respiratory depression. The present experiments sought to address this gap in the literature, thereby contributing to the knowledge of fentanyl’s differences from traditional opiates. It was hypothesized that fentanyl would undergo more rapid distribution than morphine, with greater accumulation in fat (and, potentially, other tissues) due to its greater lipophilicity. A bioanalytical method was validated for quantifying fentanyl, morphine, and select metabolites in diverse murine matrices, including the blood, brain, liver, lung, heart, kidney, spleen, small and large intestine, stomach, muscle, fat, and skin. This permitted the simultaneous assessment of fentanyl and morphine concentrations in mice to a more thorough extent than much of the prior literature. Pilot studies using whole-body plethysmography, an established respiratory depression assay, identified 0.3 mg/kg fentanyl and 30 mg/kg morphine sc as doses producing comparable respiratory depressant effects. These doses were subsequently used in acute biodistribution studies, in which drug-naïve mice were sacrificed and tissues collected at four different time points (5, 15, 60, and 240 min) after fentanyl or morphine injection. Fentanyl, morphine, and metabolite concentrations were quantified via liquid chromatography–tandem mass spectrometry, generating a profile for acute fentanyl and morphine biodistribution in mouse tissues over time. The ratios of the area under the curve (AUC) data in tissue–blood indicated that fentanyl accumulated out of the blood into the tissue to a greater extent than morphine in the brain, liver, lung, heart, kidney, spleen, small intestine, stomach, and fat, suggesting potential for deleterious fentanyl effects across multiple organs.
2. Materials and Methods
2.1. Drugs
Fentanyl hydrochloride and morphine sulfate pentahydrate were provided by the National Institute on Drug Abuse (Bethesda, MD, USA) Drug Supply Program. The drugs were dissolved in sterile saline and administered sc at a volume of 10 mL/kg body weight.
2.2. Standards and Reagents
Certified reference materials and internal standards for mass spectroscopy studies, including 100 μg/mL fentanyl (N-Phenyl-N-[1-(2-phenylethyl)-4-piperidinyl]propanamide; CAS No. 437-38-7) in methanol, 100 μg/mL fentanyl-d5 (N-(Pentadeuterophenyl)-N-[1-(2-phenylethyl)-4-piperidinyl]propanamide; CAS No. 118357-29-2) in methanol, 1 mg/mL norfentanyl oxalate (N-Phenyl-N-(4-piperidinyl)propanamide oxalate; CAS No. 1211527-24-0) in methanol, 1 mg/mL norfentanyl-d5 oxalate (N-(4-Piperidinyl)-N-pentadeuterophenylpropionamide oxalate; CAS No. 1435933-84-8) in methanol, 100 μg/mL 4-ANPP (N-Phenyl-1-(2-phenethyl)-4-piperidinamine; CAS No. 21409-26-7) in methanol, 100 μg/mL 4-ANPP-d5 (N-phenyl-D5-1-(2-phenethyl)-4-piperidinamine; CAS No. 1189466-15-6) in methanol, 1 mg/mL morphine ((5α,6α)-7,8-Didehydro-4,5-epoxy-17-methylmorphinan-3,6-diol; CAS No.57-27-2) in methanol, 100 μg/mL morphine-d3 (7,8-Didehydro-4,5-epoxy-17-trideuteromethylmorphinan-3,6-diol; CAS No. 67293-88-3) in methanol, 1 mg/mL morphine-3-β-d-glucuronide ((5α,6α)-7,8-didehydro-4,5-epoxy-6-hydroxy-17-methylmorphinan-3-yl-β-D-glucopyranosiduronic acid; CAS No. 20290-09-9) in methanol with 0.05% NaOH, 100 μg/mL morphine-3-β-d-glucuronide-d3 (7,8-Didehydro-4,5-epoxy-17-trideuteromethylmorphinan-6-ol-3beta-glucuronic acid; CAS No. 136765-44-1) in methanol with 0.05% NaOH, 1 mg/mL morphine-6-β-d-glucuronide ((5α, 6α)-7,8-didehydro-4,5-epoxy-3-hydroxy-17-methylmorphinan-6-yl-β-D-glucopyranosiduronic acid; CAS No. 20290-10-2) in water–methanol (80:20), and 100 μg/mL morphine-6-β-d-glucuronide-d3 ((5α,6α)-7,8-didehydro-4,5-epoxy-3-hydroxy-17(methyl-D3)morphinan-6-yl-β-D-glucopyranosiduronic acid; CAS No. 219533-69-4) in water–methanol (50:50) were purchased from the Cerilliant Corporation (Round Rock, TX, USA).
HPLC (high-performance liquid chromatography)-grade water, HPLC-methanol, and formic acid were purchased from Fisher Chemical (Waltham, MA, USA).
2.3. Subjects
For respiratory depression studies, 80 adult (at least 10 weeks of age) male Swiss Webster mice (Envigo) weighing between 27 and 44 g (mean ± standard deviation = 33.1 ± 3.72 g) were group housed (4–5/cage) in Association for Assessment and Accreditation of Laboratory Animal Care-accredited facilities at Virginia Commonwealth University. The animals were kept on a 12 h reverse light/dark cycle and allowed at least one week to acclimate to vivarium conditions prior to the experiments. The mice had access to food (Teklad 7012 Rodent Diet; Envigo, Madison, WI, USA) and tap water ad libitum in the home cage. Assays were run during the dark period when mice were more likely to be active. To avoid confounding effects of previous drug history, all the mice remained drug-naïve until the day of testing, and each mouse was only used once for a single study.
For acute opioid biodistribution studies, 48 drug-naïve adult male Swiss Webster mice (Envigo) weighing between 27 and 41 g (mean ± standard deviation = 33.7 ± 3.15 g) were used. The mice were kept on a standard 12 h light/dark cycle. The housing conditions were otherwise identical to those for the respiratory depression studies.
All the experiments were performed in accordance with the National Research Council’s Guide for Care and Use of Laboratory Animals (2011), and the animal study protocol was approved by the Institutional Animal Care and Use Committee of Virginia Commonwealth University (protocol code AM10322).
2.4. Whole-Body Plethysmography
2.4.1. Apparatus
Lighting for the laboratory space was provided by custom 660 nM-emitting T8-style ceiling-mounted light tubes, each with 96 0.2-watt Epistar 2835 SMD LEDs (Shenzhen Benwei Electronics Co., Ltd., Longhua District, Shenzhen, China). Since mice demonstrate reduced sensitivity to this wavelength compared to humans [55], these lights ensured minimal disruption of the dark cycle while providing visibility for the research personnel. The mice were placed in individual whole-body plethysmograph chambers (FinePointe WBP Chamber with Halcyon Technology, Data Sciences International, St. Paul, MN, USA) with a volume of 0.5 L (adjustable 0.5 L/min room air bias flow) that allowed unrestrained movement. To enhance the assay’s ability to measure drug-induced respiratory effects and reduce variation caused by ambient air conditions, a standardized gas mixture comprising 5% carbon dioxide, 21% oxygen, and balance nitrogen was continuously delivered into the chambers [28,29].
2.4.2. Three-Phase Whole-Body Plethysmography Protocol
The animals were run on a 3-phase protocol lasting a total of 90 min (modified from [28]). During the Baseline Phase (20 min), the animals were placed in the plethysmography chambers to acclimate to the novel environment, and baseline respiration (in the absence of drug treatment) was monitored. At the conclusion of the Baseline Phase, the mice were removed from the chamber; given a subcutaneous (sc) injection of either saline, fentanyl (0.03–1 mg/kg), or morphine (1–30 mg/kg); and immediately returned to the chamber to record respiration during the second phase, or Agonist Phase (35 min). At the end of the Agonist Phase, the mice were removed from the chamber, given a sc injection of saline, and immediately returned to the chamber to record respiration during the Reversal Phase (35 min). Ordinarily, a μ opioid receptor (MOR) antagonist such as naloxone would be administered at the start of the Reversal Phase [28]. However, since the main purpose of the above pilot was to compare fentanyl and morphine dose response in respiratory depression, all the mice received saline for the Reversal Phase. A schematic of this protocol is provided in Figure S1. Frequency (f; respiratory rate, or the number of breaths per minute), tidal volume (TVb; the volume of air displaced from the lungs between inspiration and expiration), and minute volume (MVb; the volume of air inhaled or exhaled from the lungs in a minute, defined as the product of frequency x tidal volume) were recorded with the FinePointe software (version 2.7.0.11788).
2.5. Tissue Collection
The mice were randomly sorted into three treatment groups: saline (vehicle control), 0.3 mg/kg fentanyl, or 30 mg/kg morphine. These groups were further divided based on the time of sacrifice post-injection (5, 15, 60, or 240 min; n = 4/treatment/time point). All the injections were delivered sc. The above doses of fentanyl and morphine were chosen based on the ~100-fold difference in potency between these drugs [17] and their ability to produce robust respiratory depression in whole-body plethysmography studies. After the designated time had elapsed, the mice were decapitated by guillotine, and trunk blood and tissue samples (the brain, liver, lung, heart, kidney, spleen, small intestine, large intestine, stomach, muscle, fat, and skin) were harvested on ice. Upon collection, all the samples were transferred to microcentrifuge tubes and immediately stored at −80 °C.
2.6. Solid-Phase Extraction
The tissue samples were homogenized in a 1:4 dilution in water (except for muscle and skin, which were diluted 1:8). In total, 100 μL aliquots of homogenate were placed in a glass culture tube along with 50 μL of internal standard solution (0.2 μg/mL morphine-d3, 1 μg/mL morphine-3-β-D-glucuronide-d3, and morphine-6-β-D-glucuronide-d3; 0.02 μg/mL fentanyl-d5, 0.1 μg/mL norfentanyl-d5, and 4-ANPP-d5) and 300 μL HPLC water. The samples were then centrifuged (Allegra X-15R centrifuge, Beckman Coulter, Inc., Indianapolis, IN, USA) at 3000 RPM for 10 min.
Extraction was performed with a 48-position positive pressure manifold (United Chemical Technologies, Inc., Bristol, PA, USA) connected to a nitrogen gas tank. SPE-Phenomenex Strata-x 33 μ Polymeric Reversed Phase columns (Phenomenex Inc., Torrance, CA, USA) were conditioned with 1 mL of methanol followed by 1 mL of water, and the samples were subsequently loaded. This was followed by a 5% methanol wash (1 mL). The samples were then eluted with 0.400 mL (2×) of 95% methanol.
The eluted samples were transferred to a 96 deep-well plate, evaporated under nitrogen (25 psi) for 30–45 min at 55 °C on an SPE Dry 96 (Biotage), and reconstituted with 65 μL methanol. In addition to the experimental samples, each run also included a calibration curve (in mouse serum), blanks, and quality controls for the tissue types being analyzed. The calibrators were prepared at 1, 2, 5, 10, 20, 50, and 100 ng/mL (fentanyl and 4-ANPP); 5, 10, 20, 50, 100, 200, and 500 ng/mL (norfentanyl); 10, 20, 50, 100, 200, 500, and 1000 ng/mL (morphine); and 50, 100, 200, 500, 1000, 2000, and 5000 ng/mL (morphine-3 and morphine-6-β-D-glucuronide).
2.7. Liquid Chromatography–Tandem Mass Spectrometry
Chromatographic separation was performed with a SCIEX ExionLC 2.0 liquid chromatograph using an Agilent Polaris SI-A column (180 Å, 5 μm, 50 × 3.0 mm). The autosampler injection volume was 5 μL with a duration of 5.50 min. Mobile phases were kept on an isocratic gradient (90% Mobile Phase A: 1% formic acid in water; 10% Mobile Phase B: 1% formic acid in acetonitrile). The column oven temperature was maintained at 40 °C.
Mass spectrometry was performed by a SCIEX (Framingham, MA, USA) QTRAP 6500+ high-throughput mass spectrometer run on the Analyst 1.7.2 analytical software. The source temperature was set to 600 °C, while the curtain gas and Gases 1 and 2 flow rates were set to 40 mL/min. The electrospray voltage was 5500 eV, and the dwell time was 100 ms.
Ion mass/charge ratios (m/z) for Q1 (Quadrupole 1) and Q3 (Quadrupole 3), as well as collision energy and declustering potential, are listed in Table S1.
The analytical method was validated in accordance with version M10 of the guidelines laid out by the International Council for Harmonisation of Technical Requirements for Pharmaceuticals for Human Use [56]. The summary tables of the method validation criteria for each analyte are listed in Tables S2–S7. Further detail on the absolute between- and within-run accuracy (Table S8–S9.3) and precision (Tables S10–S11.3), recovery of analytes (Table S12) and internal standards (Table S13), matrix effects (Tables S14 and S15), analyte stability under different storage conditions (Table S16) and over time (Tables S17.1–S18.3), and quality controls (Tables S19.1–S19.6) and accuracy (Tables S20.1–S20.6) for each analyte in the 13 experimental matrices can also be found in Supplementary Materials.
Morphine-6-β-D glucuronide is not typically produced at readily detectable levels in mice treated with morphine [57,58,59]. However, it was included in the bioanalytical method to serve as a control, i.e., if tissue samples had returned sizable readings for morphine-6-β-D glucuronide, this would be indicative of the potential technical errors that might otherwise confound the results.
2.8. Statistics
Statistical analysis was performed with the GraphPad Prism software (version 6.01). Whole-body plethysmography data (MVb, f, and TVb) was normalized within-subject to percent baseline to control for potential variation from differences in the raw baseline values. Specifically, the raw data for these parameters from individual subjects was grouped into five-minute bins, and these five-minute averages were divided by the average MVb, f, or TVb measured during the Baseline Phase, then multiplied by 100%. Afterwards, the normalized individual averages were used to calculate the normalized average MVb, f, and TVb for each treatment group during each five-minute bin. The normalized group averages underwent two-way analysis of variance (ANOVA) with time as the within-subjects factor and treatment as the between-subjects factor, followed by Holm–Šídák post hoc for multiple comparisons as needed.
Acute biodistribution data were analyzed using two-way ANOVA and, if significant differences were detected between the analytes, Šídák’s post hoc for multiple comparisons was performed (Supplementary Materials). Unpaired 2-tailed T-tests were used to compare AUC tissue–blood ratios.
Significance was defined as p < 0.05 for all the statistical tests.
3. Results
3.1. Dose Response of Fentanyl- and Morphine-Induced Respiratory Depression
In order to identify the doses of fentanyl and morphine that produced comparable respiratory depressant effects for use in biodistribution studies, the dose response of fentanyl- and morphine-induced respiratory depression was evaluated using whole-body plethysmography as described in Section 2.4. The two-way repeated-measures ANOVA revealed significant effects of dose and time (p < 0.0001) on MVb, f, and TVb in the drug-naïve mice treated with a range of acute fentanyl (0–1.0 mg/kg sc) and morphine (0–30 mg/kg sc) doses. For the sake of brevity, average MVb (Figures S2 and S5), f (Figures S3 and S6), and TVb (Figures S4 and S7) over time (organized in 5 min bins) are displayed in Supplementary Materials.
As illustrated in the Supplemental Figures referenced above, 0.3 mg/kg fentanyl and 30 mg/kg morphine (doses with a 100-fold difference in concentration) induced similar significant respiratory depression compared to the vehicle control. The direct comparison of MVb (Figure S8), f (Figure S9), and TVb (Figure S10) at these two doses further emphasized their similarities of effect, barring moderate (though statistically significant) differences in MVb at 25 and 45–55 min (Figure S8) and TVb at 45–90 min (Figure S10). Based on the above findings, as well as the established 50–100-fold difference in potency between these opioids [17], these doses were selected for acute biodistribution comparison studies.
3.2. Comparison of Fentanyl, Morphine, and Metabolite Biodistribution over Time after Acute Injection
The acute biodistribution of fentanyl, morphine, and select metabolites (norfentanyl, 4-ANPP, and morphine-3-β-D-glucuronide) was quantified and compared in the mice. Following the sc injection with vehicle control (saline), 0.3 mg/kg fentanyl, or 30 mg/kg morphine (doses demonstrated to induce equivalent levels of respiratory depression), the mice were sacrificed at 5 min, 15 min, 60 min, or 240 min after administration and tissues harvested for bioanalytical analysis as described in Section 2.5. Since it was confirmed that the tissues from the control mice did not contain detectable levels of any of the target analytes, all the data shown were obtained from the samples collected from fentanyl- or morphine-treated mice. As anticipated [57,58,59], morphine-6-β-D-glucuronide was not detected at appreciable concentrations in the morphine-treated mice, which strengthened confidence in the data obtained with the analytical protocol.
Analyte tmax (time at which maximal concentration was observed) and Cmax (maximal concentration observed) for each tissue are summarized in Table 2. Although fentanyl and morphine had the same tmax in the whole blood (15 min), liver (15 min), lung (15 min), small intestine (60 min), stomach (60 mix), and fat (60 min), tmax for the two drugs differed in the brain (fentanyl tmax = 15 min, morphine tmax = 60 min), heart (fentanyl tmax = 15 min, morphine tmax = 5 min), kidney (fentanyl tmax = 15 min, morphine tmax = 60 min), spleen (fentanyl tmax = 60 min, morphine tmax = 15 min), large intestine (fentanyl tmax = 60 min, morphine tmax = 240 min), muscle (fentanyl tmax = 15 min, morphine tmax = 60 min), and skin (fentanyl tmax = 60 min, morphine tmax = 5 min). This indicates that although the time course for the two opioids was similar in certain tissues, the maximal concentrations of fentanyl and morphine were sometimes reached at different rates depending on the body region.
Table 2.
Observed tmax and Cmax of acute fentanyl and morphine in blood and 12 tissues.
In the fentanyl-treated mice, the ranking of fentanyl Cmax from least to greatest concentration was liver < muscle < whole blood < large intestine < small intestine < skin < stomach < brain < fat < heart < spleen < lung < kidney. In the morphine-treated mice, however, the ranking of morphine Cmax from least to greatest concentration was heart < liver < brain < fat < muscle < small intestine < whole blood < stomach < large intestine < spleen < lung < kidney < skin. This implies that the pattern of fentanyl distribution among the different tissue types was somewhat distinct from morphine distribution among those tissues.
Another aspect of biodistribution in which the two opioids differed was their relative time course and pattern of tissue distribution compared to their respective metabolites. Specifically, fentanyl tmax was the same as norfentanyl tmax in the spleen (60 min), stomach (60 min), and fat (60 min) and the same as 4-ANPP tmax in the heart (15 min). Meanwhile, morphine tmax was the same as morphine-3-β-D glucuronide tmax in the brain (60 min), kidney (60 min), stomach (60 min), muscle (60 min), and fat (60 min). Conversely, fentanyl tmax differed from norfentanyl tmax in the whole blood (15 min vs. 60 min), brain (15 min vs. 5 min), liver (15 min vs. 60 min), lung (15 min vs. 60 min), heart (15 min vs. 240 min), kidney (15 min vs. 60 min), large intestine (60 min vs. 240 min), and muscle (15 min vs. 60 min), while fentanyl tmax differed from 4-ANPP tmax in the whole blood (15 min vs. 5 min), brain (15 min vs. 60 min), liver (15 min vs. 60 min), and kidney (15 min vs. 240 min), and morphine tmax differed from morphine-3-β-D glucuronide tmax in the whole blood (15 min vs. 60 min), liver (15 min vs. 60 min), lung (15 min vs. 60 min), heart (5 min vs. 60 min), spleen (15 min vs. 60 min), small intestine (60 min vs. 15 min), and skin (5 min vs. 60 min). However, there were also certain similarities in the time at which parent compound concentration peaked vs. metabolite (i.e., fentanyl tmax and morphine tmax in the lung were both 15 min, while tmax for their metabolites, norfentanyl and morphine-3-β-D-glucuronide, was 60 min). Both opioids demonstrated greater Cmax than their metabolites in the brain, lung, spleen, stomach, and fat, but metabolite Cmax (norfentanyl and morphine-3-β-D-glucuronide) was greater than that of fentanyl and morphine in the liver. In contrast to morphine, fentanyl Cmax was greater than that of at least one of its metabolites in the whole blood, heart, kidney, and small intestine. 4-ANPP was not detected in the spleen, small intestine, large intestine, stomach, muscle, or fat, and neither norfentanyl nor 4-ANPP was detected in the skin. Morphine-3-β-D-glucuronide was not detected in the large intestine. In brief, while there were similarities in fentanyl and morphine metabolism in some of the tissues studied, they were not identical across all the matrices.
However, it is worth noting that there was a 100-fold difference in dose between fentanyl and morphine, and that limiting comparisons to single time points or concentrations (tmax and Cmax) could only provide an incomplete assessment of the two opioids’ biodistribution. Therefore, to compare the biodistribution of fentanyl and morphine at the four time points, the drug tissue–blood concentration ratios, displayed in Table 3, were calculated from the average drug concentrations found in each tissue type at each time point.
Table 3.
Acute fentanyl and morphine tissue–blood concentration ratios ± SD in 12 tissue types.
The fentanyl tissue–blood concentration ratios were strikingly greater compared to morphine in several tissues, including the brain (~32.3-fold difference at 5 min, ~41.7-fold difference at 15 min, ~9.2-fold difference at 60 min), liver (~5.1-fold difference at 5 min, ~5.4-fold difference at 15 min), lung (~3.8-fold difference at 5 and 15 min, ~4.95-fold difference at 60 min), heart (~47-fold difference at 5 min, ~93.9-fold difference at 15 min, ~84.5-fold difference at 60 min), and fat (~7.5-fold difference at 5 min, ~12.4-fold difference at 15 min, ~22.2-fold difference at 60 min, ~7.2-fold difference at 240 min). However, the tissue–blood concentration ratios were similar at most time points in the kidney, spleen (except at 60 min, when the tissue–blood concentration ratio for fentanyl was ~3.8-fold greater than for morphine), stomach, small intestine, large intestine (except at 240 min, when the tissue–blood concentration ratio for morphine was ~26.8-fold greater than that for fentanyl), and skin (except at 5 min, when the tissue–blood concentration ratio for morphine was ~2.9-fold greater than that for fentanyl). Although the fentanyl tissue–blood concentration ratio for muscle was ~10.3-fold greater than the morphine tissue–blood concentration ratio at 15 min, comparisons should be made with caution due to the lack of morphine data from the muscle samples collected at 5 and 240 min. By 240 min, the magnitude of these differences in the tissue–blood concentration ratio had noticeably decreased (i.e., the fentanyl tissue–blood concentration ratio at this time point was only ~2-fold greater than morphine in the lung and ~3.5-fold greater in the heart), while morphine tissue–blood concentration ratio in the brain (~1.5-fold difference) and the liver (~2.6-fold difference) was slightly greater than that for fentanyl at 240 min. However, while the difference in the tissue–blood concentration ratio between fentanyl and morphine in fat had also been reduced by 240 min, the fentanyl tissue–blood concentration ratio was still ~7.2-fold greater at this time point.
The above data demonstrate that fentanyl moved out of the blood and accumulated into various tissues to a greater extent than morphine. These differences tended to be most prominent early after administration, with the exception of fat, in which the difference between the fentanyl and morphine tissue–blood concentration ratios was greatest at 60 min.
As another means of biodistribution comparison, the noncompartmental calculations of drug concentration over the total acute time course studied, namely, the AUC (area under the curve) values, were determined (see Tables S21 and S22 in Supplementary Materials for the original AUC values [individual subjects and treatment group averages] for fentanyl and morphine, respectively), and the ratio of drug AUC in tissue–AUC in blood was calculated for each tissue type to account for the 100-fold dose difference. The detailed breakdowns of these tissue–blood AUC ratios for individual subjects (Table 4), as well as group averages (Table 5), are provided below, while the statistical comparisons of fentanyl vs. morphine tissue–blood AUC ratios are summarized in Table 6.
Table 4.
Acute fentanyl and morphine tissue–blood AUC (by Subject) in 12 tissues.
Table 5.
Acute average fentanyl and morphine tissue–blood AUC ± SD in 12 tissues.
Table 6.
Comparison of acute fentanyl and morphine tissue–blood AUC in 12 tissue types.
As shown in Table 6 above, the ratio of fentanyl AUC in tissue to fentanyl AUC in blood was significantly greater than the tissue–blood AUC ratio for morphine in the brain, liver, lung, heart, kidney, spleen, small intestine, stomach, and fat, while there was no significant difference in fentanyl tissue AUC–blood AUC vs. morphine tissue AUC–blood AUC in the large intestine, muscle, or skin. The data, therefore, indicate that within a 240 min time period after injection, fentanyl accumulation in tissue relative to blood was greater in several body regions compared to morphine.
These findings for AUC tissue–AUC blood comparisons align with the previously mentioned differences observed between the fentanyl and morphine tissue–blood concentration ratios in the brain, liver, lung, heart, and fat (see Table 3), while revealing additional differences between the fentanyl and morphine distribution in the kidney, spleen, stomach, and small intestine not detected in the initial approaches to evaluating the results.
4. Discussion
4.1. Fentanyl and Morphine Dose Response in Respiratory Depression
Previous findings on the dose response of fentanyl- or morphine-induced respiratory depression in mice lend credibility to the whole-body plethysmography fentanyl and morphine dose–response pilot data, as well as the fentanyl and morphine doses chosen for the biodistribution comparison. Thus, the literature strengthens the claim that the acute biodistribution data presented here are applicable to fentanyl and morphine tissue distribution in the murine models of opioid-induced respiratory depression.
For example, in a recent study using the same mouse strain and sex (male Swiss Webster) and route of administration (sc) as the respiratory depression pilot described in Section 2.4 and Section 3.1, the doses of 0.1 mg/kg fentanyl or higher (up to 10 mg/kg) significantly decreased MVb starting 5 min after administration in a dose-dependent manner [28]. Maximal respiratory depression tended to occur between 10 and 15 min after injection, and 0.3 mg/kg fentanyl was the lowest dose that consistently induced respiratory depression 20 min after injection and sustained respiratory depression for at least 30 min [28]. Similarly, in the present study, the fentanyl doses that induced significant respiratory depression did so within 5 min (0.1, 0.3, and 1 mg/kg). Pilot data, likewise, revealed maximal respiratory depression at 10 min after injection with 0.1, 0.3, or 1 mg/kg fentanyl, with 0.3 mg/kg being the lowest dose that sustained respiratory depression for over 30 min.
Previous research also justifies the use of 30 mg/kg morphine for studying the biodistribution of these opioids at doses relevant to respiratory depression. For example, 1–32 mg/kg morphine sc induced dose-dependent respiratory depression in male Swiss Webster mice, although cumulative dosing was used rather than single acute injections [29], while male CD-1 mice given 3–30 mg/kg morphine ip displayed dose-dependent respiratory depression that was detected at 5 min and persisted for 30 min [60]. These findings corroborate the current morphine pilot, in which dose-dependent MVb and f depression occurred over a similar dose range (1–30 mg/kg sc), with depressant effects observed at 5 min and lasting for over 30 min at the highest tested doses (10 and 30 mg/kg).
Overall, the dose response of fentanyl- and morphine-induced respiratory depression observed in pilot studies seems to align with the established literature, thus supporting the use of 0.3 mg/kg fentanyl and 30 mg/kg morphine in biodistribution comparison studies.
4.2. Quantification of Fentanyl, Morphine, and Select Metabolites
Though the bioanalytical method described above is not the first to compare fentanyl and morphine, it presents a relative degree of novelty by quantifying these opioids and select metabolites (norfentanyl, 4-ANPP, and morphine-3-β-D glucuronide) in thirteen matrices in the mouse: the whole blood, brain, liver, lung, heart, kidney, spleen, small intestine, large intestine, stomach, muscle, fat, and skin. In contrast, other analytical methods may be intended to compare fentanyl and morphine in human samples rather than preclinical models [61,62,63,64] or tailored to murine samples that only contain one of these two opioids, such as morphine [65] or morphine plus its glucuronides [31,66,67], often with limited sample types. For example, a UPLC-MS/MS method for quantifying morphine, morphine-3-β-D-glucuronide, and morphine-6-β-D-glucuronide in mouse plasma, brain, spleen, kidney, small intestine, and liver did not include fentanyl, nor were all of the tissues processed in the present experiments analyzed [31]. One liquid chromatography–atmospheric pressure ion spray-mass spectrometry technique only measured morphine and its glucuronides in serum [67], while an examination of morphine and its metabolites in mice through LC-MS/MS was limited to the blood, brain, and lumbar spinal cord [66]. Furthermore, solid-phase extraction, which is included in the current analytical method, presents certain advantages compared to liquid–liquid extractions (i.e., a UPLC–MS/MS method for comparing morphine and fentanyl in human blood [63]) due to smaller sample volumes and the production of less solvent waste [62]. However, this method has its flaws. Compared to techniques like dried blood spot analysis, which can be run with only 15 μL of blood [61], the solid-phase extraction protocol required larger aliquots (100 μL) of homogenate for a successful analysis.
4.3. Biodistribution of Fentanyl and Morphine after Acute Administration
Some differences in the fentanyl and morphine tissue–blood concentration ratios appear consistent with the prior literature. For example, the fentanyl tissue–blood concentration ratios (see Table 3) in the brain at 5 and 15 min were ~32.3-fold and ~41.7-fold higher than those for morphine, which reflects fentanyl’s rapid central nervous system uptake compared to other abused opioids like heroin [14]. Furthermore, noticeably higher fentanyl tissue–blood concentration ratios in fat at 60 and 240 min are consistent with fentanyl’s greater lipophilicity relative to morphine [7], while the gradual accumulation of fentanyl in fat has also been observed in other rodent models of fentanyl biodistribution [53,68]. Moderately greater fentanyl tissue–blood concentration ratios compared to morphine in the liver at 5 and 15 min could be indicative of fentanyl’s rapid metabolism [69], though the observed time course in this organ was similar for both opioids.
That being said, the current data, including the tissue–blood concentration ratios and tissue AUC–blood AUC ratios (see Table 3, Table 4, Table 5 and Table 6), enhance the knowledge of fentanyl and morphine biodistribution by providing comparisons of relative fentanyl and morphine disposition throughout the body. For example, fentanyl AUC tissue–blood ratios encompassing distribution over 240 min were significantly greater than morphine ratios in the brain, liver, lung, heart, kidney, spleen, small intestine, stomach, and fat. This implies greater fentanyl accumulation into these tissues out of the blood compared to morphine, which suggests potential for deleterious fentanyl effects not only in organs directly involved in respiration, such as the lungs, but also on cardiac function, the removal of metabolic waste/blood filtration (the kidney and spleen), and gastrointestinal activity (the stomach and small intestine). For example, though the fentanyl dose studied (0.3 mg/kg) was well below the lethal range in mice [70,71], evidence from other laboratories points to the injurious cardiac effects of high fentanyl doses. Upon receiving an LD10 fentanyl dose (110 mg/kg sc), SKH1 mice displayed reduced cardiac glucose uptake 40 min and 6 h later, which illustrates fentanyl’s potential to modify normal cardiac function [71]. Moreover, the myocardium expresses α1A and α1B adrenergic receptors [72], for which fentanyl, but not morphine, has been shown to have an affinity [73], highlighting a potential way in which the greater fentanyl AUC tissue–blood ratio and tissue–blood concentration ratios observed in the heart could translate to ramifications for the cardiac health effects of fentanyl vs. morphine. Meanwhile, fentanyl accumulation in fat, implied by increasing tissue–blood concentration ratios over time and higher AUC tissue–blood ratios compared to morphine, points to sequestration in adipose tissue after administration. This could entail the release of fentanyl from fat in the hours after initial use. However, since fentanyl concentration in fat was already starting to decline at 240 min, such storage would not likely persist long-term. Gradual release from fat would also pose less of an immediate health risk than the predominately centrally mediated respiratory depression that can occur within minutes after fentanyl use [2].
Despite striking differences between acute fentanyl and morphine biodistribution, these disparities were not universal. No significant differences were observed between the AUC tissue–blood ratios for the large intestine or skin, which may suggest similarities in the effects on gastrointestinal function. In addition, while the tissue–blood concentration ratios for fentanyl in the liver, lung, heart, and kidney at 5 and 15 min appear higher than those for morphine, indicating more rapid sequestration into these tissues out of the blood, the tissue–blood concentration ratios also demonstrated both fentanyl and morphine accumulation in tissue over the 240 min period, with the concentrations in the spleen, small intestine, large intestine, and stomach steadily increasing relative to the concentration in the blood. Fentanyl and morphine also exhibited the same tmax in blood, liver, lung, small intestine, stomach, and fat, showing similar time courses even with their differences in distribution.
In brief, the acute fentanyl and morphine biodistribution differed in both the central nervous system and the periphery. As a whole, the aim to compare the acute fentanyl and morphine biodistribution in diverse murine tissues was accomplished. The data support the hypothesis that fentanyl would demonstrate more rapid uptake in central tissues and greater accumulation in adipose tissue compared to morphine.
4.4. Acute Biodistribution of Fentanyl in Rodent Models
Although several fentanyl biodistribution studies have been conducted in rats, the present findings augment such work by providing information on both fentanyl and morphine disposition in mice, another common model for studying opioid abuse. This contributes to the mouse literature on fentanyl distribution while enabling comparison with morphine, a traditional opiate. For example, male Charles River F344 rats sacrificed after 6 h of 0.15–0.30 μg/min·kg fentanyl iv displayed higher fentanyl concentrations in fat compared to the kidney, liver, and muscle [50]. The tissue–blood fentanyl concentration ratio in fat in the present study also exceeded that in the kidney, liver, and muscle at the last time point studied (240 min), though the average tissue–blood fentanyl ratio in the kidney also appeared higher than in the liver and muscle (Table 3). Meanwhile, the morphine tissue–blood concentration ratio at 240 min was greatest in the kidney, followed by fat and the liver, and was not detected in muscle (Table 3). This highlights fentanyl’s observed tendency to accumulate in fat to a greater extent than morphine, though both opioids were continuing to undergo processing in the kidney at the last time point included.
In another study, male F1 hybrid rats received 13 μg/kg/h fentanyl iv for 6 h, after which the brain, heart, lungs, stomach, small intestine, large intestine, liver, pancreas, spleen, kidneys, testes, muscle, and fat were harvested, and steady-state tissue/blood partition coefficients were determined [51]. High fentanyl tissue/blood partition coefficients were observed in fat and the spleen compared to the other tissues, while partition coefficients for the lung, stomach, and kidneys were higher than in the brain, heart, small and large intestines, liver, and muscle. Meanwhile, in the present study, the tissue–blood fentanyl concentration ratio in the spleen at 240 min was noticeably less than in fat (see Table 3). Although the tissue–blood fentanyl concentration ratio in mouse lung was similar to the heart, intestine, etc. at 240 min, the tissue–blood concentration ratios for the stomach and kidney tended to be higher than in the brain, heart, muscle, liver, etc. (see Table 3). In contrast, the morphine tissue–blood concentration ratios at 240 min were highest for the large intestine, stomach, and kidney, and lower for the small intestine, spleen, brain, lung, heart, fat, and liver (see Table 3). The fentanyl tissue–blood ratio in fat at 240 min was noticeably higher than morphine, suggesting greater sequestration. Interestingly, the morphine tissue–blood ratio in the large intestine was greater than fentanyl at 240 min, pointing to differences in excretion at this time point. (see Table 3).
In male Sprague Dawley rats receiving a 5.25 μg/kg/min iv fentanyl infusion for 5 min, drug concentration in the plasma, brain, and lung peaked at ~5 min [74]. Meanwhile, fentanyl reached Cmax at 15 min in the whole blood, brain, and lung in the present study, though fentanyl concentration in the blood at 5 and 15 min was almost identical. This may point to a need to assess additional time points between 5 and 15 min to better determine the time of peak fentanyl concentration, though differing administration routes should also be taken into account. Meanwhile, morphine Cmax was observed at 15 min in blood and lung but at 60 min in brain, emphasizing that fentanyl and morphine distribution time course differs in certain central areas but displays similarities in other tissues.
In a fentanyl time course study, male Sprague Dawley rats received 50 μg/kg (tritium-labeled) iv followed by sacrifice at 1.5, 5, 15, 30, 60, 120, or 240 min, a similar range to the current study [68]. Fentanyl uptake in the lung, heart, and brain achieved maximal concentration at or before 1.5 min, with elimination following a similar time course to plasma [68]. Fentanyl uptake into and elimination from fat and muscle occurred at a slower rate than in the aforementioned tissues, and concentration was greater in muscle (2–4×) and fat (30×) compared to plasma [68]. However, the fentanyl concentration peaked at 15 min in the lung, heart, and brain in the current study, while the morphine concentration peaked at 15 min in the lung but 5 min in the heart and 60 min in the brain, indicating a more diverse time course among these tissues contrasting with the fentanyl results. However, the broad pattern of fentanyl distribution in the whole blood, brain, heart, and lung in the current cohort (Cmax observed at 15 min, followed by a decline at 60 and 240 min) is similar across tissue types (see Table 2 and Figures S11, S12, S14 and S15). Meanwhile, the morphine distribution exhibited Cmax at 15 min, followed by a sharp decline at 60 and 240 min in the whole blood and lung, while the heart morphine Cmax was observed at 5 min and declined after, and the brain morphine concentration gradually increased to Cmax at 60 min before tapering off, thus illustrating a disparity in the cardiac and whole brain morphine accumulation compared to fentanyl (see Table 2 and Figures S11, S12, S14 and S15). While fentanyl Cmax in muscle (15 min) was the same as in the brain, lung, and heart, and fentanyl muscle concentration in the current study was generally lower than in whole blood, slower fentanyl accumulation was observed in fat than in the brain, liver, heart, and kidney, as well as markedly higher fentanyl concentrations in fat than blood at 60 and 240 min. On the other hand, morphine Cmax in muscle in the present study was the same as in the brain but later than in the heart and lung, while the morphine concentrations in muscle (when detected) were lower than in blood. The morphine accumulation time course in fat (Cmax of 60 min) was similar to the brain and kidney but slower than the heart and liver, with lower morphine fat concentrations than blood at 60 min but higher morphine concentrations in fat than blood at 240 min. This underscores morphine’s lesser tendency to accumulate in fat due to being more hydrophilic than fentanyl.
The autoradiography studies of fentanyl biodistribution in rats also share certain commonalities, though the present data provide a broader perspective by comparing fentanyl and morphine disposition in mice. For example, in female Wistar rats injected with 3H-phenethyl-fentayl iv, 5.96 μg/100 g body weight or 14C-anilino-fentanyl iv, 6 μg/100 g body weight, fentanyl was most prominent in the central nervous system, heart, and lungs immediately after infusion [52]. After 10 min, fentanyl had redistributed to the kidney, stomach, and liver, though its presence in these organs and redistribution to the small intestine and skeletal muscle was more pronounced at 30 min. By 90 min, fentanyl was found in the small intestine and kidney, and, at 270 min, was primarily found in the large intestine/colon, though trace amounts remained in the stomach and kidney [52]. In the current study, fentanyl reached Cmax at 15 min in the whole blood, brain, liver, lung, heart, kidney, and muscle and at 60 min in the spleen, small and large intestine, stomach, fat, and skin, thus showing a similar pattern of initial high brain, lung, and heart concentrations followed by distribution to the stomach and the intestines at later time points. However, fentanyl reached Cmax in the liver and kidney sooner after injection (15 min) than 3H-phenethyl- or 14C-anilino-fentanyl, as did the observed Cmax in muscle (15 min). Meanwhile, the morphine concentration in the current study peaked at 5 min in the heart and skin; 15 min in the whole blood, liver, lung, and spleen; 60 min in the brain, muscle, kidney, small intestine, stomach, and fat; and 240 min in the large intestine. Initial high morphine concentrations in the lung and later distribution to the stomach and small intestine are similar to fentanyl time course, although the time to peak concentration in other organs like the kidney and large intestine appeared delayed compared to fentanyl. Meanwhile, in a whole-body radiography study comparing fentanyl and dihydromorphine (a semisynthetic opioid derived from morphine) distribution in male and female mice, fentanyl was present in larger quantities in the central nervous system and intestinal contents [30]. The large intestine fentanyl tissue–blood AUC ratios in the current study did not significantly differ from morphine, but the fentanyl tissue–blood AUC ratios in the small intestine and brain were significantly higher compared to morphine (Table 4).
The protocol used in the present experiments offers a few advantages over the rat literature. First, it enabled a thorough assessment of acute fentanyl biodistribution in mice, another widely used preclinical model in opioid research. Second, unlike the techniques from these prior experiments, the analytical method quantified morphine alongside fentanyl. Distribution studies in rats often featured iv fentanyl administration over a protracted time period, which more closely resembles administration during anesthesia [3]. In contrast, the sc route in the present experiments was more in keeping with respiratory depression studies [28,29] and may share similarities with intranasal administration, one route of recreational or pathological fentanyl use [54], which increases the current study’s relevance. Unlike autoradiography [52], the analytical method does not require radiolabeled compounds; fentanyl, morphine, and metabolites are reliably detected via mass spectrometry. However, comparisons between the current and previous studies must be conservative due to differences in species, dose, the route of administration, and time course.
4.5. Acute Biodistribution of Morphine in Rodent Models
Previous studies also lend support to the findings on morphine biodistribution, although, once again, the current data contribute additional insights due to the quantification of fentanyl alongside morphine following acute administration. In male Swiss Webster mice given 10 mg/kg morphine sc and sacrificed 60 min later, the highest morphine concentrations were observed in the kidney, followed by the lung and spleen, liver, serum, and brain [37]. Another study in which male Swiss Webster mice were sacrificed 60 min after receiving 10 mg/kg morphine sc reported similar relative morphine concentrations, with the greatest amounts in the kidney, approximately equal concentrations in the lung and spleen, and the lowest concentrations in the liver [36]. Since a 3-fold higher dose was used in the present study, the samples from these tissues contained higher absolute morphine concentrations 60 min after injection. However, examining the morphine tissue–blood concentration ratios among this subset of tissues, morphine accumulation was also observed to be highest in the kidney and lowest in the liver at 60 min, though morphine tissue–blood concentration ratio was higher in the spleen than in the lung (highest to lowest tissue–blood concentration ratio: kidney > spleen > lung > brain > liver) (see Table 3). In comparison, the fentanyl tissue–blood concentration ratios at 60 min, highest to lowest, also ranked kidney > spleen > lung > brain > liver, which suggests similar distribution patterns for fentanyl and morphine in these tissues 60 min after administration. In addition to using a lower morphine concentration than the current study, the researchers quantified morphine by radioimmunoassay rather than LC-MS/MS, which could account for these discrepancies [36,37].
In male C57BL/6 mice administered 15 mg/kg morphine i.p., morphine concentration steadily declined in plasma up to 60 min after injection and in the liver from 10 to 60 min post-injection [45]. In the current study, the morphine concentration peaked in the whole blood and liver at 15 min, as did fentanyl (see Table 2). In another study, C57BL6/J mice received 1.45 mg/kg morphine i.p. and were sacrificed 30 min later [44]. Morphine concentration in the kidney appeared higher than in the liver and plasma. At the nearest time point in the present study, 15 min, similarly heightened tissue–blood morphine concentration ratios in the kidney compared to the liver were observed, despite the sizable difference in dose (see Table 3). The tissue–blood fentanyl concentration ratio in the kidney was also noticeably higher than in the liver at 15 min (see Table 3). This indicates that for both fentanyl and morphine, the parent compound was exiting the blood for distribution into tissues, undergoing metabolism in the liver (hence the relatively low concentration of parent compounds), and undergoing appreciable filtration through the kidneys 15 min after administration.
In wild-type FVB/NRj mice given 90 μmol/kg morphine by oral gavage and sacrificed 120 min later, the relative morphine concentrations, greatest to least, were kidney > small intestine > spleen > liver > brain [31]. Though this exact time point was not included in the current study, the relative morphine concentrations in these tissues at 240 min, greatest to least, were kidney > small intestine > spleen > brain > liver (see Figures S12, S13 and S16–S18). The observed morphine distribution in this subset of tissues was, thus, similar to previous findings. Meanwhile, the relative fentanyl concentrations in these tissues at 240 min, greatest to least, were kidney > spleen > small intestine > brain > liver. Thus, the patterns of fentanyl and morphine distribution within these tissues appear similar at this time point.
The current acute biodistribution studies build upon the prior literature by comparing morphine and fentanyl disposition, and doing so in a wider range of murine tissue matrices (13 in total) than those analyzed by certain previous groups. As stated in Section 4.4, the LC-MS/MS method is advantageous compared to techniques such as radioimmunoassay [36] since it does not require radioactive isotopes to quantify target analytes.
4.6. Clinical Context
The above studies have contributed a novel bioanalytical method for quantifying fentanyl and morphine in several murine tissues that was used to generate a detailed profile of acute fentanyl and morphine biodistribution in a preclinical mouse model. While drug elimination occurs more quickly in rodents than in higher-order species [68], and the lethal dose of fentanyl has been observed to be higher in mice [70,71] than in humans [75], fentanyl demonstrates dramatically greater potency relative to morphine in both species [17,29]. Thus, mice remain a valuable model for examining mechanisms that contribute to fentanyl’s heightened potency and toxicity. For example, as mentioned in Section 4.3, the AUC fentanyl tissue–blood ratio in the heart was significantly greater than morphine. Considering the impact of a fentanyl LD10 on cardiac glucose uptake in other mouse models [71] and the fact that fentanyl could have nonspecific effects on the heart, i.e., via α1A and α1B receptors in the myocardium [72,73], such data point to potential concerns about the cardiovascular ramifications of fentanyl abuse. The present acute biodistribution studies also highlighted a greater AUC fentanyl tissue–blood ratio in the lung compared to morphine. Depending on the route of administration, a limited number of case studies indicate a risk of diffuse alveolar hemorrhage [76] or pulmonary alveolar proteinosis [77] after fentanyl use, emphasizing potential noxious pulmonary effects. By adding to the current body of knowledge of fentanyl disposition in mice at doses known to cause respiratory depression, as well as elucidating the similarities and differences in fentanyl disposition compared to traditional opiates such as morphine, this research has played a role in investigating the unique properties of fentanyl, a compound that is central to the ongoing public health threat posed by the opioid crisis.
5. Conclusions
In summary, a novel bioanalytical protocol for quantifying fentanyl, morphine, and select metabolites in 13 matrices (whole blood, brain, lung, heart, kidney, spleen, small intestine, large intestine, stomach, muscle, fat, and skin) was used to analyze the acute biodistribution of fentanyl (0.3 mg/kg sc) and morphine (30 mg/kg sc) in male Swiss Webster mice at doses producing comparable respiratory depression. Based on the tissue–blood AUC ratios, fentanyl accumulation out of blood into tissue significantly exceeded that of morphine in the brain, liver, lung, heart, kidney, spleen, small intestine, stomach, and fat. However, no differences in the AUC tissue–blood ratios were observed in the large intestine or skin. The data, thus, underscore the potential for deleterious fentanyl effects relative to classical opioids in several organs, including both those involved and not directly involved in respiratory depression. Drug distribution time course between the two opioids varied by tissue, i.e., peak morphine concentration accumulated later than fentanyl in the brain but at the same time as fentanyl in the lung, stomach, and small intestine. Though the rapidity of fentanyl distribution depended on tissue type, and fentanyl and morphine biodistribution appeared similar in certain organs, the results support the hypothesis that the more lipophilic opioid, fentanyl, would accumulate to a greater extent in fat. However, the fentanyl fat concentration had already declined by 240 min, which raises the possibility of fentanyl being released from adipose tissue at later time points after administration, though such re-exposure would not necessarily be lethal.
Future directions could include the replications of the above experiments in females to investigate sex differences. Additional doses and time points could also be incorporated to elucidate the potential dose–response of fentanyl and morphine tissue distribution and to aid in more accurately calculating parameters such as drug clearance.
Supplementary Materials
The following supporting information can be downloaded at: https://www.mdpi.com/article/10.3390/psychoactives3040027/s1. The following supporting information is included with the article: Figure S1: Diagram of three-phase whole-body plethysmography protocol; Figure S2: Fentanyl demonstrates dose–response effects in induction of respiratory depression (specifically, MVb) in mice, with sustained respiratory depression at 0.3 mg/kg and higher; Figure S3: Fentanyl demonstrates dose–response effects in induction of respiratory depression (specifically, f) in mice, with sustained respiratory depression at 0.3 mg/kg and higher; Figure S4: Fentanyl demonstrates dose–response effects in induction of respiratory depression (Specifically, TVb) in mice, with sustained respiratory depression at 0.3 mg/kg and higher; Figure S5: Morphine demonstrates dose–response effects in induction of respiratory depression (specifically, MVb) in mice, with sustained respiratory depression at 30 mg/kg; Figure S6: Morphine demonstrates dose–response effects in induction of respiratory depression (specifically, f) in mice, with sustained respiratory depression at 30 mg/kg; Figure S7: Morphine demonstrates dose–response effects in induction of respiratory depression (specifically, TVb) in mice, with sustained respiratory depression at 30 mg/kg; Figure S8: Comparison of respiratory depressant effects (specifically, MVb) of 0.3 mg/kg fentanyl sc and 30 mg/kg morphine sc in mice; Figure S9: Comparison of respiratory depressant effects (specifically, f) of 0.3 mg/kg fentanyl sc and 30 mg/kg morphine sc in mice; Figure S10: Comparison of respiratory depressant effects (Specifically, TVb) of 0.3 mg/kg fentanyl sc and 30 mg/kg morphine sc in mice; Figure S11: Concentration of fentanyl, morphine, and select metabolites in whole blood from 5 to 240 min in mice; Figure S12: Concentration of fentanyl, morphine, and select metabolites in whole brain from 5 to 240 min in mice; Figure S13: Concentration of fentanyl, morphine, and select metabolites in liver from 5 to 240 min in mice; Figure S14: Concentration of fentanyl, morphine, and select metabolites in lung from 5 to 240 min in mice; Figure S15: Concentration of fentanyl, morphine, and select metabolites in heart from 5 to 240 min in mice; Figure S16: Concentration of fentanyl, morphine, and select metabolites in kidney from 5 to 240 min in mice; Figure S17: Concentration of fentanyl, morphine, and select metabolites in spleen from 5 to 240 min in mice; Figure S18: Concentration of fentanyl, morphine, and select metabolites in small intestine from 5 to 240 min in mice; S19: Concentration of fentanyl, morphine, and select metabolites in large intestine from 5 to 240 min in mice; Figure S20: Concentration of fentanyl, morphine, and select metabolites in stomach from 5 to 240 min in mice; Figure S21: Concentration of fentanyl, morphine, and select metabolites in muscle from 5 to 240 min in mice; Figure S22: Concentration of fentanyl, morphine, and select metabolites in fat from 5 to 240 min in mice; Figure S23: Concentration of fentanyl, morphine, and select metabolites in skin from 5 to 240 min in mice; Table S1: Parent ion (Q1) and Product ion (Q3) mass–charge ratios, MRM transitions, collision energy (CE) and declustering potential (DP) for spectrometric analysis; Table S2: Validation summary table for fentanyl; Table S3: Validation summary table for norfentanyl; Table S4: Validation summary table for 4-ANPP; Table S5: Validation summary table for morphine; Table S6: Validation summary table for morphine-3-β-D-glucuronide; Table S7: Validation summary table for morphine-6-β-D-glucuronide; Table S8: Absolute between-run accuracy (bias); Table S9.1–S9.3: Absolute within-run accuracy (bias) (Runs 1–3); Table S10: Absolute between-run precision; Table S11.1–S11.3: Absolute within-run precision (Runs 1–3); Table S12: Recovery of analytes; Table S13: Recovery of internal standards; Table S14: Matrix effect: standard; Table S15: Matrix effect: internal standard; Table S16: Analyte stability under different storage conditions; Table S17.1–S17.3: Analyte stability over time (24, 48, and 72 h post-preparation); Table S18.1–S18.3: Absolute accuracy (bias) for analyte stability over time (24, 48, and 72 h post-preparation); Table S19.1: Fentanyl quality controls for 13 experimental matrices; Table S19.2: Norfentanyl quality controls for 13 experimental matrices; Table S19.3: 4-ANPP quality controls for 13 experimental matrices; Table S19.4: Morphine quality controls for 13 experimental matrices; Table S19.5: Morphine-3-β-D-glucuronide quality controls for 13 experimental matrices; Table S19.6: Morphine-6-β-D-glucuronide quality controls for 13 experimental matrices; Table S20.1: Fentanyl: absolute accuracy (bias) in 13 matrices; Table S20.2: Norfentanyl: absolute accuracy (bias) in 13 matrices; Table S20.3: 4-ANPP: absolute accuracy (bias) in 13 matrices; Table S20.4: Morphine: absolute accuracy (bias) in 13 matrices; Table S20.5: Morphine-3-β-D-glucuronide: absolute bias (accuracy) in 13 matrices; Table S20.6: Morphine-6-β-D-glucuronide: absolute bias (accuracy) in 13 matrices; Table S21: Fentanyl AUC values (average and by subject) in blood and 12 tissues; Table S22: Morphine AUC values (average and by subject) in blood and 12 tissues.
Author Contributions
Conceptualization, R.G., M.H. and W.D.; methodology, H.J.E., D.M.W., J.P., M.H. and R.G.; software, J.P. and R.G.; validation, J.P. and R.G.; formal analysis, R.G.; investigation, R.G. and J.P.; resources, W.D., M.H., J.P. and D.M.W.; data curation, R.G.; writing—original draft preparation, R.G.; writing—review and editing, M.H., W.D. and R.G.; visualization, R.G. and M.H.; supervision, M.H., W.D. and D.M.W.; project administration, R.G., J.P., M.H. and W.D.; funding acquisition, W.D. All authors have read and agreed to the published version of the manuscript.
Funding
This research was funded by the National Institute on Drug Abuse, grant number DA007027 and grant number P30DA033934-10.
Institutional Review Board Statement
All the experiments were performed in accordance with the National Research Council’s Guide for Care and Use of Laboratory Animals (2011). The animal study protocol was approved by the Institutional Animal Care and Use Committee of Virginia Commonwealth University (protocol code AM10322).
Informed Consent Statement
Not applicable.
Data Availability Statement
The data presented in this study are available upon request from the corresponding author.
Acknowledgments
The authors would like to thank Melissa Morgan, David Stevens, and Minho Kang for their technical assistance.
Conflicts of Interest
The authors declare no conflicts of interest. The funders had no role in the design of the study; in the collection, analyses, or interpretation of data; in the writing of the manuscript; or in the decision to publish the results.
References
- Jannetto, P.J.; Helander, A.; Garg, U.; Janis, G.C.; Goldberger, B.; Ketha, H. The Fentanyl Epidemic and Evolution of Fentanyl Analogs in the United States and the European Union. Clin. Chem. 2019, 65, 242–253. [Google Scholar] [CrossRef] [PubMed]
- Kuczyńska, K.; Grzonkowski, P.; Kacprzak, L.; Zawilska, J.B. Abuse of fentanyl: An emerging problem to face. Forensic Sci. Int. 2018, 289, 207–214. [Google Scholar] [CrossRef] [PubMed]
- Stanley, T.H. The fentanyl story. J. Pain. 2014, 15, 1215–1226. [Google Scholar] [CrossRef]
- Spencer, M.R.; Warner, M.; Cisewski, J.A.; Miniño, A.; Dodds, D.; Perera, J.; Ahmad, F.B. Estimates of Drug Overdose Deaths Involving Fentanyl, Methamphetamine, Cocaine, Heroin, and Oxycodone: United States, 2021; Report No. 27; Centers for Disease Control and Prevention, National Center for Health Statistics: Hyattsville, MD, USA, 2023; pp. 1–14.
- National Institute on Drug Abuse. Drug Overdose Deaths: Facts and Figures. Available online: https://nida.nih.gov/research-topics/trends-statistics/overdose-death-rates#Fig1 (accessed on 14 May 2024).
- Sertürner, F.W.A. Darstellung der reinen Mohnsäure (Opiumsäure) nebst einer Chemischen Untersuchung des Opiums mit vorzüglicher Hinsicht auf einendarin neu entdeckten Stoff und die dahin gehörigen Bemerkungen. J. Pharme Ärzte Apoth. Chem. 1806, 14, 47–93. [Google Scholar]
- Kelly, E.; Sutcliffe, K.; Cavallo, D.; Ramos-Gonzalez, N.; Alhosan, N.; Henderson, G. The anomalous pharmacology of fentanyl. Br. J. Pharmacol. 2023, 180, 797–812. [Google Scholar] [CrossRef]
- Dosen-Micovic, L.; Ivanovic, M.; Micovic, V. Steric interactions and the activity of fentanyl analogs at the mu-opioid receptor. Bioorg. Med. Chem. 2006, 14, 2887–2895. [Google Scholar] [CrossRef]
- Ellis, C.R.; Kruhlak, N.L.; Kim, M.T.; Hawkins, E.G.; Stavitskaya, L. Predicting opioid receptor binding affinity of pharmacologically unclassified designer substances using molecular docking. PLoS ONE 2018, 13, e0197734. [Google Scholar] [CrossRef] [PubMed]
- de Waal, P.W.; Shi, J.; You, E.; Wang, X.; Melcher, K.; Jiang, Y.; Xu, H.E.; Dickson, B.M. Molecular mechanisms of fentanyl mediated beta-arrestin biased signaling. PLoS Comput. Biol. 2020, 16, e1007394. [Google Scholar] [CrossRef]
- Vo, Q.N.; Mahinthichaichan, P.; Shen, J.; Ellis, C.R. How mu-opioid receptor recognizes fentanyl. Nat. Commun. 2021, 12, 984. [Google Scholar] [CrossRef]
- Kapoor, A.; Martinez-Rosell, G.; Provasi, D.; de Fabritiis, G.; Filizola, M. Dynamic and Kinetic Elements of micro-Opioid Receptor Functional Selectivity. Sci. Rep. 2017, 7, 11255. [Google Scholar] [CrossRef]
- Roy, S.D.; Flynn, G.L. Solubility and related physicochemical properties of narcotic analgesics. Pharm. Res. 1988, 5, 580–586. [Google Scholar] [CrossRef] [PubMed]
- Hill, R.; Santhakumar, R.; Dewey, W.; Kelly, E.; Henderson, G. Fentanyl depression of respiration: Comparison with heroin and morphine. Br. J. Pharmacol. 2020, 177, 254–266. [Google Scholar] [CrossRef] [PubMed]
- Sutcliffe, K.J.; Charlton, S.J.; Sessions, R.B.; Henderson, G.; and Kelly, E. Fentanyl binds to the μ-opioid receptor via the lipid membrane and transmembrane helices. bioRxiv 2021. [Google Scholar] [CrossRef]
- Kalvass, J.C.; Olson, E.R.; Cassidy, M.P.; Selley, D.E.; Pollack, G.M. Pharmacokinetics and pharmacodynamics of seven opioids in P-glycoprotein-competent mice: Assessment of unbound brain EC50,u and correlation of in vitro, preclinical, and clinical data. J. Pharmacol. Exp. Ther. 2007, 323, 346–355. [Google Scholar] [CrossRef]
- Centers for Disease Control and Prevention. Fentanyl. Available online: https://www.cdc.gov/overdose-prevention/about/fentanyl.html?CDC_AAref_Val=https://www.cdc.gov/opioids/basics/fentanyl.html (accessed on 13 April 2024).
- Somerville, N.J.; O’Donnell, J.; Gladden, R.M.; Zibbell, J.E.; Green, T.C.; Younkin, M.; Ruiz, S.; Babakhanlou-Chase, H.; Chan, M.; Callis, B.P.; et al. Characteristics of Fentanyl Overdose—Massachusetts, 2014–2016. MMWR. Morb. Mortal. Wkly. Rep. 2017, 66, 382–386. [Google Scholar] [CrossRef]
- Mahonski, S.G.; Leonard, J.B.; Gatz, J.D.; Seung, H.; Haas, E.E.; Kim, H.K. Prepacked naloxone administration for suspected opioid overdose in the era of illicitly manufactured fentanyl: A retrospective study of regional poison center data. Clin. Toxicol. 2020, 58, 117–123. [Google Scholar] [CrossRef]
- Mayer, S.; Boyd, J.; Collins, A.; Kennedy, M.C.; Fairbairn, N.; McNeil, R. Characterizing fentanyl-related overdoses and implications for overdose response: Findings from a rapid ethnographic study in Vancouver, Canada. Drug Alcohol. Depend. 2018, 193, 69–74. [Google Scholar] [CrossRef]
- Moe, J.; Godwin, J.; Purssell, R.; O’Sullivan, F.; Hau, J.P.; Purssell, E.; Curran, J.; Doyle-Waters, M.M.; Brasher, P.M.A.; Buxton, J.A.; et al. Naloxone dosing in the era of ultra-potent opioid overdoses: A systematic review. Can. J. Emerg. Med. 2020, 22, 178–186. [Google Scholar] [CrossRef]
- Sutter, M.E.; Gerona, R.R.; Davis, M.T.; Roche, B.M.; Colby, D.K.; Chenoweth, J.A.; Adams, A.J.; Owen, K.P.; Ford, J.B.; Black, H.B.; et al. Fatal Fentanyl: One Pill Can Kill. Acad. Emerg. Med. 2017, 24, 106–113. [Google Scholar] [CrossRef]
- Grell, F.L.; Koons, R.A.; Denson, J.S. Fentanyl in anesthesia: A report of 500 cases. Anesth. Analg. 1970, 49, 523–532. [Google Scholar] [CrossRef] [PubMed]
- Comstock, M.K.; Carter, J.G.; Moyers, J.R.; Stevens, W.C. Rigidity and hypercarbia associated with high dose fentanyl induction of anesthesia. Anesth. Analg. 1981, 60, 362–363. [Google Scholar] [CrossRef]
- Benthuysen, J.L.; Smith, N.T.; Sanford, T.J.; Head, N.; Dec-Silver, H. Physiology of alfentanil-induced rigidity. Anesthesiology 1986, 64, 440–446. [Google Scholar] [CrossRef]
- Abrams, J.T.; Horrow, J.C.; Bennett, J.A.; Van Riper, D.F.; Storella, R.J. Upper airway closure: A primary source of difficult ventilation with sufentanil induction of anesthesia. Anesth. Analg. 1996, 83, 629–632. [Google Scholar] [CrossRef]
- Bennett, J.A.; Abrams, J.T.; Van Riper, D.F.; Horrow, J.C. Difficult or impossible ventilation after sufentanil-induced anesthesia is caused primarily by vocal cord closure. Anesthesiology 1997, 87, 1070–1074. [Google Scholar] [CrossRef]
- Elder, H.J.; Varshneya, N.B.; Walentiny, D.M.; Beardsley, P.M. Amphetamines modulate fentanyl-depressed respiration in a bidirectional manner. Drug Alcohol. Depend. 2023, 243, 109740. [Google Scholar] [CrossRef]
- Varshneya, N.B.; Hassanien, S.H.; Holt, M.C.; Stevens, D.L.; Layle, N.K.; Bassman, J.R.; Iula, D.M.; Beardsley, P.M. Respiratory depressant effects of fentanyl analogs are opioid receptor-mediated. Biochem. Pharmacol. 2022, 195, 114805. [Google Scholar] [CrossRef]
- Appelgren, L.E.; Terenius, L. Differences in the autoradiographic localization of labelled morphine-like analgesics in the mouse. Acta Physiol. Scand. 1973, 88, 175–182. [Google Scholar] [CrossRef]
- Heydari, P.; Martins, M.L.F.; Rosing, H.; Hillebrand, M.J.X.; Gebretensae, A.; Schinkel, A.H.; Beijnen, J.H. Development and validation of a UPLC-MS/MS method with a broad linear dynamic range for the quantification of morphine, morphine-3-glucuronide and morphine-6-glucuronide in mouse plasma and tissue homogenates. J. Chromatogr. B 2021, 1166, 122403. [Google Scholar] [CrossRef]
- Schinkel, A.H.; Wagenaar, E.; van Deemter, L.; Mol, C.A.; Borst, P. Absence of the mdr1a P-Glycoprotein in mice affects tissue distribution and pharmacokinetics of dexamethasone, digoxin, and cyclosporin A. J. Clin. Investig. 1995, 96, 1698–1705. [Google Scholar] [CrossRef]
- Zelcer, N.; van de Wetering, K.; Hillebrand, M.; Sarton, E.; Kuil, A.; Wielinga, P.R.; Tephly, T.; Dahan, A.; Beijnen, J.H.; Borst, P. Mice lacking multidrug resistance protein 3 show altered morphine pharmacokinetics and morphine-6-glucuronide antinociception. Proc. Natl. Acad. Sci. USA 2005, 102, 7274–7279. [Google Scholar] [CrossRef]
- Ishikawa, K.; Shibanoki, S.; McGaugh, J.L. Direct correlation between level of morphine and its biochemical effect on monoamine systems in mouse brain. Evidence for involvement of dopaminergic neurons in the pharmacological action of acute morphine. Biochem. Pharmacol. 1983, 32, 1473–1478. [Google Scholar] [CrossRef]
- Jin, W.Q.; Xu, H.; Chi, Z.Q. Absorption, distribution and excretion of 3-methyl[carbonyl-14C] fentanyl in mice. Zhongguo Yao Li Xue Bao 1986, 7, 399–401. [Google Scholar]
- Bian, J.T.; Bhargava, H.N. Effect of chronic administration of L-arginine, NG-nitro-L-arginine or their combination on morphine concentration in peripheral tissues and urine of the mouse. Gen. Pharmacol. 1998, 30, 753–757. [Google Scholar] [CrossRef]
- Bhargava, H.N.; Bian, J.T. Effects of acute administration of L-arginine on morphine antinociception and morphine distribution in central and peripheral tissues of mice. Pharmacol. Biochem. Behav. 1998, 61, 29–33. [Google Scholar] [CrossRef]
- Stout, P.R.; Claffey, D.J.; Ruth, J.A. Fentanyl in hair. Chemical factors involved in accumulation and retention of fentanyl in hair after external exposure or in vivo deposition. Drug Metab. Dispos. 1998, 26, 689–700. [Google Scholar]
- Leal, T.; Lebacq, J.; Vanbinst, R.; Lederman, C.; De Kock, M.; Wallemacq, P. Successful protocol of anaesthesia for measuring transepithelial nasal potential difference in spontaneously breathing mice. Lab. Anim. 2006, 40, 43–52. [Google Scholar] [CrossRef]
- Karinen, R.; Andersen, J.M.; Ripel, A.; Hasvold, I.; Hopen, A.B.; Morland, J.; Christophersen, A.S. Determination of heroin and its main metabolites in small sample volumes of whole blood and brain tissue by reversed-phase liquid chromatography-tandem mass spectrometry. J. Anal. Toxicol. 2009, 33, 345–350. [Google Scholar] [CrossRef]
- Yang, Z.; Wang, L.; Xu, M.; Gu, J.; Yu, L.; Zeng, S. Simultaneous analysis of gemfibrozil, morphine, and its two active metabolites in different mouse brain structures using solid-phase extraction with ultra-high performance liquid chromatography and tandem mass spectrometry with a deuterated internal standard. J. Sep. Sci. 2016, 39, 2087–2096. [Google Scholar] [CrossRef]
- Bremer, P.T.; Kimishima, A.; Schlosburg, J.E.; Zhou, B.; Collins, K.C.; Janda, K.D. Combatting Synthetic Designer Opioids: A Conjugate Vaccine Ablates Lethal Doses of Fentanyl Class Drugs. Angew. Chem. Int. Ed. 2016, 55, 3772–3775. [Google Scholar] [CrossRef]
- Weinsanto, I.; Laux-Biehlmann, A.; Mouheiche, J.; Maduna, T.; Delalande, F.; Chavant, V.; Gabel, F.; Darbon, P.; Charlet, A.; Poisbeau, P.; et al. Stable isotope-labelled morphine to study in vivo central and peripheral morphine glucuronidation and brain transport in tolerant mice. Br. J. Pharmacol. 2018, 175, 3844–3856. [Google Scholar] [CrossRef]
- Zhu, P.; Ye, Z.; Guo, D.; Xiong, Z.; Huang, S.; Guo, J.; Zhang, W.; Polli, J.E.; Zhou, H.; Li, Q.; et al. Irinotecan Alters the Disposition of Morphine Via Inhibition of Organic Cation Transporter 1 (OCT1) and 2 (OCT2). Pharm. Res. 2018, 35, 243. [Google Scholar] [CrossRef]
- Chen, M.; Guo, L.; Dong, D.; Yu, F.; Zhang, T.; Wu, B. The nuclear receptor Shp regulates morphine withdrawal syndrome via modulation of Ugt2b expression in mice. Biochem. Pharmacol. 2019, 161, 163–172. [Google Scholar] [CrossRef]
- Raleigh, M.D.; Baruffaldi, F.; Peterson, S.J.; Le Naour, M.; Harmon, T.M.; Vigliaturo, J.R.; Pentel, P.R.; Pravetoni, M. A Fentanyl Table 1Vaccine Alters Fentanyl Distribution and Protects against Fentanyl-Induced Effects in Mice and Rats. J. Pharmacol. Exp. Ther. 2019, 368, 282–291. [Google Scholar] [CrossRef]
- Smith, L.C.; Bremer, P.T.; Hwang, C.S.; Zhou, B.; Ellis, B.; Hixon, M.S.; Janda, K.D. Monoclonal Antibodies for Combating Synthetic Opioid Intoxication. J. Am. Chem. Soc. 2019, 141, 10489–10503. [Google Scholar] [CrossRef]
- Ban, B.; Barrientos, R.C.; Oertel, T.; Komla, E.; Whalen, C.; Sopko, M.; You, Y.; Banerjee, P.; Sulima, A.; Jacobson, A.E.; et al. Novel chimeric monoclonal antibodies that block fentanyl effects and alter fentanyl biodistribution in mice. mAbs 2021, 13, 1991552. [Google Scholar] [CrossRef]
- Powers, N.; Massena, C.; Crouse, B.; Smith, M.; Hicks, L.; Evans, J.T.; Miller, S.; Pravetoni, M.; Burkhart, D. Self-Adjuvanting TLR7/8 Agonist and Fentanyl Hapten Co-Conjugate Achieves Enhanced Protection against Fentanyl Challenge. Bioconjug Chem. 2023, 34, 1811–1821. [Google Scholar] [CrossRef]
- Björkman, S.; Stanski, D.R. Simultaneous determination of fentanyl and alfentanil in rat tissues by capillary column gas chromatography. J. Chromatogr. 1988, 433, 95–104. [Google Scholar] [CrossRef]
- Björkman, S.; Stanski, D.R.; Verotta, D.; Harashima, H. Comparative tissue concentration profiles of fentanyl and alfentanil in humans predicted from tissue/blood partition data obtained in rats. Anesthesiology 1990, 72, 865–873. [Google Scholar] [CrossRef]
- Schneider, E.; Brune, K. Distribution of fentanyl in rats: An autoradiographic study. Naunyn Schmiedebergs Arch. Pharmacol. 1985, 331, 359–363. [Google Scholar] [CrossRef] [PubMed]
- Schneider, E.; Brune, K. Opioid activity and distribution of fentanyl metabolites. Naunyn Schmiedebergs Arch. Pharmacol. 1986, 334, 267–274. [Google Scholar] [CrossRef] [PubMed]
- Abdulrahim, D.; Bowden-Jones, O. The Misuse of Synthetic Opioids: Harms and Clinical Management of Fentanyl, Fentanyl Analogues and Other Novel Synthetic Opioids; NEPTUNE: London, UK, 2018; pp. 1–29. [Google Scholar]
- Peirson, S.N.; Brown, L.A.; Pothecary, C.A.; Benson, L.A.; Fisk, A.S. Light and the laboratory mouse. J. Neurosci. Methods 2018, 300, 26–36. [Google Scholar] [CrossRef] [PubMed]
- International Council for Harmonisation of Technical Requirements for Pharmaceuticals for Human Use. ICH Harmonised Guideline: Bioanalytical Method Validation and Study Sample Analysis M10. 2022. Available online: https://database.ich.org/sites/default/files/M10_Guideline_Step4_2022_0524.pdf (accessed on 31 July 2023).
- Grung, M.; Skurtveit, S.; Aasmundstad, T.A.; Handal, M.; Alkana, R.L.; Morland, J. Morphine-6-glucuronide-induced locomotor stimulation in mice: Role of opioid receptors. Pharmacol. Toxicol. 1998, 82, 3–10. [Google Scholar] [CrossRef] [PubMed]
- Handal, M.; Grung, M.; Skurtveit, S.; Ripel, A.; Morland, J. Pharmacokinetic differences of morphine and morphine-glucuronides are reflected in locomotor activity. Pharmacol. Biochem. Behav. 2002, 73, 883–892. [Google Scholar] [CrossRef] [PubMed]
- Lawrence, A.J.; Michalkiewicz, A.; Morley, J.S.; MacKinnon, K.; Billington, D. Differential inhibition of hepatic morphine UDP-glucuronosyltransferases by metal ions. Biochem. Pharmacol. 1992, 43, 2335–2340. [Google Scholar] [CrossRef]
- Hill, R.; Lyndon, A.; Withey, S.; Roberts, J.; Kershaw, Y.; MacLachlan, J.; Lingford-Hughes, A.; Kelly, E.; Bailey, C.; Hickman, M.; et al. Ethanol Reversal of Tolerance to the Respiratory Depressant Effects of Morphine. Neuropsychopharmacology 2016, 41, 762–773. [Google Scholar] [CrossRef] [PubMed]
- Gaugler, S.; Rykyl, J.; Grill, M.; Cebolla, V.L. Fully automated drug screening of dried blood spots using online LC-MS/MS analysis. J. Appl. Bioanal. 2018, 4, 7–15. [Google Scholar] [CrossRef]
- Ferreira, E.; Corte Real, F.; Pinho, E.M.T.; Margalho, C. A Novel Bioanalytical Method for the Determination of Opioids in Blood and Pericardial Fluid. J. Anal. Toxicol. 2020, 44, 754–768. [Google Scholar] [CrossRef]
- Øiestad, E.L.; Johansen, U.; Oiestad, A.M.; Christophersen, A.S. Drug screening of whole blood by ultra-performance liquid chromatography-tandem mass spectrometry. J. Anal. Toxicol. 2011, 35, 280–293. [Google Scholar] [CrossRef]
- Vandenbosch, M.; Pajk, S.; Van Den Bogaert, W.; Wuestenbergs, J.; Van de Voorde, W.; Cuypers, E. Postmortem Analysis of Opioids and Metabolites in Skeletal Tissue. J. Anal. Toxicol. 2022, 46, 783–790. [Google Scholar] [CrossRef]
- Guillot, E.; de Mazancourt, P.; Durigon, M.; Alvarez, J.C. Morphine and 6-acetylmorphine concentrations in blood, brain, spinal cord, bone marrow and bone after lethal acute or chronic diacetylmorphine administration to mice. Forensic Sci. Int. 2007, 166, 139–144. [Google Scholar] [CrossRef]
- Gabel, F.; Hovhannisyan, V.; Andry, V.; Goumon, Y. Central metabolism as a potential origin of sex differences in morphine antinociception but not induction of antinociceptive tolerance in mice. Br. J. Pharmacol. 2023, 180, 843–861. [Google Scholar] [CrossRef] [PubMed]
- Zuccaro, P.; Ricciarello, R.; Pichini, S.; Pacifici, R.; Altieri, I.; Pellegrini, M.; D’Ascenzo, G. Simultaneous determination of heroin 6-monoacetylmorphine, morphine, and its glucuronides by liquid chromatography--atmospheric pressure ionspray-mass spectrometry. J. Anal. Toxicol. 1997, 21, 268–277. [Google Scholar] [CrossRef] [PubMed]
- Hug, C.C., Jr.; Murphy, M.R. Tissue redistribution of fentanyl and termination of its effects in rats. Anesthesiology 1981, 55, 369–375. [Google Scholar] [CrossRef]
- Iula, D.M. What Do We Know about the Metabolism of the New Fentanyl Derivatives? Available online: https://www.caymanchem.com/news/what-do-we-know-about-the-metabolism-of-the-new-fentanyl-derivative (accessed on 13 April 2024).
- Gardocki, J.F.; Yelnosky, J. A Study of Some of the Pharmacologic Actions of Fentanyl Citrate. Toxicol. Appl. Pharmacol. 1964, 6, 48–62. [Google Scholar] [CrossRef]
- Newman, M.; Lynch, C.; Connery, H.; Goldsmith, W.; Nurkiewicz, T.; Raylman, R.; Boyd, J. Fentanyl overdose: Temporal effects and prognostic factors in SKH1 mice. Basic. Clin. Pharmacol. Toxicol. 2024, 134, 460–471. [Google Scholar] [CrossRef]
- Jensen, B.C.; Swigart, P.M.; De Marco, T.; Hoopes, C.; Simpson, P.C. alpha1-Adrenergic receptor subtypes in nonfailing and failing human myocardium. Circ. Heart Fail. 2009, 2, 654–663. [Google Scholar] [CrossRef]
- Torralva, R.; Eshleman, A.J.; Swanson, T.L.; Schmachtenberg, J.L.; Schutzer, W.E.; Bloom, S.H.; Wolfrum, K.M.; Reed, J.F.; Janowsky, A. Fentanyl but not Morphine Interacts with Nonopioid Recombinant Human Neurotransmitter Receptors and Transporters. J. Pharmacol. Exp. Ther. 2020, 374, 376–391. [Google Scholar] [CrossRef] [PubMed]
- Elkiweri, I.A.; Zhang, Y.L.; Christians, U.; Ng, K.Y.; Tissot van Patot, M.C.; Henthorn, T.K. Competitive substrates for P-glycoprotein and organic anion protein transporters differentially reduce blood organ transport of fentanyl and loperamide: Pharmacokinetics and pharmacodynamics in Sprague-Dawley rats. Anesth. Analg. 2009, 108, 149–159. [Google Scholar] [CrossRef]
- United States Drug Enforcement Administration. Facts about Fentanyl. Available online: https://www.dea.gov/resources/facts-about-fentanyl (accessed on 14 April 2024).
- Ruzycki, S.; Yarema, M.; Dunham, M.; Sadrzadeh, H.; Tremblay, A. Intranasal Fentanyl Intoxication Leading to Diffuse Alveolar Hemorrhage. J. Med. Toxicol. 2016, 12, 185–188. [Google Scholar] [CrossRef]
- Chapman, E.; Leipsic, J.; Satkunam, N.; Churg, A. Pulmonary alveolar proteinosis as a reaction to fentanyl patch smoke. Chest 2012, 141, 1321–1323. [Google Scholar] [CrossRef]
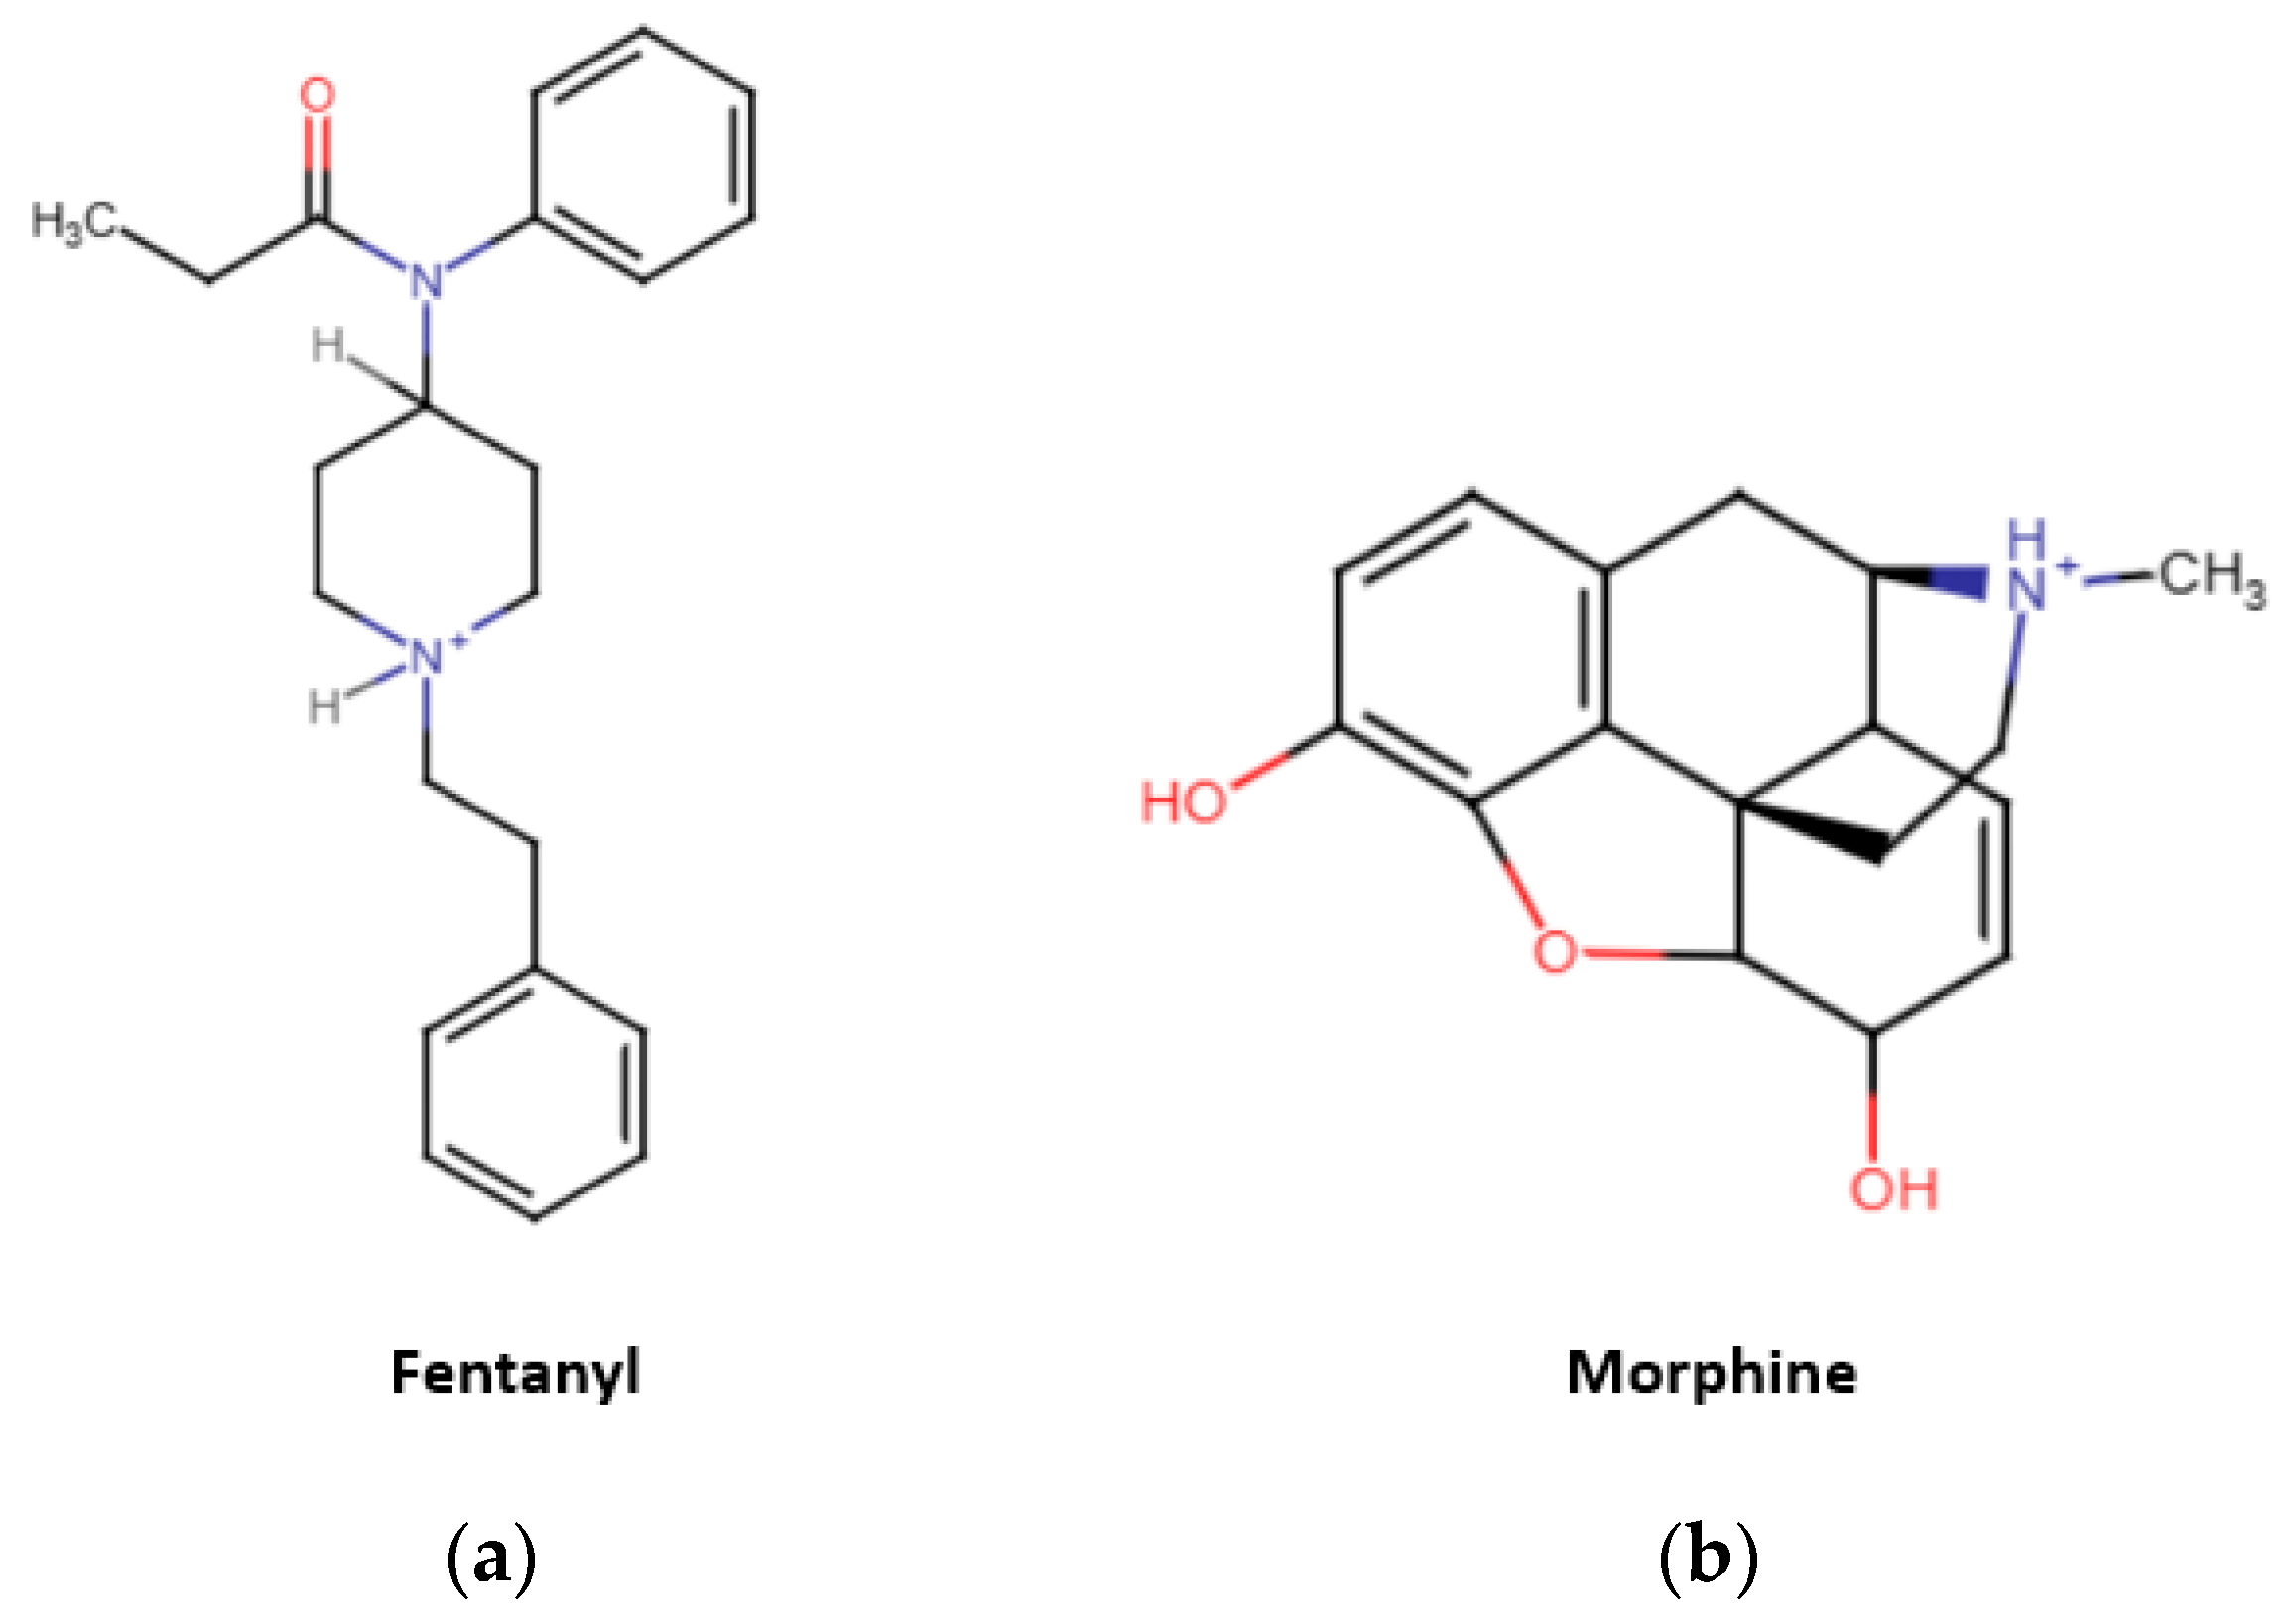
Disclaimer/Publisher’s Note: The statements, opinions and data contained in all publications are solely those of the individual author(s) and contributor(s) and not of MDPI and/or the editor(s). MDPI and/or the editor(s) disclaim responsibility for any injury to people or property resulting from any ideas, methods, instructions or products referred to in the content. |
© 2024 by the authors. Licensee MDPI, Basel, Switzerland. This article is an open access article distributed under the terms and conditions of the Creative Commons Attribution (CC BY) license (https://creativecommons.org/licenses/by/4.0/).