
Mitigating Cybersickness in Virtual Reality: Impact of Eye–Hand Coordination Tasks, Immersion, and Gaming Skills

 and
and 
Abstract
:1. Introduction
1.1. Eye–Hand Coordination Tasks in VR
1.2. Exiting VR
1.3. Cybersickness and Reaction Times
1.4. Demographics and Cybersickness
1.5. Susceptibility to Motion Sickness and Cybersickness
1.6. Technology Experience and Cybersickness
1.7. Gaming Experience and Cybersickness
1.8. Research Aims
2. Materials and Methods
2.1. Participants
2.2. Measures
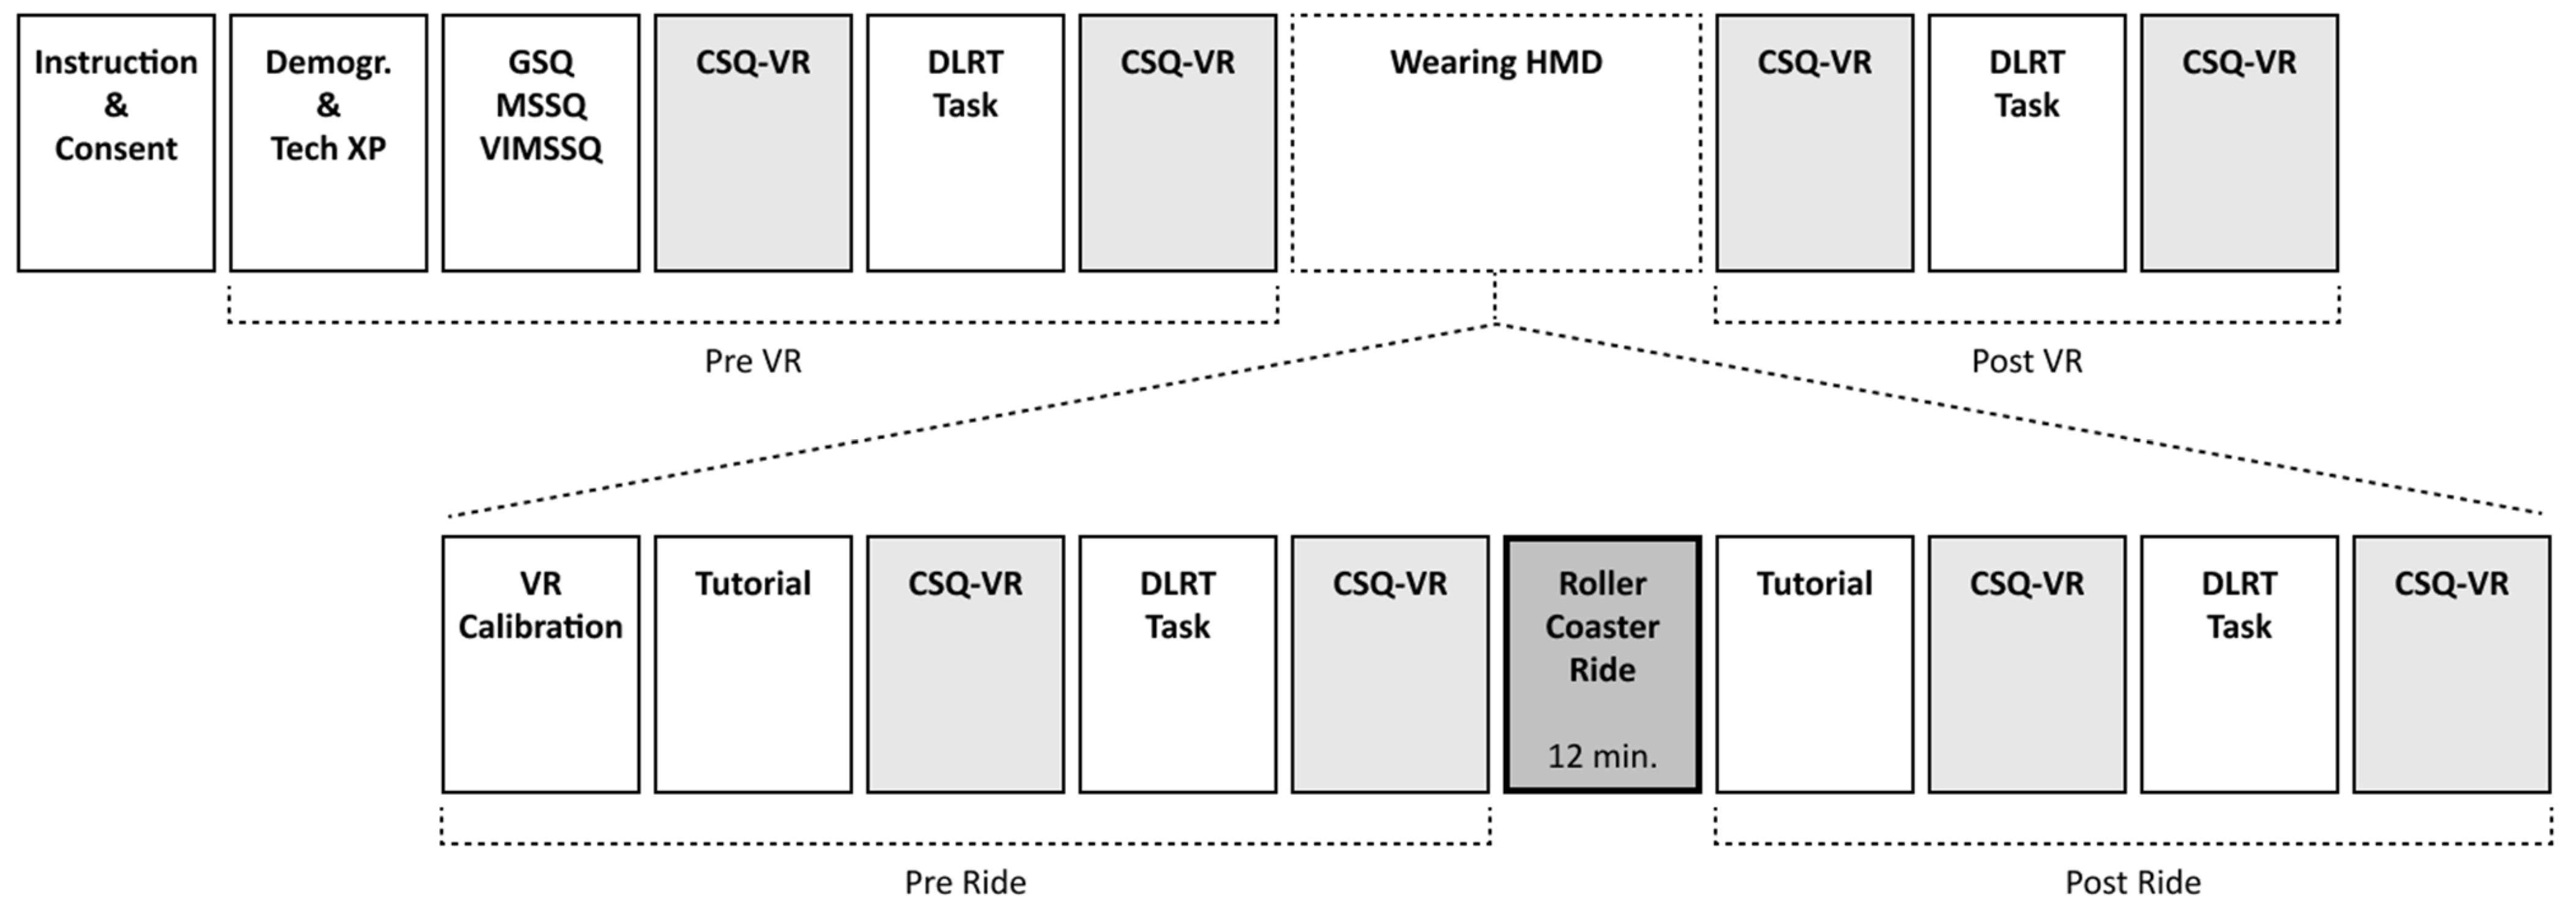
2.3. Procedure
2.4. Statistical Analyses
2.4.1. Descriptive Statistics and Normality Checks
2.4.2. Repeated Measures ANOVA (H1 & H2)
2.4.3. Paired-Samples t-Tests (H3)
2.4.4. Mixed-Effects Regression Models (H4–H6 and RQ1)
- For H4, we examined whether susceptibility to motion sickness and VIMS predicted overall cybersickness intensity.
- For H5, demographic factors such as age and sex were tested as predictors of cybersickness intensity.
- For H6, the effect of prior experience with computers, smartphones, gaming, and VR on cybersickness symptoms was evaluated.
- For RQ1, we tested whether action or FPS game genres predicted lower levels of cybersickness symptomatology.
3. Results
3.1. Descriptive Statistics
3.2. ANOVA Analyses: Cybersickness Symptomatology Intensity
3.2.1. Overall Cybersickness
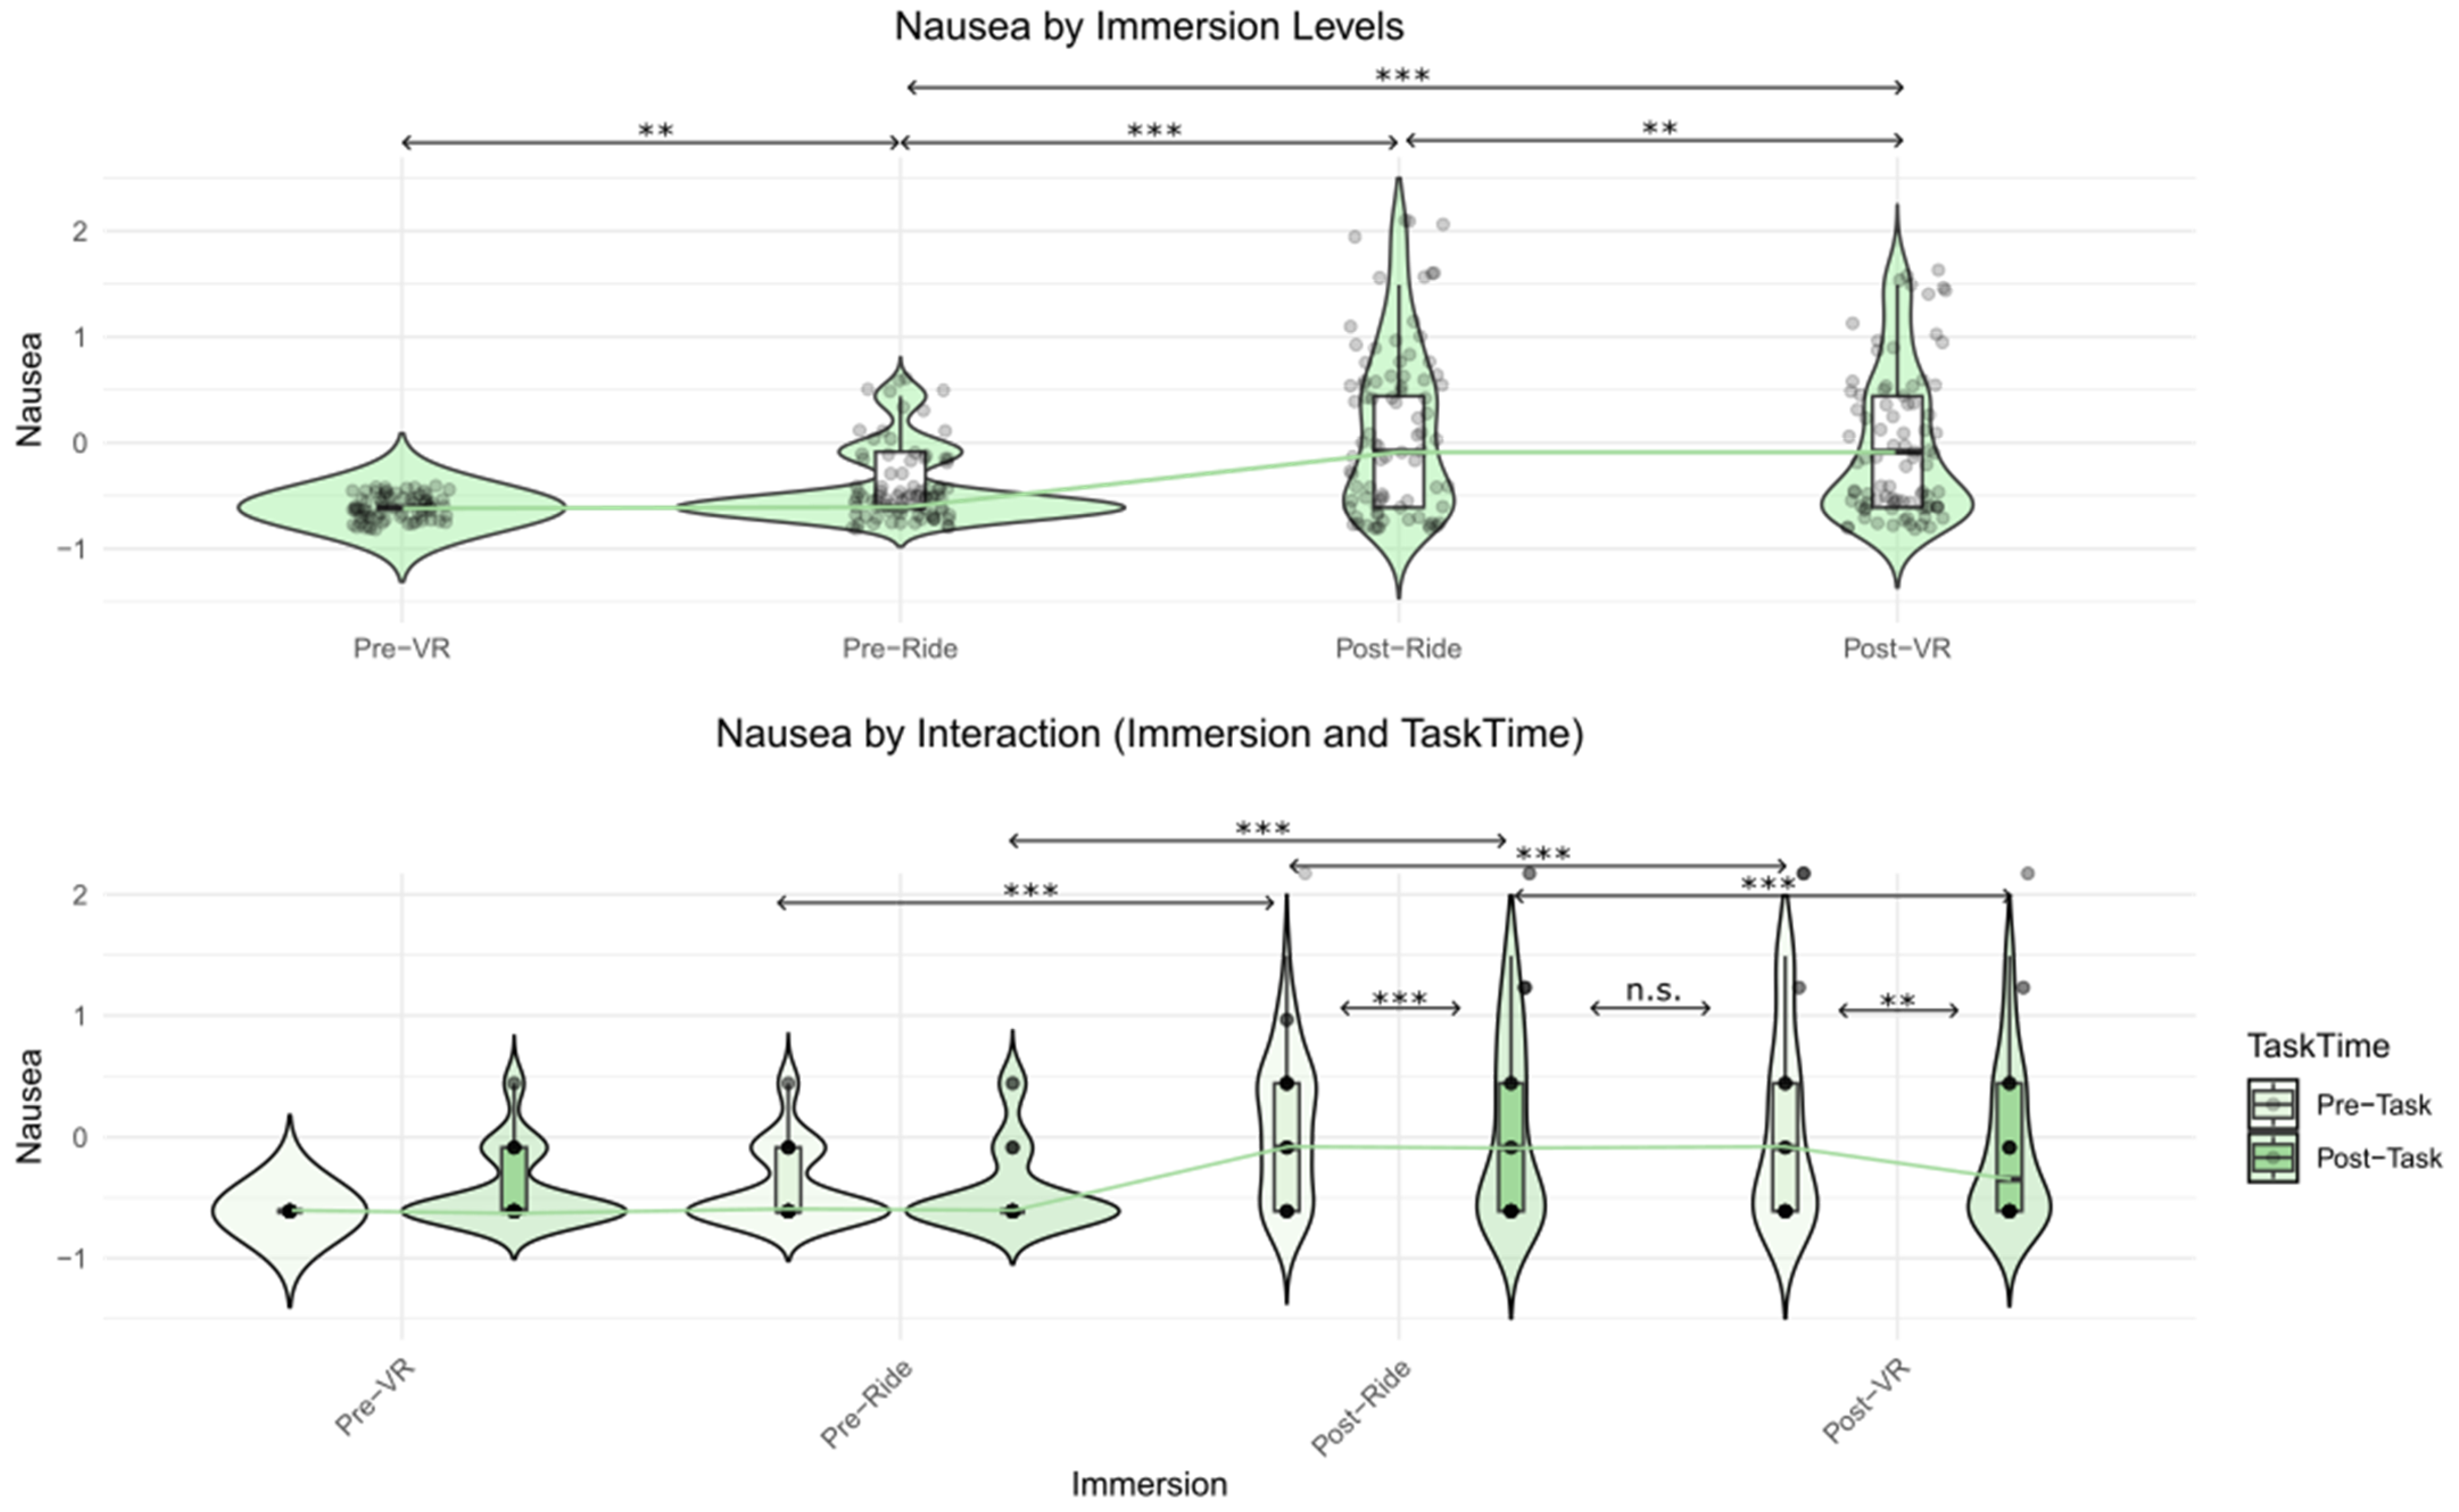
3.2.2. Nausea Symptoms
3.2.3. Vestibular Symptoms
3.2.4. Oculomotor Symptoms
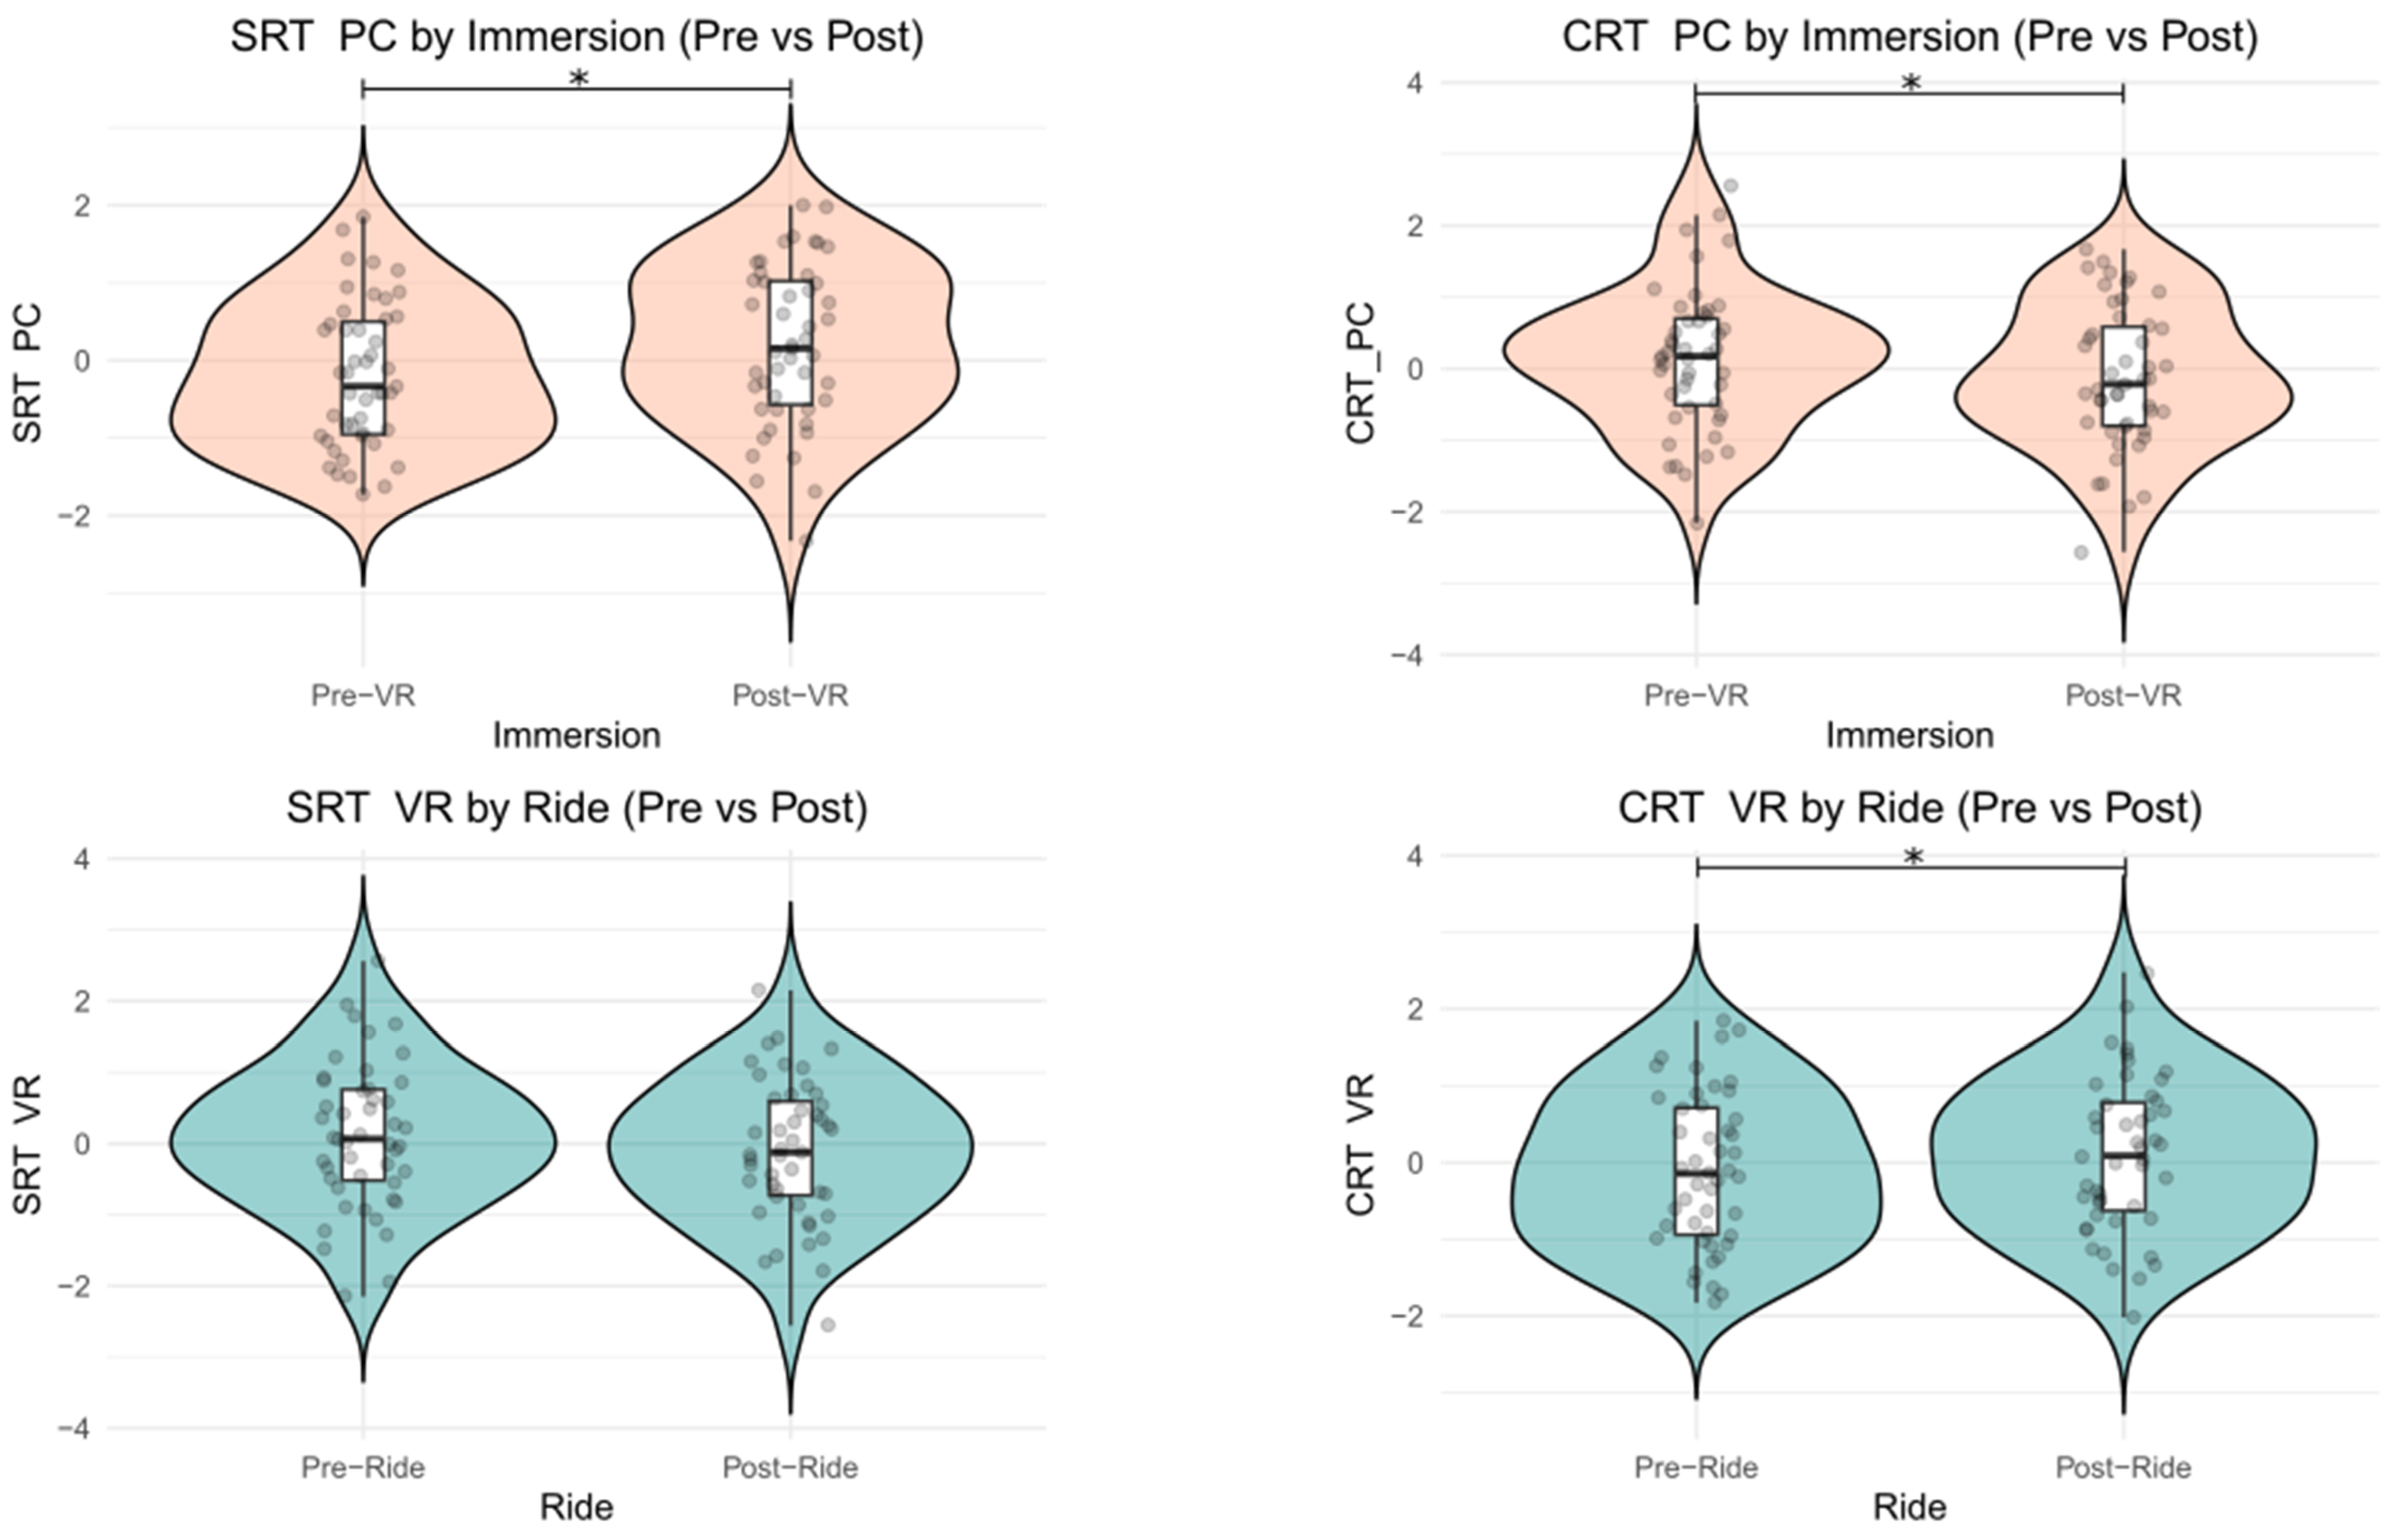
3.3. Performance Comparisons: Eye–Hand Coordination Reaction Time
3.4. Mixed Model Regressions: Individual Differences as Predictors of Cybersickness
Gaming Skills Across Diverse Genres
4. Discussion
4.1. The Effects of Immersion on Cybersickness
4.2. Mitigating Effects of Task Engagement
4.3. Reaction Times
4.4. Individual Differences in Predicting Cybersickness
4.5. Limitations and Future Studies
4.6. Practical Implications and Future Directions
5. Conclusions
Author Contributions
Funding
Institutional Review Board Statement
Informed Consent Statement
Data Availability Statement
Conflicts of Interest
References
- Kyaw, B.M.; Saxena, N.; Posadzki, P.; Vseteckova, J.; Nikolaou, C.K.; George, P.P.; Divakar, U.; Masiello, I.; Kononowicz, A.A.; Zary, N.; et al. Virtual Reality for Health Professions Education: Systematic Review and Meta-Analysis by the Digital Health Education Collaboration. J. Med. Internet Res. 2019, 21, e12959. [Google Scholar] [CrossRef] [PubMed]
- Kavanagh, S.; Luxton-Reilly, A.; Wuensche, B.; Plimmer, B. A Systematic Review of Virtual Reality in Education. Themes Sci. Technol. Educ. 2017, 10, 85–119. [Google Scholar]
- Berni, A.; Borgianni, Y. Applications of Virtual Reality in Engineering and Product Design: Why, What, How, When and Where. Electronics 2020, 9, 1064. [Google Scholar] [CrossRef]
- Palacios-Ibáñez, A.; Marín-Morales, J.; Contero, M.; Alcañiz, M. Predicting Decision-Making in Virtual Environments: An Eye Movement Analysis with Household Products. Appl. Sci. 2023, 13, 7124. [Google Scholar] [CrossRef]
- Düking, P.; Holmberg, H.-C.; Sperlich, B. The Potential Usefulness of Virtual Reality Systems for Athletes: A Short SWOT Analysis. Front. Physiol. 2018, 9, 128. [Google Scholar] [CrossRef]
- Park, E.-C.; Kim, S.-G.; Lee, C.-W. The Effects of Virtual Reality Game Exercise on Balance and Gait of the Elderly. J. Phys. Ther. Sci. 2015, 27, 1157–1159. [Google Scholar] [CrossRef]
- Loomis, J.M.; Blascovich, J.J.; Beall, A.C. Immersive Virtual Environment Technology as a Basic Research Tool in Psychology. Behav. Res. Methods Instrum. Comput. 1999, 31, 557–564. [Google Scholar] [CrossRef]
- Pan, X.; Hamilton, A.F.d.C. Why and How to Use Virtual Reality to Study Human Social Interaction: The Challenges of Exploring a New Research Landscape. Br. J. Psychol. 2018, 109, 395–417. [Google Scholar] [CrossRef]
- Greenwood, K.E.; Morris, R.; Smith, V.; Jones, A.-M.; Pearman, D.; Wykes, T. Virtual Shopping: A Viable Alternative to Direct Assessment of Real Life Function? Schizophr. Res. 2016, 172, 206–210. [Google Scholar] [CrossRef]
- Rodríguez, C.; Areces, D.; García, T.; Cueli, M.; González-Castro, P. Comparison between Two Continuous Performance Tests for Identifying ADHD: Traditional vs. Virtual Reality. Int. J. Clin. Health Psychol. 2018, 18, 254–263. [Google Scholar] [CrossRef]
- Bouchard, S.; Berthiaume, M.; Robillard, G.; Forget, H.; Daudelin-Peltier, C.; Renaud, P.; Blais, C.; Fiset, D. Arguing in Favor of Revising the Simulator Sickness Questionnaire Factor Structure When Assessing Side Effects Induced by Immersions in Virtual Reality. Front. Psychiatry 2021, 12, 739742. [Google Scholar] [CrossRef] [PubMed]
- Stanney, K.; Kennedy, R.S.; Drexler, J.M. Cybersickness Is Not Simulator Sickness. Proc. Hum. Factors Ergon. Soc. Annu. Meet. 1997, 41, 1138–1142. [Google Scholar] [CrossRef]
- LaViola, J.J. A Discussion of Cybersickness in Virtual Environments. SIGCHI Bull. 2000, 32, 47–56. [Google Scholar] [CrossRef]
- Rebenitsch, L.; Owen, C. Review on Cybersickness in Applications and Visual Displays. Virtual Real. 2016, 20, 101–125. [Google Scholar] [CrossRef]
- Bonato, F.; Bubka, A.; Palmisano, S. Combined Pitch and Roll and Cybersickness in a Virtual Environment. Aviat. Space Environ. Med. 2009, 80, 941–945. [Google Scholar] [CrossRef]
- Champney, R.K.; Stanney, K.M.; Hash, P.A.K.; Malone, L.C.; Kennedy, R.S.; Compton, D.E. Recovery from Virtual Environment Exposure: Expected Time Course of Symptoms and Potential Readaptation Strategies. Hum. Factors 2007, 49, 491–506. [Google Scholar] [CrossRef]
- Curtis, M.K.; Dawson, K.; Jackson, K.; Litwin, L.; Meusel, C.; Dorneich, M.C.; Gilbert, S.B.; Kelly, J.; Stone, R.; Winer, E. Mitigating Visually Induced Motion Sickness: A Virtual Hand-Eye Coordination Task. Proc. Hum. Factors Ergon. Soc. Annu. Meet. 2015, 59, 1839–1843. [Google Scholar] [CrossRef]
- Jasper, A.; Cone, N.; Meusel, C.; Curtis, M.; Dorneich, M.C.; Gilbert, S.B. Visually Induced Motion Sickness Susceptibility and Recovery Based on Four Mitigation Techniques. Front. Virtual Real. 2020, 1, 582108. [Google Scholar] [CrossRef]
- Deary, I.J.; Liewald, D.; Nissan, J. A Free, Easy-to-Use, Computer-Based Simple and Four-Choice Reaction Time Programme: The Deary-Liewald Reaction Time Task. Behav. Res. 2011, 43, 258–268. [Google Scholar] [CrossRef]
- Kourtesis, P.; Papadopoulou, A.; Roussos, P. Cybersickness in Virtual Reality: The Role of Individual Differences, Its Effects on Cognitive Functions and Motor Skills, and Intensity Differences during and after Immersion. Virtual Worlds 2024, 3, 62–93. [Google Scholar] [CrossRef]
- Martirosov, S.; Bureš, M.; Zítka, T. Cyber Sickness in Low-Immersive, Semi-Immersive, and Fully Immersive Virtual Reality. Virtual Real. 2022, 26, 15–32. [Google Scholar] [CrossRef] [PubMed]
- Knibbe, J.; Schjerlund, J.; Petraeus, M.; Hornbæk, K. The Dream Is Collapsing: The Experience of Exiting VR. In Proceedings of the 2018 CHI Conference on Human Factors in Computing Systems, Montreal, QC, Canada, 16–21 April 2018; pp. 1–13. [Google Scholar]
- Nalivaiko, E.; Davis, S.L.; Blackmore, K.L.; Vakulin, A.; Nesbitt, K.V. Cybersickness Provoked by Head-Mounted Display Affects Cutaneous Vascular Tone, Heart Rate and Reaction Time. Physiol. Behav. 2015, 151, 583–590. [Google Scholar] [CrossRef] [PubMed]
- Kourtesis, P.; Linnell, J.; Amir, R.; Argelaguet, F.; MacPherson, S.E. Cybersickness in Virtual Reality Questionnaire (CSQ-VR): A Validation and Comparison against SSQ and VRSQ. Virtual Worlds 2023, 2, 16–35. [Google Scholar] [CrossRef]
- Smith, E. Choice Reaction Time: An Analysis of the Major Theoretical Positions. Psychol. Bull. 1968, 69, 77–110. [Google Scholar] [CrossRef]
- Deary, I.J.; Der, G. Reaction Time, Age, and Cognitive Ability: Longitudinal Findings from Age 16 to 63 Years in Representative Population Samples. Aging Neuropsychol. Cogn. 2005, 12, 187–215. [Google Scholar] [CrossRef]
- Cote, K.A.; Milner, C.E.; Smith, B.A.; Aubin, A.J.; Greason, T.A.; Cuthbert, B.P.; Wiebe, S.; Duffus, S.E.G. CNS Arousal and Neurobehavioral Performance in a Short-Term Sleep Restriction Paradigm. J. Sleep. Res. 2009, 18, 291–303. [Google Scholar] [CrossRef]
- Smith, A.P. Effects of Upper Respiratory Tract Illnesses and Stress on Alertness and Reaction Time. Psychoneuroendocrinology 2013, 38, 2003–2009. [Google Scholar] [CrossRef]
- Yadav, A.K.; Velaga, N.R. Modelling the Relationship between Different Blood Alcohol Concentrations and Reaction Time of Young and Mature Drivers. Transp. Res. Part. F Traffic Psychol. Behav. 2019, 64, 227–245. [Google Scholar] [CrossRef]
- Nesbitt, K.; Davis, S.; Blackmore, K.; Nalivaiko, E. Correlating Reaction Time and Nausea Measures with Traditional Measures of Cybersickness. Displays 2017, 48, 1–8. [Google Scholar] [CrossRef]
- Mittelstaedt, J.M.; Wacker, J.; Stelling, D. VR Aftereffect and the Relation of Cybersickness and Cognitive Performance. Virtual Real. 2019, 23, 143–154. [Google Scholar] [CrossRef]
- Smith, S.P.; Burd, E.L. Response Activation and Inhibition after Exposure to Virtual Reality. Array 2019, 3–4, 100010. [Google Scholar] [CrossRef]
- Szpak, A.; Michalski, S.C.; Saredakis, D.; Chen, C.S.; Loetscher, T. Beyond Feeling Sick: The Visual and Cognitive Aftereffects of Virtual Reality. IEEE Access 2019, 7, 130883–130892. [Google Scholar] [CrossRef]
- Kourtesis, P.; Amir, R.; Linnell, J.; Argelaguet, F.; MacPherson, S.E. Cybersickness, Cognition, & Motor Skills: The Effects of Music, Gender, and Gaming Experience. IEEE Trans. Vis. Comput. Graph. 2023, 29, 2326–2336. [Google Scholar] [CrossRef]
- Arcioni, B.; Palmisano, S.; Apthorp, D.; Kim, J. Postural Stability Predicts the Likelihood of Cybersickness in Active HMD-Based Virtual Reality. Displays 2019, 58, 3–11. [Google Scholar] [CrossRef]
- Kennedy, R.S.; Drexler, J.; Kennedy, R.C. Research in Visually Induced Motion Sickness. Appl. Ergon. 2010, 41, 494–503. [Google Scholar] [CrossRef] [PubMed]
- Keshavarz, B.; Ramkhalawansingh, R.; Haycock, B.; Shahab, S.; Campos, J.L. Comparing Simulator Sickness in Younger and Older Adults during Simulated Driving under Different Multisensory Conditions. Transp. Res. Part. F Traffic Psychol. Behav. 2018, 54, 47–62. [Google Scholar] [CrossRef]
- Munafo, J.; Diedrick, M.; Stoffregen, T.A. The Virtual Reality Head-Mounted Display Oculus Rift Induces Motion Sickness and Is Sexist in Its Effects. Exp. Brain Res. 2017, 235, 889–901. [Google Scholar] [CrossRef]
- Boot, W.R.; Dilanchian, A.; Andringa, R. Exploring Older Adults’ Perceptions of Presence and Immersion in Diverse Virtual Environments. Innov. Aging 2019, 3, S239–S240. [Google Scholar] [CrossRef]
- Dilanchian, A.T.; Andringa, R.; Boot, W.R. A Pilot Study Exploring Age Differences in Presence, Workload, and Cybersickness in the Experience of Immersive Virtual Reality Environments. Front. Virtual Real. 2021, 2, 736793. [Google Scholar] [CrossRef]
- Chattha, U.A.; Janjua, U.I.; Anwar, F.; Madni, T.M.; Cheema, M.F.; Janjua, S.I. Motion Sickness in Virtual Reality: An Empirical Evaluation. IEEE Access 2020, 8, 130486–130499. [Google Scholar] [CrossRef]
- Curry, C.; Peterson, N.; Li, R.; Stoffregen, T.A. Postural Precursors of Motion Sickness in Head-Mounted Displays: Drivers and Passengers, Women and Men. Ergonomics 2020, 63, 1502–1511. [Google Scholar] [CrossRef] [PubMed]
- Melo, M.; Vasconcelos-Raposo, J.; Bessa, M. Presence and Cybersickness in Immersive Content: Effects of Content Type, Exposure Time and Gender. Comput. Graph. 2018, 71, 159–165. [Google Scholar] [CrossRef]
- Saredakis, D.; Szpak, A.; Birckhead, B.; Keage, H.A.D.; Rizzo, A.; Loetscher, T. Factors Associated with Virtual Reality Sickness in Head-Mounted Displays: A Systematic Review and Meta-Analysis. Front. Hum. Neurosci. 2020, 14, 96. [Google Scholar] [CrossRef] [PubMed]
- Stanney, K.; Fidopiastis, C.; Foster, L. Virtual Reality Is Sexist: But It Does Not Have to Be. Front. Robot. AI 2020, 7, 4. [Google Scholar] [CrossRef]
- Oh, H.; Son, W. Cybersickness and Its Severity Arising from Virtual Reality Content: A Comprehensive Study. Sensors 2022, 22, 1314. [Google Scholar] [CrossRef]
- Petri, K.; Feuerstein, K.; Folster, S.; Bariszlovich, F.; Witte, K. Effects of Age, Gender, Familiarity with the Content, and Exposure Time on Cybersickness in Immersive Head-Mounted Display Based Virtual Reality. Am. J. Biomed. Sci. 2020, 12, 107–121. [Google Scholar] [CrossRef]
- Gavgani, A.M.; Walker, F.R.; Hodgson, D.M.; Nalivaiko, E. A Comparative Study of Cybersickness during Exposure to Virtual Reality and “Classic” Motion Sickness: Are They Different? J. Appl. Physiol. 2018, 125, 1670–1680. [Google Scholar] [CrossRef]
- Golding, J.F. Predicting Individual Differences in Motion Sickness Susceptibility by Questionnaire. Personal. Individ. Differ. 2006, 41, 237–248. [Google Scholar] [CrossRef]
- Lackner, J.R. Motion Sickness: More than Nausea and Vomiting. Exp. Brain Res. 2014, 232, 2493–2510. [Google Scholar] [CrossRef]
- Nachum, Z.; Shupak, A.; Letichevsky, V.; Ben-David, J.; Tal, D.; Tamir, A.; Talmon, Y.; Gordon, C.R.; Luntz, M. Mal de Debarquement and Posture: Reduced Reliance on Vestibular and Visual Cues. Laryngoscope 2004, 114, 581–586. [Google Scholar] [CrossRef]
- Jasper, A.; Sepich, N.C.; Gilbert, S.B.; Kelly, J.W.; Dorneich, M.C. Predicting Cybersickness Using Individual and Task Characteristics. Comput. Hum. Behav. 2023, 146, 107800. [Google Scholar] [CrossRef]
- Rebenitsch, L.; Owen, C. Individual Variation in Susceptibility to Cybersickness. In Proceedings of the 27th Annual ACM Symposium on User Interface Software and Technology, Honolulu, HI, USA, 5 October 2014; pp. 309–317. [Google Scholar]
- Golding, J.F.; Rafiq, A.; Keshavarz, B. Predicting Individual Susceptibility to Visually Induced Motion Sickness by Questionnaire. Front. Virtual Real. 2021, 2, 576871. [Google Scholar] [CrossRef]
- Lukacova, I.; Keshavarz, B.; Golding, J.F. Measuring the Susceptibility to Visually Induced Motion Sickness and Its Relationship with Vertigo, Dizziness, Migraine, Syncope and Personality Traits. Exp. Brain Res. 2023, 241, 1381–1391. [Google Scholar] [CrossRef]
- Keshavarz, B.; Saryazdi, R.; Campos, J.L.; Golding, J.F. Introducing the VIMSSQ: Measuring Susceptibility to Visually Induced Motion Sickness. Proc. Hum. Factors Ergon. Soc. Annu. Meet. 2019, 63, 2267–2271. [Google Scholar] [CrossRef]
- Keshavarz, B.; Murovec, B.; Mohanathas, N.; Golding, J.F. The Visually Induced Motion Sickness Susceptibility Questionnaire (VIMSSQ): Estimating Individual Susceptibility to Motion Sickness-Like Symptoms When Using Visual Devices. Hum. Factors 2023, 65, 107–124. [Google Scholar] [CrossRef]
- Bouchrika, I. Mobile vs Desktop Usage Statistics for 2024. Available online: https://research.com/software/mobile-vs-desktop-usage (accessed on 14 September 2024).
- Soewardi, H.; Izzuddin, M.N. Study of Cybersickness on Non-Immersive Virtual Reality Using Smartphone. Malays. J. Public Health Med. 2020, 20, 88–93. [Google Scholar] [CrossRef]
- Kemeny, A.; Chardonnet, J.-R.; Colombet, F. Visualization and Motion Systems. In Getting Rid of Cybersickness; Springer: Cham, Switzerland, 2020; pp. 63–91. ISBN 978-3-030-59341-4. [Google Scholar]
- Stanney, K.; Lawson, B.D.; Rokers, B.; Dennison, M.; Fidopiastis, C.; Stoffregen, T.; Weech, S.; Fulvio, J.M. Identifying Causes of and Solutions for Cybersickness in Immersive Technology: Reformulation of a Research and Development Agenda. Int. J. Hum. Comput. Interact. 2020, 36, 1783–1803. [Google Scholar] [CrossRef]
- Johnson, D.M. Introduction to and Review of Simulator Sickness Research 2005; DTIC: Fort Belvoir, VA, USA, 2005. [Google Scholar]
- Knight, M.M.; Arns, L.L. The Relationship among Age and Other Factors on Incidence of Cybersickness in Immersive Environment Users. In Proceedings of the 3rd Symposium on Applied Perception in Graphics and Visualization, Boston, MA, USA, 28 July 2006; p. 162. [Google Scholar]
- Tian, N.; Lopes, P.; Boulic, R. A Review of Cybersickness in Head-Mounted Displays: Raising Attention to Individual Susceptibility. Virtual Real. 2022, 26, 1409–1441. [Google Scholar] [CrossRef]
- Grassini, S.; Laumann, K.; Luzi, A.K. Association of Individual Factors with Simulator Sickness and Sense of Presence in Virtual Reality Mediated by Head-Mounted Displays (HMDs). Multimodal Technol. Interact. 2021, 5, 7. [Google Scholar] [CrossRef]
- Keshavarz, B. Exploring Behavioral Methods to Reduce Visually Induced Motion Sickness in Virtual Environments. In Virtual, Augmented and Mixed Reality; Lackey, S., Shumaker, R., Eds.; Lecture Notes in Computer Science; Springer: Cham, Switzerland, 2016; Volume 9740, pp. 147–155. ISBN 978-3-319-39906-5. [Google Scholar]
- Pöhlmann, K.M.T.; O’Hare, L.; Focker, J.; Parke, A.; Dickinson, P. Is Virtual Reality Sickness Elicited by Illusory Motion Affected by Gender and Prior Video Gaming Experience? In Proceedings of the 2021 IEEE Conference on Virtual Reality and 3D User Interfaces Abstracts and Workshops (VRW), Lisbon, Portugal, 27 March–1 April 2021; pp. 426–427. [Google Scholar]
- Pöhlmann, K.M.T.; O’Hare, L.; Dickinson, P.; Parke, A.; Föcker, J. Action Video Game Players Do Not Differ in the Perception of Contrast-Based Motion Illusions but Experience More Vection and Less Discomfort in a Virtual Environment Compared to Non-Action Video Game Players. J. Cogn. Enhanc. 2022, 6, 3–19. [Google Scholar] [CrossRef]
- Pöhlmann, K.M.T.; Li, G.; Wilson, G.; McGill, M.; Pollick, F.; Brewster, S. Is Video Gaming a Cure for Cybersickness? Gamers Experience Less Cybersickness Than Non-Gamers in a VR Self-Motion Task. IEEE Trans. Visual. Comput. Graph. 2024, 30, 7225–7233. [Google Scholar] [CrossRef] [PubMed]
- Weech, S.; Kenny, S.; Lenizky, M.; Barnett-Cowan, M. Narrative and Gaming Experience Interact to Affect Presence and Cybersickness in Virtual Reality. Int. J. Hum. Comput. Stud. 2020, 138, 102398. [Google Scholar] [CrossRef]
- Rangelova, S.; Motus, D.; André, E. Cybersickness Among Gamers: An Online Survey. In Advances in Human Factors in Wearable Technologies and Game Design; Ahram, T., Ed.; Advances in Intelligent Systems and Computing; Springer: Cham, Switzerland, 2020; Volume 973, pp. 192–201. ISBN 978-3-030-20475-4. [Google Scholar]
- Baniqued, P.L.; Lee, H.; Voss, M.W.; Basak, C.; Cosman, J.D.; DeSouza, S.; Severson, J.; Salthouse, T.A.; Kramer, A.F. Selling Points: What Cognitive Abilities Are Tapped by Casual Video Games? Acta Psychol. 2013, 142, 74–86. [Google Scholar] [CrossRef]
- Krarup, K.B.; Krarup, H.B. The Physiological and Biochemical Effects of Gaming: A Review. Environ. Res. 2020, 184, 109344. [Google Scholar] [CrossRef]
- Spence, I.; Feng, J. Video Games and Spatial Cognition. Rev. Gen. Psychol. 2010, 14, 92–104. [Google Scholar] [CrossRef]
- Maneuvrier, A.; Nguyen, N.-D.-T.; Renaud, P. Predicting VR Cybersickness and Its Impact on Visuomotor Performance Using Head Rotations and Field (in)Dependence. Front. Virtual Real. 2023, 4, 1307925. [Google Scholar] [CrossRef]
- Clarke, D.; McGregor, G.; Rubin, B.; Stanford, J.; Graham, T.C.N. Arcaid: Addressing Situation Awareness and Simulator Sickness in a Virtual Reality Pac-Man Game. In Proceedings of the 2016 Annual Symposium on Computer-Human Interaction in Play Companion Extended Abstracts, Austin, TX, USA, 15 October 2016; pp. 39–45. [Google Scholar]
- Denisova, A.; Cairns, P. First Person vs. Third Person Perspective in Digital Games: Do Player Preferences Affect Immersion? In Proceedings of the 33rd Annual ACM Conference on Human Factors in Computing Systems, Seoul, Republic of Korea, 18 April 2015; pp. 145–148. [Google Scholar]
- Monteiro, D.; Liang, H.; Xu, W.; Brucker, M.; Nanjappan, V.; Yue, Y. Evaluating Enjoyment, Presence, and Emulator Sickness in VR Games Based on First- and Third-Person Viewing Perspectives. Comput. Animat. Virtual 2018, 29, e1830. [Google Scholar] [CrossRef]
- Shafer, D.M.; Carbonara, C.P.; Korpi, M.F. Factors Affecting Enjoyment of Virtual Reality Games: A Comparison Involving Consumer-Grade Virtual Reality Technology. Games Health J. 2019, 8, 15–23. [Google Scholar] [CrossRef]
- Kennedy, R.S.; Lane, N.E.; Berbaum, K.S.; Lilienthal, M.G. Simulator Sickness Questionnaire: An Enhanced Method for Quantifying Simulator Sickness. Int. J. Aviat. Psychol. 1993, 3, 203–220. [Google Scholar] [CrossRef]
- Zioga, T.; Ferentinos, A.; Konsolaki, E.; Nega, C.; Kourtesis, P. The Effects of Videogame Skills Across Diverse Genres on Verbal and Visuospatial Short-Term and Working Memory, Hand-Eye Coordination, and Empathy in Early Adulthood. Behav. Sci. 2024, 14, 874. [Google Scholar] [CrossRef]
- Zioga, T.; Nega, C.; Roussos, P.; Kourtesis, P. Validation of the Gaming Skills Questionnaire in Adolescence: Effects of Gaming Skills on Cognitive and Affective Functioning. Eur. J. Investig. Health Psychol. Educ. 2024, 14, 722–752. [Google Scholar] [CrossRef] [PubMed]
- Kourtesis, P.; Collina, S.; Doumas, L.A.A.; MacPherson, S.E. Technological Competence Is a Pre-Condition for Effective Implementation of Virtual Reality Head Mounted Displays in Human Neuroscience: A Technological Review and Meta-Analysis. Front. Hum. Neurosci. 2019, 13, 342. [Google Scholar] [CrossRef] [PubMed]
- Kourtesis, P.; Korre, D.; Collina, S.; Doumas, L.A.A.; MacPherson, S.E. Guidelines for the Development of Immersive Virtual Reality Software for Cognitive Neuroscience and Neuropsychology: The Development of Virtual Reality Everyday Assessment Lab (VR-EAL), a Neuropsychological Test Battery in Immersive Virtual Reality. Front. Comput. Sci. 2020, 1, 12. [Google Scholar] [CrossRef]
- Kourtesis, P.; MacPherson, S.E. How Immersive Virtual Reality Methods May Meet the Criteria of the National Academy of Neuropsychology and American Academy of Clinical Neuropsychology: A Software Review of the Virtual Reality Everyday Assessment Lab (VR-EAL). Comput. Hum. Behav. Rep. 2021, 4, 100151. [Google Scholar] [CrossRef]
- Schwind, V.; Knierim, P.; Tasci, C.; Franczak, P.; Haas, N.; Henze, N. “These Are Not My Hands!”: Effect of Gender on the Perception of Avatar Hands in Virtual Reality. In Proceedings of the 2017 CHI Conference on Human Factors in Computing Systems, Denver, CO, USA, 2 May 2017; pp. 1577–1582. [Google Scholar]
- Bebko, A.O.; Troje, N.F. bmlTUX: Design and Control of Experiments in Virtual Reality and Beyond. I-Perception 2020, 11, 4. [Google Scholar] [CrossRef]
- R Core Team. R: A Language and Environment for Statistical Computing. Open J. Stat. 2022, 13, 2. [Google Scholar]
- RStudio Team RStudio. Integrated Development Environment for R; RStudio PBC: Boston, MA, USA, 2022. [Google Scholar]
- Revelle, W. Psych: Procedures for Psychological, Psychometric, and Personality Research; Northwestern University: Evanston, IL, USA, 2022. [Google Scholar]
- Wickham, H. Ggplot2: Elegant Graphics for Data Analysis; Springer: New York, NY, USA, 2016; ISBN 978-3-319-24277-4. [Google Scholar]
- Bates, D.; Mächler, M.; Bolker, B.; Walker, S. Fitting Linear Mixed-Effects Models Using Lme4. J. Stat. Softw. 2015, 67, 1–48. [Google Scholar] [CrossRef]
- Lenth, R.V. Emmeans: Estimated Marginal Means, Aka Least-Squares Means. Am. Stat. 2022, 34, 216–221. [Google Scholar]
- Peterson, R.A.; Cavanaugh, J.E. Ordered Quantile Normalization: A Semiparametric Transformation Built for the Cross-Validation Era. J. Appl. Stat. 2020, 47, 2312–2327. [Google Scholar] [CrossRef]
- Garrido, L.E.; Frías-Hiciano, M.; Moreno-Jiménez, M.; Cruz, G.N.; García-Batista, Z.E.; Guerra-Peña, K.; Medrano, L.A. Focusing on Cybersickness: Pervasiveness, Latent Trajectories, Susceptibility, and Effects on the Virtual Reality Experience. Virtual Real. 2022, 26, 1347–1371. [Google Scholar] [CrossRef]
- Dużmańska, N.; Strojny, P.; Strojny, A. Can Simulator Sickness Be Avoided? A Review on Temporal Aspects of Simulator Sickness. Front. Psychol. 2018, 9, 2132. [Google Scholar] [CrossRef] [PubMed]
- Sepich, N.C.; Jasper, A.; Fieffer, S.; Gilbert, S.B.; Dorneich, M.C.; Kelly, J.W. The Impact of Task Workload on Cybersickness. Front. Virtual Real. 2022, 3, 943409. [Google Scholar] [CrossRef]
- Flores-Gallegos, R.; Rodríguez-Leis, P.; Fernández, T. Effects of a Virtual Reality Training Program on Visual Attention and Motor Performance in Children with Reading Learning Disability. Int. J. Child Comput. Interact. 2022, 32, 100394. [Google Scholar] [CrossRef]
- Rutkowski, S.; Adamczyk, M.; Pastuła, A.; Gos, E.; Luque-Moreno, C.; Rutkowska, A. Training Using a Commercial Immersive Virtual Reality System on Hand–Eye Coordination and Reaction Time in Young Musicians: A Pilot Study. Int. J. Environ. Res. Public Health 2021, 18, 1297. [Google Scholar] [CrossRef]
- Szpak, A.; Michalski, S.C.; Loetscher, T. Exergaming with Beat Saber: An Investigation of Virtual Reality Aftereffects. J. Med. Internet Res. 2020, 22, e19840. [Google Scholar] [CrossRef]
- Chen, S.; Weng, D. The Temporal Pattern of VR Sickness during 7.5-h Virtual Immersion. Virtual Real. 2022, 26, 817–822. [Google Scholar] [CrossRef]
- Howarth, P.A.; Hodder, S.G. Characteristics of Habituation to Motion in a Virtual Environment. Displays 2008, 29, 117–123. [Google Scholar] [CrossRef]
- Risi, D.; Palmisano, S. Effects of Postural Stability, Active Control, Exposure Duration and Repeated Exposures on HMD Induced Cybersickness. Displays 2019, 60, 9–17. [Google Scholar] [CrossRef]


| Μ | SD | Minimum | Maximum | |
|---|---|---|---|---|
| Age | 27.4 | 5.78 | 18 | 45 |
| Education in Years | 16.8 | 2.04 | 12 | 23 |
| Computing XP | 10.1 | 1.78 | 4 | 12 |
| Smartphone XP | 10.5 | 1.14 | 8 | 12 |
| Virtual Reality XP | 2.53 | 1.02 | 2 | 7 |
| GSQ—Total | 24.5 | 11.5 | 12 | 59 |
| Sport Games Skill | 3.85 | 2.22 | 2 | 10 |
| FPS Games Skill | 4.55 | 3.01 | 2 | 11 |
| RPG Games Skill | 4.09 | 2.93 | 2 | 12 |
| Action Games Skill | 4.21 | 2.69 | 1 | 12 |
| Strategy Games Skill | 3.32 | 2.20 | 2 | 11 |
| Puzzle Games Skill | 4.49 | 2.60 | 2 | 10 |
| MSA-Child | 6.39 | 4.83 | 0 | 18 |
| MSB-Adult | 4.45 | 4.61 | 0 | 18 |
| MSSQ-Total | 10.8 | 8.79 | 0 | 36 |
| VIMSSQ | 3.47 | 4.41 | 0 | 17 |
| CSQ-VR | Μ | SD | Minimum | Maximum |
|---|---|---|---|---|
| Pre-VR–Pre-Task | 7.62 | 1.92 | 6 | 15 |
| Pre-VR–Post-Task | 7.96 | 2.25 | 6 | 15 |
| Pre-Ride–Pre-Task | 8.85 | 3.26 | 6 | 18 |
| Pre-Ride–Post-Task | 9.36 | 4.26 | 6 | 24 |
| Post-Ride–Pre-Task | 14.5 | 7.23 | 6 | 32 |
| Post-Ride–Post-Task | 12.9 | 6.42 | 6 | 33 |
| Post-VR–Pre-Task | 12.2 | 6.02 | 6 | 29 |
| Post-VR–Post-Task | 10.8 | 4.63 | 6 | 23 |
| DLRT (SRT—CRT) | Μ | SD | Minimum | Maximum |
|---|---|---|---|---|
| SRT–Pre-VR | 0.270 | 0.0311 | 0.224 | 0.375 |
| CRT–Pre-VR | 0.439 | 0.0672 | 0.346 | 0.682 |
| SRT–Post-VR | 0.284 | 0.0392 | 0.218 | 0.399 |
| CRT–Post-VR | 0.421 | 0.0520 | 0.311 | 0.566 |
| CRT–Pre-Ride | 0.585 | 0.0948 | 0.437 | 0.867 |
| SRT–Pre-Ride | 0.511 | 0.0753 | 0.370 | 0.759 |
| CRT–Post-Ride | 0.578 | 0.0935 | 0.426 | 0.893 |
| SRT–Post-Ride | 0.500 | 0.0786 | 0.296 | 0.678 |
| Predicted | Predictor | β | p-Value | R2 (Fixed Effects/Overall) |
|---|---|---|---|---|
| CSQ-VR—Total | MSB-Adult | 0.315 | <0.001 *** | 0.175/0.376 |
| VIMSSQ | 0.174 | <0.001 *** | ||
| Smartphone XP | −0.133 | <0.01 ** | ||
| CSQ-VR—Nausea | MSB-Adult | 0.320 | <0.001 *** | 0.098/0.245 |
| CSQ-VR—Vestibular | MSB-Adult | 0.282 | <0.001 *** | 0.087/0.268 |
| Smartphone XP | −0.111 | 0.015 * | ||
| Puzzle Games Skill | 0.094 | 0.042 * | ||
| CSQ-VR—Oculomotor | MSB-Adult | 0.251 | <0.001 *** | 0.156/0.296 |
| VIMSSQ | 0.252 | <0.001 *** | ||
| Strategy Games Skill | 0.117 | 0.009 ** |
| Predicted | Predictor | β | p-Value | R2 (Fixed Effects/Overall) |
|---|---|---|---|---|
| CSQ-VR—Total | FPS Games Skill | −0.281 | <0.001 *** | 0.047/0.247 |
| RPG Games Skill | 0.139 | 0.019 * | ||
| CSQ-VR—Nausea | FPS Games Skill | −0.179 | <0.001 *** | 0.031/0.176 |
| CSQ-VR—Vestibular | FPS Games Skill | −0.212 | <0.001 *** | 0.038/0.218 |
| Puzzle Games Skill | 0.121 | 0.018 * | ||
| CSQ-VR—Oculomotor | FPS Games Skill | −0.175 | 0.002 ** | 0.027/0.165 |
| Strategy Games Skill | 0.155 | 0.005 ** |
Disclaimer/Publisher’s Note: The statements, opinions and data contained in all publications are solely those of the individual author(s) and contributor(s) and not of MDPI and/or the editor(s). MDPI and/or the editor(s) disclaim responsibility for any injury to people or property resulting from any ideas, methods, instructions or products referred to in the content. |
© 2024 by the authors. Licensee MDPI, Basel, Switzerland. This article is an open access article distributed under the terms and conditions of the Creative Commons Attribution (CC BY) license (https://creativecommons.org/licenses/by/4.0/).
Share and Cite
Papaefthymiou, S.; Giannakopoulos, A.; Roussos, P.; Kourtesis, P. Mitigating Cybersickness in Virtual Reality: Impact of Eye–Hand Coordination Tasks, Immersion, and Gaming Skills. Virtual Worlds 2024, 3, 506-535. https://doi.org/10.3390/virtualworlds3040027
Papaefthymiou S, Giannakopoulos A, Roussos P, Kourtesis P. Mitigating Cybersickness in Virtual Reality: Impact of Eye–Hand Coordination Tasks, Immersion, and Gaming Skills. Virtual Worlds. 2024; 3(4):506-535. https://doi.org/10.3390/virtualworlds3040027
Chicago/Turabian StylePapaefthymiou, Sokratis, Anastasios Giannakopoulos, Petros Roussos, and Panagiotis Kourtesis. 2024. "Mitigating Cybersickness in Virtual Reality: Impact of Eye–Hand Coordination Tasks, Immersion, and Gaming Skills" Virtual Worlds 3, no. 4: 506-535. https://doi.org/10.3390/virtualworlds3040027
APA StylePapaefthymiou, S., Giannakopoulos, A., Roussos, P., & Kourtesis, P. (2024). Mitigating Cybersickness in Virtual Reality: Impact of Eye–Hand Coordination Tasks, Immersion, and Gaming Skills. Virtual Worlds, 3(4), 506-535. https://doi.org/10.3390/virtualworlds3040027