Abstract
The challenges climate change poses require careful consideration and addressing within specific industries. In the mining context, climate change introduces potential limitations to the sustainable sourcing of minerals, thereby amplifying the criticality of several metals. However, most studies examining mineral criticality fail to assess the localized impacts of climate change, despite significant variations occurring at a relatively small scale. In this study, we propose a methodological approach for conducting a climate risk assessment in the mining industry, encompassing the identification of relevant hazards, vulnerabilities, and exposure specific to the sector. To illustrate the application of this approach, we utilize micro-level data for the Antofagasta region in Chile, a prominent mining cluster situated in a country projected to be profoundly affected by climate change. The findings of this study underscore the necessity for coordinated efforts in adaptation and climate resilience while offering a valuable tool for allocating resources to more vulnerable locations, thus strengthening the mineral supply chain.
1. Introduction
The mining industry plays a vital role in the supply of minerals necessary to achieve climate change goals. Numerous studies have emphasized the criticality of metals such as copper, lithium, cobalt, and rare earth elements in deploying technological energy solutions [1,2,3,4]. While there is an optimistic outlook that minerals can contribute to a more sustainable future, growing concerns surround the potential impacts of increased mining activities on regions and communities already burdened by long-standing environmental and social consequences associated with mining [5,6,7,8].
Criticality studies have been the predominant methodological approach for assessing the vulnerability of mineral supply chains. Typically, these studies evaluate vulnerability based on factors such as geographical concentration, institutional quality of producing nations, and the by-product nature of the minerals being assessed [1,9]. However, some researchers advocate for including environmental impacts associated with mining activities as variables that influence supply chain vulnerability [6,10,11]. In practical terms, these studies highlight the influence of mining’s environmental implications, as increased extraction intensifies pressure on biodiversity, land use, waste disposal, and water consumption, thereby heightening vulnerability within the supply chain. Nevertheless, these analyses typically overlook environmental factors related to climate change, which can significantly impact the local environment and potentially increase the likelihood of supply disruptions unrelated to mining extraction.
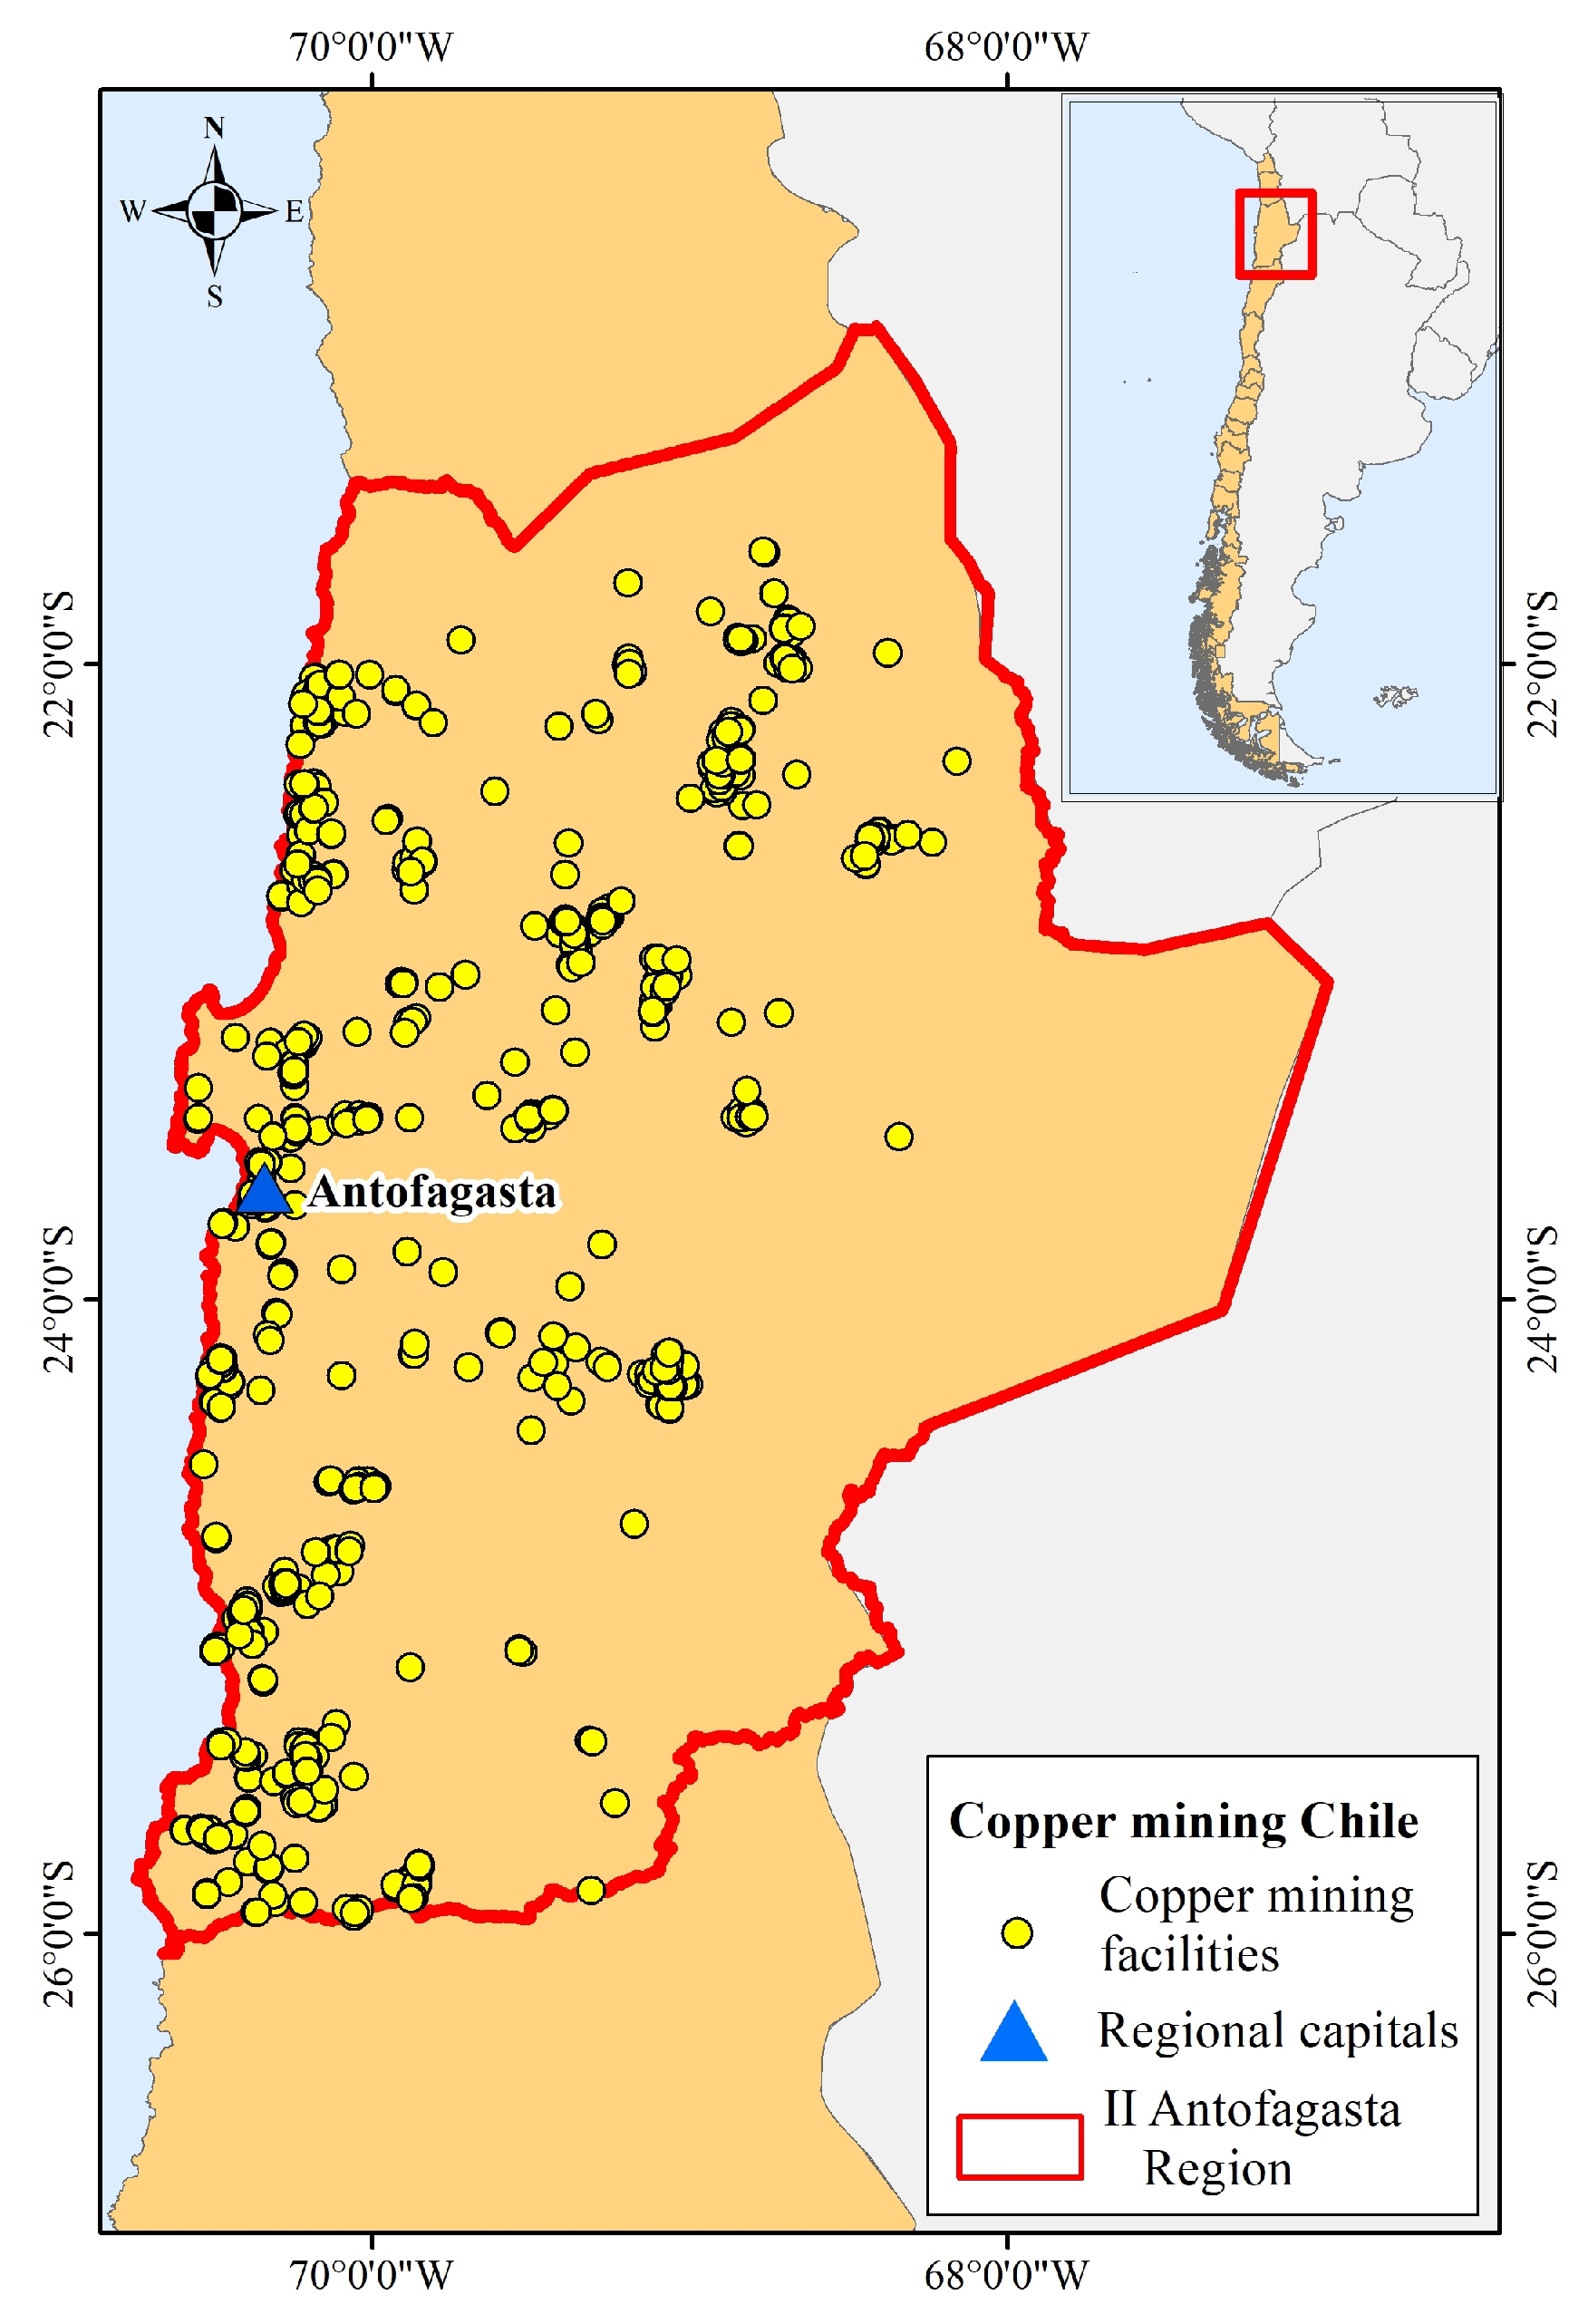
This study proposes a methodological approach to assess climate risks in mining activities, specifically focusing on identifying the primary hazards that impact mine operations. Our approach utilizes geo-referenced data on vulnerabilities and mining facilities, aiming to address the current lack of a comprehensive methodological framework by incorporating climate change as a variable affecting the mineral supply chain. To demonstrate the application of this approach, we implement it in the Antofagasta region of Chile—a prominent mining cluster for key minerals, including copper, lithium, molybdenum, and rhenium, contributing significantly to the country’s mineral production. The region is indicated in Figure 1. Additionally, Chile is particularly vulnerable to various climate hazards such as droughts, water scarcity, increasing extreme rainfall events, and heatwaves [12,13,14].
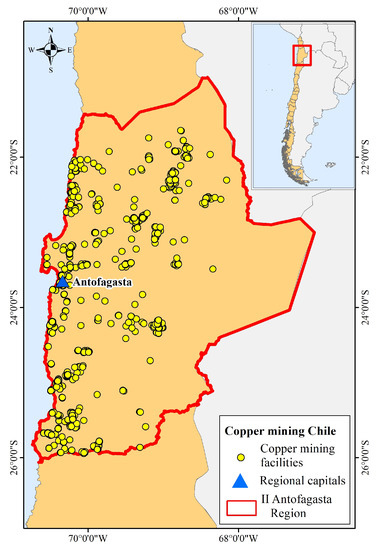
Figure 1.
Location of copper mining operations in the Antofagasta region, Chile. Source: Based on [15].
The case study conducted in the Antofagasta region highlights three crucial aspects for future research on analyzing the vulnerability of mineral supply chains. First, it emphasizes the importance of localized consideration of climate change due to significant variations in climate impacts within the same country. Second, it underscores the need to define impact chains encompassing many mining facilities, as they are susceptible to different climate risks. The heterogeneity in risks creates the potential for alternative risk management strategies, resulting in varying vulnerabilities across different production stages. Third, the case study reveals that droughts pose the most significant climate risk to copper production, with only a few large-scale mine sites anticipated to rely on non-continental water resources.
The subsequent sections of this paper are organized as follows: Section 2 summarizes the existing literature on the intrinsic relationship between mining and climate change. Section 3 presents the methodological approach employed, including developing industry-specific impact chains. The application of the approach to the Antofagasta region in Chile is presented in Section 4. Finally, Section 5 outlines the conclusions.
2. Mining and Climate Change
Human-induced climate change is already impacting weather and climate extremes worldwide [16], with further changes expected in the coming years. According to the Intergovernmental Panel on Climate Change (IPCC), global surface temperatures will continue to rise until at least mid-century under all considered emissions scenarios. Consequently, the climate system will undergo more pronounced changes, including increased frequency and intensity of warm extremes, marine heatwaves, heavy precipitation events, a higher proportion of intense tropical cyclones, and reductions in sea ice, snow cover, and permafrost. Chile, in particular, is projected to face significant climate change impacts [17,18], encompassing issues such as air pollution, increased fire risks, drought, water stress, biodiversity loss, ecosystem damage, and human migration. These hazards profoundly affect various sectors reliant on natural resources in Chile, including the mining industry [19]. Despite some progress, Chile’s policy, infrastructure, and climate readiness still rank in the middle of global indexes [20].
The mining sector in Chile holds a strategic position within the country’s industrial landscape, accounting for 50% of the total export value and possessing a 28.5% global share in copper production. Throughout history, it has played a pivotal role in Chile’s economic growth and development, contributing significantly to the Gross Domestic Product (GDP), tax revenues, export earnings, employment opportunities, and the attraction of investors. However, the sector’s continued contribution relies heavily on the operational profitability of the companies operating within it [21]. According to copper projections provided by [22], a 20.7% increase in copper production is anticipated by 2030, amounting to 7.04 million tons per year, with a growth rate of 1.6%.
Mining in Chile is facing a complex and unprecedented scenario due to the impacts of climate change. On one hand, the mining sector plays a crucial role in the energy transition [23,24], as the production of metals, such as lithium, cobalt, copper, and manganese (which are abundant in Chile), is required for the intensified use of electricity in comparison to fossil fuel consumption [25]. On the other hand, the mining industry must confront the environmental challenges caused by climate change. Unlike other sectors, mining operations are often located in geographically complex areas that are exposed to climate risks. The changing climate can impact the mining sector, including physical effects on mine sites and neighboring communities, social impacts, and consequences for reputation and the economy [26]. Physically, climate change can affect construction, slope stability, and tailings dams [27] and disrupt access points or transportation routes, leading to operational interruptions and production losses. Examples of such impacts can be observed in the first quarter of 2019 when adverse weather conditions resulted in a 5.1% decrease in total copper production in Chile during that period [28]. Additionally, the drought in central Chile significantly affected the operations of Minera Los Pelambres, leading to a 24% reduction in production during the first half of 2022 [29].
The main climatic hazards that affect and could affect the mining sector in Chile include:
- Precipitation and flooding: In the north and center of the country, precipitation will be infrequent but more intense and warmer [30]. Heavy rain can generate floods and natural disasters such as landslides and alluviums [31] that can cause damage to infrastructure and supply networks, causing work stoppages and risks to people’s health and safety [32]. The Bolivian winter phenomenon occurs in northern Chile, causing intense rainfall in the Atacama Desert.
- Droughts: Since 2010, rainfall has been deficient in much of the national territory [33], especially in the central area of the country with decreases of 25 and 50%, compared to a typical year [34], being one of the biggest problems in Chile in the short term. Even though the national mining sector represents 3% of water consumption [35], a large number of operations accumulate in places that experience water stress, so the tension over water use with local communities is likely to intensify [32]. In addition, productivity losses result from water supply shortages, as exemplified by Los Pelambres mine [29].
- Heatwaves: The increase in temperature in northern Chile and altiplano zones will be 1.5 °C. In contrast, in the central zone, the average temperature will increase at a rate of 0.14 °C per decade [36]. Besides the effect on human health, this can cause water availability alterations, restricting summer water reserves and increasing evaporation of tailings [27].
- Sea level rises: Global sea level will rise between 0.39 m to 0.84 m for 2081–2100 according to different scenarios [37]. However, Chile has the advantage of having a high elevation in most of the country, so this hazard would be a manageable risk in the face of climate change [38]. In the mining sector, critical infrastructure can be affected, including desalination plants and ports (the latter of which are already affected by the more substantial swells). Damaged infrastructure will affect operations’ operational continuity due to seawater restrictions and copper exports through shipping.
Climate risk assessment in the mining industry necessitates adopting consistent and reproducible approaches, particularly when climate events lead to human and economic losses [32]. Existing studies evaluating supply chain disruptions have primarily focused on economic, political, social, and, to some extent, environmental factors [1,9,39,40,41,42]. Within the environmental realm, variables such as environmental regulations and future restrictions have been included [43]. Additional approaches involve the assessment of the Environmental Performance Index (EPI), substitution potential, and old scrap recycling [40]. However, these methodologies do not explicitly consider climate change as a measurable factor influencing the vulnerability of the mining supply chain and the criticality of minerals.
3. Methodological Approach
In this section, we present a methodology for assessing climate risk in the mining sector, which is particularly crucial in Chile, where the vulnerability of the mining sector to climate change has not been thoroughly analyzed [44].
Various methodologies exist for assessing climate risks. This project utilized the approach proposed by the Intergovernmental Panel on Climate Change (IPCC) in its fifth assessment report and supplemented it with the vulnerability sourcebook developed by GIZ and EURAC [45], which has already been utilized by institutions and companies in different projects. Bloomberg Associates (BA), the philanthropic consulting arm of Bloomberg Philanthropies, has produced a series of citywide maps that overlay key metrics to identify areas in London that are most susceptible to climate impacts and have high concentrations of vulnerable populations [46]. In Chile, the “Climate Risk Atlas” project (Atlas de Riesgo Climático, ARCLIM, in Spanish), supervised by the Ministry of Environment, has developed over 50 maps illustrating climate risk in different economic and social sectors across the country [32]. Exposure, vulnerability, and hazards are determined based on available data for the specific sector of interest, with input from sector experts to define appropriate metrics.
The approach is based on four fundamental concepts: risk, hazards, vulnerability, and exposure. According to the definitions provided by [45], climate risk is the potential for specific climate-related consequences (climate impacts) on valuable entities, including people, ecosystems, and culture. Hazard refers to the potential occurrence of a natural physical event or physical impact that can result in loss of life, injury, or health impacts, as well as damage and loss to property, infrastructure, livelihoods, service provision, ecosystems, and environmental resources. Vulnerability is defined as the inclination or predisposition to be adversely affected, encompassing sensitivity or susceptibility to harm and a lack of capacity to cope and adapt. Exposure denotes the presence of people, livelihoods, species or ecosystems, environmental functions, services, resources, infrastructure, or economic, social, or cultural assets in areas and settings that could be adversely affected. The climate risk is determined by combining hazard, vulnerability, and exposure, employing an impact chain. Consequently, the risk of potential consequences is defined through the interplay of these three concepts. This methodological approach places emphasis on utilizing publicly available data [47]. For the present analysis, a total of seven databases were employed (see Table 1 for details).

Table 1.
Data used for the development of the work. Source: Own.
Six steps are followed to determine climate risk in the mining system. The first step involves establishing the mining system susceptible to climate hazards. The second step entails studying the potential hazards in the system’s location, specifically Antofagasta, and assessing the risks that the mining system in northern Chile may face. The third step focuses on identifying the system’s vulnerabilities based on the hazards identified in the previous step and the specific links between mining facilities and hazards. The fourth step involves determining the system’s exposure, quantified as the number of mining facilities within a specific area. In the fifth step, each component’s numerical index is determined as the average of indicators involved. This is done using a min-max normalization for each variable at each pixel in the database. The normalization process should represent when an indicator reaches optimal (zero) or critical (one) states; therefore, there is also room for expert judgment defining thresholds [45]. Lastly, the climate risk (R) is calculated as the average interaction of the components: hazards (H), vulnerabilities (V), and exposure (E), where each component ranges from 0 to 1.
Climate risk is calculated by assigning equal importance and equal weighting to the three components. The resulting index falls within the range of 0 to 1, allowing for determining the corresponding risk representation based on this index. Refer to Table 2 for the representation of risk levels.

Table 2.
Risk indexes and levels. Source: Own.
The creation of maps involves the calculation of indexes for each geographical zone. Raster maps are utilized, where each pixel represents the area for which climate risk is calculated. As a result of this methodology, five maps are generated, illustrating climate risk for each impact chain. These maps are produced at a territorial scale of 25 km.
4. A Case Study in the Antofagasta Region, Chile
The Antofagasta region holds significant importance in Chile’s mining sector. This section applies the methodological approach to assess climate risks in the copper mining system. We construct impact chains by considering indexes for hazards in mining facilities and differences in exposure and vulnerability. Subsequently, we analyze the risk assessment and highlight key findings. All the databases utilized in the analysis are provided as Supplementary Material.
4.1. Climate Risk Indexes
The impact chains contain three components: hazards, exposure, and vulnerability. Each component is examined individually through indicators within the context of copper mining in the Antofagasta region.
4.1.1. Hazards
In Antofagasta, three primary climate hazards are considered to affect the mining industry: heavy rains, droughts, and heatwaves.
The region is known for its arid climate [12]. However, unexpected heavy rains can lead to severe infrastructure damage and pose risks to individuals. For instance, in March 2015, heavy rains resulted in 28 fatalities, 59 people missing, and more than 16,000 individuals affected by the damages [48]. Such events also impact the mining sector. In 2019, due to heavy rains, Codelco had to suspend its operations at the Ministro Hales and Chuquicamata mines. Landslides caused by heavy rain are hazards that can potentially endanger lives.
Droughts present an ongoing challenge for mining in Chile, particularly in water-scarce regions like Antofagasta [49]. Desalination has emerged as an effective solution to address water stress in Antofagasta, but it also brings environmental impacts and social considerations [50,51]. The availability and reliability of water resources constitute evident hazards for mining operations in the region.
Heatwaves harm the habitability of mining communities and pose significant risks to the health and safety of workers [52]. The mining industry is vulnerable to heatwaves, which can result in heart attacks, hyperthermia, and potentially even fatalities if individuals’ body temperatures exceed 40 degrees Celsius. Heatwaves also adversely affect productivity, reducing efficiency and impairing decision-making under extreme conditions [53]. Table 3 presents the hazard variables associated with heatwaves. The data for these variables is shown in a 5 km by 5 km grid format. It is worth noting that this grid is the minimum point of analysis, and there can be several mining facilities, companies, and operations within that range, limiting linking the analysis to individual miners.

Table 3.
Hazard variables and measures considered for copper mining in the Antofagasta region. Source: Own.
All data is normalized between zero and one using min-max normalization, depending on the change between future climate conditions and historical values, as indicated in Table 4. The 95th percentile was considered as the threshold for maximum values to represent extreme alterations as critical (in the top 5% of data in the region).

Table 4.
Hazard variables normalization for copper mining in the Antofagasta region. Source: Own.
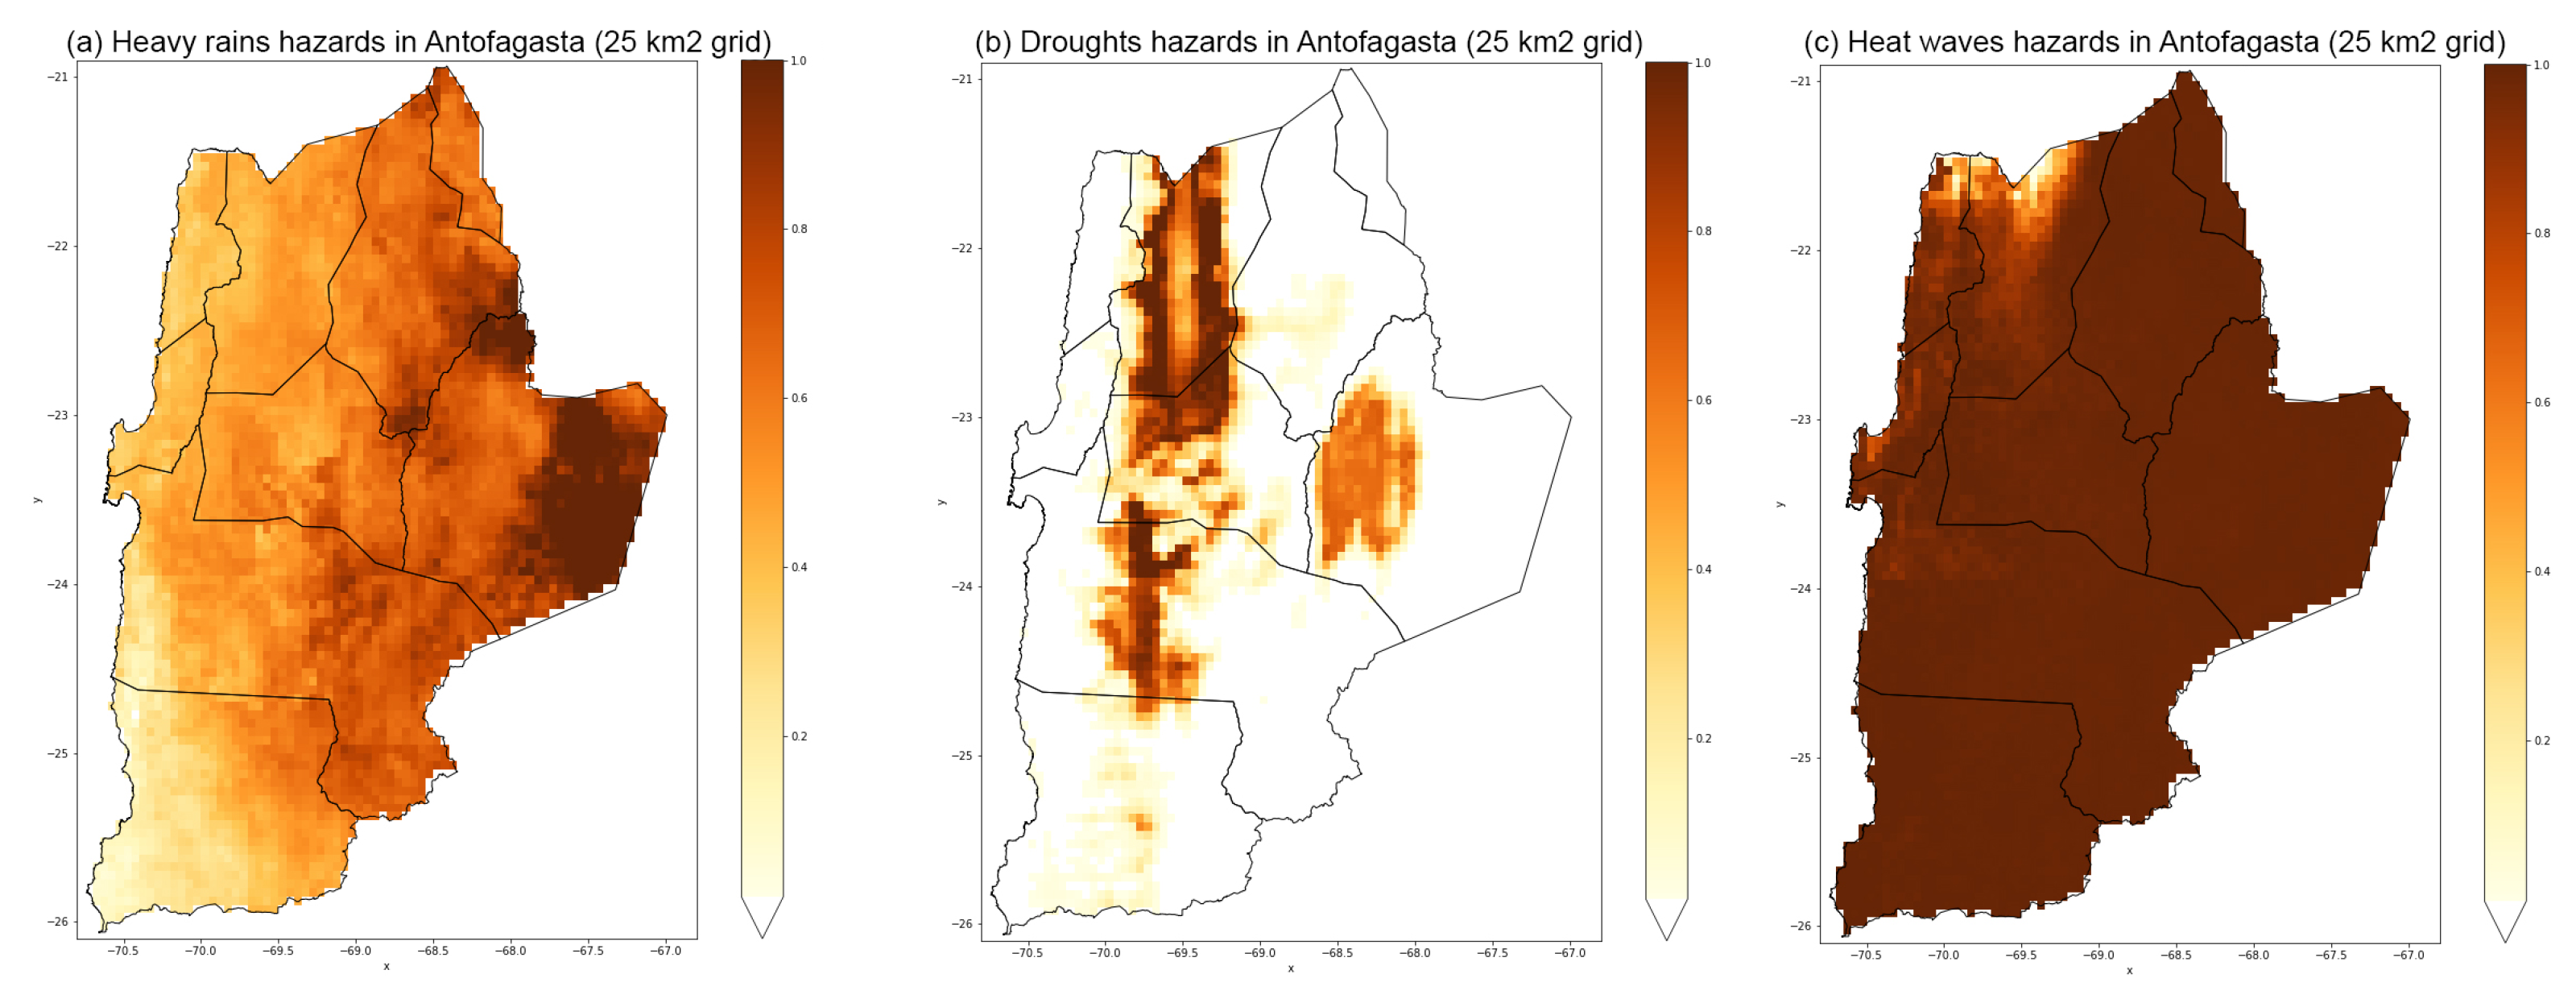
The distribution of climate hazards in Antofagasta appears in Figure 2. Figure 2a indicates that heavy rain is a more serious concern in the region’s eastern part. Figure 2b shows that droughts are a significant issue in the entire region, while Figure 2c illustrates a higher expectation of heatwaves in the middle zone.
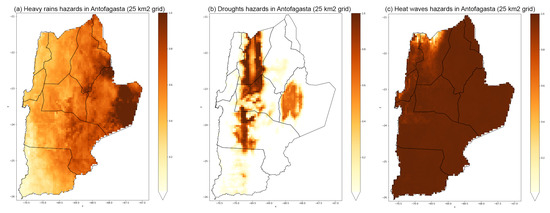
Figure 2.
Climate hazard maps in the Antofagasta region, Chile. (a) shows heavy rains hazards, (b) indicates droughts hazards, and lastly, (c) shows heatwave hazards. Every pixel represents 25 km. Source: Based on ARClim database [54].
4.1.2. Exposure
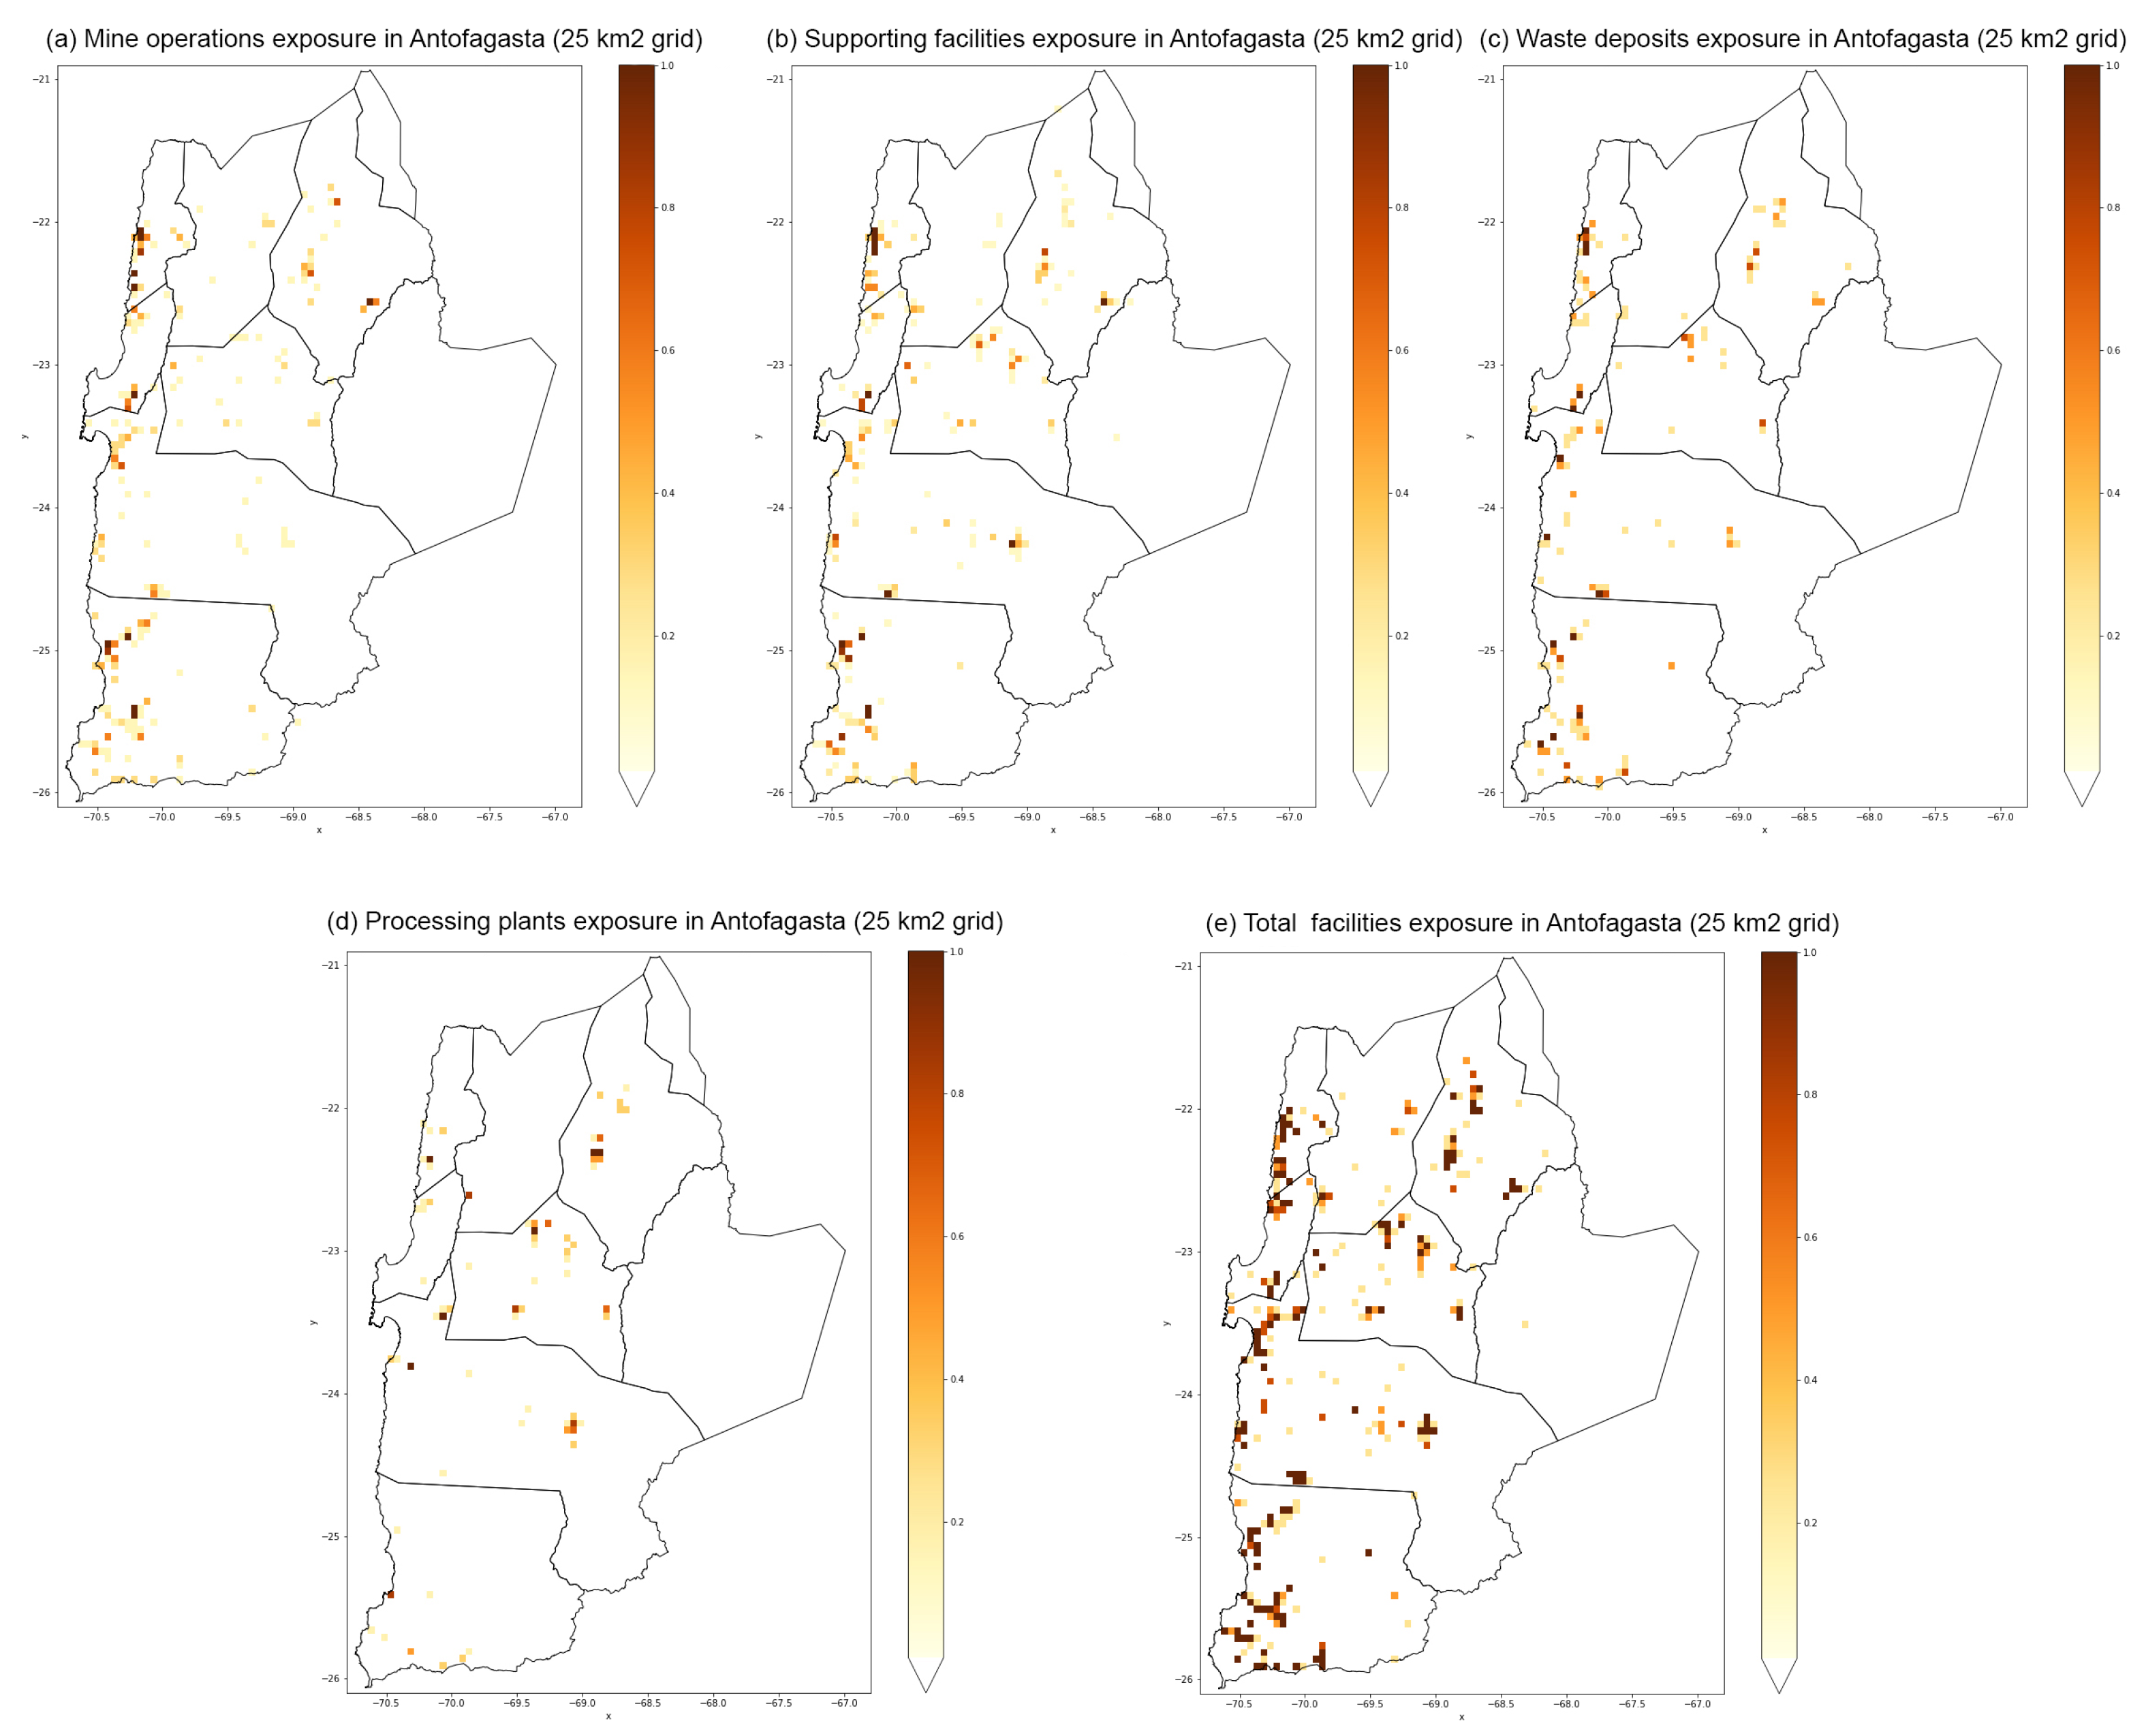
Exposure refers to the component within the mining industry that can be affected by climate hazards. Different facilities along the supply chain are susceptible to varying degrees of impact from climate events in the copper mining industry in the Antofagasta region. The analysis considers four key facilities based on the Chilean mining facilities database [15], and data is shown in Figure 3. For each type of facility, the exposure index is determined by the number of the same type of facilities within each pixel (25 km):
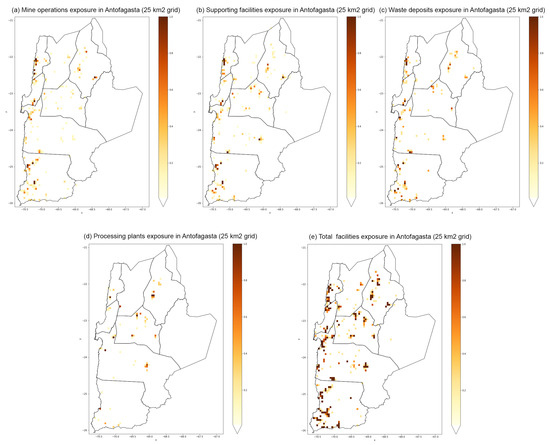
Figure 3.
Exposure for mining facilities in the Antofagasta region, Chile. (a) Mine operations, (b) Supporting facilities, (c) Waste deposits, (d) Processing plants, (e) Total facilities. Every pixel represents 25 km. Source: Based on Sernageomin [15].
- Mine operations: These facilities involve the extraction of minerals and waste rocks using either underground or open-pit methods. The maximum number of mine operations for normalization purposes is six for the Antofagasta region.
- Processing plants: These facilities encompass all infrastructure necessary for producing marketable mineral products, such as copper concentrate, electro-winning cathodes, and electro-refined cathodes. The maximum number of processing plants for normalization purposes is six for the Antofagasta region.
- Waste deposits: These facilities encompass areas dedicated to the storage of discarded materials, waste rock, slag deposits, spent ore, and tailings dams. The maximum number of waste deposits for normalization purposes is four for the Antofagasta region.
- Supporting facilities: These facilities include transportation infrastructure, ports, and water and electricity infrastructure specifically designed to support mining activities. The maximum number of supporting facilities for normalization purposes is nine for the Antofagasta region.
Regarding risk assessment, we focus on how previously defined hazards affect key elements of a mine. For example, heavy rains can affect mine operations (disrupting the extraction process), waste deposits by increasing their instability, and supporting facilities (e.g., landslide cutting transportation roads). Even though droughts affect all facilities, we focus on the impact on processing plants, which are by far the largest water consumer in copper mines [55]. Lastly, heatwaves can affect equipment and people, but we focus primarily on people and they are involved in all four mining facilities.
4.1.3. Vulnerability
Vulnerability is a complex measure that reflects the capacity to adapt to changing climate conditions in the future. Several indicators can be used in practice depending on available data and the consensus of the participatory process from all stakeholders involved [45]. As a first approximation, we consider five distinct vulnerability factors related to each of the four facilities mentioned in Section 4.1.2 through different mechanisms. These factors include mine operation size, topography, coordination between companies, distance to health centers, and access to seawater resources. Each vulnerability factor and its reasonability are depicted below.
- Mine operation size. Mine size plays a role in the company’s ability to access financial resources and implement climate resilience solutions. Conversely, smaller mine operations have a lower adaptive capacity to changing environmental conditions, increasing their vulnerability. Mining facilities are classified based on their size, ranging from artisanal mining to large-scale mining. The Chilean Geological and Mining Service (SERNAGEOMIN) classifies operations as large-scale if they have over 400 workers, medium-scale mining between 80 and 400 workers, small-scale between 12 and 80 workers, and artisanal mining if they have fewer than 12 workers [56] (p. 179). We have used this classification to assign vulnerability factors to each facility as indicated in the following Table 5. The presented scale indicates that despite all operations being vulnerable to hazards, small- and artisanal-scale mine operations are significantly more vulnerable, as they commonly lack sufficient safety and protective measures [57]. This factor is expected to affect the risk calculation for all mining facilities across all hazards.
 Table 5. Vulnerability factor for the mine operation size. Source: Own.
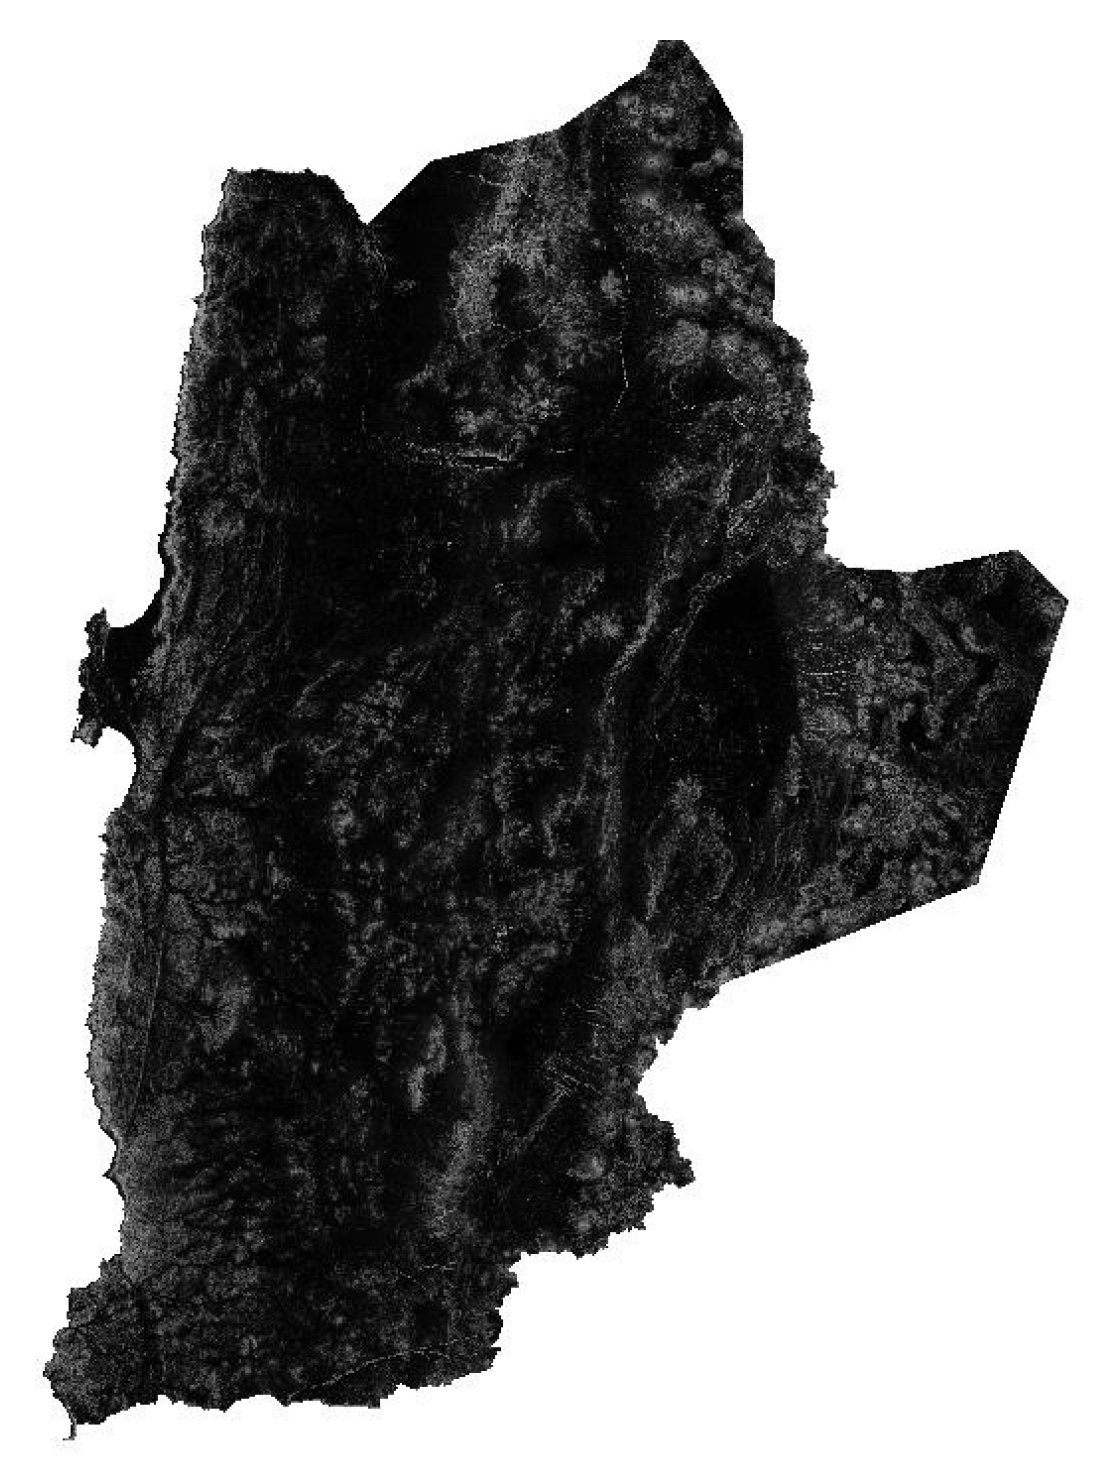
 - Topography. Topography affects mining activities, particularly in relation to landslides during heavy rain events. Topography is determined from the DEM of the Antofagasta region. The slope for each mining facility (in degrees) is obtained from satellite images as shown in Figure 4 Lighter areas represent higher altitudes and the maximum threshold considered is 35 degrees.
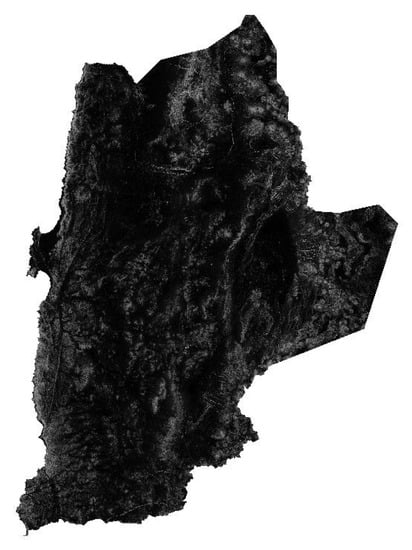 Figure 4. Topography of the Antofagasta region, Chile. Source: adapted from Google Earth Engine.
 - Access to seawater resources. The Antofagasta region host the Atacama desert, the most arid desert in the world. In this context, copper mines has been historically operating under stringent conditions of water availability. The major response to water scarcity in the region has been through desalination plants, especially for lager operations. Considering the ongoing process of adaptation in the copper mining industry in Chile, access to water resources is evaluated based on two variables: the availability of desalinated water (which reduces stress on continental water sources) and the distance to seawater plants (as it indicates the potential to access to existing plants to solve water supply issues). The maximum distance for facilities in the region is 162 km. For companies that already have invested in desalination, the indicator represents the percentage of continental water used. This means that a company only using seawater will have a value of zero in this variable. In this way, the index provides a means of assessing the adaptability to drought conditions in the Antofagasta region. As previously mentioned, this vulnerability factor is considered only in processing plants, as they are the largest facility type in terms of water consumption in copper mining.
- Distance to health centers. Proximity to health centers enables better management of human impacts during heatwaves. People facing the impacts of heatwaves should be less vulnerable if health centers are closer to the mining facility involved in the analysis. In this case, the maximum threshold was set in 100 km, roughly representing the distance in which someone suffering the effects of heatwaves within one hour. It should also be considered than medium-scale and large-scale miners have internal health services. To take this into consideration, medium- and large-scale companies are given a value of zero in this variable.
- Coordination between companies. Higher number of different mine owners makes coordination more challenging, requiring more effort to reach consensus on adaptation measures. This variable is expected to give a proxy of viability to implement actions against climate change in the very local area. In Antofagasta, the maximum number of different companies within 25 km is 37. A large number of agents involved will make negotiation more difficult, as transaction costs increase with the number of parties [58]. This factor is considered for all mining facilities exposed.
A summary of vulnerability factors considered in the analysis are presented in Table 6

Table 6.
Vulnerability factors and their related mining facilities. The hazard associated with each facility is indicated in parentheses. Source: Own.
It is worth mentioning that we have not included socio-economic or institutional variables that could affect the vulnerability of each operation. Those, for example, can be how disadvantaged groups relate to mining facilities, as increasing poverty rates can increase the risk from a social point of view, as impacts on mining facilities can be more severe for communities. There can be variables difficult to measure, like the trust in mining activity of local institutions, which can support adaptive measures, decreasing climate risks. A more in-depth vulnerability assessment requires a specific analysis and project to tackle socio-economic aspects with key stakeholders.
4.2. Climate Risk Assessment
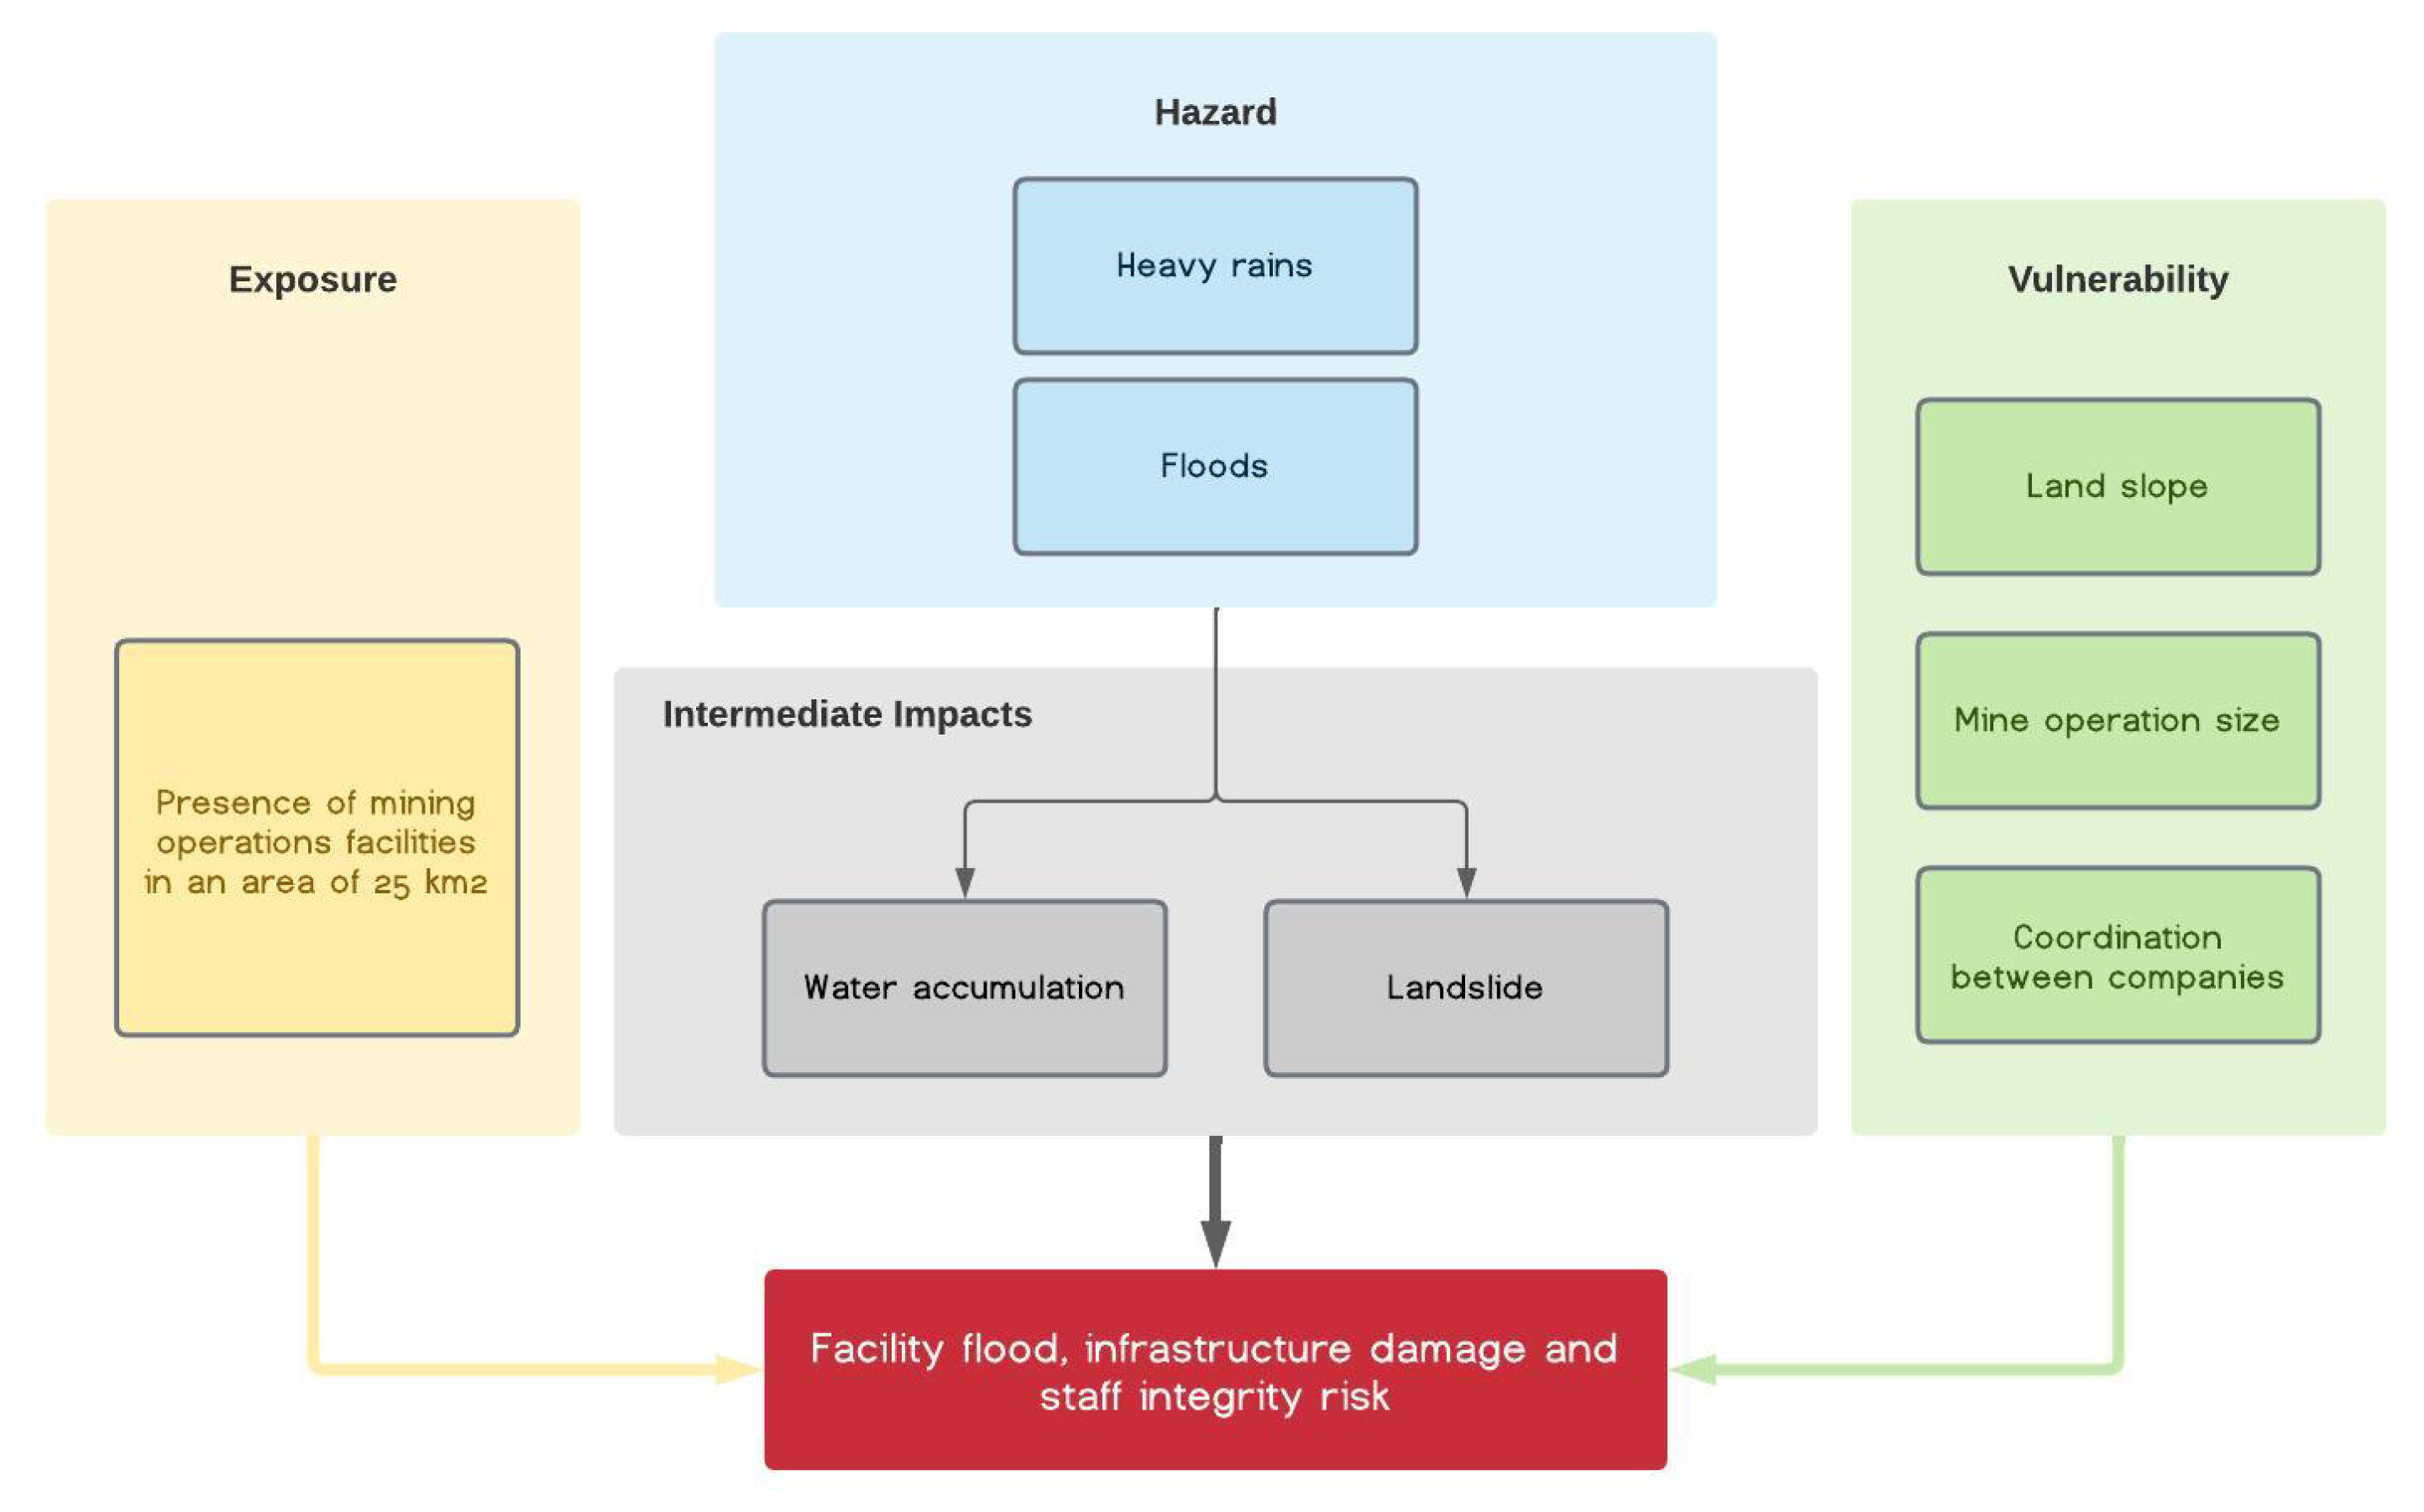
The analysis incorporates the combination of hazards, exposure, and vulnerability to identify five key risks in the mining industry: (i) heavy rains risk on mine operations, (ii) heavy rains risk on waste deposits, (iii) heavy rains risk on supporting facilities, (iv) heatwaves in all mining facilities, and (v) droughts in processing plants. The impact chains for each risk are provided as Supplementary Material. Figure 5 presents an example of the impact chain for the heavy rains risk on mine operations.
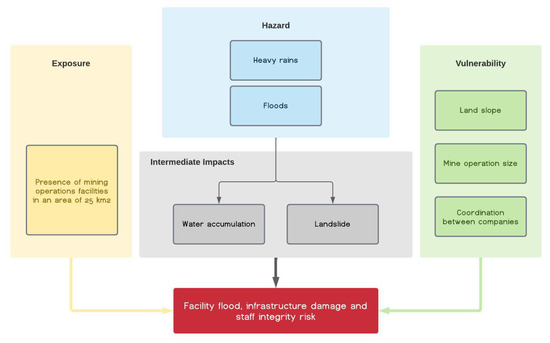
Figure 5.
Impact chain for heavy rains risk affecting mine operations. Source: Own.
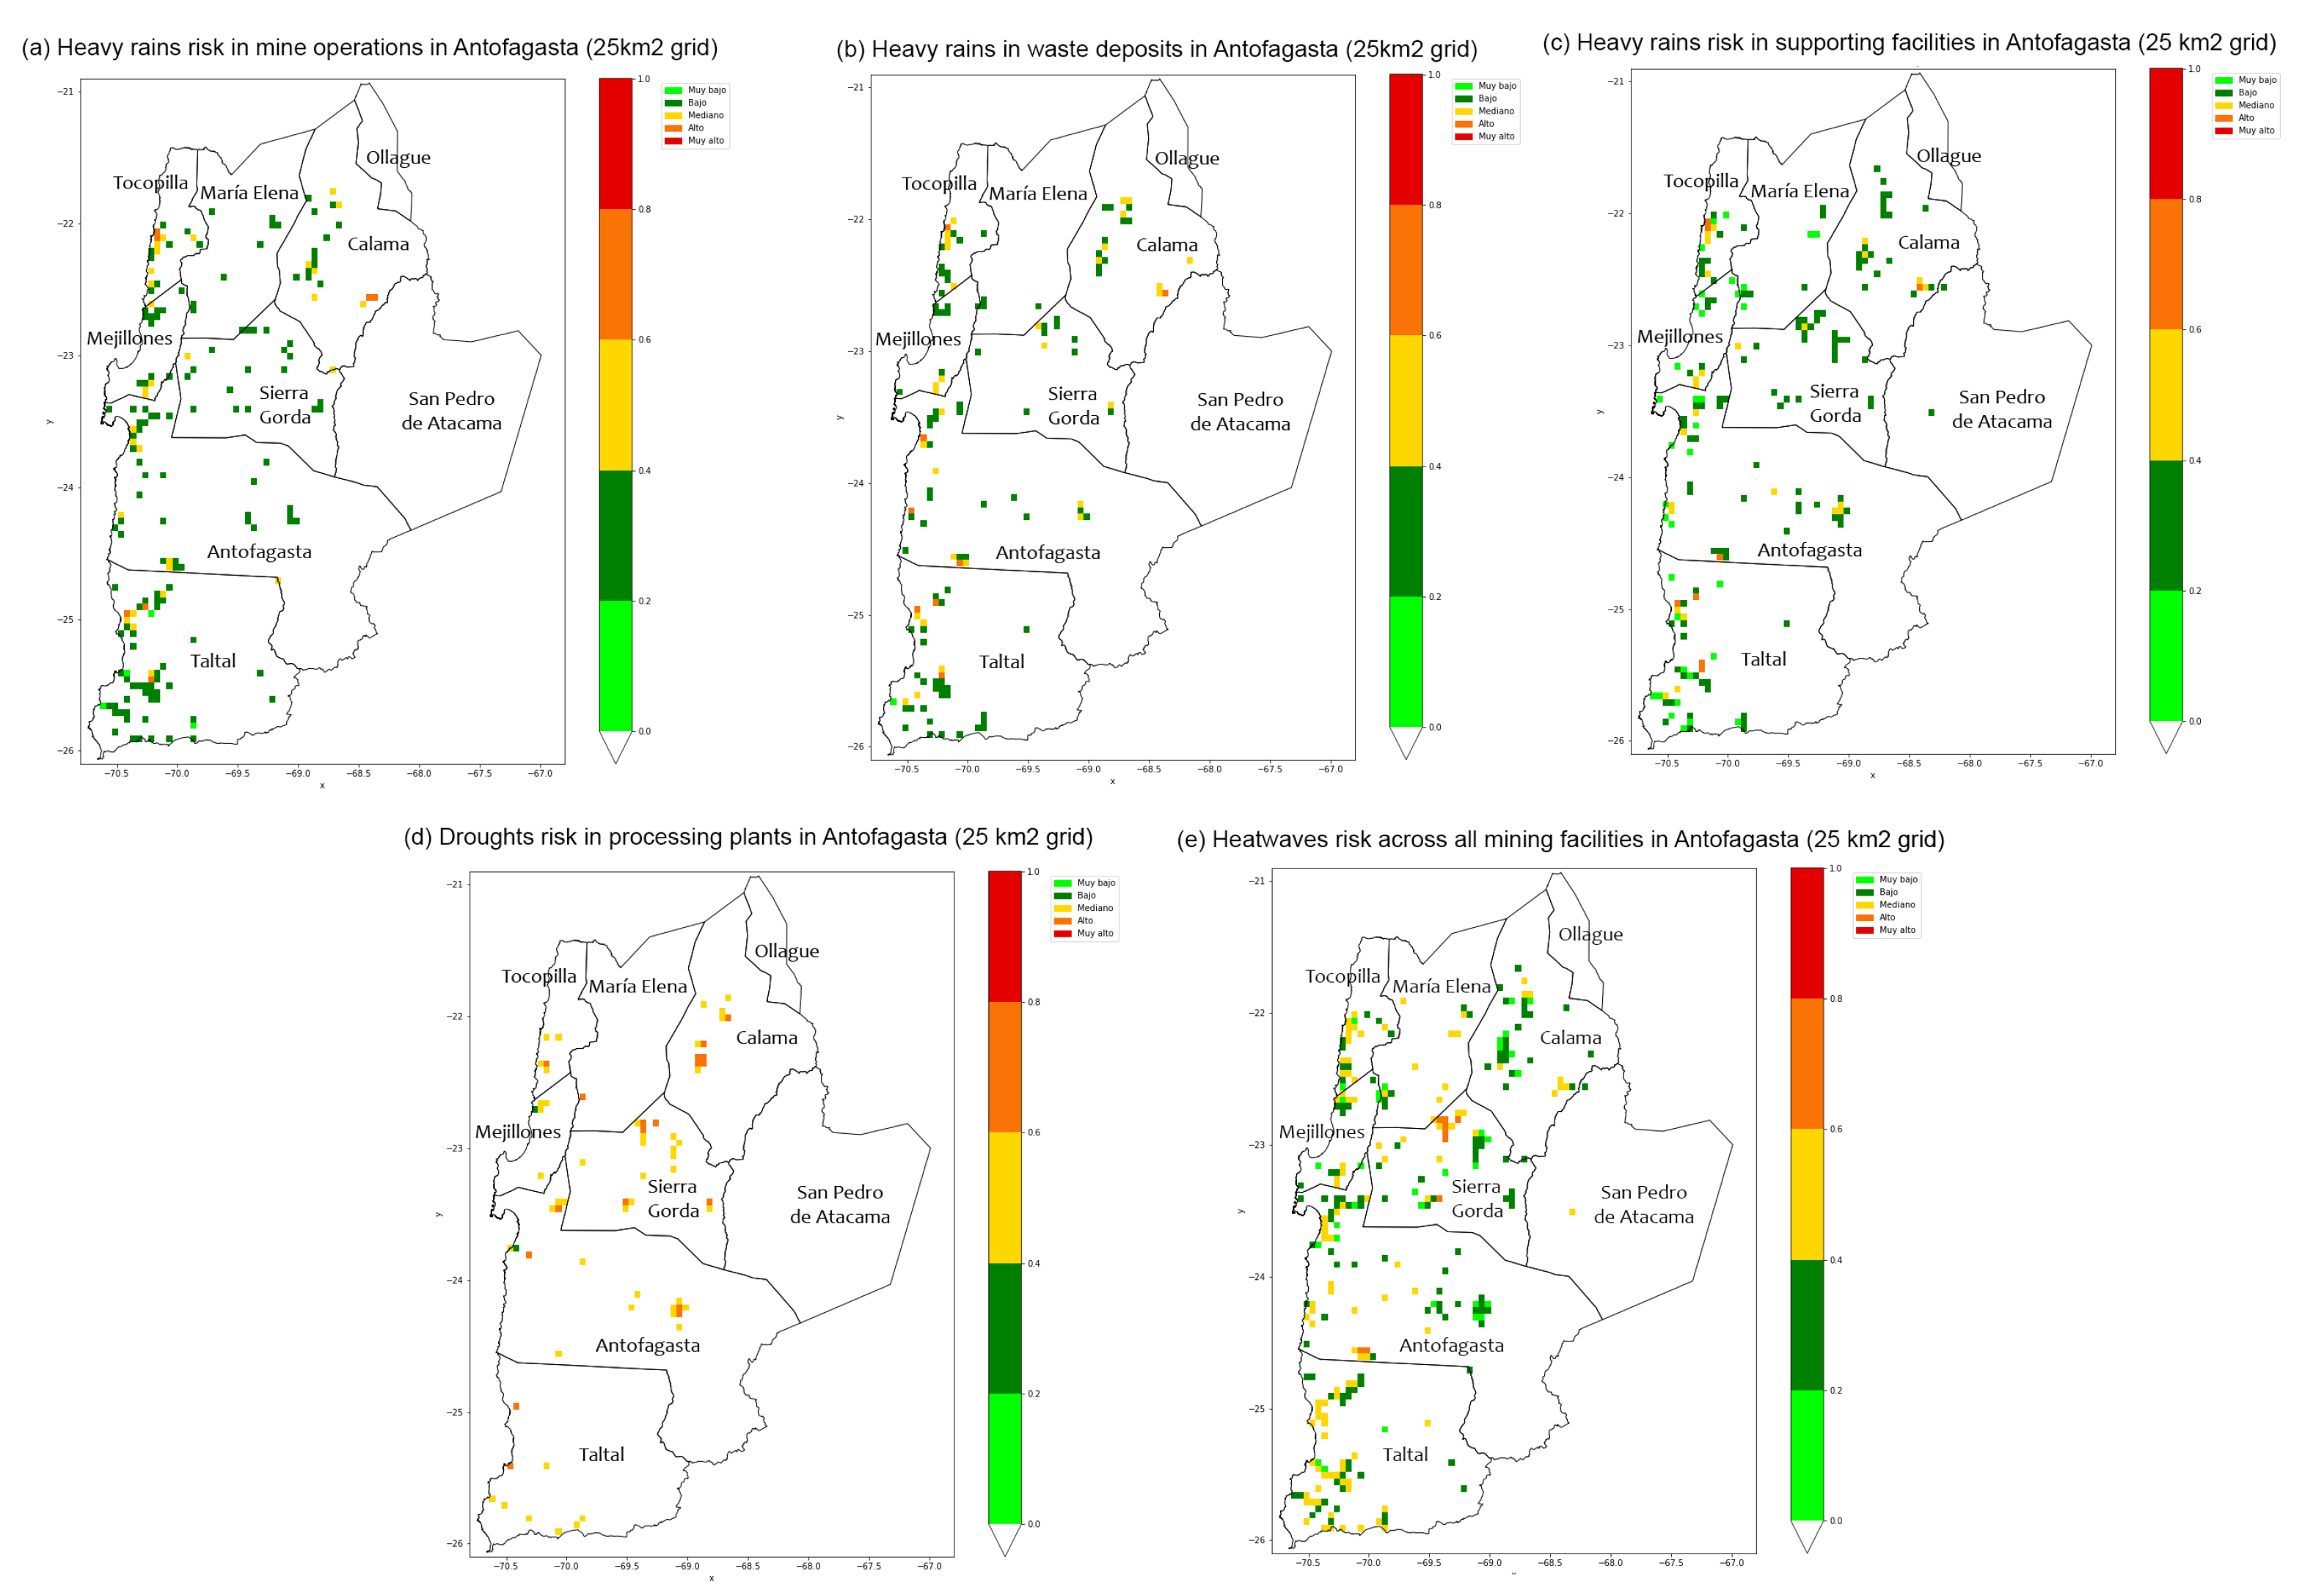
Risk assessment takes into account the major hazards affecting each mining facility. For instance, heavy rains can lead to soil instability, impacting mine operations, waste deposits, and supporting facilities such as roads and power grids. Landslides triggered by heavy rains can damage infrastructure and disrupt production. Processing plants, the largest water consumers in the mining industry, are particularly vulnerable to droughts. Heatwaves pose a risk across all mining facilities as workers move throughout the entire site. The graphical representation of the risks determined by the impact chains varies depending on the specific hazard, as depicted in Figure 6.
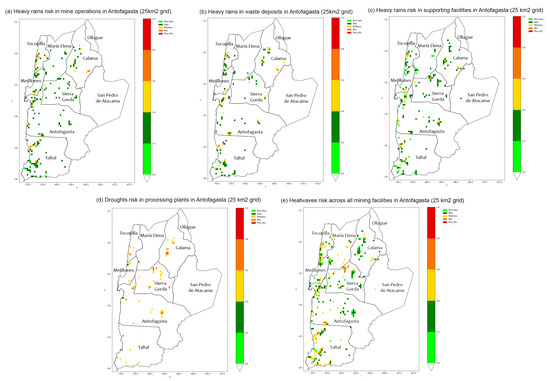
Figure 6.
Climate risks for copper mining facilities in Antofagasta, Chile. (a) Heavy rains risk in mine operations. (b) Heavy rains risk in waste deposits. (c) Heavy rains risk in supporting facilities. (d) droughts in processing plants. (e) Heatwaves across all mining facilities. Source: Own.
Figure 6a–c indicate that heavy rain is not a significant concern for copper mining facilities in Antofagasta, which aligns with the high level of operational safety and control measures implemented in the region. However, there is a slightly higher risk associated with waste deposits, particularly in the Eastern region near the Andes mountains. Failures or instability in waste deposits can threaten communities and the environment. Figure 6d clearly highlights the significant risk of droughts in processing plants, given the limited availability of water resources. The copper supply chain is susceptible to disruptions in water supply. Lastly, Figure 6e identifies two riskier zones: the first located in northern Sierra Gorda and the second closer to the coast, between northern Taltal and southern Antofagasta. The presence of medium-scale mining operations and higher climatic events can explain the higher risk in Sierra Gorda, while the numerous small-scale operations in Taltal contribute to increased risk. Heatwaves are expected to have a relatively minor impact on large-scale mining, where most of Chile’s copper production occurs. However, small-scale miners, who rely more on public health services, are significantly affected by heatwaves.
5. Conclusions
The interconnection between the energy transition and the mining industry is undeniable, as minerals are the foundation for developing green technologies. However, this relationship is bidirectional, as climate change poses significant threats to mine operations for critical minerals. Although the inverse relationship has gained attention, a comprehensive assessment requires detailed local-level data, which is often lacking. Climate risk assessment necessitates the analysis of three key variables: hazards, exposure, and vulnerability. The combination of these factors enables the identification of zones that are more susceptible to supply disruptions.
In this study, we have developed and implemented a methodological approach to assess climate risk in mining facilities, considering various factors that encompass hazards, exposure, and vulnerability. To exemplify the climate risk assessment, we focused on the Antofagasta region in Chile, a crucial hub for copper production, a critical mineral for the advancement of electrification. The identified key hazards in the region include heavy rains, droughts, and heatwaves, which affect different mining facilities in distinct ways. The response of exposed facilities to these hazards depends on their vulnerability factors. We incorporated five vulnerability factors in our assessment: topography, mine size, distance to health centers, access to water resources, and coordination of nearby companies. Our findings indicate that droughts pose the most significant climate risk to large-scale copper production processing plants, with limited operations implementing adaptation measures.
The presented methodology represents a significant step toward climate risk assessment in the mining industry. However, some areas require further development. First, the lack of scientific data on local-level variability hinders the comprehensive assessment of hazards such as sea-level rise. This limitation affects the determination of suitable port locations for mineral transportation and the identification of areas suitable for desalination plants. Second, data availability is unavailable to generate an analysis for specific mining operations, which hinders the possibility of preparing detailed recommendations based on the risk assessment for individual cases. Third, there is a need to further study vulnerability factors beyond those considered in this study. Social and institutional elements are crucial in adapting to changing climate conditions and including local communities in decision-making. Incorporating these variables into the methodology can be part of a more participatory approach to generate specific social measures that further enhance its effectiveness and ability to pinpoint adaptation measures. Fourth, it should be noticed that forecasting weather events contains uncertainty about how unknown events will unravel. Changing models and data availability implies that risk assessments should be revised periodically to better incorporate new knowledge. All previous aspects are potential avenues for future research on the climate risk assessment of mining operations.
Supplementary Materials
The following supporting information can be downloaded at: https://www.mdpi.com/article/10.3390/commodities2030015/s1.
Author Contributions
Conceptualization, E.C. and L.F.O.; methodology, J.I.D.R. and E.C.; software, J.I.D.R. and P.F.; validation, J.I.D.R.; formal analysis, J.I.D.R., E.C. and L.F.O.; investigation, J.I.D.R. and P.F.; resources, J.I.D.R. and P.F.; data curation, J.I.D.R.; writing—original draft preparation, J.I.D.R.; writing—review and editing, E.C.; visualization, J.I.D.R. and P.F.; supervision, E.C. and L.F.O.; project administration, E.C. and L.F.O.; funding acquisition, E.C. and L.F.O. All authors have read and agreed to the published version of the manuscript.
Funding
This research was funded by FONDEF ID 20I10147. E.C. was partially supported by UCH VID UI-011/22. L.F.O. gratefully acknowledges the financial support from the basal project AFB220002 of the Advanced Mining Technology Center (AMTC) and the ANID/FONDAP/15110019 of the Solar Energy Center (SERC).
Institutional Review Board Statement
Not applicable.
Informed Consent Statement
Not applicable.
Data Availability Statement
Data supporting results are included as Supplementary Material.
Acknowledgments
The authors would like to express their gratitude and appreciation to all participants in the mining and climate change project at Universidad de Chile.
Conflicts of Interest
The authors declare no conflict of interest.
References
- Schrijvers, D.; Hool, A.; Blengini, G.A.; Chen, W.Q.; Dewulf, J.; Eggert, R.; van Ellen, L.; Gauss, R.; Goddin, J.; Habib, K.; et al. A review of methods and data to determine raw material criticality. Resour. Conserv. Recycl. 2020, 155, 104617. [Google Scholar] [CrossRef]
- Hayes, S.M.; McCullough, E.A. Critical minerals: A review of elemental trends in comprehensive criticality studies. Resour. Policy 2018, 59, 192–199. [Google Scholar] [CrossRef]
- IEA (International Energy Agency). The Role of Critical Minerals in Clean Energy Transitions; IEA Publications: Paris France, 2021; p. 283. [Google Scholar]
- Bazilian, M.D. The mineral foundation of the energy transition. Extr. Ind. Soc. 2018, 5, 93–97. [Google Scholar] [CrossRef]
- Lèbre, É.; Owen, J.R.; Corder, G.D.; Kemp, D.; Stringer, M.; Valenta, R.K. Source Risks As Constraints to Future Metal Supply. Environ. Sci. Technol. 2019, 53, 10571–10579. [Google Scholar] [CrossRef] [PubMed]
- Lèbre, É.; Stringer, M.; Svobodova, K.; Owen, J.R.; Kemp, D.; Côte, C.; Arratia-Solar, A.; Valenta, R.K. The social and environmental complexities of extracting energy transition metals. Nat. Commun. 2020, 11, 4823. [Google Scholar] [CrossRef] [PubMed]
- Ali, S.H.; Giurco, D.; Arndt, N.; Nickless, E.; Brown, G.; Demetriades, A.; Durrheim, R.; Enriquez, M.A.; Kinnaird, J.; Littleboy, A.; et al. Mineral supply for sustainable development requires resource governance. Nature 2017, 543, 367–372. [Google Scholar] [CrossRef]
- Jowitt, S.M.; Mudd, G.M.; Thompson, J.F.H. Future availability of non-renewable metal resources and the influence of environmental, social, and governance conflicts on metal production. Commun. Earth Environ. 2020, 1, 13. [Google Scholar] [CrossRef]
- Graedel, T.E.; Harper, E.M.; Nassar, N.T.; Nuss, P.; Reck, B.K.; Turner, B.L. Criticality of metals and metalloids. Proc. Natl. Acad. Sci. USA 2015, 112, 4257–4262. [Google Scholar] [CrossRef]
- Graedel, T.E.; Barr, R.; Chandler, C.; Chase, T.; Choi, J.; Christoffersen, L.; Friedlander, E.; Henly, C.; Jun, C.; Nassar, N.T.; et al. Methodology of metal criticality determination. Environ. Sci. Technol. 2012, 46, 1063–1070. [Google Scholar] [CrossRef]
- Frenzel, M.; Kullik, J.; Reuter, M.A.; Gutzmer, J. Raw material ‘criticality’—Sense or nonsense? J. Phys. D Appl. Phys. 2017, 50, 123002. [Google Scholar] [CrossRef]
- Schulz, N.; Boisier, J.P.; Aceituno, P. Climate change along the arid coast of northern Chile. Int. J. Climatol. 2012, 32, 1803–1814. [Google Scholar] [CrossRef]
- Valdés-Pineda, R.; Pizarro, R.; García-Chevesich, P.; Valdés, J.B.; Olivares, C.; Vera, M.; Balocchi, F.; Pérez, F.; Vallejos, C.; Fuentes, R.; et al. Water governance in Chile: Availability, management and climate change. J. Hydrol. 2014, 519, 2538–2567. [Google Scholar] [CrossRef]
- Piticar, A. Changes in heat waves in Chile. Glob. Planet. Chang. 2018, 169, 234–246. [Google Scholar] [CrossRef]
- Sernageomin. Faenas mineras—Conjuntos de Datos—Portal de Datos Abiertos. 2016. Available online: https://datos.gob.cl/dataset/27824 (accessed on 14 July 2023).
- IPCC. Summary for Policymakers; Cambridge University Press: Cambridge, UK, 2021; pp. 3–22. [Google Scholar] [CrossRef]
- World Bank. Turn down the Heat: Climate Extremes, Regional Impacts, and the Case for Resilience; World Bank: Washington, DC, USA, 2013. [Google Scholar]
- World Bank. Climate Risk Country Profile: Chile; World Bank: Washington, DC, USA, 2021; pp. 494–496. [Google Scholar]
- Centro UC Cambio Global. Empresas y Cambio Climático en Chile: El Camino Hacia una Adaptación Sostenible; Technical Report; Acción Empresas: Santiago, Chile, 2018. [Google Scholar]
- Madeira, C. A review of the future impact of climate change in Chile: Economic output and other outcomes. Mitig. Adapt. Strateg. Glob. Chang. 2022, 27, 56. [Google Scholar] [CrossRef]
- COCHILCO. Indicadores de Productividad de la Minería del Cobre en Chile al 2019; Technical Report; COCHILCO: Santiago, Chile, 2020.
- COCHILCO. Proyección de la Producción de Cobre en Chile 2019–2030; Technical Report; COCHILCO: Santiago, Chile, 2019.
- Kracht, W.; Salinas, B. Minería y Cambio Climático; Technical Report; Beauchef Minería: Santiago, Chile, 2021. [Google Scholar]
- Russell, C. Column: Mining Is Key to the Energy Transition, but It’s Still Unloved; Reuters. 2022. Available online: https://www.reuters.com/business/energy/mining-is-key-energy-transition-its-still-unloved-russell-2022-05-11/#:~:text=Climate%20Change-,Column%3A%20Mining%20is%20key%20to%20the,transition%2C%20but%20it’s%20still%20unloved&text=CAPE%20TOWN%2C%20May%2011%20(Reuters,the%20laggard%20in%20the%20process (accessed on 14 July 2023).
- Hund, K.; La Porta, D.; Fabregas, T.; Laing, T.; Drexhage, J. Minerals for Climate Action: The Mineral Intensity of the Clean Energy Transition; Technical Report; World Bank: Washington, DC, USA, 2020. [Google Scholar]
- The Mining Association of Canada. Guide on Climate Change Adaptation for the Mining Sector; Technical Report; MAC: Ottawa, ON, Canada, 2021. [Google Scholar]
- Pearce, T.D.; Ford, J.D.; Prno, J.; Duerden, F.; Pittman, J.; Beaumier, M.; Berrang-Ford, L.; Smit, B. Climate change and mining in Canada. Mitig. Adapt. Strateg. Glob. Chang. 2011, 16, 347–368. [Google Scholar] [CrossRef]
- Minería Chilena. El Abra, Codelco y Escondida Lideran caída de Producción de Cobre por Lluvias. 2019. Available online: https://www.mch.cl/2019/05/08/el-abra-codelco-y-escondida-lideran-caida-de-produccion-de-cobre-por-lluvias/ (accessed on 14 July 2023).
- Antofagasta Minerals. Antofagasta Minerals Resultados de Producción Primer Trimestre 2022. 2022. Available online: https://www.aminerals.cl/centro-de-informacion/resultados-de-producci%C3%B3n (accessed on 14 July 2023).
- Molina, C.; Lagos, M. Evaluación Hidrometeorológica de la Ocurrencia de Aluviones Incorporando Proyecciones del Cambio Climático en la Cuenca de los Ríos el Carmen y el Tránsito, Chile; Technical Report; University of Chile: Santiago, Chile, 2019. [Google Scholar]
- Terlien, M.T. The determination of statistical and deterministic hydrological landslide-triggering thresholds. Environ. Geol. 1998, 35, 124–130. [Google Scholar] [CrossRef]
- Rivera, D.; Pagliero, L.; Murillo, G.; McIntyre, N.; Aitken, D.; Godoy, A. Informe Proyecto Arclim: Minería; Technical Report; Centro de Recursos Hídricos para la Agricultura y la Minería de la Universidad del Desarrollo, Centre for Water in the Minerals Industry, Sustainable Minerals Institute de la University of Queensland, Sustainable Minerals Institute-Chile y Centro de Inve: Santiago, Chile, 2020. [Google Scholar]
- Biblioteca del Congreso Nacional. Emergencia Hídrica: Sequía en la Zona Central del País; BCN: Valparaiso, Chile, 2015. [Google Scholar]
- Dirección Meteorológica de Chile. Anomalías Pluviométricas en el año 2010 y Proyecciones para el año 2011; DMC: Santiago, Chile, 2011. [Google Scholar]
- Dirección General de Aguas. Atlas del Agua; Series de Estudios Básicos DGA: Santiago, Chile, 2016; pp. 104–133. [Google Scholar]
- Montes, C. Cambio Climático: El Implacable Aumento de la Temperatura en Chile; CR2: Santiago, Chile, 2019. [Google Scholar]
- IPCC. “Resumen para Responsables de Políticas”, en: Informe Especial Sobre los Oceéanos y la Criósfera en un Clima Cambiante del IPCC; Pörtner, H.O., Roberts, D.C., Masson-Delmotte, V., Zhai, P., Tignor, M., Poloczanska, E., Mintenbeck, K., Nicolai, M., Okem, A., Petzold, J., et al., Eds.; Cambridge University Press: Cambridge, UK, 2019; p. 38. [Google Scholar]
- Heselaars, T.; Diáz, C. Científicos Nacionales Aterrizan el Impacto en Chile del Informe Sobre el Aumento en el Nivel del Mar; CR2: Santiago, Chile, 2019. [Google Scholar]
- Eheliyagoda, D.; Zeng, X.; Li, J. A method to assess national metal criticality: The environment as a foremost measurement. Humanit. Soc. Sci. Commun. 2020, 7, 43. [Google Scholar] [CrossRef]
- European Commission. Critical raw materials for the EU. Technical Report. Eur. Commusion 2010, 39, 1–84. [Google Scholar]
- Knoeri, C.; Wäger, P.A.; Stamp, A.; Althaus, H.J.; Weil, M. Towards a dynamic assessment of raw materials criticality: Linking agent-based demand—With material flow supply modelling approaches. Sci. Total Environ. 2013, 461–462, 808–812. [Google Scholar] [CrossRef]
- Northey, S.A.; Mudd, G.M.; Werner, T.T.; Jowitt, S.M.; Haque, N.; Yellishetty, M.; Weng, Z. The exposure of global base metal resources to water criticality, scarcity and climate change. Glob. Environ. Chang. 2017, 44, 109–124. [Google Scholar] [CrossRef]
- New Energy and Industrial Technology Devlopment Organization (NEDO). Trend Report of Development in Materials for Substitution of Scarce Metals; Technical Report, Report No. 08007835-0 08007838-0; Shinko Research Co., Ltd. (Mitsubishi UFJ Research and Consulting): Tokyo, Japan, 2009. (In Japanese) [Google Scholar]
- MMA. 4to Informe Bienal de Actualización de Chile Sobre Cambio Climático; Technical Report; Ministerio del Medio Ambiente de Chile: Santiago, Chile, 2020. [Google Scholar]
- Giz & Eurac. Risk Supplement to the Vulnerability Sourcebook. Guidance on How to Apply the Vulnerability Sourcebook’s Approach with the New IPCC AR5 Concept Risk; Technical Report; GIZ: Bonn, Germany, 2017. [Google Scholar]
- Associates, B. BClimate Risk Mapping: London, England. 2022. Available online: https://data.london.gov.uk/dataset/climate-risk-mapping (accessed on 14 July 2023).
- Fritzsche, K.; Schneiderbauer, S.; Bubeck, P.; Kienberger, S.; Buth, M.; Zebisch, M.; Kahlenborn, W. The Vulnerability Sourcebook: Concept and Guidelines for Standardised Vulnerability Assessments; Deutsche Gesellschaft für Internationale Zusammenarbeit (GIZ) GmbH: Bonn, Germany, 2014. [Google Scholar]
- ONEMI. Monitoreo por Evento Hidrometeorológico, Santiago, Chile. 2015. Available online: https://www.onemi.gov.cl/alerta/monitoreo-por-evento-hidrometeorologico/ (accessed on 14 July 2023).
- Aitken, D.; Rivera, D.; Godoy-Faúndez, A.; Holzapfel, E. Water Scarcity and the Impact of the Mining and Agricultural Sectors in Chile. Sustainability 2016, 8, 128. [Google Scholar] [CrossRef]
- Šteflová, M.; Koop, S.H.; Fragkou, M.C.; Mees, H. Desalinated drinking-water provision in water-stressed regions: Challenges of consumer-perception and environmental impact lessons from Antofagasta, Chile. Int. J. Water Resour. Dev. 2021, 38, 742–765. [Google Scholar] [CrossRef]
- Herrera-León, S.; Cruz, C.; Negrete, M.; Chacana, J.; Cisternas, L.A.; Kraslawski, A. Impact of seawater desalination and wastewater treatment on water stress levels and greenhouse gas emissions: The case of Chile. Sci. Total Environ. 2022, 818, 151853. [Google Scholar] [CrossRef] [PubMed]
- Loechel, B.; Hodgkinson, J.; Moffat, K. Climate change adaptation in Australian mining communities: Comparing mining company and local government views and activities. Clim. Chang. 2013, 119, 465–477. [Google Scholar] [CrossRef]
- Maurya, T.; Karena, K.; Vardhan, H.; Aruna, M.; Raj, M.G. Effect of Heat on Underground Mine Workers. Procedia Earth Planet. Sci. 2015, 11, 491–498. [Google Scholar] [CrossRef]
- MMA. Atlas de Riesgos Climáticos; Technical Report; MMA: Santiago, Chile, 2022. [Google Scholar]
- Cochilco. Consumo de Agua en la Minería del Cobre; Technical Report; Cochilco: Santiago, Chile, 2022.
- Sernageomin. Anuario de la Minería de Chile; Technical Report; Cochilco: Santiago, Chile, 2021.
- Fritz, M.; McQuilken, J.; Collins, N.; Weldegiorgis, F. Global Trends in Artisanal and Small-Scale Mining (ASM): A Review of Key Numbers and Issues; Technical Report; IGF and IISD: Winnipeg, MB, Canada, 2018. [Google Scholar]
- Pannell, D.J.; Roberts, A.M.; Park, G.; Alexander, J. Improving environmental decisions: A transaction-costs story. Ecol. Econ. 2013, 88, 244–252. [Google Scholar] [CrossRef]
Disclaimer/Publisher’s Note: The statements, opinions and data contained in all publications are solely those of the individual author(s) and contributor(s) and not of MDPI and/or the editor(s). MDPI and/or the editor(s) disclaim responsibility for any injury to people or property resulting from any ideas, methods, instructions or products referred to in the content. |
© 2023 by the authors. Licensee MDPI, Basel, Switzerland. This article is an open access article distributed under the terms and conditions of the Creative Commons Attribution (CC BY) license (https://creativecommons.org/licenses/by/4.0/).

