Abstract
The unintended loss of glyphosate and P from cropland may pose an environmental risk to downstream water quality and marine ecosystems. Glyphosate and P compete for exchange sites, and since glyphosate is an organophosphate, it reacts similarly to phosphates in soil. The competition for exchange sites between glyphosate and P could lead to an increased risk of loss due to leaching, leading to water quality degradation and harm to aquatic wildlife. The focus of this study was to (i) determine the sorption tendencies of P and orthophosphate in Florida Entisols and (ii) determine the sorption tendencies of glyphosate in Florida Entisols. Adsorption and desorption experiments were performed for both P and glyphosate. The data from the sorption experiments were fitted to linear, Freundlich, and Langmuir models. Orthophosphate-P (ortho-P) was best represented by the linear isotherm. Glyphosate adsorption was best represented by the linear isotherm, and desorption was best represented by both the linear and Freundlich models. Phosphorus and glyphosate sorption and desorption increased with soil depth, likely due to the higher concentrations of Fe and Al with greater depth. These results could improve P and glyphosate application rates when applied in tandem to citrus trees, increasing overall tree health and improving soil quality.
1. Introduction
Phosphorus (P) losses resulting from increasing population and agricultural intensification have become an increasing environmental concern with regard to water quality and aquatic ecosystems [1,2]. Total nitrogen (N) and P have contributed to the excessive growth of algae, which adversely alters elements of aquatic ecosystems, leading to eutrophication [3,4].
While both runoff and leaching contribute to P losses, the bulk of P losses results from runoff [5,6]. Soil characteristics such as soil texture and mineralogy can impact P losses, primarily by indirectly impacting soil’s capacity to retain P through adsorption.
Recently, Florida has faced water quality issues due to eutrophication and harmful algal blooms (HABs). HABs can result from excessive nutrient loading and subsequent eutrophication, leading to human health and environmental concerns [7]. Florida has several species of harmful toxic algae, such as Karenia Brevis, and detection of algal toxins, including brevetoxin, saxitoxin, and domoic acid, has been found throughout Florida water bodies [7]. Recently, Florida has been experiencing issues with Red Tide, a HAB caused by Karenia Brevis. Karenia Brevis is the source of brevetoxin, a neurotoxin known to have neurological effects on mammals, fish, and birds [8,9,10]. Furthermore, Karenia Brevis causes neurotoxic shellfish poisoning (NSP), a human illness caused by consuming shellfish with brevetoxins [11]. Human exposure to harmful algae has been linked to significant health effects. Studies have shown that humans may experience adverse effects from brevetoxins through inhalation and dermal exposure. Onshore winds allow brevetoxins to enter the air, leading to inhalation during recreational activities [12,13]. Backer et al. [13] found that inhalation of brevetoxins leads to upper and lower respiratory symptoms, and participants experienced more frequent and stronger symptoms in areas with higher concentrations of brevetoxins.
Glyphosate, a broad-spectrum herbicide, is one of the most commonly used herbicides globally and is the most commonly used herbicide in Florida citrus production. Over 1.6 billion kilograms of glyphosate have been applied since 1974, with two thirds of that mass being applied in the last decade [14]. Like P, losses of glyphosate may occur through leaching and runoff [15], and, as a result of this increased use of glyphosate, as well as an evolving understanding of potential human health effects resulting from exposure to glyphosate, glyphosate losses are becoming an increasing concern with regard to water quality. Glyphosate can induce toxicity through the formation of reactive oxygen species, which then damage proteins and lipids [16]. The chronic exposure of Florida manatees to glyphosate suggests adverse impacts on their immune and renal systems [17]. Furthermore, glyphosate has been associated with oxidative stress and disruption of fish metabolisms due to direct or indirect exposure of fish to glyphosate [18,19].
Glyphosate is an organophosphate, and, as a result, there are similarities in reactivity between phosphate and glyphosate. Phosphate is adsorbed through ligand exchange, and glyphosate is also adsorbed through ligand exchange via phosphonic acid moiety [20]. Because glyphosate and phosphates have similar mechanisms for adsorption, studies have predicted that these two compounds may compete for adsorption sites, leading to losses due to increased mobility [21,22]. Gimsing and Boggard [21,23] found high adsorption and competitive relationships between glyphosate and phosphate in pure oxides and clay silicates. The competition between glyphosate and phosphate has been observed in various soil types, including soils with explicitly higher Al and Fe oxides. However, additive adsorption effects have only been observed for soils that mainly have 2:1 silicates [24], and the interactions between glyphosate and P in more coarse-textured, more highly weathered soils are not well understood.
Isotherms are used to assess the adsorption (or binding) and desorption processes of a specified chemical in soils. An isotherm displays the quantity of the chemical adsorbed once equilibrium has been reached over a range of concentrations [25]. There are three different models of isotherms used to depict the adsorption of compounds in soil. An isotherm model is linear when the concentration of the chemical adsorbed onto the solid phase increases in direct proportion to the concentration in the solution phase [25]. In a linear isotherm, soil acts as a sink, so the rate of change in concentration is dependent only on the liquid concentration of the chemical; therefore, theoretically, the adsorption is limitless [26]. A Langmuir isotherm is derived initially from mass kinetics that assumes chemisorption [27]. There are three assumptions to Langmuir isotherms: there is a finite number of sites where adsorption can occur, there is monolayer adsorption, and there is no lateral interaction or steric hindrance of the adsorbed chemicals [28]. A Langmuir isotherm allows the estimation of the maximum adsorption capacity for a chemical in a specific soil [25]. The Freundlich model is another isotherm similar to the Langmuir model in that they both follow an L-shaped curve. The Freundlich model shows that adsorption affinity logarithmically decreases as the covered surface increases [25]. The Freundlich isotherm model assumes there are heterogeneous adsorptive energies on the soil surface [27]. This model can predict adsorption that is non-ideal and reversible [28]. The limitation of this model is that, unlike the Langmuir model, the Freundlich model cannot predict maximum adsorption.
Thus, this research sought to (i) determine the sorption tendencies of P and Ortho-P in Florida Entisols and (ii) determine the sorption tendencies of glyphosate in Florida Entisols. It was hypothesized that if there were an interaction between P and glyphosate adsorption, then there would be antagonistic and competitive effects after applying varying rates of P and glyphosate on Florida sandy soils due to the competition for adsorption sites between the two. Also, it was further hypothesized that when glyphosate herbicide was introduced to Florida sandy Entisols with a relatively low adsorption capacity, glyphosate adsorption would follow a Freundlich isotherm model. The third and final hypothesis was that when P amendments were introduced to Florida sandy Entisols with a relatively low adsorption capacity, P adsorption would follow a Freundlich isotherm model, indicating the soil’s adsorption affinity for P would decrease logarithmically as the covered soil surface increased [25].
2. Materials and Methods
2.1. Site Description
Three sites were chosen randomly to obtain samples from the Citrus Research and Education Center. There were three depths taken for each sample: 0–15 cm, 15–30 cm, and 30–45 cm. Soil samples were collected from the Citrus Research and Education Center in Lake Alfred, FL (28.09° N, 81.75° W). The samples from each site were combined and mixed based on their corresponding depths. Soil classification was based on the classification of Candler fine sand as hyperthermic, coated Lamellic Quartzipsamments formed from eolian, or sandy marine deposits as the parent material [29]. The soil samples were then sieved using a 2 mm sieve and dried at 100 °C for 24 h [30].
2.2. Phosphorus Adsorption and Desorption
Adsorption behavior was assessed for the soil samples obtained from the three different depths using seven different treatments: 0 mg/L, 10 mg/L, 25 mg/L, 50 mg/L, 100 mg/L, 200 mg/L, and 500 mg/L of phosphate, with four replicates for each treatment. Each treatment was created by diluting 1000 mg/L of P standard using 0.1 M of potassium chloride (KCl). For each sample, 20 mL of the treatment solution were added to 5 g of soil. The samples were subsequently shaken continuously for 24 h. The tubes were centrifuged at 4000 revolutions per min (rpm) for 30 min. Once filtered, the samples were split and sent to the Soil and Water Chemistry Laboratory at the University of Florida Sciences to analyze the samples for both ortho-P and the University of Florida Institute of Food and Agricultural Sciences Analytical Services Laboratory (UF/IFAS ARL) for total P concentrations using Inductively Coupled Plasma Atomic Emission Spectroscopy (ICP-AES, Spectro Arcos [2] (Spectro Analytical Instruments, Mahwah, NJ). The ortho-P samples were determined with the US EPA Method 365.3 using an Evolution 300 spectrophotometer (Thermo Fisher Scientific, Waltham, MA, USA). The standards were analyzed to determine the original concentrations of the samples, which were used in the final calculations. For quality/control analysis purposes, blanks were included in the sample set to ensure proper measurement of the unknown samples.
Desorption behavior was determined using the same conditions as the adsorption study. The supernatant from the adsorption study was removed, and an equal amount of 0.1 moles/L of KCl solution was added into Teflon tubes. Soil aggregates were dispersed through vibration. The contents in the tubes were horizontally shaken for 24 h at 200 rpm. Following re-equilibration, the tubes were centrifuged at 4000 rpm for 30 min. Once filtered, the samples were sent to the Soil and Water Chemistry Laboratory at the University of Florida to be analyzed for both orthophosphate-P and total P concentrations.
2.3. Glyphosate Adsorption and Desorption
As with P, glyphosate adsorption behavior was determined in the soil samples from three different depths and using the same five treatments (0 mg/L, 10 mg/L, 50 mg/L, 100 mg/L, and 500 mg/L) with four replicates for each treatment. A preliminary study was performed to determine the optimum soil: the solution ratio for the study was 1:4. About 7.5 g of soil was weighed out and equilibrated with 30 mL of analytical-grade glyphosate. Analytical-grade glyphosate was diluted with 0.1 moles/L of KCl to generate treatment solutions. Then, these solutions were horizontally shaken (200 rpm) for 24 h and centrifuged in a 40 mL Teflon centrifuge tube at 4000 rpm for 30 min to separate the solution from the solids. The samples were analyzed using high-performance liquid chromatography (HPLC, PerkinElmer, Akron, OH, USA) at Sanders Laboratories Inc. An aliquot of a filtered water sample was injected into the HPLC analytical column. Separation was achieved using gradient elution, and after elution from the column, the analyte was oxidized, and the product was then coupled with o-phthalaldehyde-2-mercaptoethanol complex to obtain the derivative, fluorophore (post-column derivatization). The concentration of glyphosate eluted from the HPLC column was then measured by detecting the fluorescence of the derivative using a fluorometer. Glyphosate analysis using the samples was performed as outlined in the EPA method 547 [31]. A high-pressure liquid chromatography (HPLC) system (PerkinElmer, Akron, OH, USA) equipped with a silica-based anion-exchange column (5 µm particle size, 250 mm long × 4.6 mm internal diameter) was utilized to separate glyphosate from the samples. The column temperature was 38 °C. The mobile phase consisted of 5 mM monobasic potassium phosphate (pH 1.9 with phosphoric acid; Solvent A) and methanol (Solvent B), with a 0.5 mL/min flow rate. Separation was achieved using an icocratic elution of 96% A and 4% B. After elution from the column, the analyte was oxidized, and the product was then coupled with o-phthalaldehyde-2-mercaptoethanol complex to obtain the derivative, fluorophore (post-column derivatization, [31]). The concentration of glyphosate eluted from the HPLC column was then measured by detecting the fluorescence of the derivative using a fluorescence detector (Perkin Elmer LC series 200, excitation at 338 nm, detection of emission at 465 nm).
The desorption study was performed using the same conditions as the adsorption study. The supernatant from the adsorption study was removed, and an equal amount of 0.1 moles/L of KCl solution was added into Teflon tubes. The contents in the tubes were horizontally shaken for 24 h at 200 rpm. The tubes were centrifuged at 4000 rpm for 30 min. For quality assurance/quality control (QA/QC) purposes, three blanks were included in the sample set to ensure proper measurement of the unknown samples. The supernatant was analyzed using HPLC for glyphosate concentration, as described above.
2.4. Adsorption and Desorption Analysis
The methodology for determining the adsorption isotherms was according to the Adsorption/Desorption Batch Equilibrium in the United States Environmental Protection Agency (EPA) guidelines, ‘Fate, Transport and Transformation Test Guidelines’ [32]. The data were used to develop linear, Langmuir, and Freundlich isotherms. The linear equation is as follows:
where q (mg/kg) is the amount of chemical adsorbed, Ce (mg/L) is the final equilibrium concentration, and Kd (L/kg) is the slope of the isotherm.
q = Kd × Ce
The Langmuir linear equation is as follows:
where Kl (L/kg) is a constant and a measure of the intensity of the adsorption isotherm, qmax (mg/kg) is the maximum adsorption capacity for the soil, Ce (mg/L) is the final equilibrium concentration, and q is the amount of chemical adsorbed (mg/kg).
The Freundlich linear equation used in this experiment is as follows:
where q (mg/kg) is the amount of chemical adsorbed, Kf is the Freundlich adsorption coefficient (mg1−N kg−1 LN), n is an empirical constant, and Ce (mg/L) is the final equilibrium concentration. By comparing the R2 values, the isotherm that best suits the adsorption of P in the soil was chosen.
log q = logKf + nlogCe
The analysis for the phosphorus and glyphosate adsorption experiments to determine significant differences among Kd was completed using Tukey’s Honest Significant Test at p = 0.05. Sorption coefficient (Kd) values were determined for both adsorption and desorption by creating isotherms using depth and replicates as factors. The replicate Kd values were averaged across depth, and the standard deviation, confidence intervals, and upper and lower bounds were determined. Statistical significance was determined through a comparison of confidence intervals at p = 0.05.
3. Results and Discussion
3.1. Ortho-Phosphorus Sorption Studies
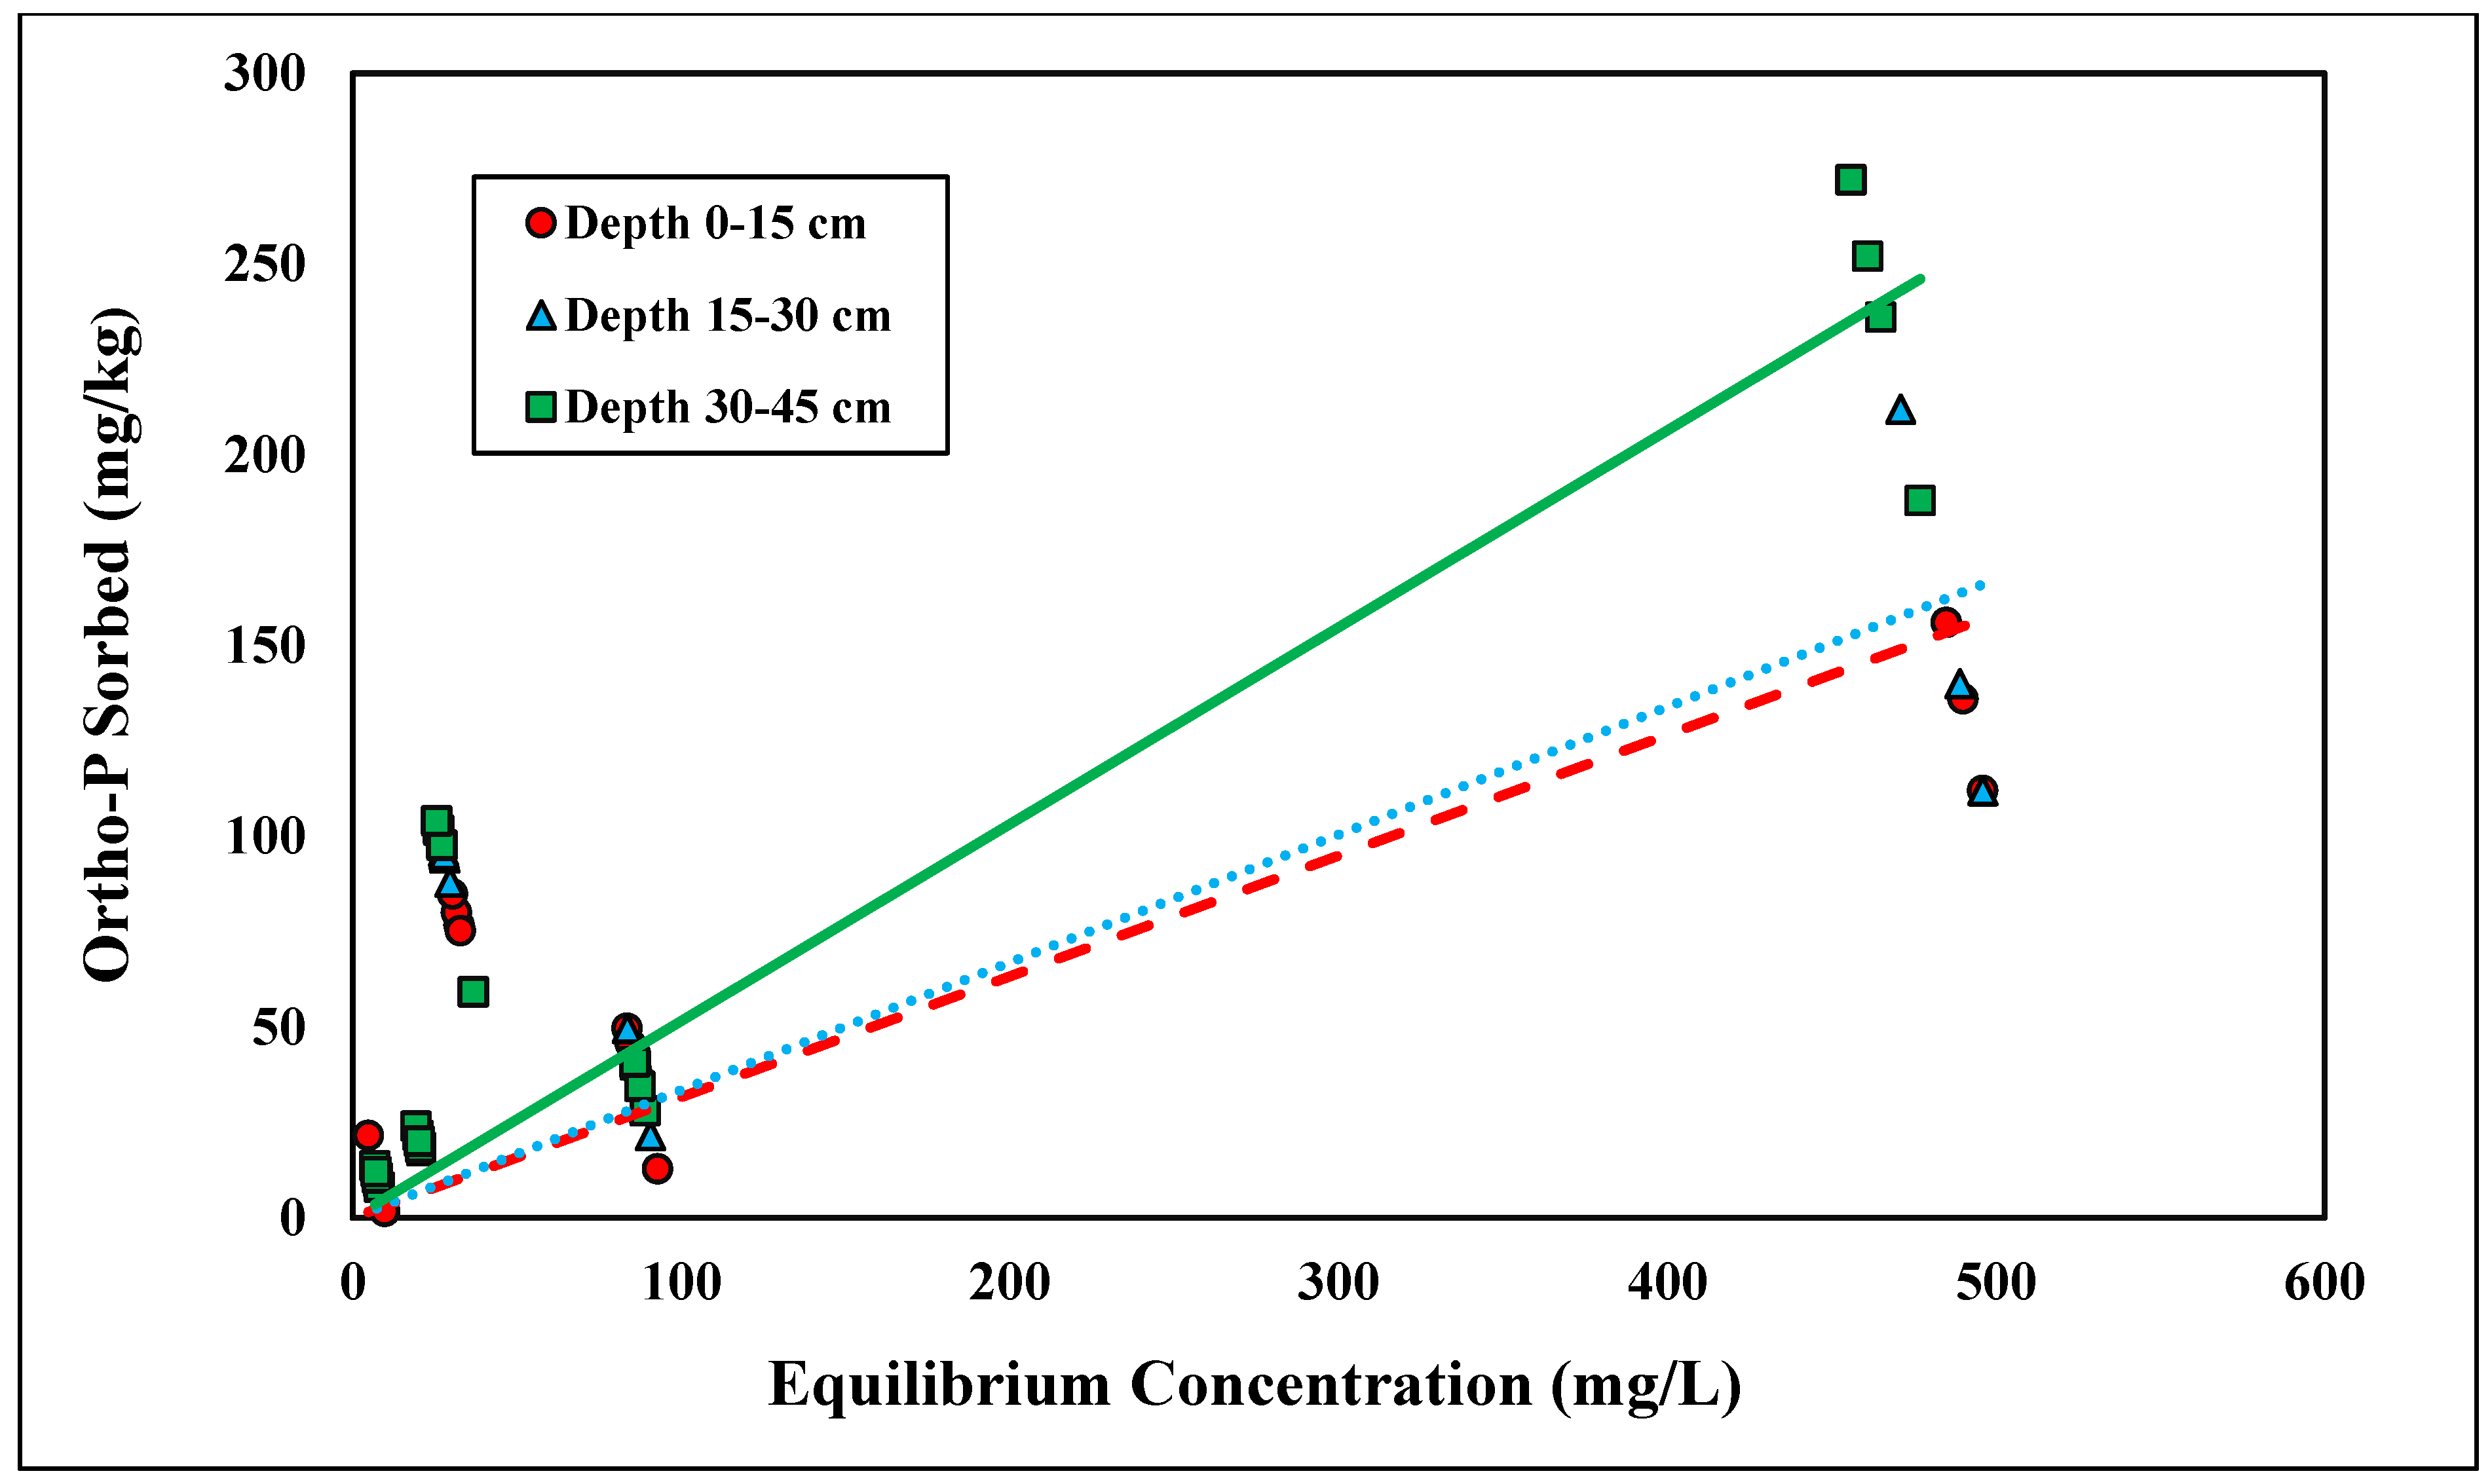
The linear model was found to have the best fit for ortho-P adsorption across all three depths for the concentration range tested (0–500 mg/L), with R2 values ranging from 0.67 to 0.89 (Figure 1 and Table 1). Because the linear isotherm depicted ortho-P adsorption, no reliable adsorption maxima were observed over the range of concentrations tested. The Kd ranges fell between 0.31 and 0.52 kg/L (Table 1). The higher the distribution coefficient (Kd), the stronger the adsorption affinity for the adsorbent, ortho-P, in the Entisols. The ranges of the distribution coefficient were consistent with those reported in previous studies [30,33]. Although the Kd values were within the range of previously reported values, they were slightly lower than the values for Candler fine sand reported in a previous study, indicating that there was a lower affinity for ortho-P adsorption and, thus, less ortho-P being adsorbed. The adsorption mechanism for ortho-P occurs via monodentate-mononuclear or bidentate-binuclear ligand exchange that displaces water molecule(s) through inner-sphere complexation [34]. The nature of ortho-P adsorption is likely through inner-sphere complexation where P fixes to Al and Fe with the possible formation of Al-P and Fe-P mineral complexes. This is likely due to the low soil pH (<6.0) and the presence of Fe- and Al-coated sands (Table 2). The Kd values significantly increased with depth (p < 0.05; Table 1). The Kd value at a depth of 30–45 cm was over 1.5 times higher than the Kd value at a depth of 0–15 cm. The adsorption affinity for ortho-P increased as a function of depth was likely a result of increases in soil Al and Fe contents in the deeper soil samples (Table 2). The higher concentrations of Al and Fe contents at 30–45 cm depth resulted in further P fixation and higher retention compared to 0–15 cm.

Figure 1.
Linear adsorption isotherm for ortho-P across three depths. Dashed, dotted, or solid lines depict 1:1 linear equations at 0–15, 15–30 and 30–45 cm depths, respectively, between sorbed and equilibrium concentrations of Ortho-P.

Table 1.
Linear adsorption and desorption equations and significance.
Table 2.
Soil properties of Candler fine sand.
The linear isotherm also described ortho-P desorption well over the tested concentration range (R2 = 0.92–0.99) (Figure 2). Both adsorption data sets follow the linear isotherm, showing that the desorption and adsorption phenomena are consistent. Since ortho-P desorption followed the linear isotherm model, there were no reliable desorption maxima over the range of concentrations tested. For the desorption models, a larger Kd was observed and was indicative of higher adsorption of ortho-P. The range of Kd values was between 51.45 and 74.25 kg/L (Table 1). Because ortho-P adsorbs through chemisorption, retained P is not readily desorbed; however, monodentate-mononuclear ortho-P is more reversible than bidentate-binuclear ortho-P [34,36]. Similar to adsorption, desorption Kd significantly increased with depth (p < 0.05). At depths of 0–15 and 15–30 cm, the Kd values were significantly less than at a depth of 30–45 cm (Table 1). The Kd value t 30–45 cm depth was between 1 and 2 times higher than the values at the two lower depths. The higher retention of ortho-P at the lowest depth was consistent with that of the results of the adsorption study. The stronger retention of ortho-P at the lowest depth of 30–45 cm was due to the larger amount of Al and Fe within the lowest depth, leading to a higher concentration of ortho-P being adsorbed strongly to the surface that was resisting to desorption (Table 2). Ortho-P retention likely increases at lower depths because more coated sands are located deeper in the profile where lamellae occur based upon the USDA taxonomy of Candler fine sand [29]. Although no adsorption maxima were observed, as the concentration of P increased, the supernatant concentration increased, so more P was desorbed. These results were consistent with the previous theory that the concentration of applied P was directly proportional to desorption, and leaching or erosion was likely to occur [37].

Figure 2.
Linear desorption isotherm for ortho-P across three depths. Dashed, dotted, or solid lines depict 1:1 linear equations at 0–15, 15–30 and 30–45 cm depths, respectively, between sorbed and equilibrium concentrations of Ortho-P.
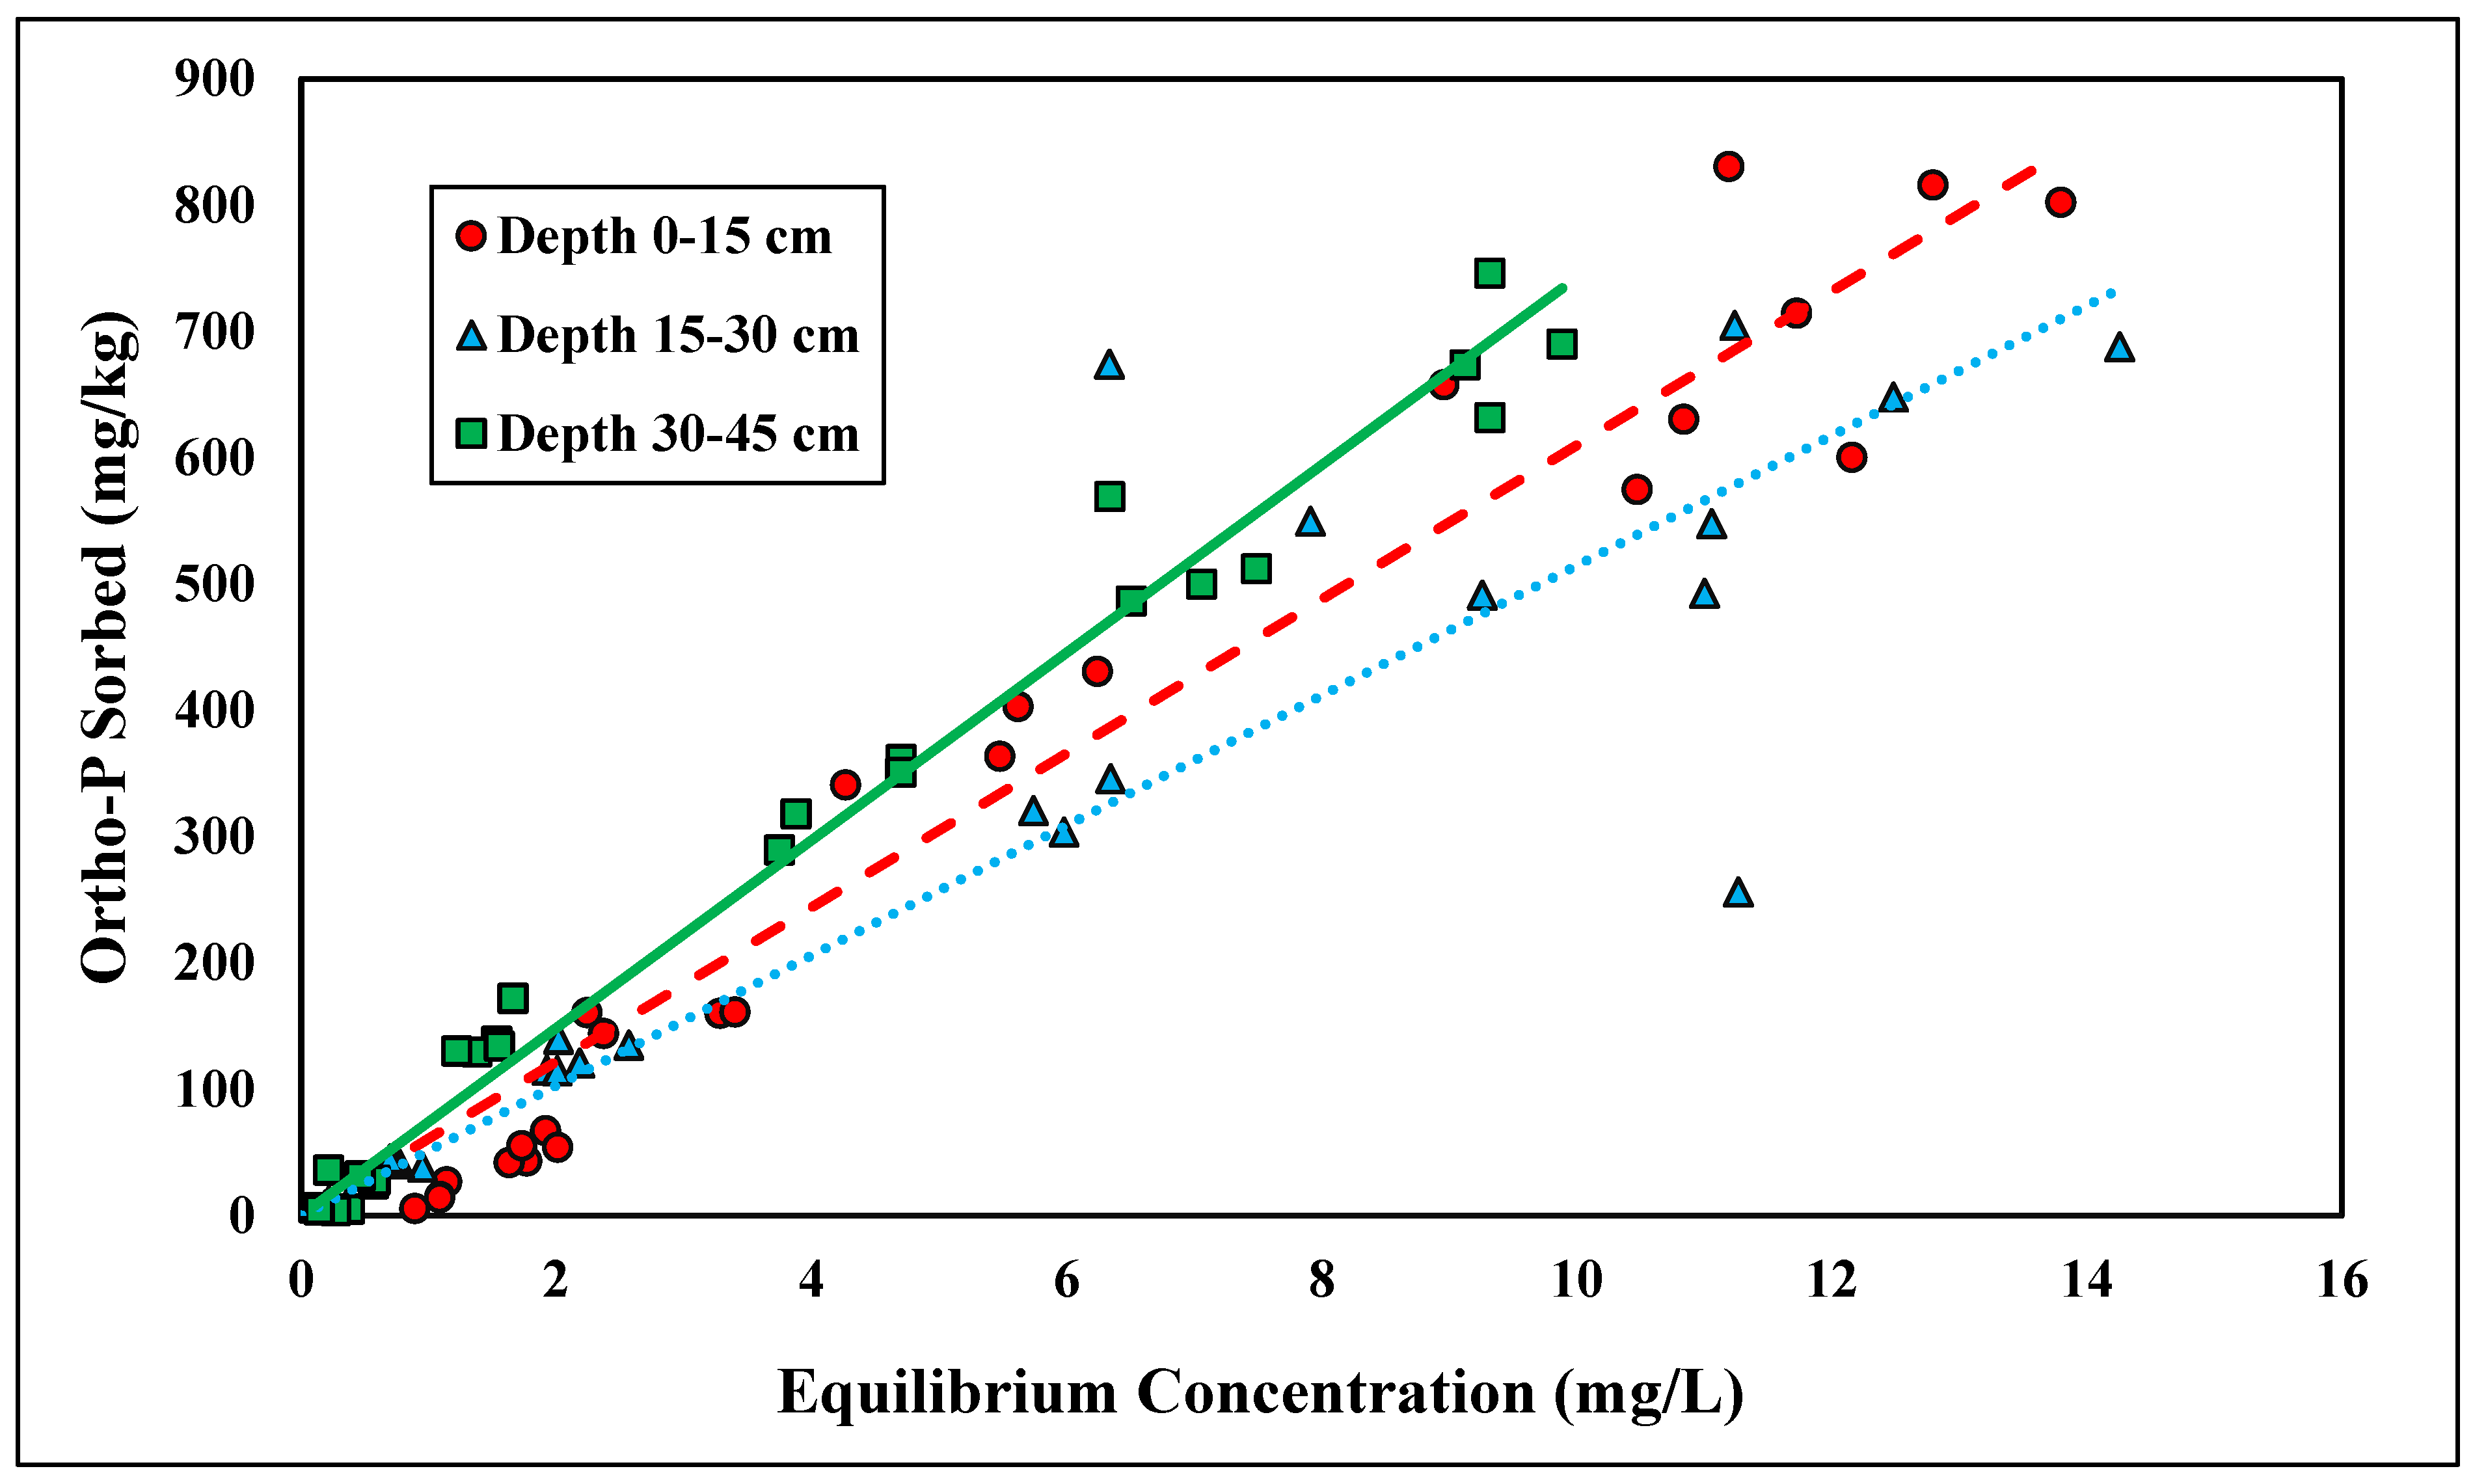
3.2. Total Phosphorus Sorption Studies
The Langmuir and linear isotherms were found to best represent total P adsorption (Figure 3 and Figure 4). The shallowest depth, 0–15 cm, fitted the linear model best, with an R2 value of 0.64 (Table 3). Because the depth of 0–15 cm followed the linear isotherm, no reliable adsorption maxima were established for total P adsorption. The Kd at the depth of 0–15 cm was 0.58 kg/L (Table 3). The linear distribution coefficient for total P was slightly higher than the distribution coefficient for ortho-P, suggesting a slightly stronger adsorption affinity for total P than for ortho-P. The adsorption affinity was likely higher because total P contains all sources of P, thereby allowing for more adsorption. Although the organic matter content was low (<0.5%), there was likely some contribution to P retention in the uppermost layer (Table 2). There were no significant differences between the linear distribution coefficient across depth (Table 3).

Figure 3.
Linear adsorption isotherm for total P across three depths. Dashed, dotted, or solid lines depict 1:1 linear equations at 0–15, 15–30 and 30–45 cm depths, respectively, between sorbed and equilibrium concentrations of Ortho-P.

Figure 4.
Langmuir adsorption isotherm for total P across three depths. Dashed, dotted, or solid lines depict 1:1 linear equations at 0–15, 15–30 and 30–45 cm depths, respectively, between sorbed and equilibrium concentrations of Ortho-P.
Table 3.
Total P linear adsorption and desorption equations and significance.
The Langmuir isotherm was found to best depict adsorption at the lower depths of 15–30 cm and 30–45 cm, with R2 values ranging from 0.71 to 0.92, respectively (Table 4). At depths of 15–30 and 30–45 cm, the adsorption maxima were 71.42 and 140.85 mg/kg, which were slightly greater than the average maxima reported by Zhang et al. [38] (Table 4). The adsorption maxima at the lowest depth were roughly two times greater than those at the 15–30 cm depth. The adsorption maxima at 30–45 cm were higher than the adsorption maxima reported in a previous study on Candler uncoated fine sand [39], demonstrating a higher presence of Al and Fe coatings at the lowest depth within the profile of our study (Table 2). Fewer adsorption sites could partially explain the low adsorption maxima at 15–30 cm due to the higher presence of uncoated sands and the low fraction of colloids containing organic matter. When approaching total P’s adsorption capacity, any additional P will cause larger quantities of P in the soil solution [40], leading to higher quantities of P losses. Understanding the nature of the sorption capacity and degree of P saturation could aid in the predictions of P desorption into soil solutions [40]. There is a significant difference between the adsorption capacities shown on the Langmuir isotherms at the 15–30 and 30–45 cm depths (Table 4). The higher concentrations of Fe and Al correspond with a higher P adsorption capacity. Because of the high concentrations of Fe and Al, P is strongly adsorbed to Al and Fe hydroxides, leading to a low diffusion rate [41]. Various studies have shown the direct correlation between P adsorption and Fe concentration content [42]. In addition, P has also been shown to be correlated between P adsorption and Al content [43,44].
Table 4.
Total P Langmuir adsorption equations, coefficients, and significance.
The linear isotherms represent total P desorption across all three depths (R2 > 0.93) (Figure 5). The total P desorption mechanism corresponds with the ortho-P desorption linear trend. No adsorption maxima were observed over the range of concentrations tested since the desorption data for total P followed the linear model. The Kd values at the depths 0–15, 15–30, and 30–45 cm were 52.65, 51.08, and 59.96 kg/L, respectively (Table 3). Higher Kd values indicate higher retention of P in the soil. These values were within the similar range of Kd values for ortho-P desorption, which indicates comparable retention of total P. Using KCl as the electrolyte for desorption studies results in mostly exchangeable P being desorbed from adsorption sites [44], possibly accounting for the similarities between ortho-P and total P desorption. The distribution coefficients were significantly different (p < 0.05), further demonstrating the higher P retention capacities at a lower depth in the profile due to the higher levels of Al and Fe (Table 3).

Figure 5.
Linear desorption isotherm for total P across three depths. Dashed, dotted, or solid lines depict 1:1 linear equations at 0–15, 15–30 and 30–45 cm depths, respectively, between sorbed and equilibrium concentrations of Ortho-P.
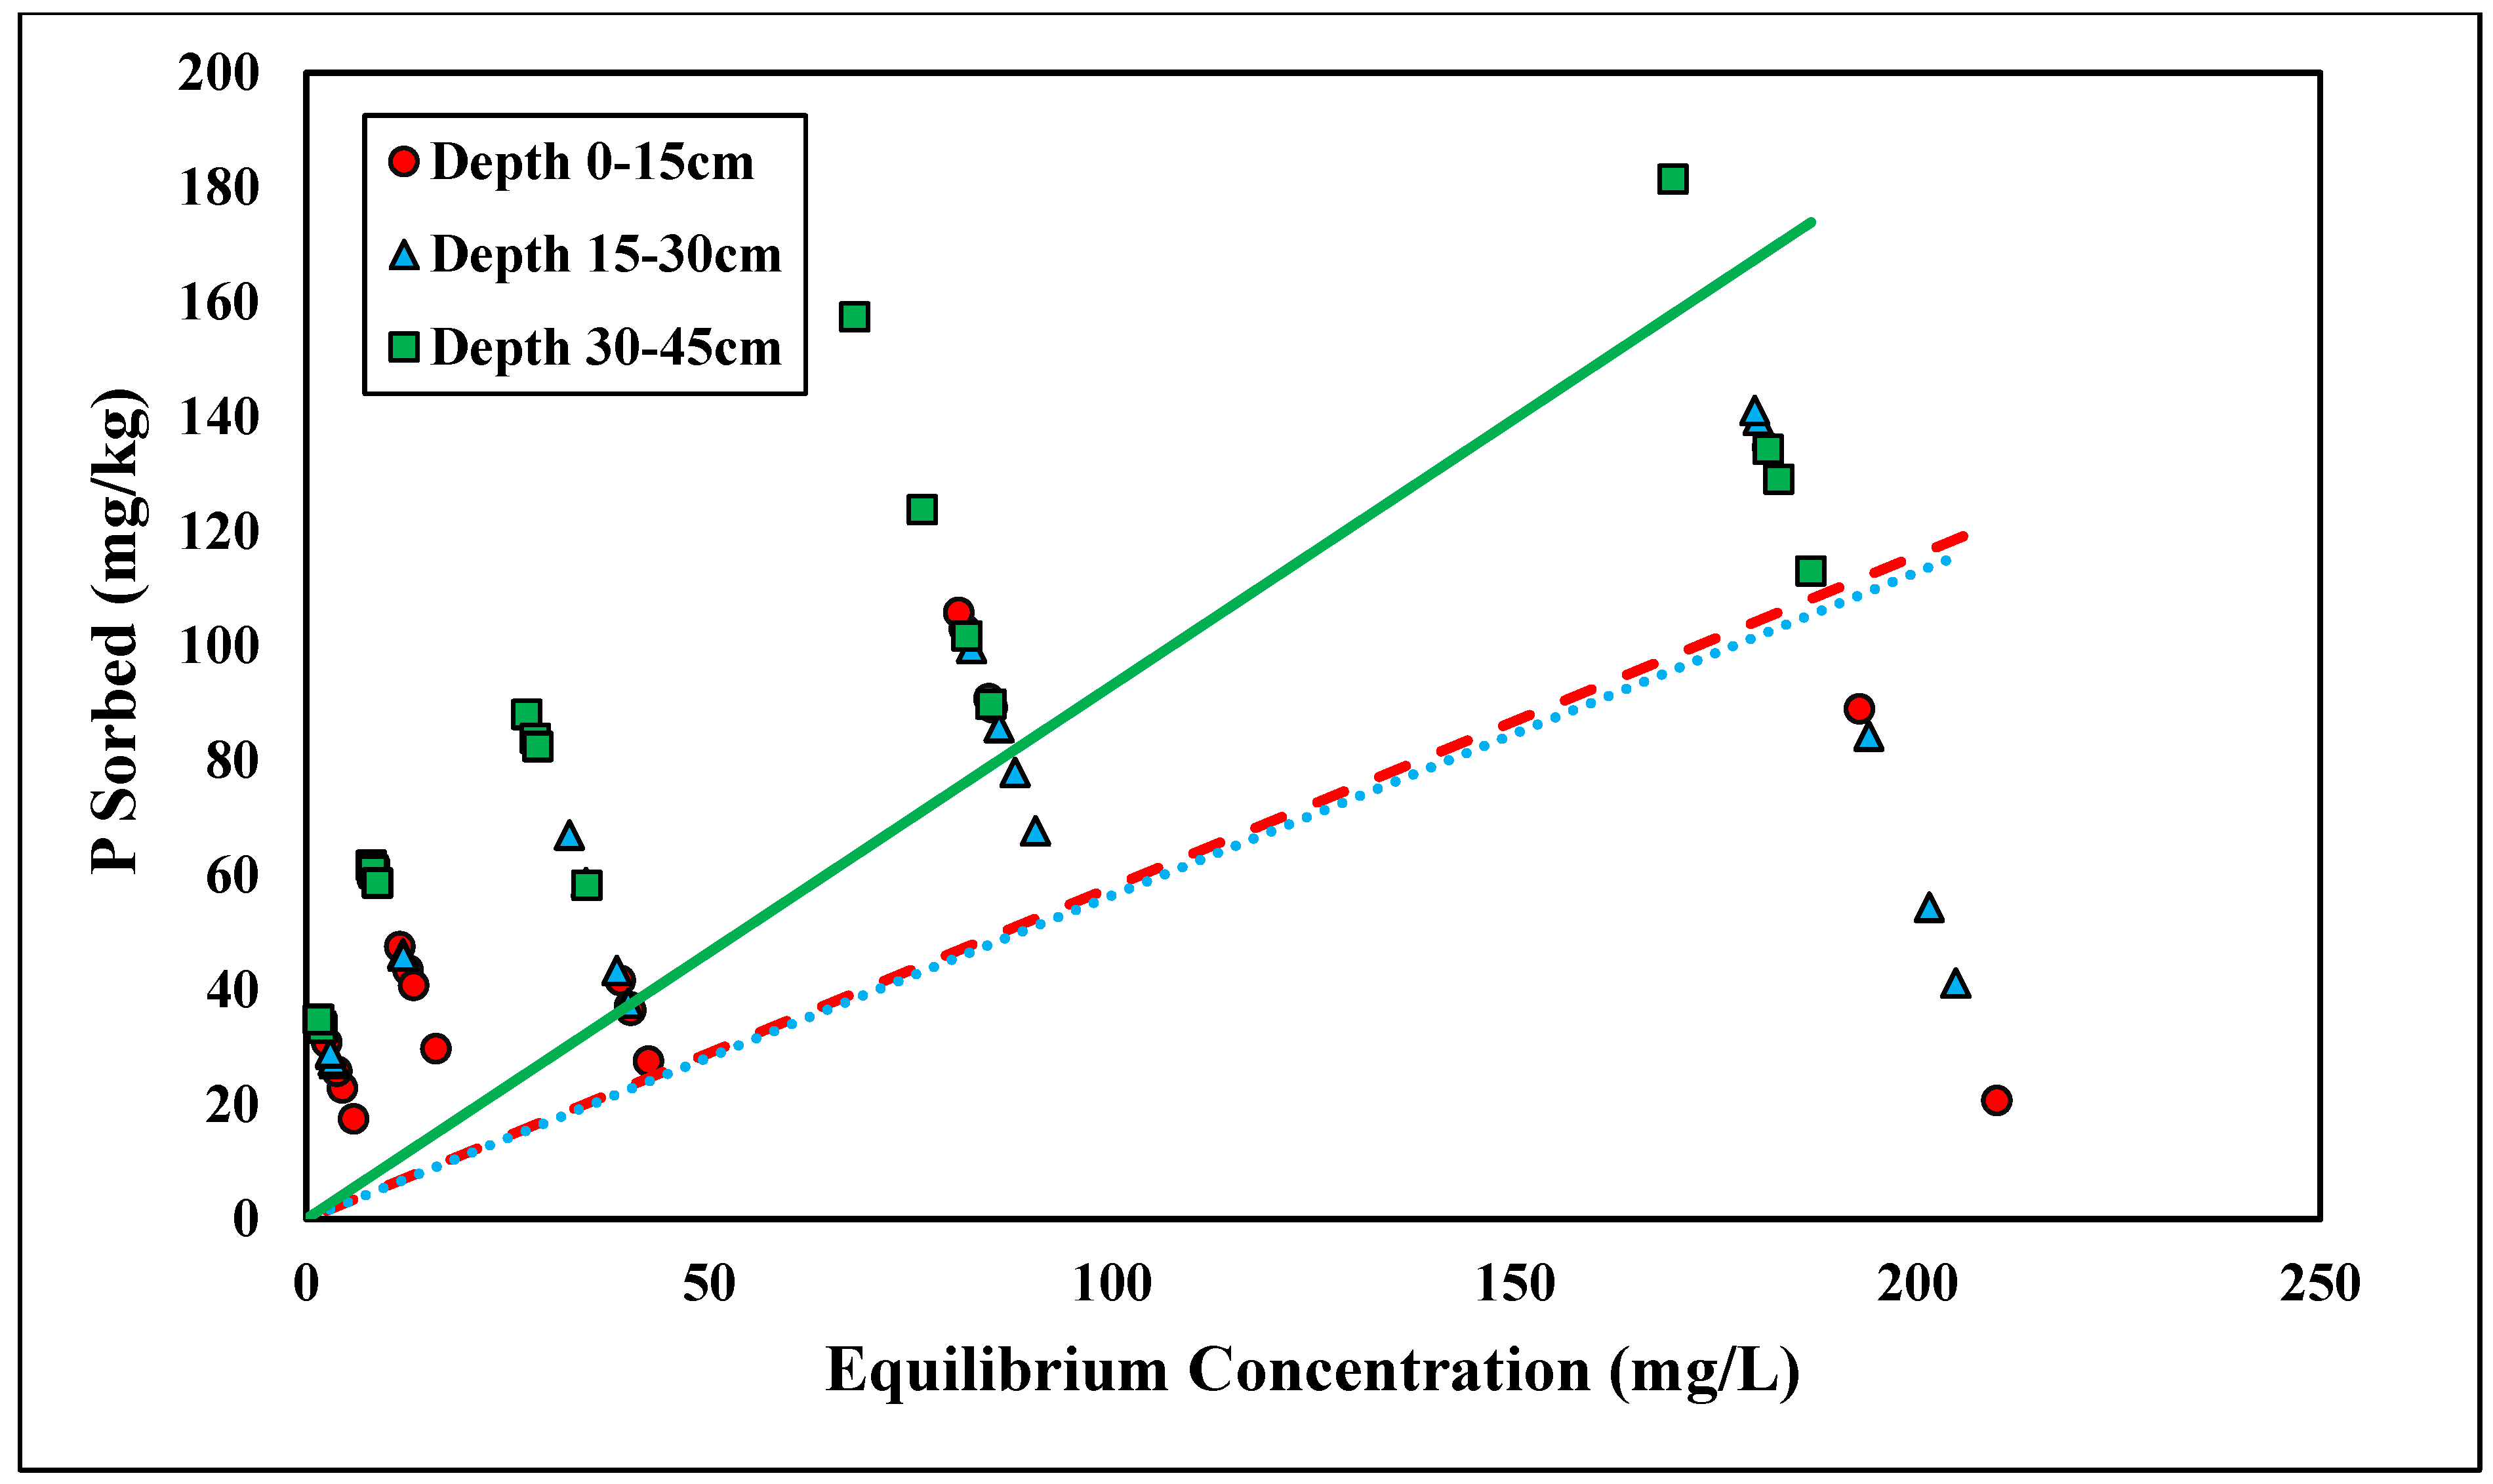
3.3. Glyphosate Adsorption Studies
Glyphosate adsorption followed the linear isotherm across all three depths (R2 > 0.83) (Figure 6 and Table 5). A linear isotherm indicates constant partitioning, meaning the glyphosate linear isotherm slope, Kd, is constant regardless of the surface coverage until a theoretical maximum adsorption capacity is reached [34]. However, for this trial, no maximum adsorption capacity was observed for the concentrations tested. Glyphosate is a polyprotic acid and, therefore, forms anions within the pH range tested (pH < 6.5) [45] (Table 2). Previous studies have shown that glyphosate adsorption is inversely related to pH; thus, as pH becomes more acidic, there is an increase in glyphosate adsorption [24]. The Kd values at depths of 0–15, 15–30, and 30–45 cm were 2.01, 1.68, and 3.47 kg/L, respectively (Table 5). The linear Kd values were within a similar range to those of the phosphorus adsorption studies. Munira et al. [46] found that the Kd values between phosphate and glyphosate were positively correlated, suggesting similar adsorption mechanisms within the soil. Although the glyphosate data had a stronger correlation with the linear isotherms, the Kf coefficients from the Freundlich isotherms (Kf = 59.97–75.59) were in the range of previous studies [47]. Notably, the Kd values were significantly different across depths (p < 0.05) (Table 5). This relationship was similar to ortho-P adsorption. The Kd value was highest with the lowest depth because of the increased Al and Fe contents (Table 2). Glyphosate strongly adsorbs Fe and Al oxides. The phosphonic acid group on glyphosate acts similarly to inorganic phosphate [48]. Glyphosate adsorbs Fe and Al hydroxides by forming an inner-sphere complex and replacing the hydroxyl group [48]. The linear isotherms best represent both glyphosate and ortho-P adsorption, and their respective Kd values show significant differences across depth, which supports the theory that phosphorus and glyphosate adsorption mechanisms are similar.

Figure 6.
Glyphosate linear adsorption isotherm across three depths. Dashed, dotted, or solid lines depict 1:1 linear equations at 0–15, 15–30 and 30–45 cm depths, respectively, between sorbed and equilibrium concentrations of Glyphosate.
Table 5.
Glyphosate linear adsorption and desorption equations and significance.
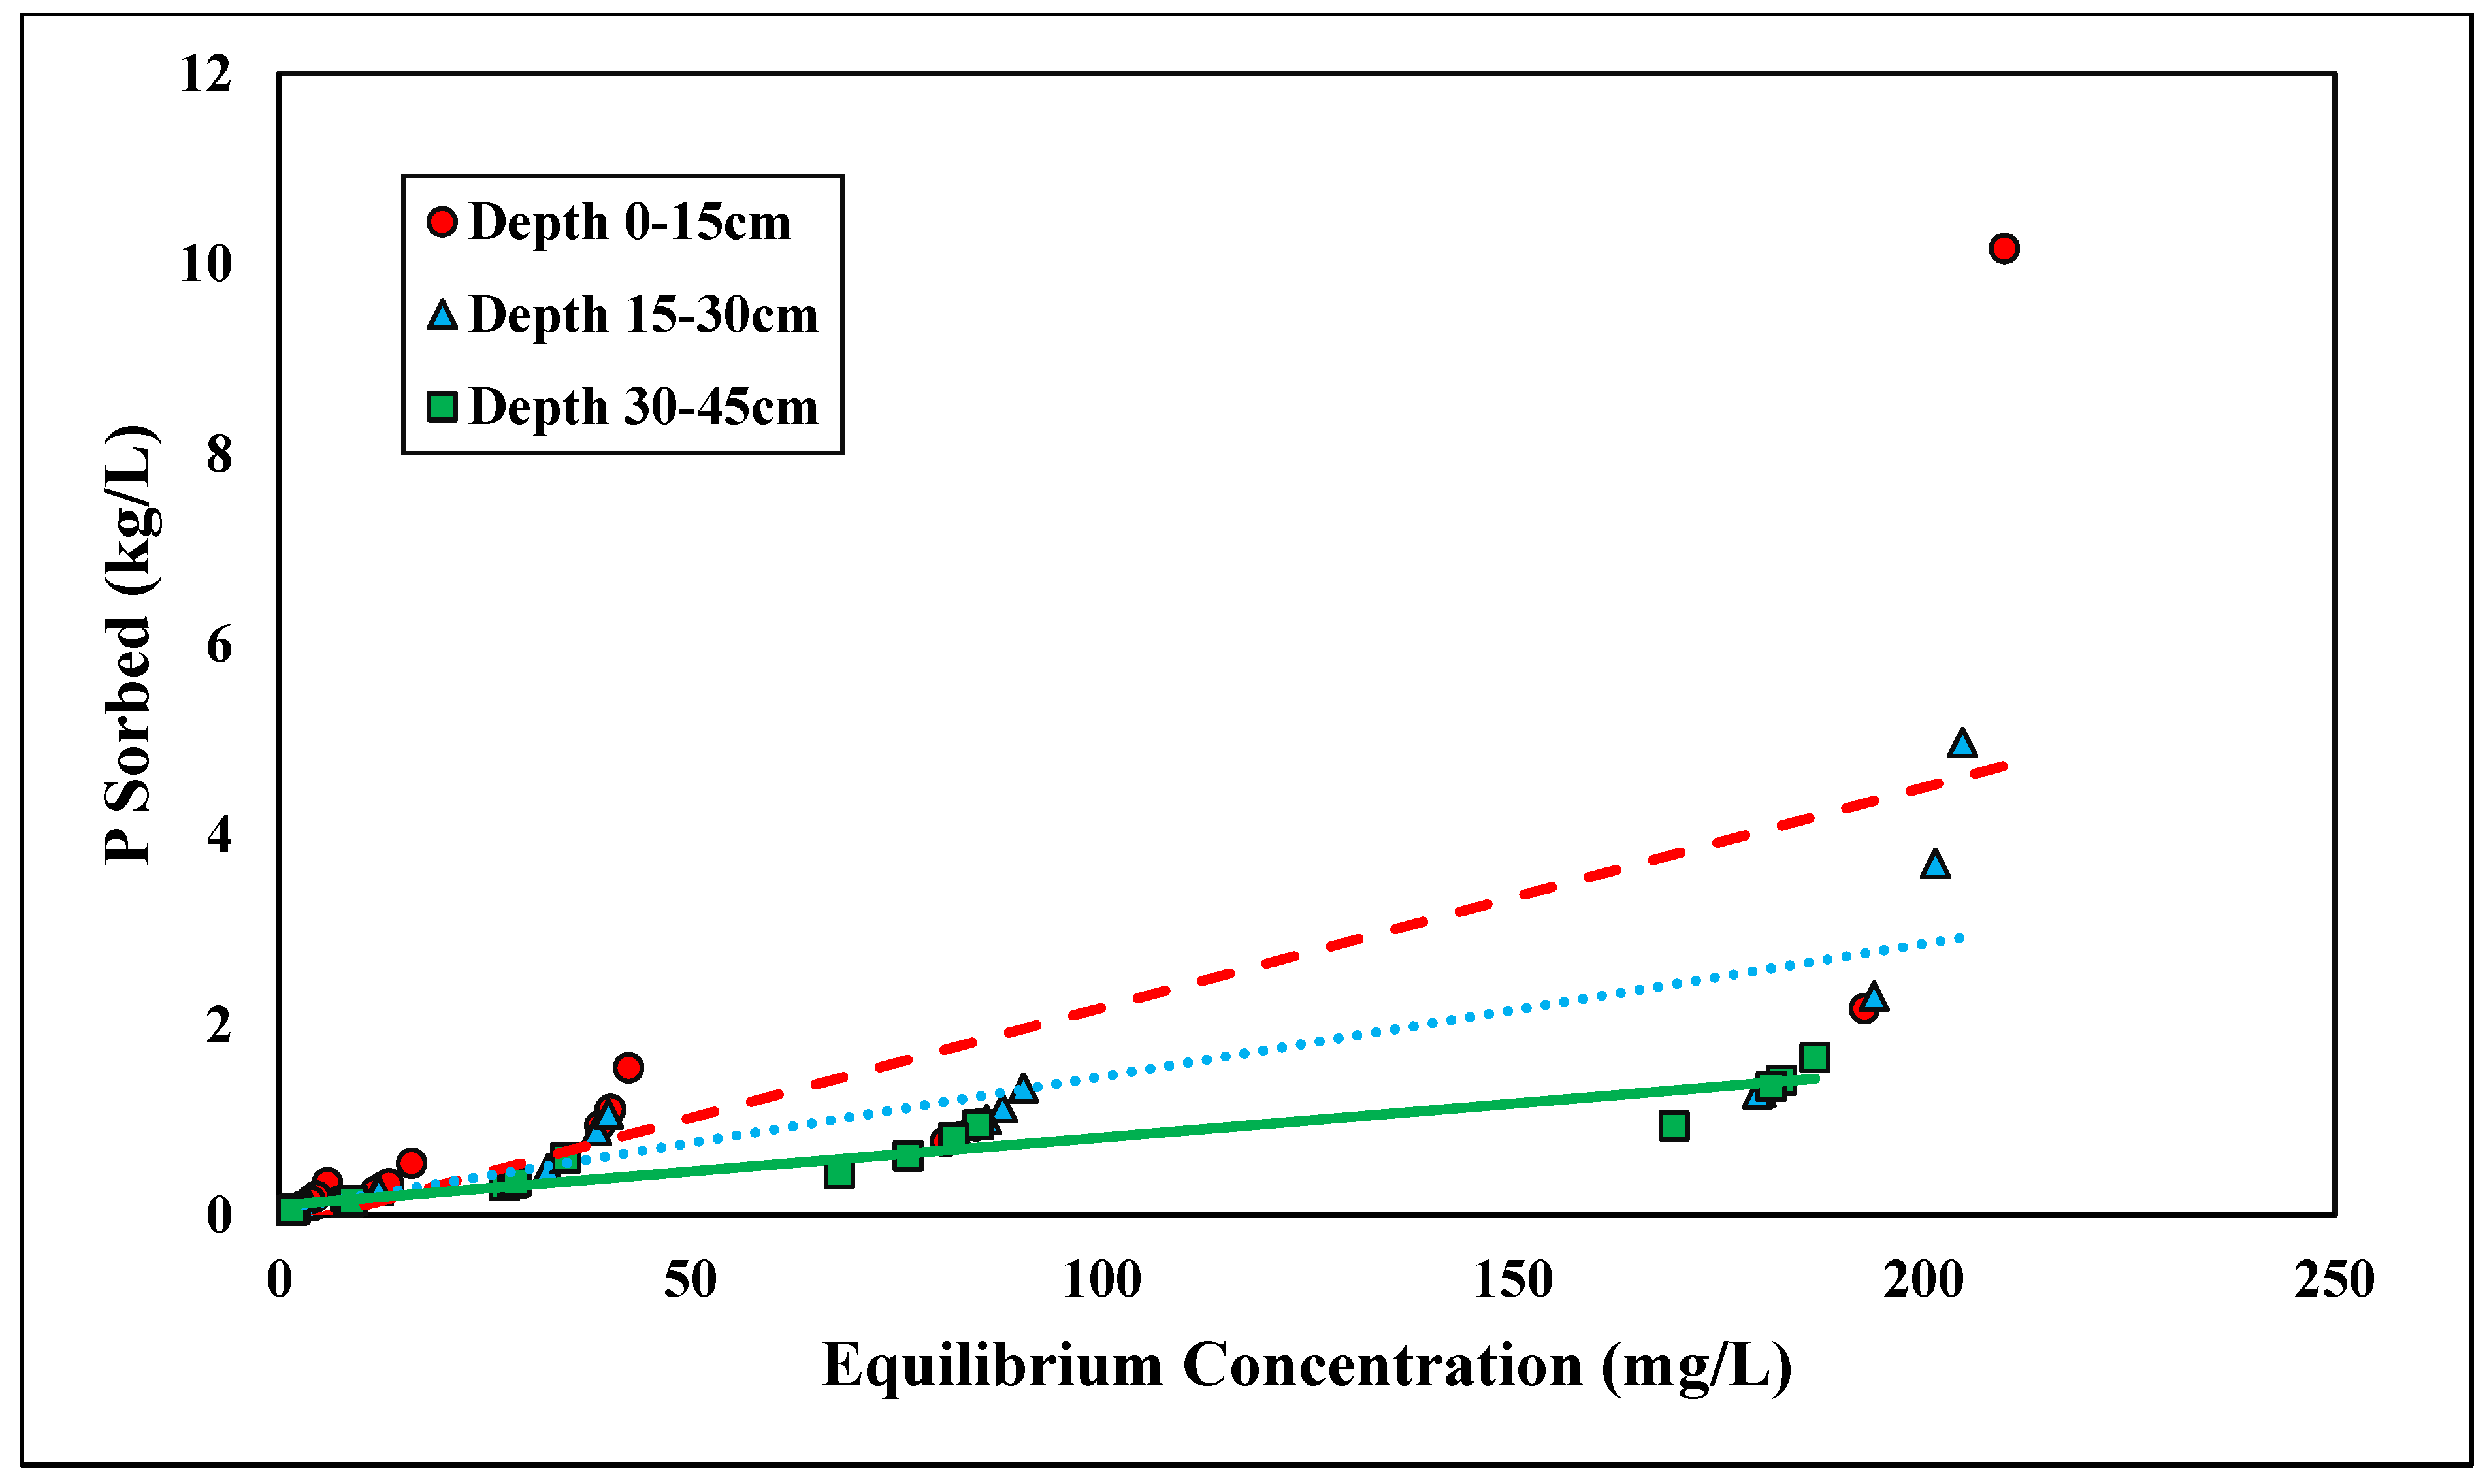
The linear and Freundlich isotherms were found to best depict glyphosate desorption tendencies (Figure 7 and Figure 8). Both the linear and Freundlich isotherms fit the depth of 0–15 cm, with an R2 value equal to 0.97 (Table 5 and Table 6). The 15–30 cm depth was best depicted by the Freundlich isotherm (R2 = 0.87), and the lowest depth, 30–45 cm, was best depicted by the linear isotherm (R2 = 0.93) (Table 5 and Table 6). The Kf values at the depths of 0–15 cm and 0–30 cm were 6.75 and 1.42 kg/L, respectively (Table 6). Previous studies have shown that the Freundlich isotherm best represents glyphosate desorption; however, the Kf values are much higher than those presented in this study [46]. The Kf values may differ from previous research since Candler fine sand has lower clay and organic matter than previously tested soil (Table 6). Glyphosate has also been found to adsorb to broken edges of kaolinite, which would not play a major role in Candler fine sand since the clay content is less than 3% [49,50]. The Freundlich coefficient Kf was significantly higher at the lowest depth 30–45 cm, further supporting the higher retention of glyphosate at lower depths due to higher Al and Fe contents (Table 2). The linear Kd values at 0–15 and 30–45 cm were 16.31 and 51.53 kg/L, respectively (Table 5). The linear Kd value at 30–45 cm was significantly higher than the Kd value at 0–15 cm (Table 5). The diffusion coefficient increased with depth for the linear isotherm, showing a stronger adsorption affinity with increasing depth. As stated previously, for glyphosate adsorption, the stronger affinity was likely due to the increasing amounts of Fe and Al at lower depths. The greater the retention of glyphosate, the less likely glyphosate would be lost due to leaching and erosion. Recently, glyphosate and its derivative AMPA were found to have high leaching susceptibility and could potentially contaminate groundwater [51,52].

Figure 7.
Glyphosate linear desorption isotherm across three depths. Dashed, dotted, or solid lines depict 1:1 linear equations at 0–15, 15–30 and 30–45 cm depths, respectively, between sorbed and equilibrium concentrations of Glyphosate.

Figure 8.
Glyphosate Freundlich desorption isotherm across three depths. Dashed, dotted, or solid lines depict 1:1 linear equations at 0–15, 15–30 and 30–45 cm depths, respectively, between sorbed and Log Cf of Glyphosate.
Table 6.
Glyphosate Freundlich desorption equations, coefficients, and significance.
4. Conclusions
Over the concentrations tested, the linear model best represents ortho-P adsorption and desorption. Adsorption of ortho-P likely occurs through the formation of inner-sphere complexes on Fe and Al oxides by replacing water molecules on the mineral surface since the soil tested contained Al and Fe coatings. Adsorption affinity was found to increase with depth significantly, and Fe and Al content were also found to increase with depth, supporting that there are more coatings at a lower depth within the profile that fix P. Total P adsorption is best represented by linear and Langmuir isotherms, while its desorption follows only linear isotherms. Across 0–30 and 30–45 cm depths, the adsorption maxima significantly increased with depth, showing a higher adsorption capacity at a lower depth in the profile due to a higher amount of adsorption sites. Glyphosate adsorption was best modeled by linear isotherms, and desorption was best represented by both linear and Freundlich isotherms. Similar to ortho-P, there were significant differences in the K parameters across depth. Glyphosate has similar adsorption mechanisms to ortho-P, so glyphosate adsorbs to Fe and Al oxides, which is supported by the increases in adsorption affinity with depth.
Author Contributions
Conceptualization, R.A.F., D.M.K. and R.G.K.; methodology, R.A.F., D.M.K., R.G.K. and J.J.; investigation, R.A.F.; resources, D.M.K.; data curation, R.A.F.; writing—original draft preparation, R.A.F.; writing—review and editing, D.M.K., R.G.K., J.J. and M.B.; supervision, D.M.K. and R.G.K.; project administration, D.M.K.; funding acquisition, D.M.K. All authors have read and agreed to the published version of the manuscript.
Funding
This research was funded by the USDA Multi-Agency Coordination APHIS, Project No. P0136316-201-2200 and the USDA Hatch, Project No. FLA-CRC-006185.
Institutional Review Board Statement
Not applicable.
Informed Consent Statement
Not applicable.
Data Availability Statement
Data are available upon request.
Acknowledgments
The authors thank the University of Florida, the Citrus Research and Education Center, the Southwest Florida Research and Education Center, and the Department of Soil and Water Sciences for assistance with the project.
Conflicts of Interest
The authors declare no conflict of interest.
References
- Tilman, D. Global environmental impacts of agricultural expansion: The need for sustainable and efficient practices. Proc. Natl. Acad. Sci. USA 1999, 96, 5995. [Google Scholar] [CrossRef]
- Parry, R. Agricultural Phosphorus and Water Quality: A U.S. Environmental Protection Agency Perspective. J. Envinon. Qual. 1998, 27, 258–261. [Google Scholar] [CrossRef]
- Dolan, D.M.; Bierman, V.J.; Dipert, M.H.; Geist, R.D. Statistical analysis of the spatial and temporal variability of the ratio chlorophyll A to phytoplankton cell volume in Saginaw Bay, Lake Huron. J. Great Lakes Res. 1978, 4, 75–83. [Google Scholar] [CrossRef]
- Rolle Longley, K.; Huang, W.; Clark, C.; Johnson, E. Effects of nutrient load from St. Jones River on water quality and eutrophication in Lake George, Florida. Limnologica. 2019, 77, 125687. [Google Scholar] [CrossRef]
- Sharpley, A.N.; Smith, S.; Jones, O.; Berg, W.; Coleman, G. The Transport of bioavailable phosphorus in agricultural runoff. J. Environ. Qual. 1992, 21, 30–35. [Google Scholar] [CrossRef]
- Daniel, T.C.; Sharpley, A.N.; Lemunyon, J.L. Agricultural Phosphorus and Eutrophication: A Symposium Overview. J. Environ. Qual. 1998, 27, 251–257. [Google Scholar] [CrossRef]
- Heil, C.A.; Muni-Morgan, A.L. Florida’s Harmful Algal Bloom (HAB) Problem: Escalating risks to human, environmental and economic health with climate change. Front. Ecol. Environ. 2021, 9, 646080. [Google Scholar] [CrossRef]
- McCabe, E.J.B.; Wells, R.S.; Toms, C.N.; Barleycorn, A.A.; Wilkinson, K.A.; Palubok, V.I. Effects of multiple karenia brevis red tide blooms on a common bottlenose dolphin (Tursiops truncatus) Prey fish assemblage: Patterns of resistance and resilience in Sarasota Bay, Florida. Front. Mar. Sci. 2021, 8, 1068. [Google Scholar] [CrossRef]
- Gunter, G.; Williams, R.H.; Davis, C.C.; Smith, F.G.W. Catastrophic Mass Mortality of marine animals and coincident phytoplankton bloom on the west coast of Florida, November 1946 to August 1947. Ecol. Monogr. 1948, 18, 310–324. [Google Scholar] [CrossRef]
- Forrester, D.J.; Gaskin, J.M.; White, F.H.; Thompson, N.P.; Quick, J.A., Jr.; Henderson, G.E.; Woodard, J.C.; Robertson, W.D. An epizootic of waterfowl associated with a red tide episode in Florida. J. Wildl. Dis. 1977, 13, 160–167. [Google Scholar] [CrossRef]
- Plakas, S.M.; Dickey, R.W. Advances in monitoring and toxicity assessment of brevetoxins in molluscan shellfish. Toxicon 2010, 56, 137–149. [Google Scholar] [CrossRef] [PubMed]
- Pierce, R.H.; Henry, M.S.; Proffitt, L.S.; Hasbrouck, P.A. Red Tide Toxin (Brevetoxin) Enrichment in Marine Aerosol. In Toxic Marine Phytoplankton; Graneli, E., Sundstrim, B., Elder, L., Anderson, D., Eds.; Elsevier: Amsterdam, The Netherlands, 1990; pp. 128–131. [Google Scholar]
- Backer, L.C.; Fleming, L.E.; Rowan, A.; Cheng, Y.; Benson, J.; Pierce, R.H.; Zaias, J.; Bean, J.; Bossart, G.D.; Johnson, D.; et al. Recreational exposure to aerosolized brevetoxins during Florida red tide events. Harmful Algae 2003, 2, 19–28. [Google Scholar] [CrossRef]
- Benbrook, C.M. Trends in glyphosate herbicide use in the United States and globally. Environ. Sci. Eur. 2016, 28, 3. [Google Scholar] [CrossRef] [PubMed]
- Grandcoin, A.; Piel, S.; Baurès, E. AminoMethylPhosphonic acid (AMPA) in natural waters: Its sources, behavior and environmental fate. Water Res. 2017, 117, 187–197. [Google Scholar] [CrossRef] [PubMed]
- Chaufan, G.; Coalova, I.; de Molina Mdel, C.R. Glyphosate commercial formulation causes cytotoxicity, oxidative effects, and apoptosis on human cells: Differences with its active ingredient. Int. J. Toxicol. 2014, 33, 29–38. [Google Scholar] [CrossRef]
- De María, M.; Silva-Sanchez, C.; Kroll, K.J.; Walsh, M.T.; Nouri, M.-Z.; Hunter, M.E.; Ross, M.; Clauss, T.M.; Denslow, N.D. Chronic exposure to glyphosate in Florida manatee. Environ. Int. 2021, 152, 106493. [Google Scholar] [CrossRef]
- Lushchak, O.; Kubrak, O.I.; Storey, J.M.; Storey, K.B.; Lushchak, V.I. Low toxic herbicide roundup induces mild oxidative stress in goldfish tissues. Chemosphere 2009, 76, 932–937. [Google Scholar] [CrossRef]
- Glusczak, L.; Loro, V.L.; Pretto, A.; Moraes, B.S.; Raabe, A.; Duarte, M.F.; da Fonseca, M.B.; de Menezes, C.C.; Valladão, D.M.D.S. Acute exposure to glyphosate herbicide affects oxidative parameters in Piava (Leporinus obtusidens). Arch. Environ. Contam. Toxicol. 2011, 61, 624–630. [Google Scholar] [CrossRef]
- Sheals, J.; Sjöberg, S.; Persson, P. Adsorption of glyphosate on Goethite: Molecular characterization of surface complexes. Environ. Sci. Technol. 2002, 36, 3090–3095. [Google Scholar] [CrossRef]
- Gimsing, A.L.; Borggaard, O.K. Effect of KCl and CaCl2 as background electrolytes on the competitive adsorption of glyphosate and phosphate on Goethite. Clay Clay Min. 2001, 49, 270–275. [Google Scholar] [CrossRef]
- Gimsing, A.L.; Borggaard, O.K.; Bang, M. Influence of soil composition on adsorption of glyphosate and phosphate by contrasting Danish surface soils. Eur. J. Soil Sci. 2004, 55, 183–191. [Google Scholar] [CrossRef]
- Gimsing, A.L.; Borggaard, O.K. Competitive adsorption and desorption of glyphosate and phosphate on clay silicates and oxides. Clay Min. 2002, 37, 509–515. [Google Scholar] [CrossRef]
- Gimsing, A.L.; Borggaard, O.K.; Sestoft, P. Modeling the kinetics of the competitive adsorption and desorption of glyphosate and phosphate on goethite and gibbsite and in soils. Environ. Sci. Technol. 2004, 38, 1718–1722. [Google Scholar] [CrossRef]
- Bohn, H.L.; OConner, G.A.; Strawn, D.G. Soil Chemistry; John Wiley & Sons: Hoboken, NJ, USA, 2015. [Google Scholar]
- Ogata, A. Mathematics of Dispersion with Linear Adsorption Isotherm; Geological Survey Professional Paper 411-H; United States Government Printing Office: Washington, DC, USA, 1964. [Google Scholar]
- Subramanyam, B.; Das, A. Linearized and non-linearized isotherm models comparative study on adsorption of aqueous phenol solution in soil. Int. J. Envion Sci. Technol. 2009, 6, 633–640. [Google Scholar] [CrossRef]
- Foo, K.Y.; Hameed, B.H. Insights into the modeling of adsorption isotherm systems. Chem. Eng. J. 2010, 156, 2–10. [Google Scholar] [CrossRef]
- Soil Survey Staff, Natural Resources Conservation Service, United States Department of Agriculture. Official Soil Series Descriptions. Available online: https://www.nrcs.usda.gov/resources/data-and-reports/web-soil-survey (accessed on 20 March 2020).
- Kadyampakeni, D.M.; Morgan, K.T.; Mahmoud, K.; Schumann, A.; Nkedi-Kizza, P. Phosphorus and potassium distribution and adsorption on two Florida sandy soils. Soil. Sci. Soc. Am. J. 2014, 78, 325–334. [Google Scholar] [CrossRef]
- Winfield, T.W.; Bashe, W.J.; Baker, T.V. US Environmental Protection Agency Method 547, Determination of Glyphosate in Drinking Water by Direct-Aqueous Injection HPLC, Post-Column Derivatization, and Fluorescence Detection; US Environmental Protection Agency: Cincinnati, OH, USA, 1990. [Google Scholar]
- Environmental Protection Agency. Fate, Transport, and Transformation Test Guidelines: Adsorption/Desorption (Batch Equilibrium); Government Printing Office: Washington, DC, USA, 2008. [Google Scholar]
- Harris, W.G.; Rhue, R.D.; Kidder, G.; Brown, R.B.; Littell, R. Phosphorus retention as related to morphology of sandy coastal plain soil materials. Soil. Sci. Soc. Am. J. 1996, 60, 1513–1521. [Google Scholar] [CrossRef]
- Essington, M. Surface Chemistry and Adsorption Reactions. In Soil and Water Chemistry: An Integrative Approach; CRC Press: Boca Raton, FL, USA, 2015; pp. 383–486. [Google Scholar]
- Mehlich, A. Mehlich 3 soil test extractant: A modification of Mehlich 2 extractant. Commun. Soil Sci. Plant Anal. 1984, 15, 1409–1416. [Google Scholar] [CrossRef]
- Havlin, J.; Tisdale, S.; Nelson, W.; Beaton, J. Phosphorus. Soil Fertility and Fertilizers: An Introduction to Nutrient Management; Pearson: London, UK, 2016; pp. 185–221. [Google Scholar]
- Zhou, M.; Li, Y. Phosphorus-sorption characteristics of calcareous soils and limestone from the southern everglades and adjacent farmlands. Soil. Sci. Soc. Am. J. 2001, 65, 1404–1412. [Google Scholar] [CrossRef]
- Zhang, M.K.; Calvert He, Z.L.; Stoffella, D.V.; Li, Y.C.; Lamb, E.M. Release potential of phosphorus in Florida sandy soils in relation to phosphorus fractions and adsorption capacity. J. Environ. Sci. Health Part A 2002, 37, 793–809. [Google Scholar] [CrossRef]
- Dari, B.; Nair, V.D.; Harris, W.G.; Nair, P.; Sollenberger, L.; Mylavarapu, R. Relative influence of soil- vs. biochar properties on soil phosphorus retention. Geoderma 2016, 280, 82–87. [Google Scholar] [CrossRef]
- Torrent, J.; Delgado, A. Using phosphorus concentration in the soil solution to predict phosphorus desorption to water. J. Environ. Qual. 2001, 30, 1829–1835. [Google Scholar] [CrossRef] [PubMed]
- DeLuca, T.; Gundale, M.; MacKenzie, D.; Jones, D. Biochar Effects on Soil Nutrient Transformations. In Biochar for Environ-Mental Management, 2nd ed.; Lehmann, J., Joseph, S., Eds.; Routledge: London, UK, 2015; pp. 421–454. [Google Scholar]
- Ramulu, U.S.S.; Pratt, P.F.; Page, A.L. Phosphorus fixation by soils in relation to extractable iron oxides and mineralogical composition. Soil. Sci. Soc. Am. J. 1967, 31, 193–196. [Google Scholar] [CrossRef]
- Udo, E.J.; Uzu, F.O. Characteristics of phosphorus adsorption by some Nigerian soils. Soil. Sci. Soc. Am. J. 1972, 36, 879–883. [Google Scholar] [CrossRef]
- Reddy, R.; DeLaune, R. Biogeochemistry of Wetlands: Science and Applications; CRC Press: Boca Raton, FL, USA, 2008. [Google Scholar]
- Borggaard, O.K.; Gimsing, A.L. Fate of glyphosate in soil and the possibility of leaching to ground and surface waters: A review. Pest. Manag. Sci. 2008, 64, 441–456. [Google Scholar] [CrossRef]
- Munira, S.; Farenhorst, A.; Akinremi, W. Phosphate and glyphosate sorption in soils following long-term phosphate applications. Geoderma 2018, 313, 146–153. [Google Scholar] [CrossRef]
- Kanissery, R.G.; Welsh, A.; Sims, G.K. Effect of soil aeration and phosphate addition on the microbial bioavailability of carbon-14-glyphosate. J. Environ. Qual. 2015, 44, 137–144. [Google Scholar] [CrossRef]
- Sprankle, P.; Meggitt, W.F.; Penner, D. Adsorption, mobility, and microbial degradation of glyphosate in the soil. Weed Sci. 1975, 23, 229–234. [Google Scholar] [CrossRef]
- Sprankle, P.; Meggitt, W.F.; Penner, D. Rapid inactivation of glyphosate in the soil. Weed Sci. 1975, 23, 224–228. [Google Scholar] [CrossRef]
- Uthman, Q.O.; Kadyampakeni, D.M.; Nkedi-Kizza, P. Manganese adsorption, availability, and uptake in citrus under microsprinkler irrigation. Age 2020, 3, e20061. [Google Scholar] [CrossRef]
- Veiga, F.; Zapata, J.M.; Fernandez Marcos, M.L.; Alvarez, E. Dynamics of glyphosate and aminomethylphosphonic acid in a forest soil in Galicia, north-west Spain. Sci. Total Environ. 2001, 271, 135–144. [Google Scholar] [CrossRef] [PubMed]
- Landry, D.; Dousset, S.; Fournier, J.C.; Andreux, F. Leaching of glyphosate and AMPA under two soil management practices in Burgundy vineyards (Vosne-Romanée, 21-France). Environ. Pollut. 2005, 138, 191–200. [Google Scholar] [CrossRef] [PubMed]
Disclaimer/Publisher’s Note: The statements, opinions and data contained in all publications are solely those of the individual author(s) and contributor(s) and not of MDPI and/or the editor(s). MDPI and/or the editor(s) disclaim responsibility for any injury to people or property resulting from any ideas, methods, instructions or products referred to in the content. |
© 2023 by the authors. Licensee MDPI, Basel, Switzerland. This article is an open access article distributed under the terms and conditions of the Creative Commons Attribution (CC BY) license (https://creativecommons.org/licenses/by/4.0/).