Abstract
Sustainable crop and weed management is among the crucial challenges in the era of the EU Green Deal. The main objective of the present study was to apply an innovative approach for the rapid assessment of herbicide efficacy in maize (Zea mays) crop in four different trials during two years. Weed NDVI values were recorded at two weeks after treatment, while weed biomass and crop yield were also measured. The results revealed significant differences between the several treatments. In many cases, significant effects of herbicide application on the normalized difference vegetation index (NDVI) values and weed biomass were noticed at two weeks after treatment. Moreover, the mixture nicosulfuron + rimsulfuron + mesotrione resulted in high efficacy on the crop yield of all fields. Consequently, our approach can allow for an early prediction of the real field efficacy of several herbicides and thus act as an alert for the farmers in order to choose the most efficient herbicide, avoid applications of low efficacy and reduce the herbicide inputs.
1. Introduction
Weeds have been identified as the most important pests for important crops like wheat, rice, maize and soybean [1]. Up to now, chemical control has played a pivotal role in successful weed management. However, the development of herbicide-resistant weed biotypes tends to put into danger their overall efficacy [2]. Furthermore, recent policies like the EU Green Deal and “Farm to Fork” strategy have set ambitious and challenging goals toward a more sustainable agriculture and a vast reduction in herbicide use [3].
Several sensor-based approaches have been developed for evaluating plant health and estimating crop growth and productivity [4]. Among the several indices, the normalized difference vegetation index (NDVI) is one of the most widely used [5,6]. In precision agriculture, the NDVI is used to identify differently managed zones in herbaceous crops [7]. In particular, a novel method based on the NDVI was recently proposed by Travlos et al. (2021) for the early assessment of the herbicides’ efficacy in durum wheat crop [8], while hyperspectral imaging and machine learning were used for the early detection of the herbicidal effect [9].
Furthermore, unmanned aerial vehicle (UAV) platforms, sensor technologies and Sentinel-2 multispectral time-series data have been lately used and studied toward the identification and assessment of herbicide-resistant weeds and the efficacy of glyphosate-based herbicides [10,11].
The aim of the present study was to evaluate our novel method in terms of herbicide performance in maize crop. The assessment of herbicide performance was based on the NDVI values recorded within a few days after the application. Destructive measurements were taken to validate the reliability of the method whereas the effect of herbicide application on maize yield was also studied.
2. Materials and Methods
2.1. Site Description
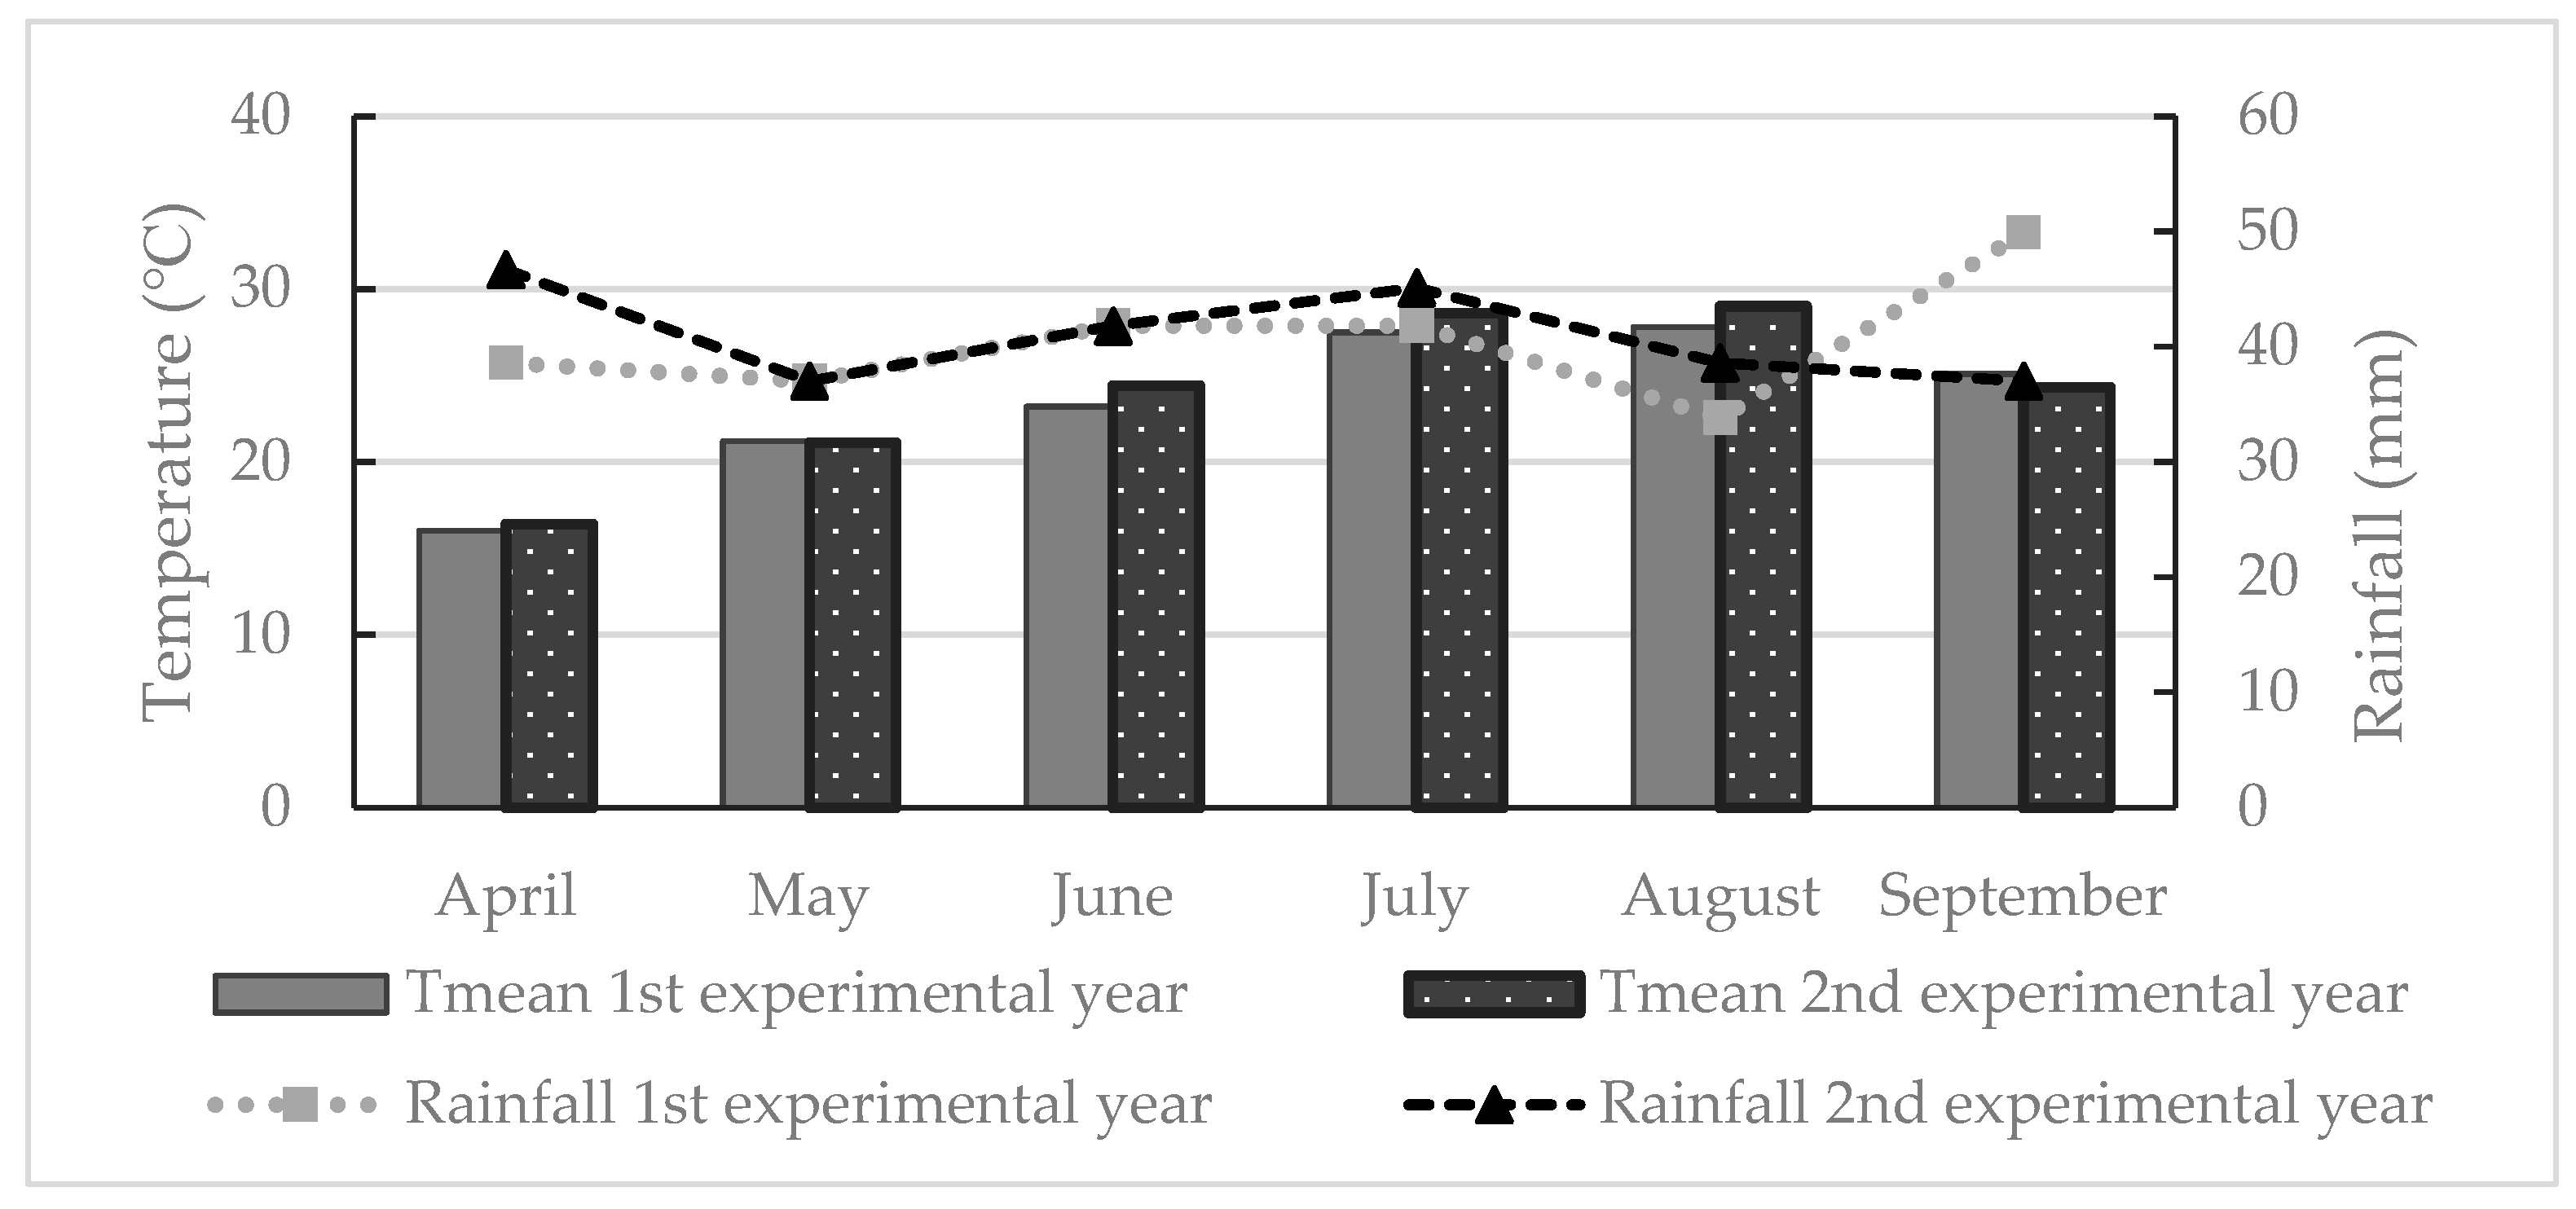
Field trials were carried out and repeated for two consecutive growing seasons in several maize (Zea mays L.) fields in Pyrgos region, Western Greece (Table 1). The selection of fields was based on the reports of local farmers for the inadequate efficacy of herbicide applications. For each location, soil properties of fields and meteorological data were recorded. Before experimental establishment, soil samples were taken at 0–25 cm depth in order to have an idea of the main soil characteristics of each trial, which are described in Table 1. Regarding the weather data, the average monthly air temperature and rainfall were collected on a daily basis and given as mean monthly values for the study period (Figure 1). The climatic conditions in both experimental seasons were quite similar and typical of the Mediterranean basin.

Table 1.
Specific geographic position and soil features of experimental fields in maize crop for both growing seasons.
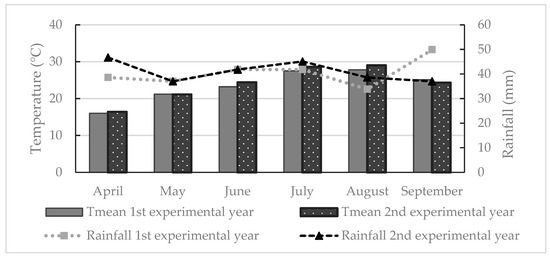
Figure 1.
Monthly mean temperature (Tmean) and total rainfall during the two growing seasons (1st experimental year and 2nd experimental year) where the experiments were conducted.
2.2. Experimental Setup and Design
For all the studied fields, experimental trials were conducted on already established maize fields. According to farmers, seedbed preparation of each trial was carried out one week before sowing by plowing with a cultivator to a depth of 20 cm and followed by harrowing. Maize sowing was carried out at the beginning of April for both growing seasons (Table 2) at an approximate rate of 70,000 to 80,000 seeds ha−1. In all fields, the crop was sown in rows separated by 75 cm, with 5 cm spacing within the rows. No disease and insect pest control practices were followed since infestations were not detected in any experimental run for both growing seasons. The abovementioned crop management procedures were identical in all experimental fields.

Table 2.
Maize sowing dates for each growing season (1st experimental year and 2nd experimental year).
Regarding the experimental setup, we walked through each field on the two diagonals in order to define the most frequent weed species [7]. In each field, areas with representative weed flora were chosen for the establishment of the field trials, and GPS coordinates were recorded [12] to resettle the trials in the following year. The selected area was organized in a randomized complete block design (RCBD) with seven treatments and four replications, resulting in a total of twenty-eight plots. The plot size of each treatment was 2.5 m long × 4 m wide with 5 rows and occupied a surface of 10 m2. The total experimental area in each maize field was 280 m2.
Fields were treated with six different post-emergence herbicides including five prepackaged herbicide mixtures, and 2,4-D at the maximum recommended application dose (Table 3). A weedy check (control) treatment was also added. Herbicides were applied with five spray nozzles (spray angle: 80°) of the pressurized backpack sprayer Gloria © 405 T (Gloria Haus & Gartengeraete GMBH, Witten, Germany). Sprayers were calibrated to deliver 300 L·ha−1 of spray solution at 300 kPa except for 2,4-D, which was applied with 200 kPa pressure according to the registration’s recommendations. At the time of herbicide application, maize plants had reached the phenological stage of 2–6 true leaves corresponding to stages 12–16 of the BBCH scale, while weeds were between 3 and 5 leaves.

Table 3.
Description of the treatments, mechanism of action, application rates, commercial products and manufacturer names included in the treatment list in all four sites for both experimental years.
2.3. Data Collection
To evaluate herbicide efficacy, NDVI, weed dry biomass and maize yield measurements were carried out. Prior to measurements, three 0.25 m2 metal quadrats were placed permanently around the middle of each plot with awareness of including a uniform weed flora and remaining away from plot margins. Each quadrat was positioned between the rows of maize crop in order to contain only the weed species. To measure weed NDVI, a Trimble ® GreenSeeker® handheld sensor (Trimble Agriculture Division, Westminster, CO, USA) was used. The sensor unit has self-contained illumination in both red and near-infrared (NIR) ranges and shows the reflectance in the red (visible 660 nm) and NIR (visible 770 nm) portion of the electromagnetic spectrum [12,13] corresponding to the subsequent Equation (1):
NDVI measurements were conducted in the areas marked by the quadrats at 0, 4, 7 and 14 days after treatments (DAT), whereas the first NDVI measurement and the weed density (0 DAT) preceded the herbicide application. Regarding the procedure of NDVI records in each plot, the sensor was placed in parallel to the direction of the crop rows and held stable at a height of 25–30 cm above the weed leaf area. The device was moved slowly within the limits of the quadrat for 5 s as recommended by Kong et al. [14]. This procedure was repeated twice per quadrat to detect almost all existing weeds, and then recorded values were averaged. All NDVI measurements were taken at midday between 13:00 pm and 15:00 pm as suggested by previous relative studies [8].
To validate the method and determine whether the low NDVI values corresponded to the most efficient herbicide applications, weed population and dry matter were also recorded before maize harvest. Weeds from two quadrats of each plot were sampled at 0, 7 and 14 DAT. In particular, the aboveground biomass was harvested by cutting at a height of 3–5 cm height [15], and weed species were identified and counted. Then, the fresh weed biomass of 7 and 14 DAT destructive measurements was oven-dried at 60 ℃ for 48 h to a constant weight to record weed dry weight. Values obtained were transformed per area unit for density (numbers m−2) and biomass (g·m−2). Simpson index was also calculated based on the data of the sampled weeds at 0 DAT to evaluate the weed diversity in each plot [16] (Equation (2)). For the calculation of the index, values of two quadrats per plot were averaged.
At the growth stage of maize grain maturity (BBCH 89), all ears from plants of the middle rows in an area of 6 m2 were harvested. Then, ears were dried in the oven at 70 °C until a constant weight was accomplished and the final yield was determined at a grain moisture content of 14%. Grain yield per unit area was calculated by multiplying the number of ears per unit area (number m−2), the number of rows per ear (number ear−1), the number of kernels per row (number row−1) and the mean weight of one kernel (g), which was calculated from the 10,000 kernels weight [17].
2.4. Statistical Analysis
Normal distribution of all data was confirmed with the Shapiro–Wilk test [18], while the variance check was performed by Levene’s test [19]. All data were subjected to a two-way analysis of variance (ANOVA) using the STATGRAPHICS Centurion XVII Version statistical software (Statpoint Technologies Inc., The Plains, VA, USA). The site-years and herbicide treatments were taken into account as fixed effects and replicates as random effects. Differences between treatments were compared by using Fisher’s least significant difference (LSD) test, where probabilities are equal to or less than 0.05 (a = 5%). Linear regressions were also performed according to the following linear model (Equation (3)):
where the dependent variable y is weed biomass or grain yield, the independent x is weed NDVI, a is the intercept and b is the slope of the regression line.
3. Results and Discussion
A total of five most frequent weed species were identified during the two experimental years, including the grasses Sorghum halepense L. and Echinochloa spp. L. and the broadleaves Datura stramonium L., Solanum nigrum L. and Amaranthus spp. L. In the field Pyrgos1, the dominant weed was Solanum nigrum with a density of 11 and 12 plants m−2 for the first and second experimental years, respectively (consisting of 70% of total weed flora). A similar density was recorded in the field Pyrgos 4 for the dominant weed species Echinochloa spp. Regarding the experimental fields P2 and P3, a high weed diversity was noted and thus no dominant species emerged (Table 4). Simpson index calculation proved that weed flora was uniform before the application of herbicide treatments (0 DAT) in each plot of the studied fields and remained the same during the experimental years. That observation was a prerequisite for the establishment of field trials in order to ensure that NDVI measurements would be derived by baseline plots with homogenous weed flora (Table 4).

Table 4.
Simpson index of weed flora of each treatment plot before the application of herbicide (0 DAT) for the first and second experimental years. T: herbicide treatments (Τ1: untreated control; Τ2: nicosulfuron + rimsulfuron + mesotrione; T3: nicosulfuron + rimsulfuron + dicamba; T4: nicosulfuron + rimsulfuron; T5: florasulam + mesotrione; T6: mesotrione + nicosulfuron; T7: 2,4-D ester); Y: year.
3.1. Herbicide Efficacy
Herbicide treatments significantly affected the NDVI values for both years of experimentation (p < 0.001), whereas non important differences were documented between the experimental fields (ns; p > 0.05). Since the environmental conditions were similar, NDVI values of weed flora did not differ between the fields (Figure 1). That fact is easily noticeable from the NDVI values of the untreated control (T1) at 14 DAT and is in agreement with previous studies [8]. For instance, the NDVI of T1 for fields Pyrgos1, Pyrgos2, Pyrgos3 and Pyrgos4 was 0.71, 0.69, 0.71 and 0.69, respectively, in the second year of experimentation.
Regarding the herbicide treatments, chlorotic symptoms were caused in the leaf tissues of weeds, and weed growth was inhibited compared with the untreated control. These symptoms were not detectable in the second measurement (7 DAT) of the NDVI in most of the studied fields. The very short time after application led to insignificant differences between NDVI values of plots treated with the herbicides and untreated plots (T1) (ns; p > 0.05). Therefore, data only from the third NDVI measurement (14 DAT) are presented below (Table 5).

Table 5.
Normalized difference vegetation index (NDVI) values recorded at 14 DAT and total weed aboveground biomass per unit area (kg·ha−1). Herbicide treatments (Τ1: untreated control; Τ2: nicosulfuron + rimsulfuron + mesotrione; T3: nicosulfuron + rimsulfuron + dicamba; T4: nicosulfuron + rimsulfuron; T5: florasulam + mesotrione; T6: mesotrione + nicosulfuron; T7: 2,4-D ester).
The analysis of variance revealed significant effects of herbicide application on the NDVI values at 14 DAT in the first field at Pyrgos (Pyrgos1) (p < 0.001). On the contrary, there were no significant differences between the experimental years (ns; p > 0.05). All herbicide treatments reduced the weed NDVI values across the growing seasons, exactly as found in previous studies [20,21,22]. For the first experimental year, the lowest value (0.48) was recorded in plots treated with nicosulfuron + rimsulfuron + dicamba (T3) at 14 DAT. During the following year, the highest decline in the NDVI (40.8 %) was caused by nicosulfuron + rimsulfuron + mesotrione (T2) compared with the untreated plots (T1). The effect of herbicide application was well depicted in the dry biomass of weeds, where all treatments led to a significant decrease compared with untreated plots (T1) (p < 0.001). The lowest values of weed growth (biomass production) were noted in the experimental plots treated with nicosulfuron + rimsulfuron + mesotrione (T2), recording 497.6 kg ha−1, a fact that follows the low NDVI values (Table 5).
Regarding the results of the Pyrgos2 field, herbicide treatments negatively affected the existing weeds in total. The measurement of the NDVI at 14 DAT demonstrated the high efficacy of the herbicide mixture nicosulfuron + rimsulfuron + dicamba (T3) for both experimental years. In particular, NDVI values were reduced compared to untreated plots (T1) by 34% and 26% in the first and second experimental years, respectively. Even though the florasulam + mesotrione mixture (T5) tended to reduce NDVI values, it showed the lowest herbicide efficacy. This finding was also presented in the increased weed biomass across the experimental years. Moreover, the efficacy of herbicide application with nicosulfuron + rimsulfuron + dicamba (T3) was also observed in the aboveground weed biomass, the lowest values recording 497.6 kg ha−1 and 411.7 kg ha−1 for the first and second year, respectively (Table 5).
In terms of the experimental field at Pyrgos3, the highest efficacy was observed by the application of the florasulam + mesotrione (T5), while the lowest efficacy was showed by nicosulfuron + rimsulfuron (T4) for both years. The herbicide mixture T5 caused a significant decrease in the NDVI values of 37.5% and 24% in the first and second experimental years, respectively. These low NDVI values were followed by a reduction in weed biomass at 14 DAT in both experimental years. In particular, the application of T5 caused a 64.2% and 53.8% decrease in aboveground weed biomass in the first and the following experimental years. On the contrary, herbicide mixture T4 had no effect on the NDVI compared to the untreated plants in the first growing season, while, in the following year, an insignificant reduction of 8.4% was recorded. A similar trend was documented in the impact of the nicosulfuron + rimsulfuron mixture (T4) on the growth of weeds (Table 5).
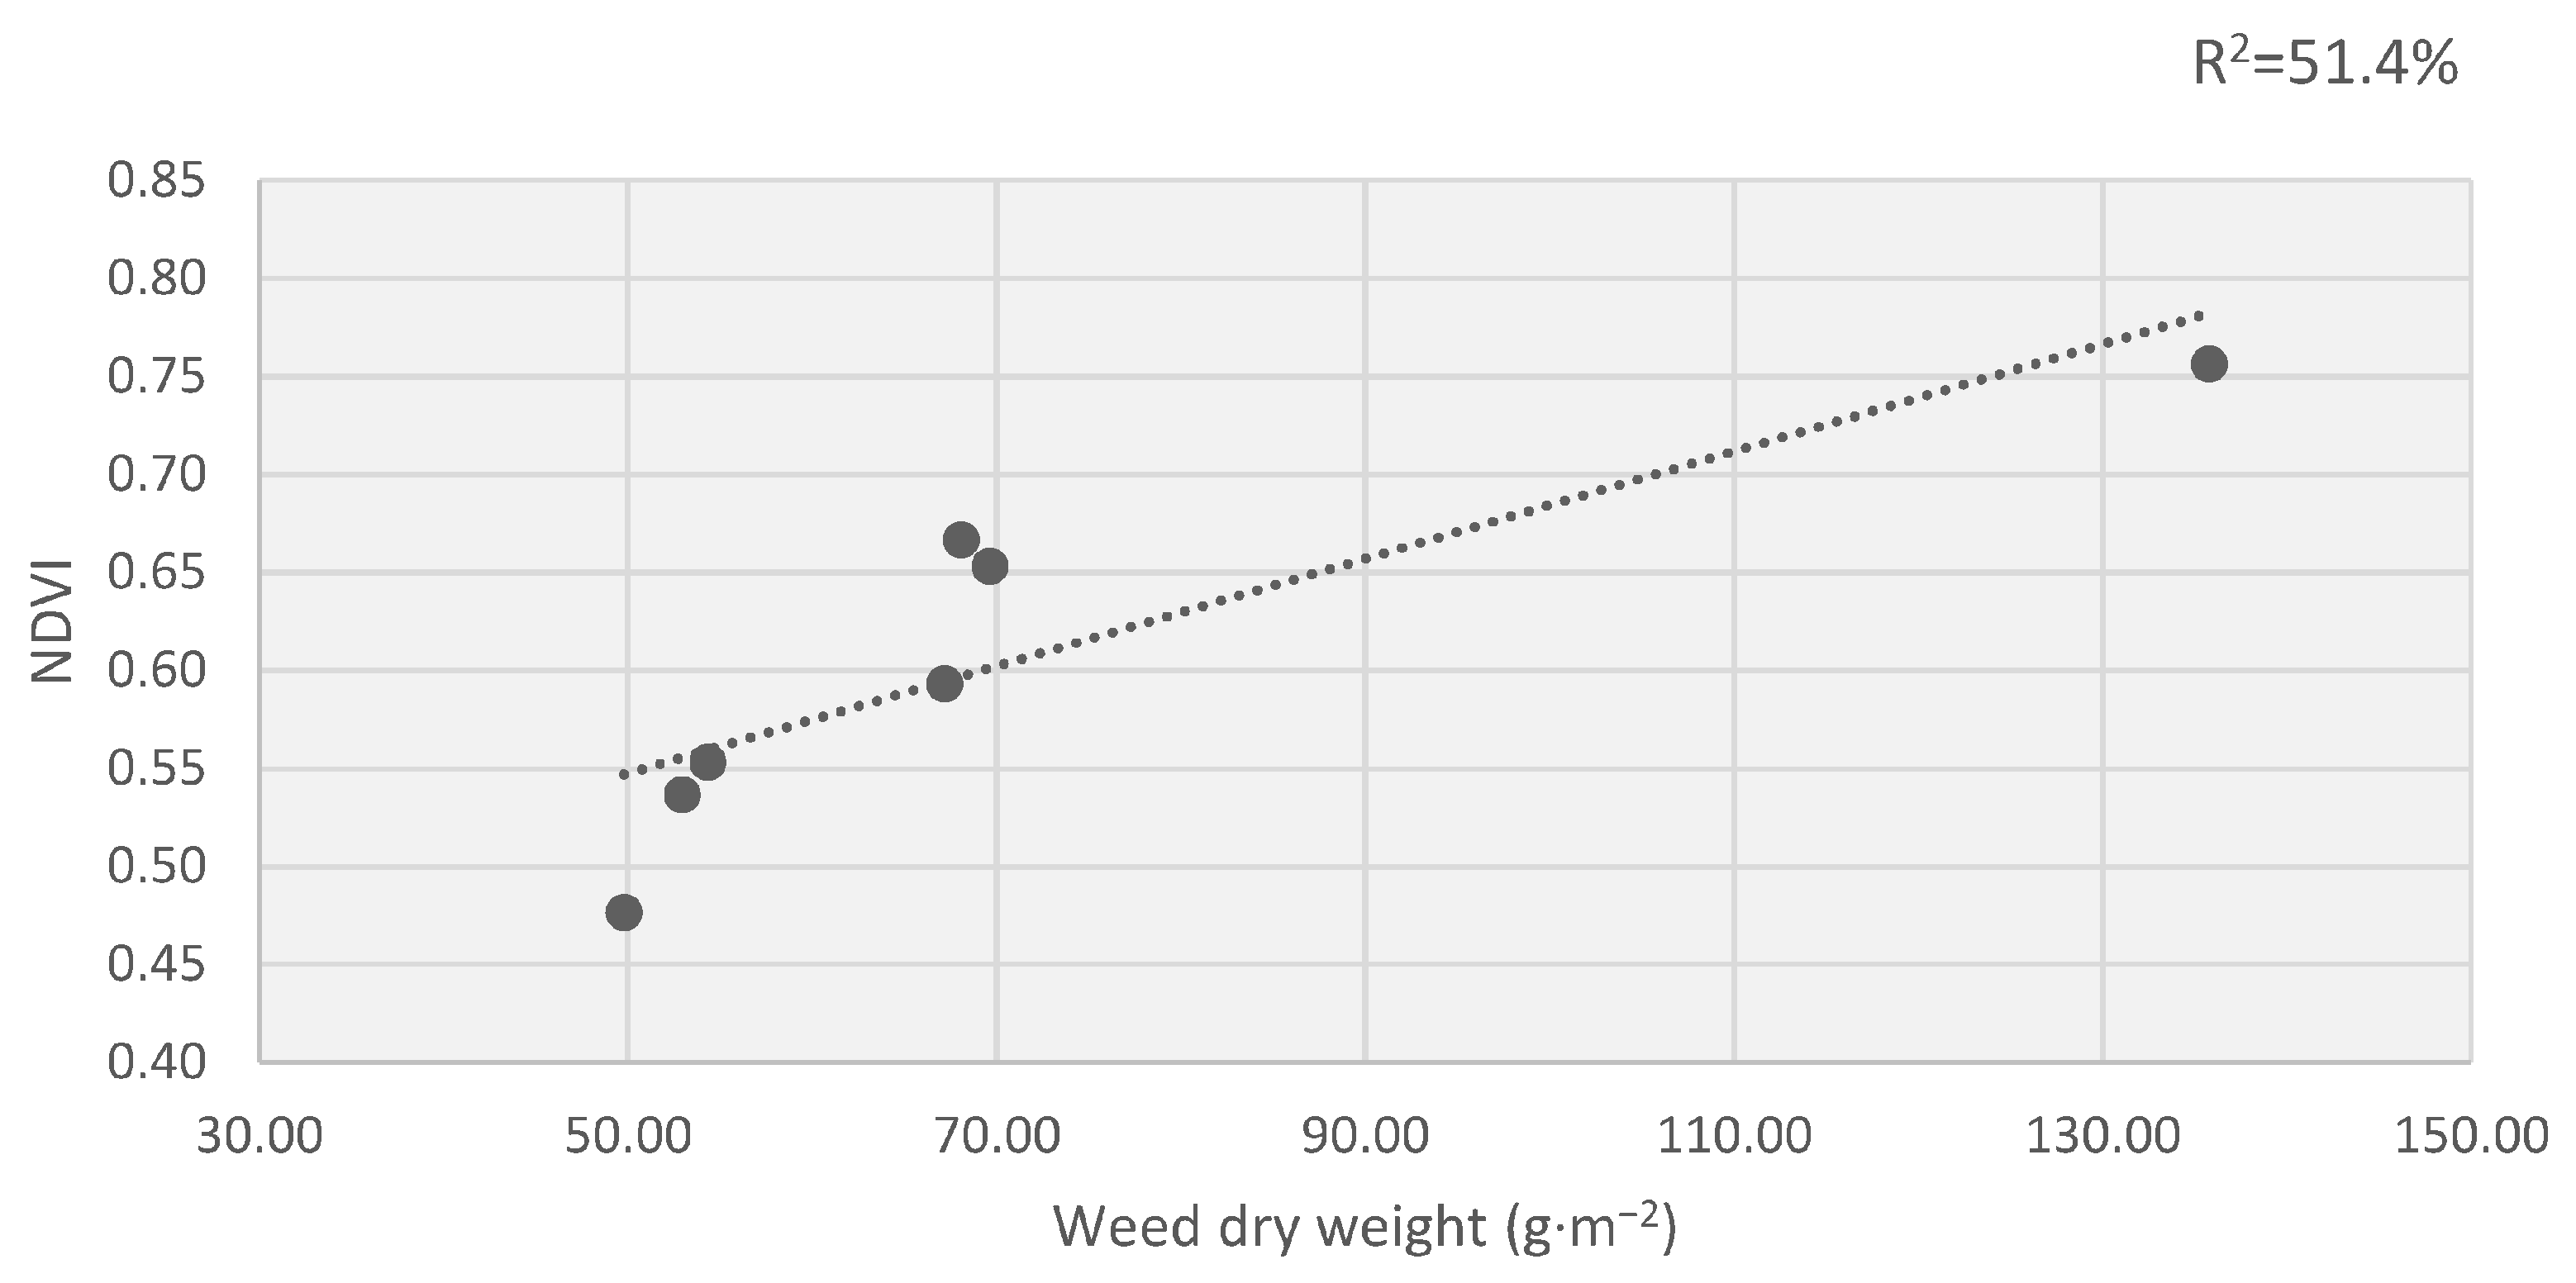
According to the analysis of variance, significant effects of herbicide treatment were revealed on the NDVI values and weed biomass at 14 DAT in the field at Pyrgos4 (p < 0.001) for both experimental years. All herbicide treatments decreased the NDVI, while the application of nicosulfuron + rimsulfuron + dicamba (T3) reduced the index the most compared to the untreated plants (T1). Among the experimental years, T3 showed the highest herbicide efficacy in the second year, resulting in a 40.6% NDVI reduction compared to the untreated plots (T1). The effect of T3 on weed flora was also well depicted in the low values of weed biomass at 14 DAT for both experimental years (Table 5). The herbicide mixture of nicosulfuron + rimsulfuron + dicamba (T3) reduced the weed biomass in about one-third of the untreated plots (T1). In general, it has to be also noted that the NDVI had a significant and positive correlation with weed biomass (Figure 2), confirming the capability of the specific vegetation index to evaluate weed growth. This finding is in agreement with previous studies in which spectral broadband vegetative indices were used for the quantification of the damage caused by the chemical control. Pause et al. [11] revealed that several vegetation indices and their time-series analysis can be used to quantify the impact of herbicides on vegetation and that the availability of satellite-based multi-spectral data can be exploited. Furthermore, this quick assessment of the herbicides’ performance shown in the present study could be also used as a potential indication of herbicide resistance and is based on the different chlorophyll content and cell wall structure of the susceptible and resistant biotypes [10].
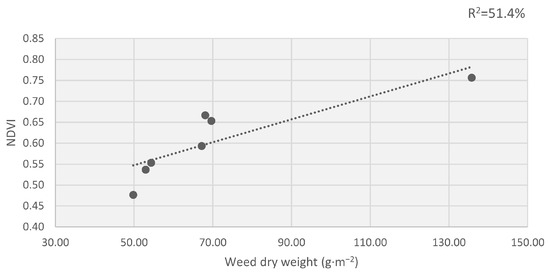
Figure 2.
Correlation between NDVI and weed biomass for the experimental field Pyrgos2 during the first growing season.
3.2. Maize Grain Yield
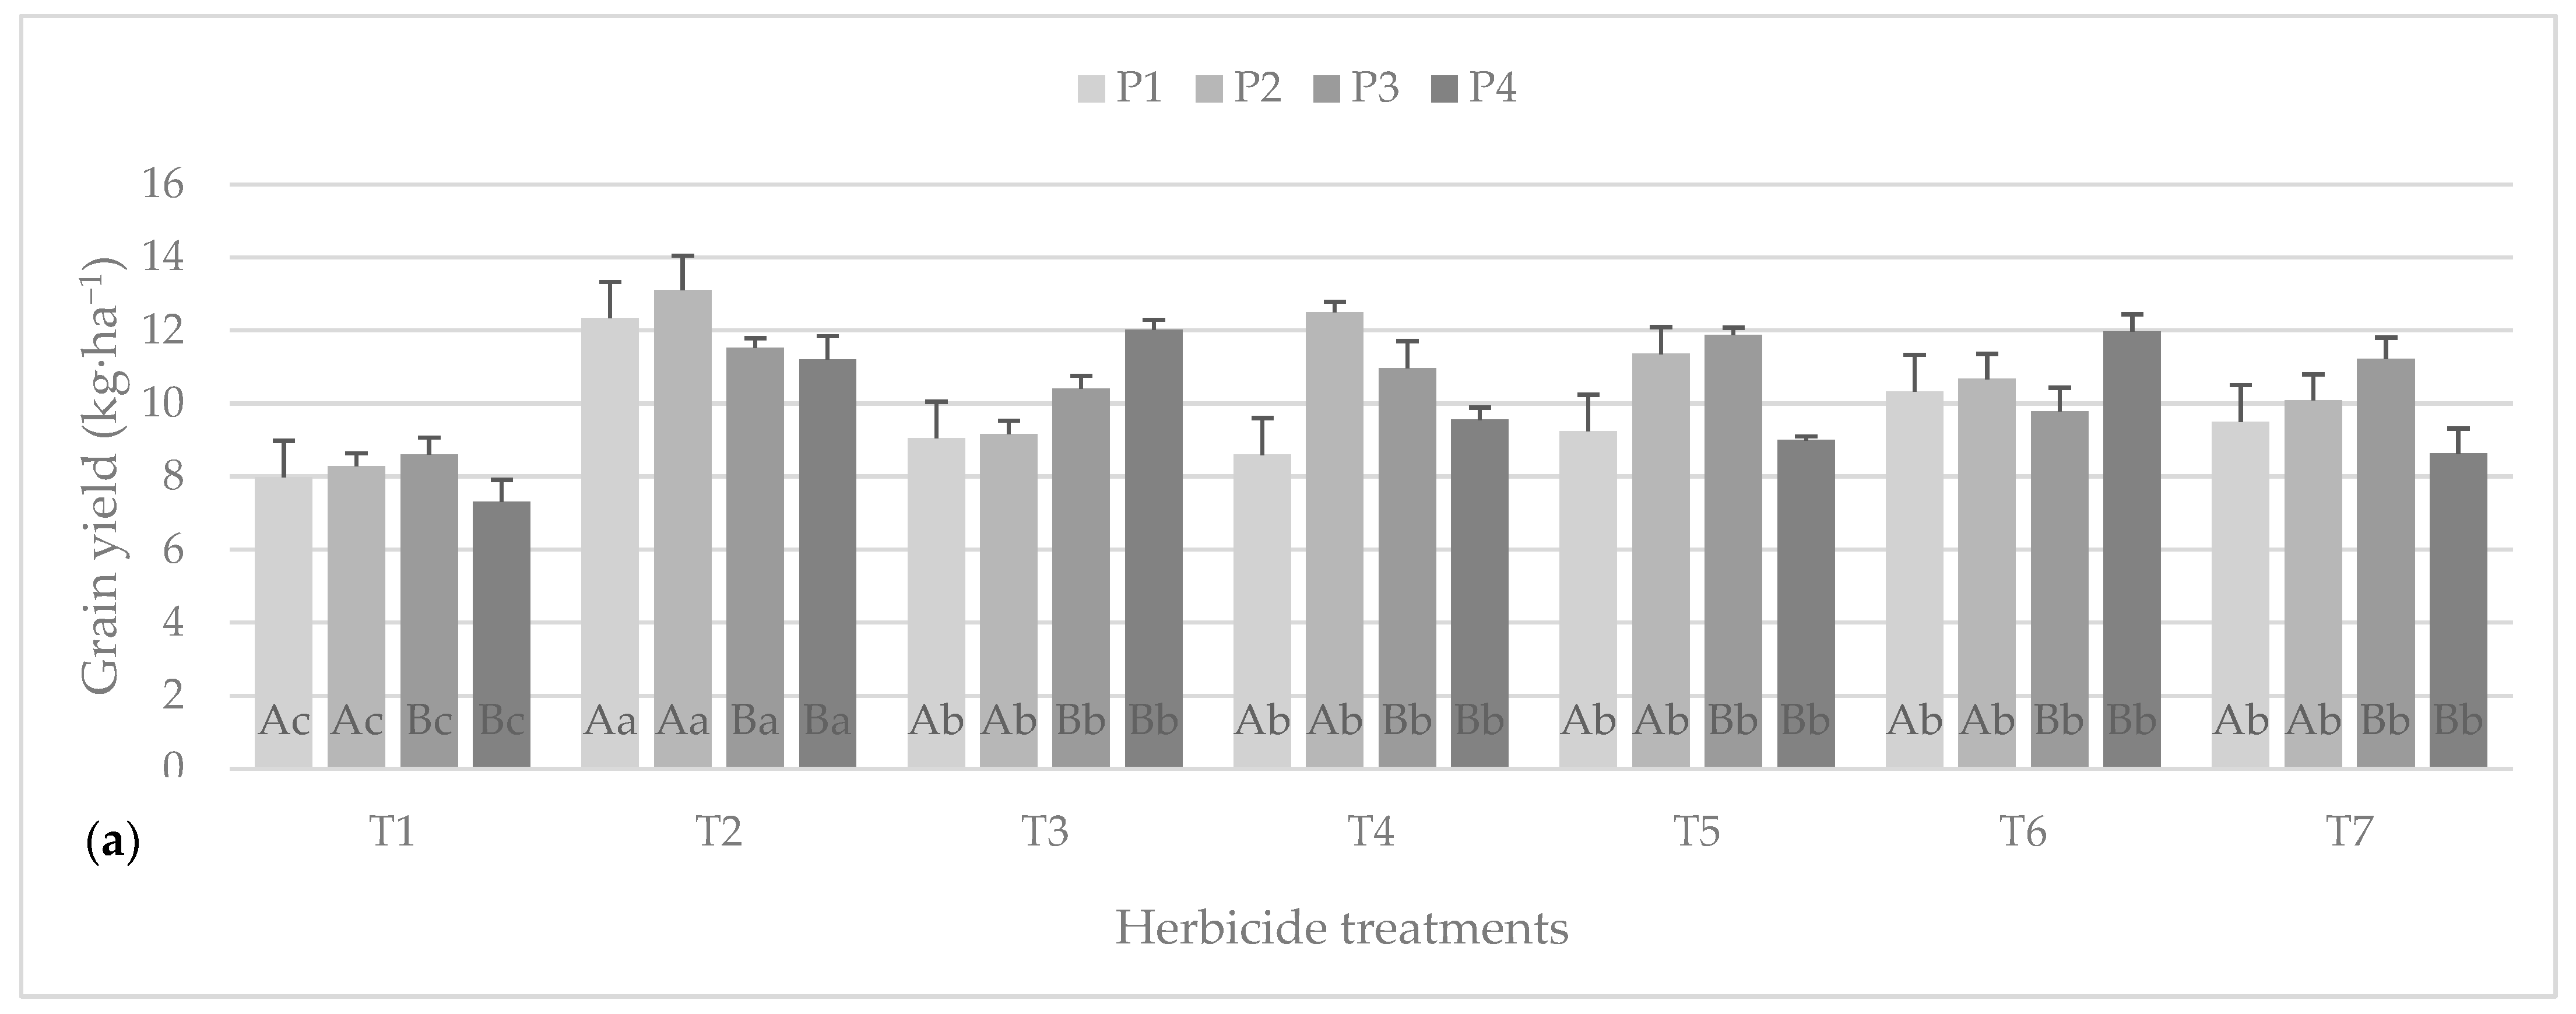
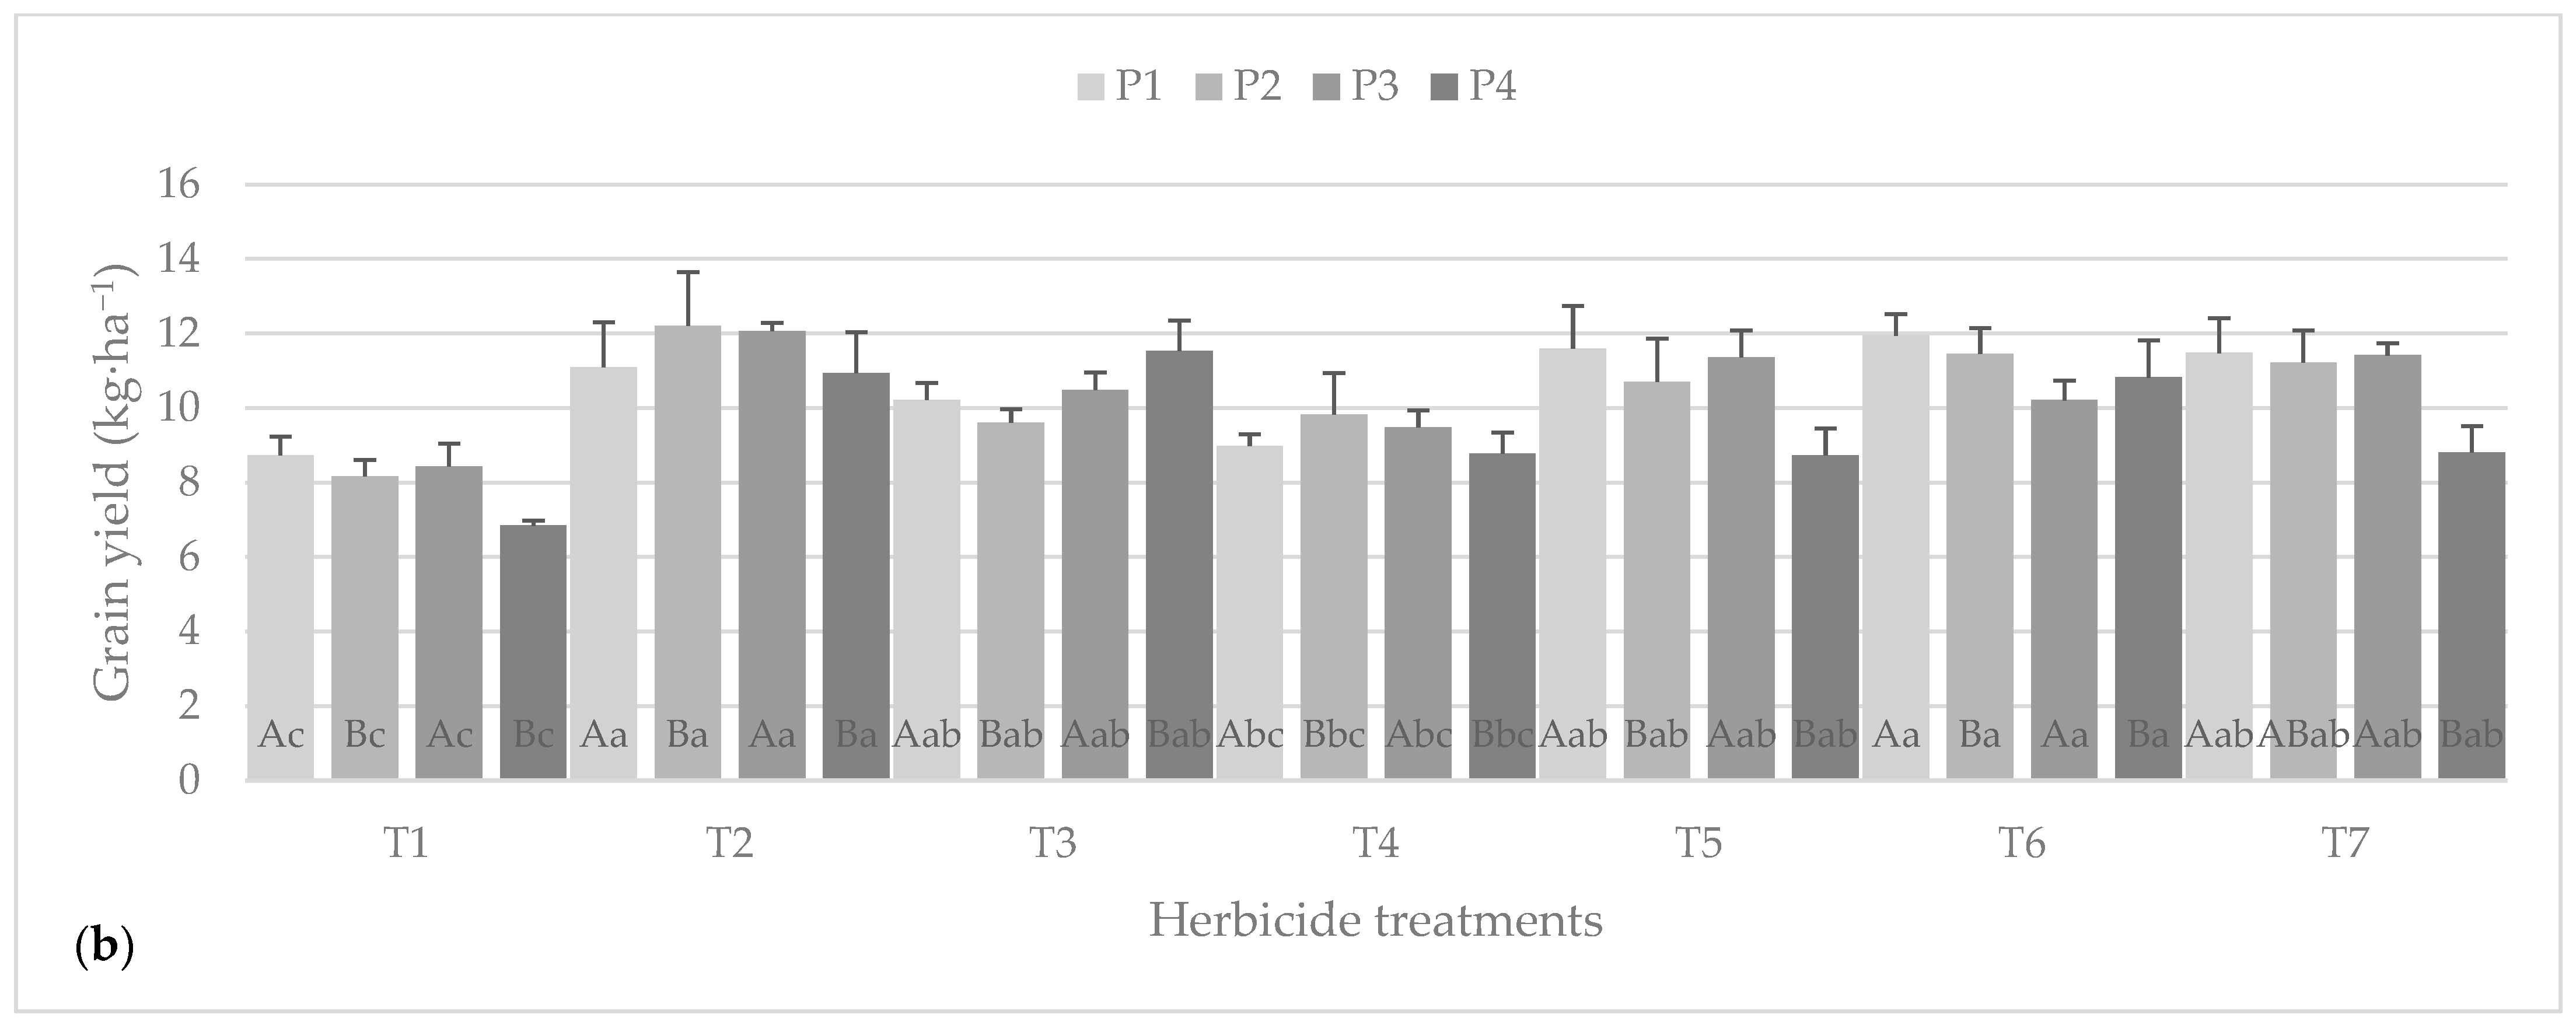
Maize grain yield was significantly affected by herbicide applications in all studied fields for both years of experimentation as indicated by the analysis of variance (p < 0.001). In total, maize plants in plots subjected to herbicide treatments showed a higher grain yield than plants in untreated control plots (T1). Herbicide applications reduced the effect of weed infestation on the final grain yield of maize, while the efficacy of each treatment differed among fields [20]. In particular, the mixture nicosulfuron + rimsulfuron + mesotrione (T2) documented high efficacy on the crop yield of all fields, and the highest at Pyrgos1 and Pyrgos2 for both experimental years. In Pyrgos1, T2 resulted in an increase of 35.3% and 33.2% in yield compared with untreated plots (T1) in the first and second year, respectively. In the second field, T2 caused an even higher rise in yield by 41% and 38.6% for each year, respectively, in comparison with control plants. The application of the mixture florasulam + mesotrione (T5) resulted in a quite higher efficacy than T2 in Pyrgos3, recording yields of 1188 kg ha−1 and 1136 kg ha−1 in the first and second year, respectively. Regarding the field at Pyrgos4, the application of nicosulfuron + rimsulfuron + dicamba (T3) followed by T2 led to the highest maize yield values compared with the other herbicide treatments (Figure 3). Several indices like the normalized difference red edge index (NDRE) and the green normalized difference vegetation index (GNDVI) allowed for early stress detection in maize crop [23,24]. However, this is the first time that the early-measured NDVI on weeds managed to give a good indication of final grain yields in maize crop. Indeed, grain yield showed a negative correlation with the NDVI and weed biomass (−0.39 and −0.5, respectively), confirming the well-known negative effect of weed competition on crop yield [8,20] and the potential of the NDVI to give an indication of weed and crop growth and productivity (depending on where, when and how we take this measurement).
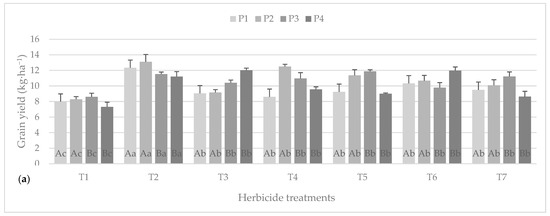
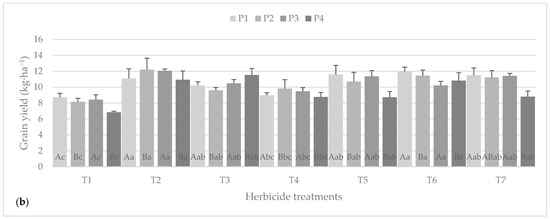
Figure 3.
The impact of herbicide treatments on maize grain yield in the first (a) and second (b) experimental years. Herbicide treatments (Τ1: untreated control; Τ2: nicosulfuron + rimsulfuron + mesotrione; T3: nicosulfuron + rimsulfuron + dicamba; T4: nicosulfuron + rimsulfuron; T5: florasulam + mesotrione; T6: mesotrione + nicosulfuron; T7: 2,4 D ester); fields: (P1: Pyrgos1; P2: Pyrgos2; P3: Pyrgos3; P4: Pyrgos4). Values without a common letter are statistically significant according to LSD (0.05). Values belonging to the same characteristics without common letters are statistically different according to LSD (0.05).
4. Conclusions
In conclusion, the present study is the first time that our novel NDVI-based method was successfully applied in maize crop under real field conditions. The four field trials established during two consecutive years ensure repeatability and allow us to have reliable findings. The effects of herbicide treatment on the weed NDVI and weed biomass were significant. Moreover, crop yield had a negative correlation with the abovementioned parameters. Further research is clearly required in order to improve this method, test it in more crops, overcome any limitations and increase its potential.
Author Contributions
Conceptualization, A.T. and I.T.; methodology, A.T. and I.G.; software, I.G.; validation, A.T, A.K., P.K. and N.A.; formal analysis, A.T.; investigation, A.T.; resources, P.K. and I.T.; data curation, A.T. and I.G.; writing—original draft preparation, A.T., I.G., A.K., N.A. and P.K.; writing—review and editing, A.T., I.G., P.K. and I.T.; visualization, A.T. and A.K.; supervision, I.T.; project administration, I.T.; funding acquisition, I.T. All authors have read and agreed to the published version of the manuscript.
Funding
This research received support from CORTEVATM (Project entitled “Quick-test for the optimization of herbicide use & in-season recommendations to the farmers”, ELKE code: 340456).
Data Availability Statement
Data are contained within the article.
Conflicts of Interest
The authors declare no conflicts of interest.
References
- Oerke, E.C. Crop losses to pests. J. Agric. Sci. 2006, 144, 31–43. [Google Scholar] [CrossRef]
- Beckie, H.J. Herbicide-resistant weeds: Management tactics and practices. Weed Technol. 2006, 3, 793–814. [Google Scholar] [CrossRef]
- Silva, V.; Yang, X.; Fleskens, L.; Ritsema, C.J.; Geissen, V. Environmental and human health at risk—Scenarios to achieve the Farm to Fork 50% pesticide reduction goals. Environ. Int. 2022, 165, 107296. [Google Scholar] [CrossRef] [PubMed]
- Wang, X.; Christensen, S.; Svensgaard, J.; Jensen, S.M.; Liu, F. The effects of cultivar, nitrogen supply and soil type on radiation use efficiency and harvest index in spring wheat. Agronomy 2020, 10, 1391. [Google Scholar] [CrossRef]
- Vannoppen, A.; Gobin, A.; Kotova, L.; Top, S.; De Cruz, L.; Vīksna, A.; Aniskevich, S.; Bobylev, L.; Buntemeyer, L.; Caluwaerts, S.; et al. Wheat Yield Estimation from NDVI and Regional Climate Models in Latvia. Remote Sens. 2020, 12, 2206. [Google Scholar] [CrossRef]
- Milesi, C.; Samanta, A.; Hashimoto, H.; Kumar, K.K.; Ganguly, S.; Thenkabail, P.S.; Srivastava, A.N.; Nemani, R.R.; Myneni, R.B. Decadal Variations in NDVI and Food Production in India. Remote Sens. 2010, 2, 758–776. [Google Scholar] [CrossRef]
- Romano, E.; Bergonzoli, S.; Pecorella, I.; Bisaglia, C.; De Vita, P. Methodology for the definition of durum wheat yield homogeneous zones by using satellite spectral indices. Remote Sens. 2021, 13, 2036. [Google Scholar] [CrossRef]
- Travlos, I.; Tsekoura, A.; Antonopoulos, N.; Kanatas, P.; Gazoulis, I. Novel sensor-based method (quick test) for the in-season rapid evaluation of herbicide efficacy under real field conditions in durum wheat. Weed Sci. 2021, 69, 147–160. [Google Scholar] [CrossRef]
- Nehurai, O.; Atsmon, G.; Kizel, F.; Kamber, E.; Bar, N.; Eizenberg, H.; Lati, R.N. Early detection of the herbicidal effect of glyphosate and glufosiate by using hyperspectral imaging. Agron. J. 2023, 115, 2558–2569. [Google Scholar] [CrossRef]
- Xia, F.; Quan, L.; Lou, Z.; Sun, D.; Li, H.; Lv, X. Identification and comprehensive evaluation of resistant weeds using unmaned aerial vehicle-based multispectral imagery. Front. Plant Sci. 2022, 13, 938604. [Google Scholar] [CrossRef]
- Pause, M.; Raasch, F.; Marrs, C.; Csaplovics, E. Monitoring glyphosate-based herbicide treatment using Sentinel-2 time series-a proof-of-principle. Remote Sens. 2019, 11, 2541. [Google Scholar] [CrossRef]
- Gerhards, R.; Wyse-Pester, D.Y.; Johnson, G.A. Characterizing spatial stability of weed populations using interpolated maps. Weed Sci. 1997, 45, 108–119. [Google Scholar] [CrossRef]
- Tremblay, N.; Wang, Z.; Ma, B.; Belec, C. Comparison of crop data measured by two commercial sensors for variable-rate nitrogen application. Precis. Agric. 2009, 10, 145–161. [Google Scholar] [CrossRef]
- Kong, L.; Si, J.; Feng, B.; Li, S.; Wang, F.; Sayre, K. Differential responses of two types of winter wheat (Triticum aestivum L.) to autumn- and spring-applied mesosulfuron-methyl-methyl. Crop Prot. 2009, 28, 387–392. [Google Scholar] [CrossRef]
- Kanatas, P.; Travlos, I.; Gazoulis, J.; Antonopoulos, N.; Tsekoura, A.; Tataridas, A.; Zannopoulos, S. The combined effects of false seedbed technique, post-emergence chemical control and cultivar on weed management and yield of barley in Greece. Phytoparasitica 2020, 48, 131–143. [Google Scholar] [CrossRef]
- Berger, W.; Parker, F.L. Diversity of planktonic Forminifera in deep-sea sediments. Science 1970, 168, 1345–1347. [Google Scholar] [CrossRef] [PubMed]
- Ashenafi, M.; Gebre Selassie, Y.; Alemayehu, G.; Berhani, Z. Growth, yield components, and yield parameters of maize (Zea mays L.) as influenced by unified use of NPSZnB blended fertilizer and farmyard manure. Int. J. Agron. 2023, 2023, 1311521. [Google Scholar] [CrossRef]
- Shapiro, S.S.; Wilk, M.B. An analysis of variance test for normality (complete samples). Biometrika 1965, 52, 591–611. [Google Scholar] [CrossRef]
- Levene, H. Robust tests of equality of variances. In Contributions to Probability and Statistics, Essays in Honor of Harold Hoteling; Olkin, I., Ghurye, S.G., Hoeffding, W., Madow, W.G., Mann, H.B., Eds.; Stanford University Press: Stanford, CA, USA, 1960; pp. 278–292. [Google Scholar]
- Kanatas, P.; Gazoulis, I.; Antonopoulos, N.; Tataridas, A.; Travlos, I. The Potential of a Precision Agriculture (PA) Practice for In Situ Evaluation of Herbicide Efficacy and Selectivity in Durum Wheat (Triticum durum Desf.). Agronomy 2023, 13, 732. [Google Scholar] [CrossRef]
- Alvarenga, C.B.; Mundim, G.S.M.; Santos, E.A.; Gallis, R.B.A.; Zampiroli, R.; Rinaldi, P.C.N.; Prado, J.R. Normalized difference vegetation index for desiccation evaluation with glyphosate + 2,4-D in magnetized spray solution. Braz. J. Biol. 2023, 83, e246579. [Google Scholar] [CrossRef]
- Mink, R.; Linn, A.I.; Santel, H.-J.; Gerhards, R. Sensor-based evaluation of maize (Zea mays) and weed response to post-emergence herbicide applications of isoxaflutole and cyprosulfamide applied as crop seed treatment or herbicide mixing partner. Pest Manag. Sci. 2019, 76, 1856–1865. [Google Scholar] [CrossRef] [PubMed]
- Li, F.; Miao, Y.; Feng, G.; Yuan, F.; Yue, S.; Gao, X.; Liu, Y.; Liu, B.; Ustin, S.L.; Chen, X. Improving estimation of summer maize nitrogen status with red edge-based spectral vegetation indices. Field Crops Res. 2014, 157, 111–123. [Google Scholar] [CrossRef]
- Gitelson, A.A.; Kaufman, Y.J.; Merzlyak, M.N. Use of green channel in remote sensing of global vegetation from EOS-MODIS. Remote Sens. Environ. 1996, 58, 289–298. [Google Scholar] [CrossRef]
Disclaimer/Publisher’s Note: The statements, opinions and data contained in all publications are solely those of the individual author(s) and contributor(s) and not of MDPI and/or the editor(s). MDPI and/or the editor(s) disclaim responsibility for any injury to people or property resulting from any ideas, methods, instructions or products referred to in the content. |
© 2023 by the authors. Licensee MDPI, Basel, Switzerland. This article is an open access article distributed under the terms and conditions of the Creative Commons Attribution (CC BY) license (https://creativecommons.org/licenses/by/4.0/).

