Communication

Acarological Risk of Infection with Borrelia burgdorferi, the Lyme Disease Agent, in Staten Island, New York City

Office of Vector Surveillance and Control, NYC Department of Health and Mental Hygiene, Manhattan, NY 10013, USA
*
Author to whom correspondence should be addressed.
Arthropoda 2024, 2(3), 181-191; https://doi.org/10.3390/arthropoda2030014
Submission received: 21 March 2024 / Revised: 29 June 2024 / Accepted: 10 July 2024 / Published: 15 July 2024
(This article belongs to the Topic Ticks and Tick-Borne Pathogens)

Abstract

:
Lyme disease, the leading vector-borne ailment in the U.S., annually affects an estimated 476,000 individuals, predominantly in the Northeast and Upper Midwest. Despite its increasing incidence, the evaluation of risk within U.S. cities, including natural public lands, remains inadequate. This study focuses on blacklegged tick occurrences and Borrelia burgdorferi infection prevalence in 24 Staten Island parks, aiming to assess Lyme disease exposure risk. Monthly acarological risk index (ARI) calculations from 2019 to 2022 revealed elevated values (0.16–0.53) in specific parks, notably Wolfe’s Pond Park, High Rock Park, Clay Pit Pond Park, Clove Lake Park, and Fair View Park. June (0.36) and November (0.21) consistently exhibited heightened ARIs, aligning with peak tick collection months. Despite stable yearly infection rates at 28.97%, tick densities varied significantly between parks and years. Identifying a high transmission risk in specific parks in Staten Island, a highly urbanized part of New York City, emphasizes the continuous necessity for Lyme disease risk management, even within the greenspaces of large cities.

1. Introduction

In the complex realm of public health, Lyme disease stands as a formidable challenge, annually impacting approximately 30,000 individuals, with an estimated 476,000 cases in the United States (http://www.cdc.gov/lyme, accessed on 20 March 2024). The causative agent, Borrelia burgdorferi sensu stricto, a tick-borne spirochete, is transmitted through the bite of the blacklegged tick (Ixodes scapularis Say, 1821), colloquially known as the deer tick [1]. This spatiotemporal surge in Lyme disease incidence and geographic spread is particularly concentrated in the Northeast and Upper Midwest, driven by a dynamic interplay of climate, host species populations, and various human-related factors [2,3].
Contrary to the prevailing perception that Lyme disease risk is mitigated in highly urbanized settings, recent revelations challenge this notion, unraveling a new narrative, especially in expansive metropolises like New York City [4]. The density of I. scapularis adults and nymphs, coupled with the infection prevalence of B. burgdorferi within these ticks, mirrors that of nonurban residential and recreational areas in the highly endemic coastal Northeast [5,6]. This paradigm-shifting study seeks to comprehensively evaluate Lyme disease exposure risk in 24 regional parks nestled within the iconic Staten Island of New York City, probing into the influence of inner-city greenspaces in the vicinity of densely populated neighborhoods.
Dispelling the conventional belief that most New York City Lyme disease cases stem from travel outside the urban enclave, a notable upswing in white-tailed deer populations in Staten Island has prompted localized interventions, including innovative sterilization programs [7]. As the number of ticks escalates in parks and locally acquired Lyme disease cases surge, the impact of neighborhood-level characteristics, such as greenspaces and the diverse fauna-inhabiting ticks in Staten Island, becomes increasingly apparent [4].
Building on the foundation of prior research that underlines the critical importance of understanding tick-borne disease risks at the neighborhood scale [8,9,10,11,12], our study pioneers the utilization of the acarological risk index. This index, rooted in the infection rates of I. scapularis nymphs by B. burgdorferi, emerges as a beacon of predictability and correlation for Lyme disease risk. Drawing from meticulously conducted monthly tick surveys spanning from 2019 to 2022 in Staten Island’s 24 main parks, our acarological indices transcend temporal and spatial boundaries, offering a nuanced understanding of Lyme disease transmission risks.

2. Material and Methods

The investigation spanned from 2019 to 2022, encompassing monthly assessments conducted across 24 parks in Staten Island. The study focused on two developmental stages of ticks: nymphs and adults. To quantify the acarological risk index (ARI), the collection figures and testing outcomes for both stages were combined.

2.1. Tick Collections

Every year, the sampling regimen targeted 24 primary parks in Staten Island (refer to Table 1). Standard flagging procedures were employed for tick collection. This method involves dragging a 1 square meter section of white corduroy cloth across the leaf litter and low-lying vegetation. Sampling areas were strategically flagged along publicly accessible pathways, within a 5 m radius on either side of the woodland’s edge. Following every 10 steps, the cloth underwent visual inspection, and all identified ticks were promptly removed and stored in labeled vials preserved with 70% ethanol.
Concurrently, pertinent information such as the date, sampling time, current temperature, relative humidity, and other relevant weather conditions were meticulously recorded during the flagging process. Subsequently, ticks were subjected to species, gender, and stage identification using morphological keys [13]. The identified ticks were then stored in absolute ethanol and dispatched to the laboratory for comprehensive pathogen testing. The details of tick collection and testing procedures are available in the Supplementary Material of this paper

2.2. DNA Isolation and PCR Assays

Blacklegged ticks, encompassing nymphs and adults, underwent transportation to the Public Health Laboratory at the Department of Health and Mental Hygiene in New York City. Upon arrival, individual ticks were meticulously placed in 1.5–2.0 mL microcentrifuge tubes, where they were consistently maintained on dry ice or ice post-removal from the freezer to prevent degeneration of DNA and viral RNA. Ticks were homogenized in phosphate-buffered saline prior to nucleic acid extraction using the EasyMag extraction platform (BioMérieux, Marcy-l'Étoile, France). The extracted total nucleic acid samples derived from these ticks were then utilized in real-time RT-PCR [14]. Both the homogenized ticks and nucleic acid underwent storage at −70 °C after examination to prevent degradation during freezing/thawing. The Public Health Laboratory employed the QuantStudio Dx instrument for a multiplex real-time RT-PCR assay capable of detecting five pathogens including Anaplasma phagocytophilum, Babesia microti, Borrelia burgdorferi, Borrelia miyamotoi, and Powassan virus were tested from individual or pooled ticks. In this study, all ticks (nymphs and adults) were tested individually. Our analysis focuses on B. burgdorferi, as the positive rates for the other four pathogens were very low: 3.22% for A. phagocytophilum, 4% for B. microti, 1.58% for B. miyamotoi, and no detections of Powassan virus (refer to supplementary material). Executed by competent personnel equipped with appropriate biosafety measures, this nucleic acid amplification assay incorporated five sets of oligonucleotide primers and hydrolysis probes. The target for B. burgdorferi was a plasmid-borne gene exclusive to Lyme borreliosis-borrelia. Fluorescently labeled probes bound to amplified DNA fragments, and the QuantStudio Dx instrument monitored the fluorescent signal intensity during each PCR cycle. Target amplification was recorded through the observation of an increase in fluorescence over time relative to the background signal.

2.3. Data Analysis

The acarological risk index (ARI) was computed for each park where tick collections took place. Representing the number of nymphs and adults of I. scapularis infected with B. burgdorferi collected per minute of flag sampling [15], the ARI values formed a basis for subsequent statistical analyses. Analyses of variance (ANOVA) were conducted, employing SAS EG 7.1 (SAS Institute, Cary, NC, USA), to compare monthly and yearly average tick densities, average tick infection rates, and average ARI values across the 24 parks. This analysis entailed testing the hypothesis that each sample is drawn from the same underlying probability distribution, against the alternative hypothesis suggesting variations in underlying probability distributions among the samples. Statistical significance was attributed to p-values less than 0.05. Spatial mapping of park locations and spatial ARI interpolation were executed using Arc/GIS (version 10.6.1, Esri, Inc., Redlands, CA, USA).

3. Results

3.1. Tick Collections and Testing for B. burgdorferi

Between 2019 and 2022, a comprehensive survey yielded a total of 1139 I. scapularis adults and nymphs across the 24 parks in Staten Island (refer to Table 2). Among the sampled ticks, 662 (58.1%) were nymphs, while 477 (41.8%) were adults. Notably, 330 ticks, comprising 29.0% of all nymphs and adults, were found to be infected with B. burgdorferi. The yearly average infection rates across these 24 parks exhibited minimal fluctuations, ranging from a low of 26.84% in 2020 to a peak of 34.21% in 2019, resulting in an overall four-year average of 28.97%.
Further analysis revealed a notable disparity between the infection rates of adults and nymphs, with the percentage of infected adults notably higher at 39.4%, compared to 21.5% in nymphs. Interestingly, the infection rates among male and female adults were remarkably close, standing at 40.3% and 38.3%, respectively.
Delving into specific parks, Wolfe’s Pond Park emerged with the highest number of tested ticks at 226, followed by 117 in Clay Pit Pond Park, and 109 in Fair View Park. Meanwhile, High Rock Park, Willowbrook Park, La Tourette Golf Course, and Clove Lake Park reported lower numbers, ranging from 50 to 100. The remaining 17 parks displayed the lowest tested numbers, all falling below 50 ticks.

3.2. Tick Densities and Acarological Risk Index (ARI)

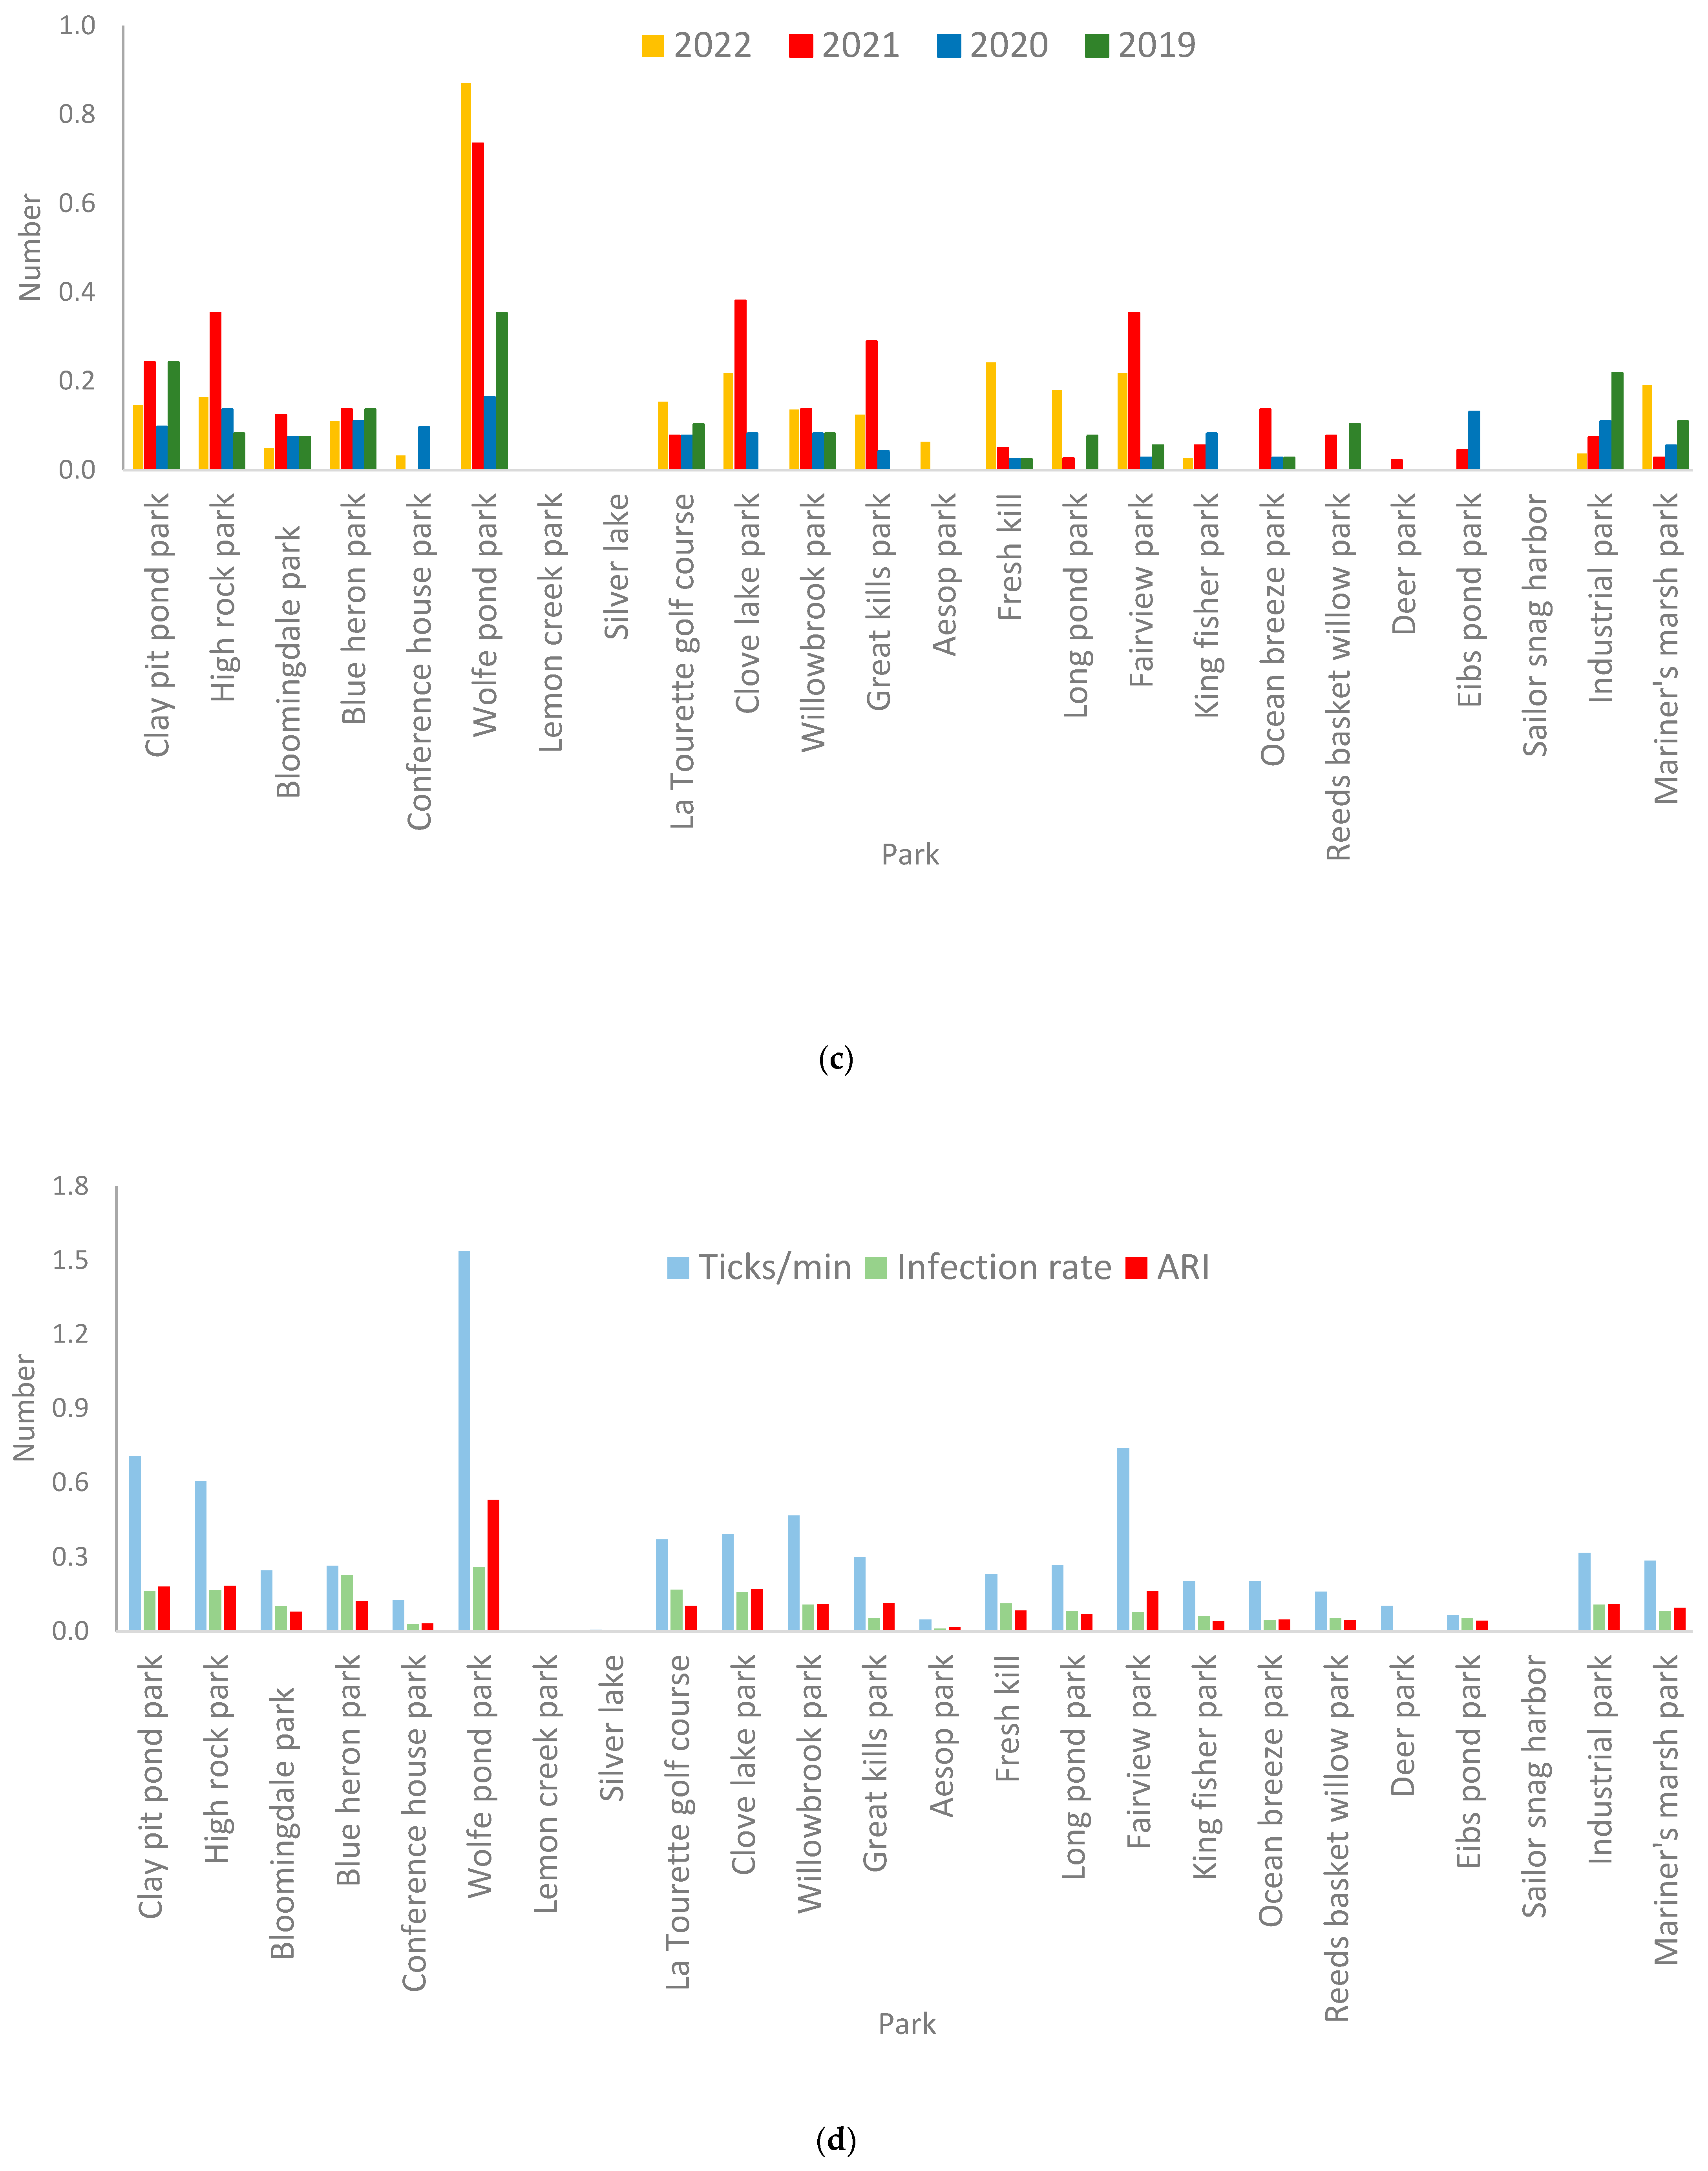
The densities of ticks, as detailed in Table 3 and illustrated in Figure 1, exhibited significant variations across parks and years. In 2021, a noteworthy increase in ticks was observed, with a yearly average of 0.5 ticks per minute, surpassing the other three years (df = 3, F = 2.72, p < 0.05). Throughout the period from 2019 to 2022, the monthly average infection rates across all 24 parks remained relatively stable, fluctuating modestly between 8% and 10%. However, a more granular examination of individual park infection rates unveiled substantial diversity in infectivity, ranging from 0% to 100% on a monthly basis.
Regarding the number of ticks tested, 71.4% of the 24 parks reported no ticks collected or tested in specific months between 2019 and 2022. Additionally, 24.2% of parks had monthly tick test numbers ranging from 1 to 5, while 3.2% reported numbers from 6 to 10, and only 1.2% recorded figures between 11 and 40 ticks. Although not statistically significant, 2021 stood out with the highest ARI of 0.14, followed by 0.12 in 2022, and comparatively lower values in 2019 and 2020.
Wolfe’s Pond Park, High Rock Park, Clay Pit Pond Park, Clove Lake Park, and Fair View Park (refer to Figure 1) emerged as focal points, with both elevated tick collections (ranging from 0.39 to 1.54) and ARI values (ranging from 0.16 to 0.53). Notably, these parks also exhibited relatively higher infection rates, spanning from 10% to 26%.
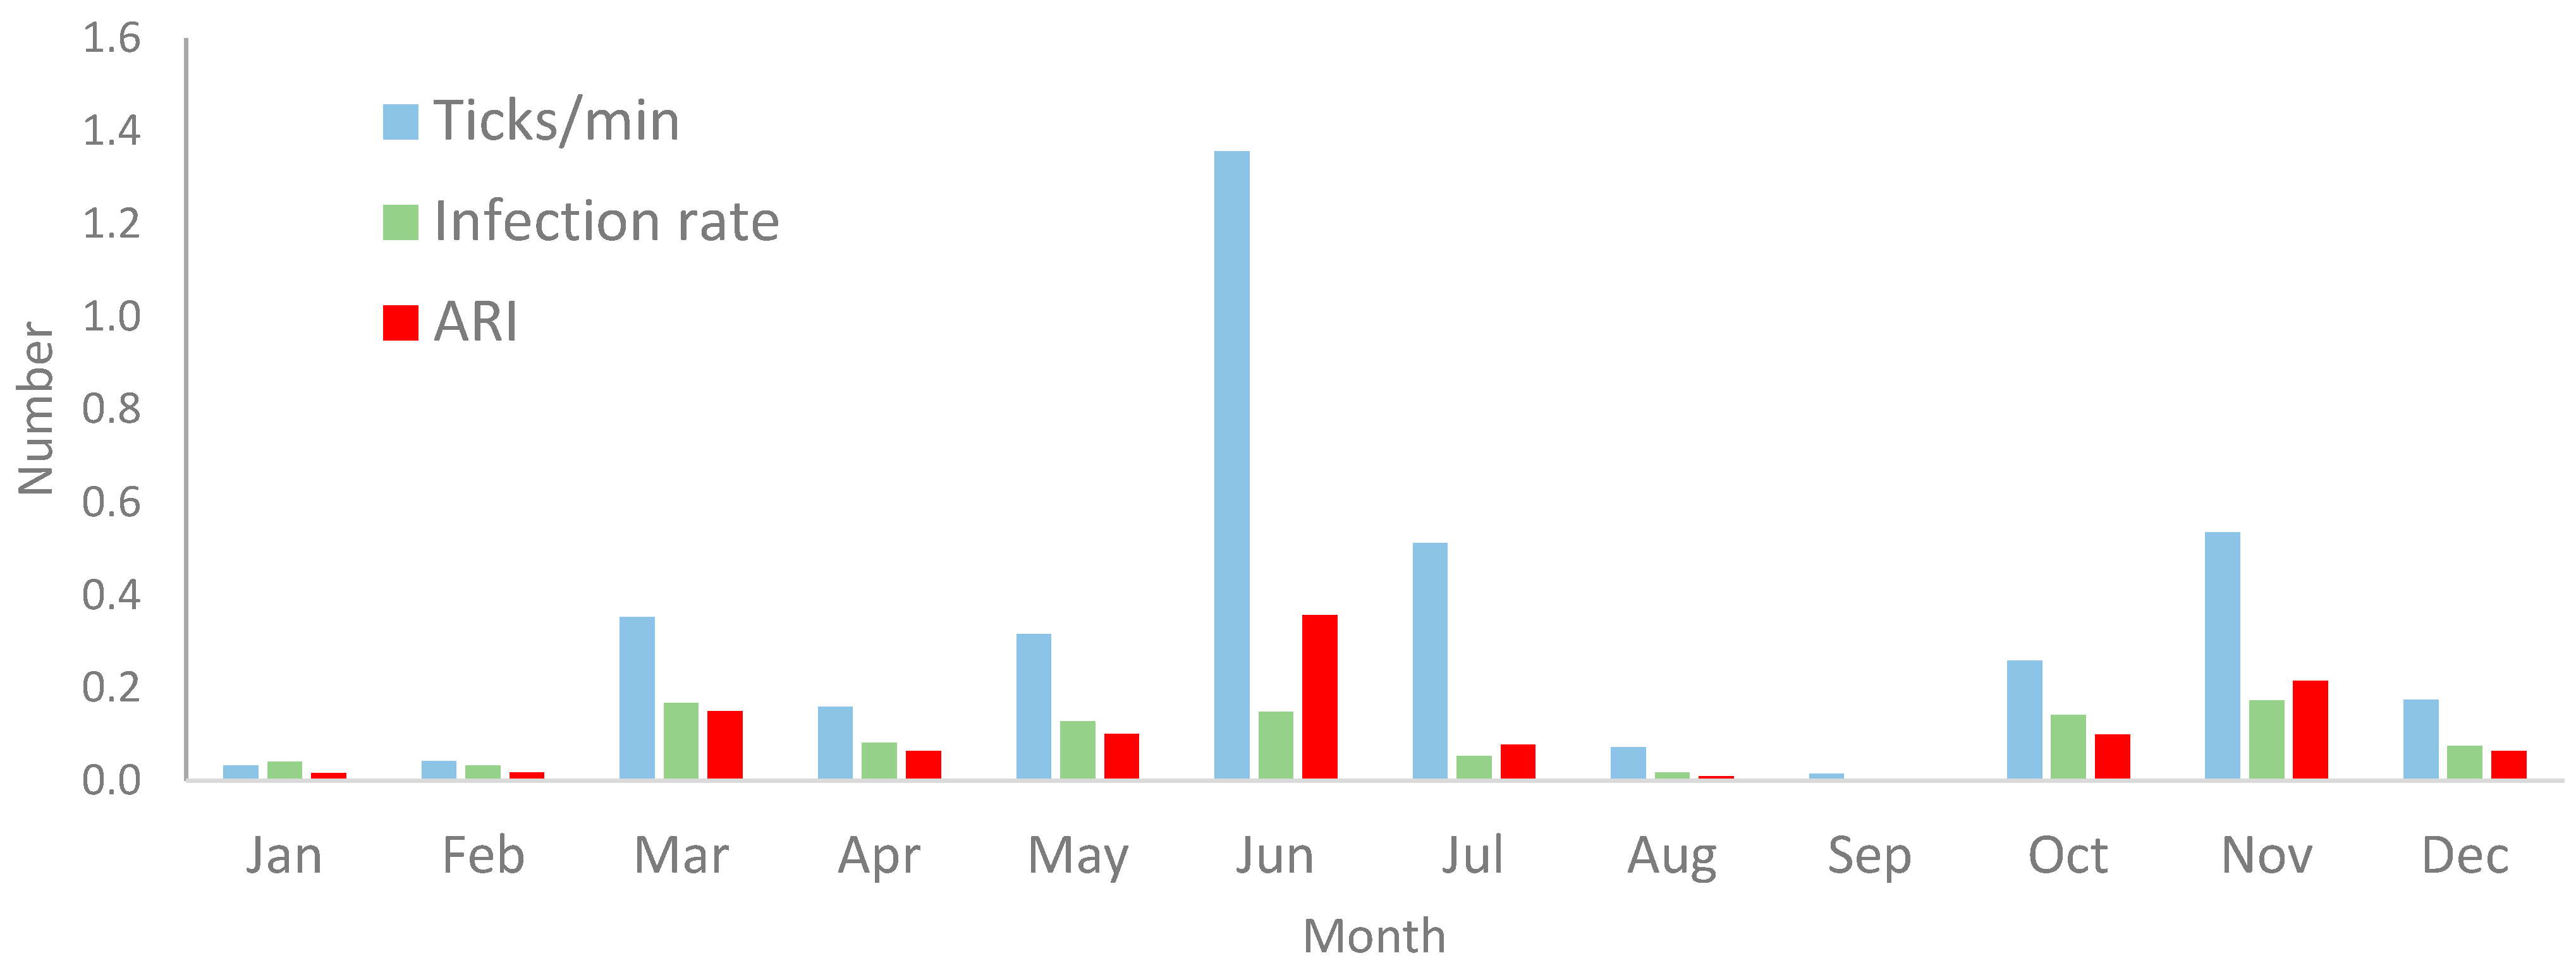
In the seasonal analysis (refer to Figure 2), notably elevated acarological risk indices (ARIs) were identified in June (0.36) and November (0.21) (df = 11, F = 5.08, p < 0.01). This finding aligns with the months of peak tick collection, registering 1.36 and 0.54 ticks per minute in June and November, respectively. Generally, a heightened tick collection trend was observed from March to July and October to November (df = 11, F = 6.15, p < 0.01). However, the ability to detect infectivity persisted throughout the year, given the consistent monthly tick collections (df = 11, F = 5.77, p < 0.01), except for an exception in September, likely attributed to a minimal number of ticks collected during that period.

3.3. Spatial Distribution of Acarological Risk Index (ARI)

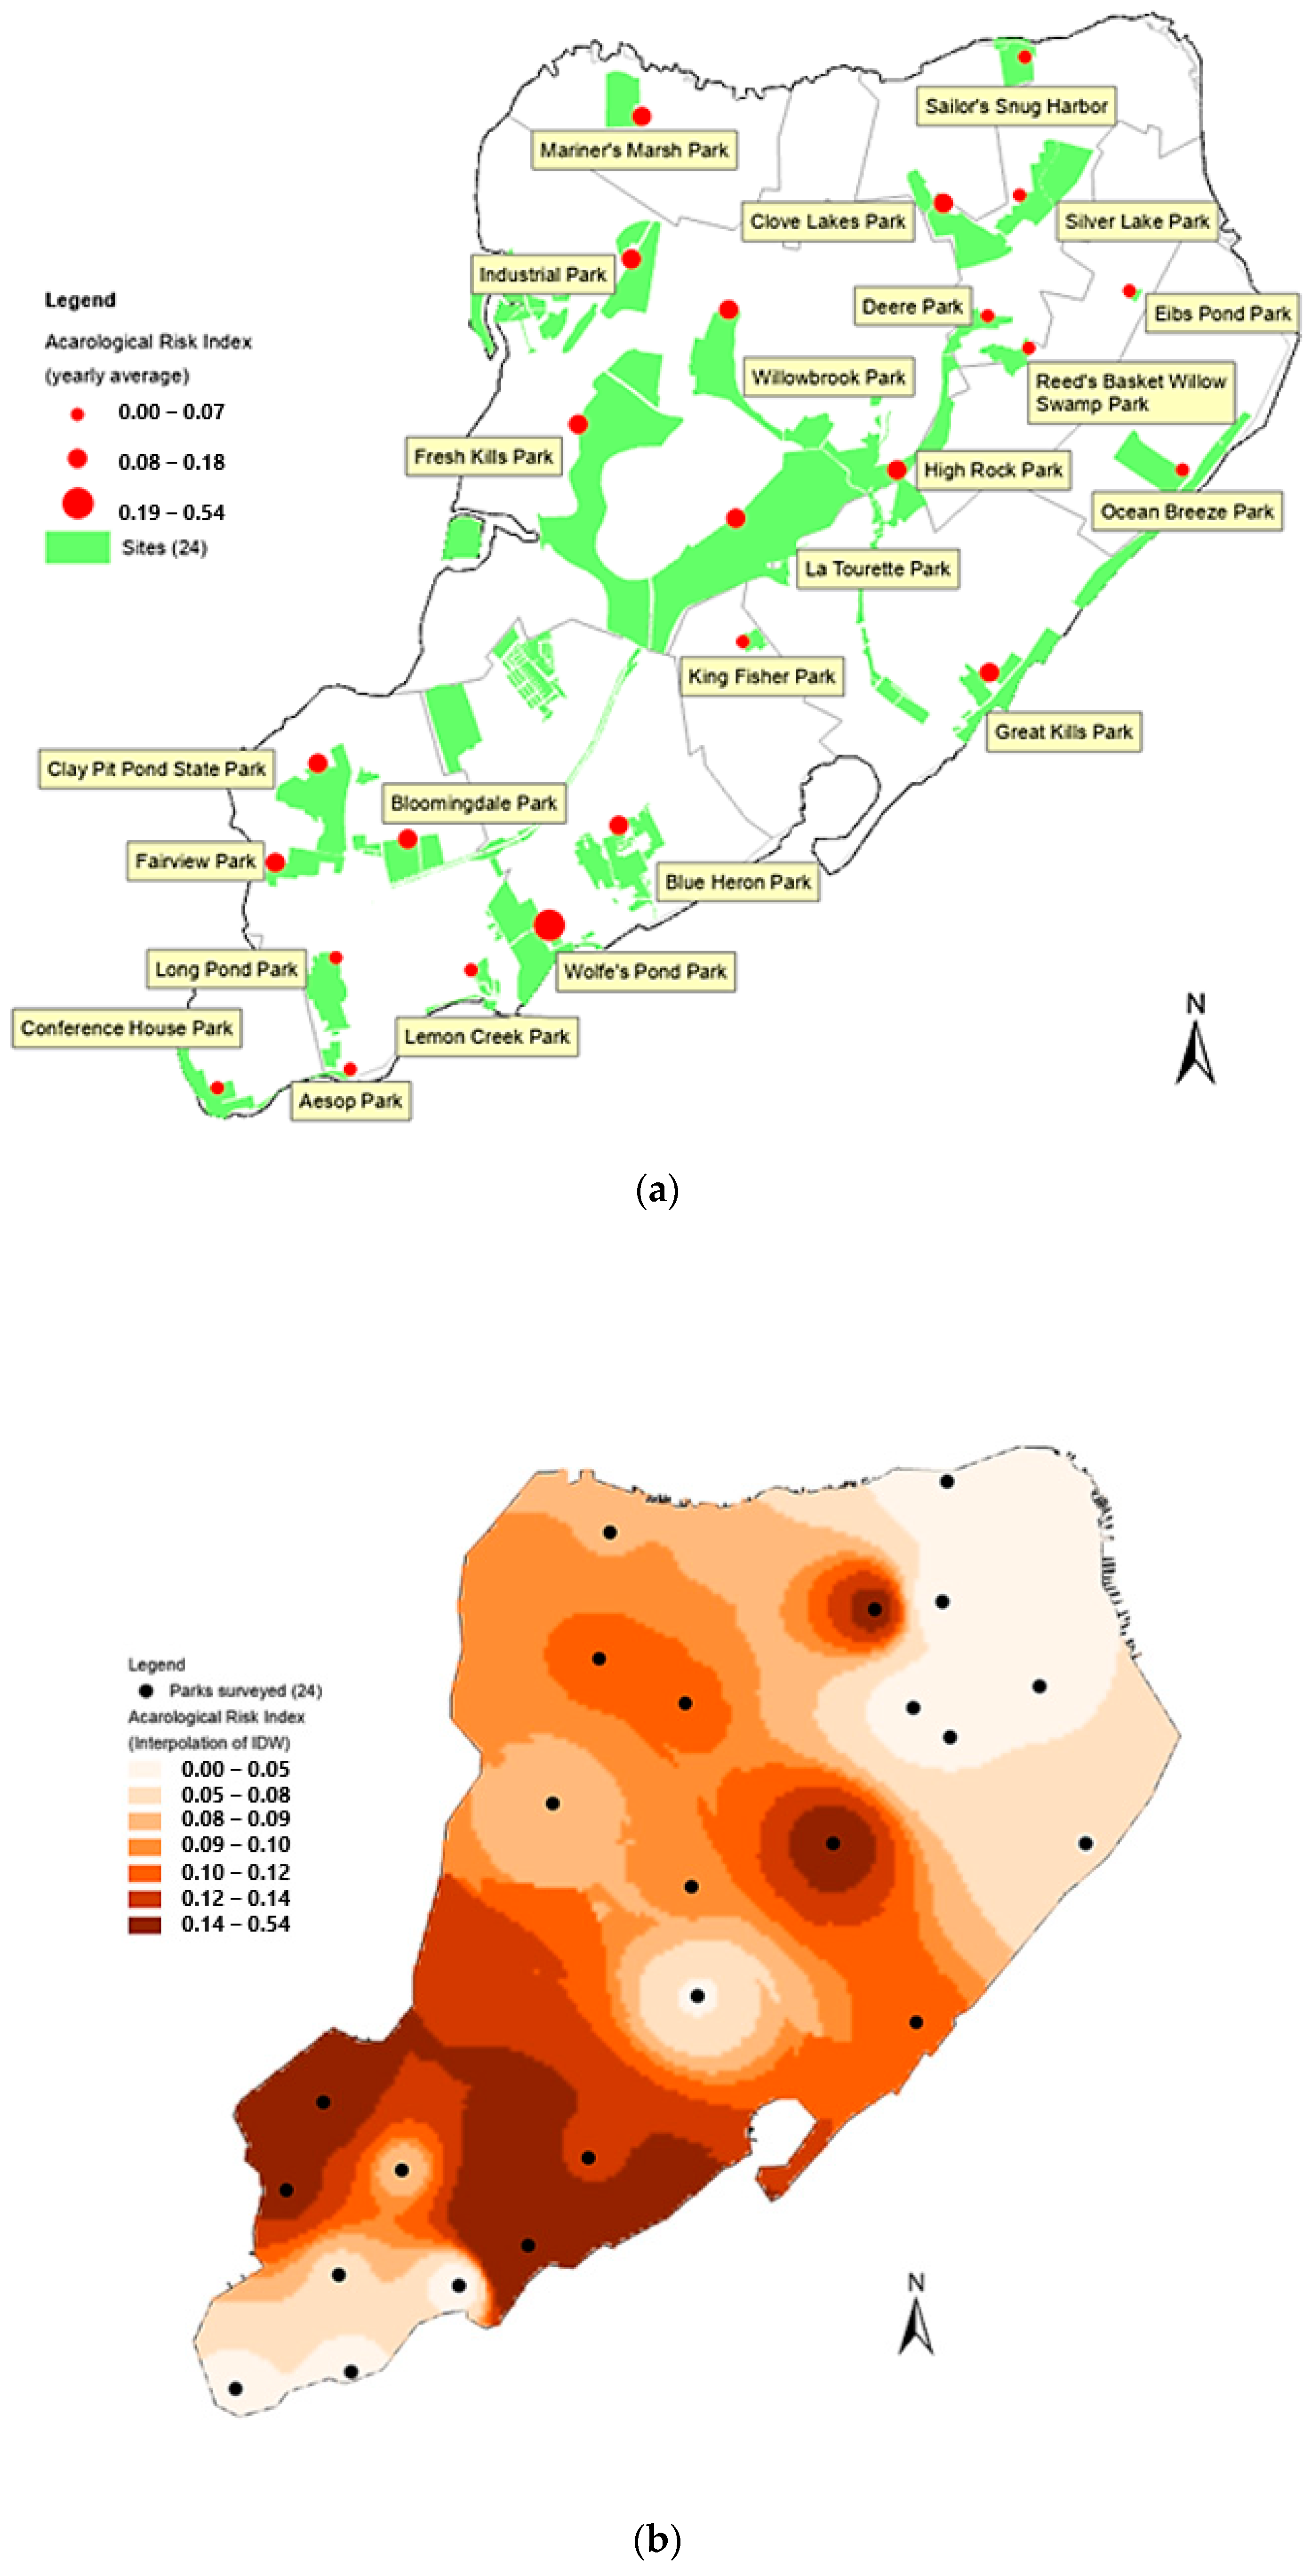
Figure 3 illustrates the spatial distribution of Lyme disease transmission risk based on the classification of acarological risk indices (ARIs) across 24 parks. Wolfe’s Pond Park stands out with the highest risk level (ARI = 0.53), succeeded by 13 parks at a medium risk level (High Rock Park, Clay Pit Pond Park, Clove Lake Park, etc., 0.07 < ARI < 0.18), while the remaining 10 parks (Ocean Breeze Park, Reeds Basket Willow Swamp Park, etc.) exhibit the lowest risk level (ARI < 0.07). Notably, four parks (Aesop Park, Lemon Creek Park, Sailor Snag Harbor, and Silver Lake Park) record ARIs as 0, indicating that either no ticks were collected or no B. burgdorferi was detected in these locations.
Leveraging the inverse distance weighting (IDW) model of the Spatial Analyst within Arc/GIS for tick ARI distribution interpolation in Staten Island reveals distinct risk patterns. Southern Staten Island, particularly around Wolfe’s Pond Park, Clay Pit Pond Park, and Fair View Park, emerges as a hotspot with elevated Lyme disease transmission risk. The central part of Staten Island exhibits a medium-level risk, while areas surrounding High Rock Park and Clove Lake Park may experience heightened activity. Conversely, the northeastern and most southwestern regions, characterized by reduced natural areas and higher human population density, demonstrate the lowest risk.

4. Discussion

The results of our investigation unveil significant variations in blacklegged tick collections, for both nymphs and adults, across various parks and diverse temporal dimensions in Staten Island. The elevated tick collections and infection rates observed in Wolfe’s Pond Park, High Rock Park, Clay Pit Pond Park, Clove Lake Park, and Fair View Park, particularly in recent years, highlight the persistent challenges posed by Lyme disease [16]. Infections were widespread, affecting nymphs and adults from 20 of the 24 surveyed parks (83.3%), suggesting a heightened risk of Lyme disease transmission throughout the year, except for September due to limited tick collection and testing [17]. The continuous high infectivity of nymphs, despite a lower infection rate compared to adults, sheds light on the observed surge in locally acquired Lyme disease cases [18].
Traditionally, studies in the United States primarily focused on low-intensity residential and forested areas to identify factors contributing to human Lyme disease infection [19,20,21]. However, recent attention has shifted towards urban Lyme disease infection risks, challenging the notion that tickborne disease risk is low to suburban and natural settings [16]. Our findings advocate for a comprehensive risk assessment that integrates various methods, encompassing all tick stages, and considers human behavior and habits.
Our study highlights the imperative for ongoing assessment and management of Lyme disease risk in Staten Island’s greenspaces. Over the past 30 years, most of the grasslands around Staten Island have either been developed or protected from vandalism and fire. As a result, grassy fields have undergone natural succession and transformed into woodlands (https://www.silive.com/news/2015/03/what_are_the_most_common_wild.html, accessed on 20 March 2024). Among the most common native rodents are squirrels, chipmunks, muskrats, white-footed mice, and meadow voles. However, in the past decade, the number of white-tailed deer, a significant host for blacklegged ticks, has increased substantially in Staten Island. This prompted the NYC Department of Parks and Recreation’s Wildlife Unit to conduct a program of sterilizing male deer from 2016 to 2021 (https://www.nyc.gov/site/wildlifenyc/index.page, accessed on 20 March 2024). The estimated white-tailed deer population was reduced by about 21%, from approximately 2053 in 2016 to 1616 in 2021, and this initiative also resulted in a 60% reduction in fawn births. At this time, it is unclear whether the change in the deer population will affect the further distribution and establishment of different tick species in Staten Island.
Spatial distribution analysis indicates higher transmission risks in southern Staten Island, emphasizing the need for targeted interventions and public awareness campaigns [22]. However, the limited locally acquired cases and tick surveillance efforts hinder a detailed exploration of the relationship between acarological ARIs and human Lyme disease risk in Staten Island. From 2019 to 2022, only 25 human cases (averaging about 6 cases per year) without travel history during the season were identified as probable infections in Staten Island. Excluding Wolfe’s Pond Park, which had an exceptionally high Annual Lyme Disease Incidence Rate (ARI) of 0.53, the ARI ranged from 0 to 0.18 across other areas. This range is comparable to Rhode Island’s six towns, where the ARI varies from 0 to 0.22, with a median of 0.10 to 0.13 for detected human cases [9]. However, Staten Island recorded significantly fewer human cases compared to Rhode Island.
Although ARIs facilitate a meaningful comparison among parks characterized by substantial tick populations, continuous monitoring will prove indispensable to discern population trends in the 17 parks with lower tick densities [18,23]. Our findings not only function as a critical alert for the implementation of signage in parks and the guidance of tick control measures but also advocate for heightened public awareness. We propose the strategic installation of tick warning signs in City and State parks within Staten Island, particularly in areas designated with medium to high ARI values. Although the reduction in tick populations is generally deemed promising, our study underscores the necessity of evaluating outcomes for individuals, such as disease incidence or tick encounters, to gauge the efficacy of tick reduction methods [22,24]. The collaborative endeavors of our research team significantly contribute to the ongoing discourse on Lyme disease, aiming for well-informed public health measures and community safety. Furthermore, our study establishes a crucial baseline for tracking the spread of infection from areas endemic in 2019–2022.

Supplementary Materials

The following supporting information can be downloaded at: https://www.mdpi.com/article/10.3390/arthropoda2030014/s1, S1. Numbers for collected and tested ticks at 24 parks in Staten Island from 2019 to 2022.

Author Contributions

W.B.: Conceptualization and visualization, project administration, writing and reviewing; L.Z.: Writing, reviewing, project administration; L.T.: Tick surveillance; K.K.: Specimen preparation for pathological testing; Z.S.: Field supervision, specimen preparation for pathological testing. All authors have read and agreed to the published version of the manuscript.

Funding

This research received no external funding.

Data Availability Statement

The original contributions presented in the study are included in the article; further inquiries can be directed to the corresponding author.

Conflicts of Interest

The authors declare no conflicts of interest. The funders had no role in the design of the study; in the collection, analyses, or interpretation of data; in the writing of the manuscript; or in the decision to publish the results.

References

  1. Burgdorfer, W. Discovery of the Lyme disease spirochete and its relation to tick vectors. Yale J. Biol. Med. 1984, 57, 518–520. [Google Scholar]
  2. Fouque, F.; Reeder, J.C. Impact of past and on-going changes on climate and weather on vector-borne diseases transmission: A look at the evidence. Infect. Dis. Poverty 2019, 8, 51. [Google Scholar] [CrossRef]
  3. Tran, T.; Prusinski, M.A.; White, J.L.; Falco, R.C.; Kokas, J.; Vinci, V.; Gall, W.K.; Tober, K.J.; Haight, J.; Oliver, J.; et al. Predicting spatio-temporal population patterns of Borrelia burgdorferi, the Lyme disease pathogen. J. Appl. Ecol. 2022, 59, 2779–2789. [Google Scholar] [CrossRef] [PubMed]
  4. New York City Department of Health and Mental Hygiene. Preventing, diagnosing, and managing tick-borne diseases. City Health Inf. 2020, 39, 12–18. [Google Scholar]
  5. Kilpatrick, A.M.; Dobson, A.D.M.; Levi, T.; Salkeld, D.J.; Swei, A.; Ginsberg, H.S.; Kjemtrup, A.; Padgett, K.A.; Jensen, P.M.; Fish, D. Lyme disease ecology in a changing world: Consensus, uncertainty and critical gaps for improving control. Phil. Trans. R. Soc. B 2017, 372, 20160117. [Google Scholar] [CrossRef] [PubMed]
  6. Alison, E.S.; Anna, B.M.; Tashi, B.; Shannon, L.T.; Sara, E.M.; Matthew, Q.D.; Joseph, E.D.; Thomas, W.S. Lyme disease risk of exposure to blacklegged ticks (Acari: Ixodidae) infected with Borrelia burgdorferi (Spirochaetales: Spirochaetaceae) in Pittsburgh regional parks. J. Med. Entomol. 2020, 57, 273–280. [Google Scholar]
  7. Jason, R.B.; Paul, D.C.; Evan, G.C.; Anthony, J.D. Sterilization as an alternative deer control technique: A review. Hum.-Wildl. Interact. 2012, 6, 273–282. [Google Scholar]
  8. Ilya, R.F.; Sarah, E.B.; Felicia, K.; Richard, S.O. Systematic review and meta-analysis of tick-borne disease risk factors in residential yards, neighborhoods, and beyond. BMC Inf. Dis. 2019, 19, 861. [Google Scholar]
  9. Mather, T.N.; Nicholson, M.C.; Donnelly, E.F.; Matyas, B.T. Entomologic index for human risk of Lyme disease. Am. J. Epi. 1996, 144, 1066–1069. [Google Scholar] [CrossRef]
  10. Kirby, C.S.; Matthew, L.C.; Louis, A.M.; Starrhope, E.; Patricia, A.M. Temporal correlations between tick abundance and prevalence of ticks infected with Borrelia burgdorferi and increasing incidence of Lyme disease. J. Clin. Microbiol. 1998, 36, 1240–1244. [Google Scholar]
  11. Parasuraman, B.; Pichai, K.; Rajagopal, T.P.; Sivsankaran, S.; Subramaniam, S.; Mahaligam, K. Study on entomological surveillance and its significance during a dengue outbreak in the district of Tirunelveli in Tamil Nadu, India. Osong Public Health Res. Perspect. 2013, 4, 152–158. [Google Scholar]
  12. Eliza, A.H.L.; John, F.A.; Kirby, C.S.; Lars, E.; Eisen, R.J.; Goudarz, M. Predicting spatiotemporal patterns of Lyme disease in-cidence from passively collected surveillance data for Borrelia burgdorferi sensu lato-infected Ixodes scapularis ticks. Ticks Tick-Borne Dis. 2019, 10, 970–980. [Google Scholar]
  13. Keirans, J.E.; Hutcheson, H.J.; Durden, L.A.; Klompen, J.S. Ixodes (Ixodes) scapularis (Acari: Ixodidae): Redescription of all active stages, distribution, hosts, geographical variation, and medical and veterinary importance. J. Med. Entomol. 1996, 33, 297–318. [Google Scholar] [CrossRef] [PubMed]
  14. Rafal, T.; Teresa, T.; Moses, D.C.; Ilia, R.; Stephen, S.; Ian, W.L. Detection of Anaplasma phagocytophilum, Babesia microti, Borrelia burgdorferi, Borrelia miyamotoi, and Powassan virus in Ticks by a Multiplex Real-Time Reverse Transcription-PCR Assay. mSphere 2017, 2, e00151-17. [Google Scholar] [CrossRef]
  15. Milena, K.; Novica, S.; Srdjan, L. Prevalence of Borrelia burgdorferi sensu lato in Ixodes ricinus ticks and assessment of entomological risk index at localities in Belgrade. Vojnosanit. Pregl. 2016, 73, 817–824. [Google Scholar]
  16. Adams, D.A.; Thomas, K.R.; Jajosky, R. Summary of notifiable infectious diseases and conditions—United States. MMWR Morb. Mortal. Wkly. Rep. 2016, 63, 1–152. [Google Scholar] [CrossRef] [PubMed]
  17. Diuk-Wasser, M.A.; Hoen, A.G.; Cislo, P.; Brinkerhoff, R.; Hamer, S.A.; Rowland, M.; Cortinas, R.; Vourc’h, G.; Melton, F.; Hickling, G.J.; et al. Human risk of infection with Borrelia burgdorferi, the Lyme disease agent, in Eastern United States. Am. J. Trop. Med. Hyg. 2012, 86, 320–327. [Google Scholar] [CrossRef] [PubMed]
  18. Eisen, L.; Eisen, R.J. Critical evaluation of the linkage between tick-based risk measures and the occurrence of Lyme disease cases. J. Med. Entomol. 2018, 55, 1381–1396. [Google Scholar] [CrossRef]
  19. Meredith, C.V.; Eliza, A.H.L.; Goudarz, M.; Waheed, I.B.; Maria, A.D. Enhancement of risk for Lyme disease by landscape connectivity, New York, New York, USA. Emerg. Inf. Dis. 2019, 25, 1137–1143. [Google Scholar]
  20. Simon, J.A.; Marrotte, R.R.; Desrosiers, N.; Fiset, J.; Gaitan, J.; Gonzalez, A.; Koffi, J.K.; Lapointe, F.J.; Leighton, P.A.; Lindsay, L.R.; et al. Climate change and habitat fragmentation drive the occurrence of Borrelia burgdorferi, the agent of Lyme disease, at the northeastern limit of its distribution. Evol. Appl. 2014, 7, 750–764. [Google Scholar] [CrossRef]
  21. Johnson, T.L.; Bjork, J.K.H.; Neitzel, D.F.; Dorr, F.M.; Schiffman, E.K.; Eisen, R.J. Habitat suitability model for the distribution of Ixodes scapularis (Acari: Ixodidae) in Minnesota. J. Med. Entomol. 2016, 53, 598–606. [Google Scholar] [CrossRef] [PubMed]
  22. Hinckley, A.F.; Meek, J.I.; Ray, J.A.; Niesobecki, S.A.; Connally, N.P.; Feldman, K.A.; Jones, E.H.; Backenson, P.B.; White, J.L.; Lukacik, G.; et al. Effectiveness of residential acaricides in reducing tick infestations in the United States. J. Med. Entomol. 2014, 51, 880–889. [Google Scholar]
  23. Donal, B.; Maria, P.F.; Elisa, M.; Richard, R.; Maria, A.D. Current and future spatiotemporal patterns of Lyme disease reporting in the Northeastern United States. JAMA Net. Opn. 2020, 3, 1–12. [Google Scholar]
  24. Felicia, K.; Stacy, M.; William, B.; Shannon, D.; Andrew, S.E.; Ilya, R.F.; Alison, F.H.; Sarah, A.H.; Fiona, K.; Jennifer, P.; et al. Effects of tick-control interventions on tick abundance, human encounters with ticks, and incidence of tickborne diseases in residential neighborhoods, New York, USA. Emerg. Inf. Dis. 2022, 28, 957–966. [Google Scholar]
Figure 1. Yearly collection, infection rate, and acarological risk index (ARI) of blacklegged ticks at 24 parks in Staten Island, 2019–2022. (a) Collection of adults and nymphs; (b) infection rates; (c) ARI; (d) yearly average.
Arthropoda 02 00014 g001aArthropoda 02 00014 g001b
Figure 2. Four-year (2019–2022) monthly comparison of average blacklegged tick collections, infection rates, and acarological risk index (ARI).
Arthropoda 02 00014 g002
Figure 3. Spatial distribution of Lyme disease transmission risk in Staten Island. (a) Acarological risk index (ARI) for each park; (b) spatial inverse distance weighting (IDW) interpolation.
Arthropoda 02 00014 g003
Table 1. Sampling area in 24 parks of Staten Island.
PARKLatitudeLongitudeArea Surveyed (Square Meter)
Aesop park40.50291−74.22399159.3
Bloomingdale park40.53481−74.21358409.0
Blue heron park40.53679−74.17531369.2
Clay pit pond park40.54528−74.229881463.0
Clove lake park40.62296−74.11640373.5
Conference house park40.50038−74.24799316.7
Deere park40.60751−74.10836450.7
Eibs pond park40.61096−74.08256225.3
Fairview park40.53152−74.23759360.5
Freshkill park40.59233−74.18271405.6
Great kills park40.55806−74.10796244.2
High rock park40.58611−74.124851463.0
Industrial park40.61525−74.17326270.3
King fisher park40.56221−74.15284360.5
La Tourette golf course40.57939−74.15414306.7
Lemon creek park40.51670−74.20202264.1
Long pond park40.51837−74.22654383.0
Mariners marsh40.63492−74.17130360.5
Ocean breeze park40.58615−74.07302360.5
Reeds basket willow park40.60293−74.10084383.0
Sailor snag harbor40.64321−74.10165360.5
Silver lake40.62412−74.10262404.7
Willowbrook park40.60822−74.15545326.6
Wolfe pond park40.52302−74.18778309.6
Table 2. Annual results of blacklegged tick testing for B. burgdorferi.
YearAdults TestedNymphs TestedPositive AdultsPositive NymphsCombined Adult and Nymph Positivity (%)
Male Female MaleFemale
2022837116333263228.71
2021975628937275927.83
2020463810615152126.84
2019424410423123034.21
Total2682096621088014228.97
Table 3. Annual tick activity across 24 parks in Staten Island.
2019202020212022Average
Ticks/min0.200.210.500.360.32
Infection rate0.090.080.100.100.09
ARI0.070.060.140.120.10
Disclaimer/Publisher’s Note: The statements, opinions and data contained in all publications are solely those of the individual author(s) and contributor(s) and not of MDPI and/or the editor(s). MDPI and/or the editor(s) disclaim responsibility for any injury to people or property resulting from any ideas, methods, instructions or products referred to in the content.