Article

Expression of Tribbles Pseudokinase 3 in Prostate Cancers and Its Roles in Cell Cycle Regulation

Department of Medical Microbiology, Immunology and Cell Biology, Southern Illinois University School of Medicine and Simmons Cancer Institute, Springfield, IL 62794, USA
*
Author to whom correspondence should be addressed.
Kinases Phosphatases 2025, 3(1), 2; https://doi.org/10.3390/kinasesphosphatases3010002
Submission received: 22 November 2024 / Revised: 2 February 2025 / Accepted: 3 February 2025 / Published: 6 February 2025

Abstract

:
Tribbles Pseudokinase 3 (TRIB3) is a negative regulator of cellular signaling, particularly the PI3K-Akt and NF-κB pathways. Aberrant TRIB3 expressions have been reported in a number of cancers, but its role in tumor growth and progression remains controversial since both oncogenic and tumor suppressive activities have been reported. The goal of this study is to understand the roles of TRIB3 in prostate cancers through bioinformatic queries of public databases and experimental evaluations through gain-of-function and loss-of-function approaches. Here we report that there was increased TRIB3 gene expression with a Z-score over 2, relative to normal samples, in 26% of prostate cancers. Increased TRIB3 expression was associated with increased mutation counts and aneuploidy scores of prostate cancers. Increased TRIB3 expression was also associated with reduced progression-free or disease-free survival of prostate cancer patients. However, our experiments found that increased TRIB3 expression actually had an antiproliferative effect and increased cell cycle arrest at the G2/M phase. Depletion of the endogenous TRIB3 expression enhanced cell proliferation and reduced the level of Cdc25C phosphatase. Our results suggest that although TRIB3 expression was increased in prostate cancers in association with increased genomic instabilities, TRIB3 actually promoted cell cycle arrest and reduced tumor cell proliferation.

1. Introduction

Tribbles pseudokinases (TRIBs or TRBs) are a class of serine-threonine kinases, with three human tribble homologs identified: TRIB1, TRIB2, and TRIB3. Although tribbles have a single kinase-like domain, no catalytic activity has been found, thus they are known as pseudokinases [1]. Despite its lack of kinase activities, Tribbles can function as adaptor/scaffold proteins to regulate different signaling pathways such as NF-κB and Akt signaling. This class of proteins was first identified in the dog thyroid cells in regulating the mitogenic pathway [2,3]. Tribble 3 (gene name, TRIB3), also known as TRB3, PINK, SINK, C20orf97, and SKIP3, has been reported to have roles in insulin resistance and signaling through regulating the AKT pathway [4,5,6,7,8]. During fasting, TRIB3 is upregulated in patients with diabetes, where it inhibits Akt phosphorylation, leading to the constitutive activation of downstream effector GSk-3β involved in hyperglycemia and glucose intolerance [9]. TRIB3 also plays roles in many other disease processes, such as diabetes, obesity, and atherosclerosis [10].
TRIB3 has been studied in several malignancies, with both oncogenic and tumor suppressive activities reported [11,12]. For example, TRIB3 supported tumor angiogenesis in gastric cancer patients, while deletion of TRIB3 downregulated the level of VEGFA [13]. In breast cancer patients, TRIB3 has been linked to poor disease outcomes, likely due to its upregulated level under hypoxia [14] and/or its supporting roles in breast cancer stemness [15]. Other studies, however, found TRIB3 can be onco-suppressive [16]. In prostate cancer, it was reported that TRIB3 expression was stimulated when there was nutrient starvation [17], and TRIB3 plays a role in protecting prostate cancer cells from ferroptosis [18]. However, the expression and functions of TRIB3 in prostate cancers remain largely unexplored. Here we report that TRIB3 expression is increased in prostate cancers, and the increased TRIB3 expression is associated with clinical attributes including progression-free survival, mutation burdens, and aneuploidy scores. Gain-of-function and loss-of-function studies suggest that TRIB3 actually increases cell cycle arrest and reduces cell proliferation of prostate cancer cells.

2. Results

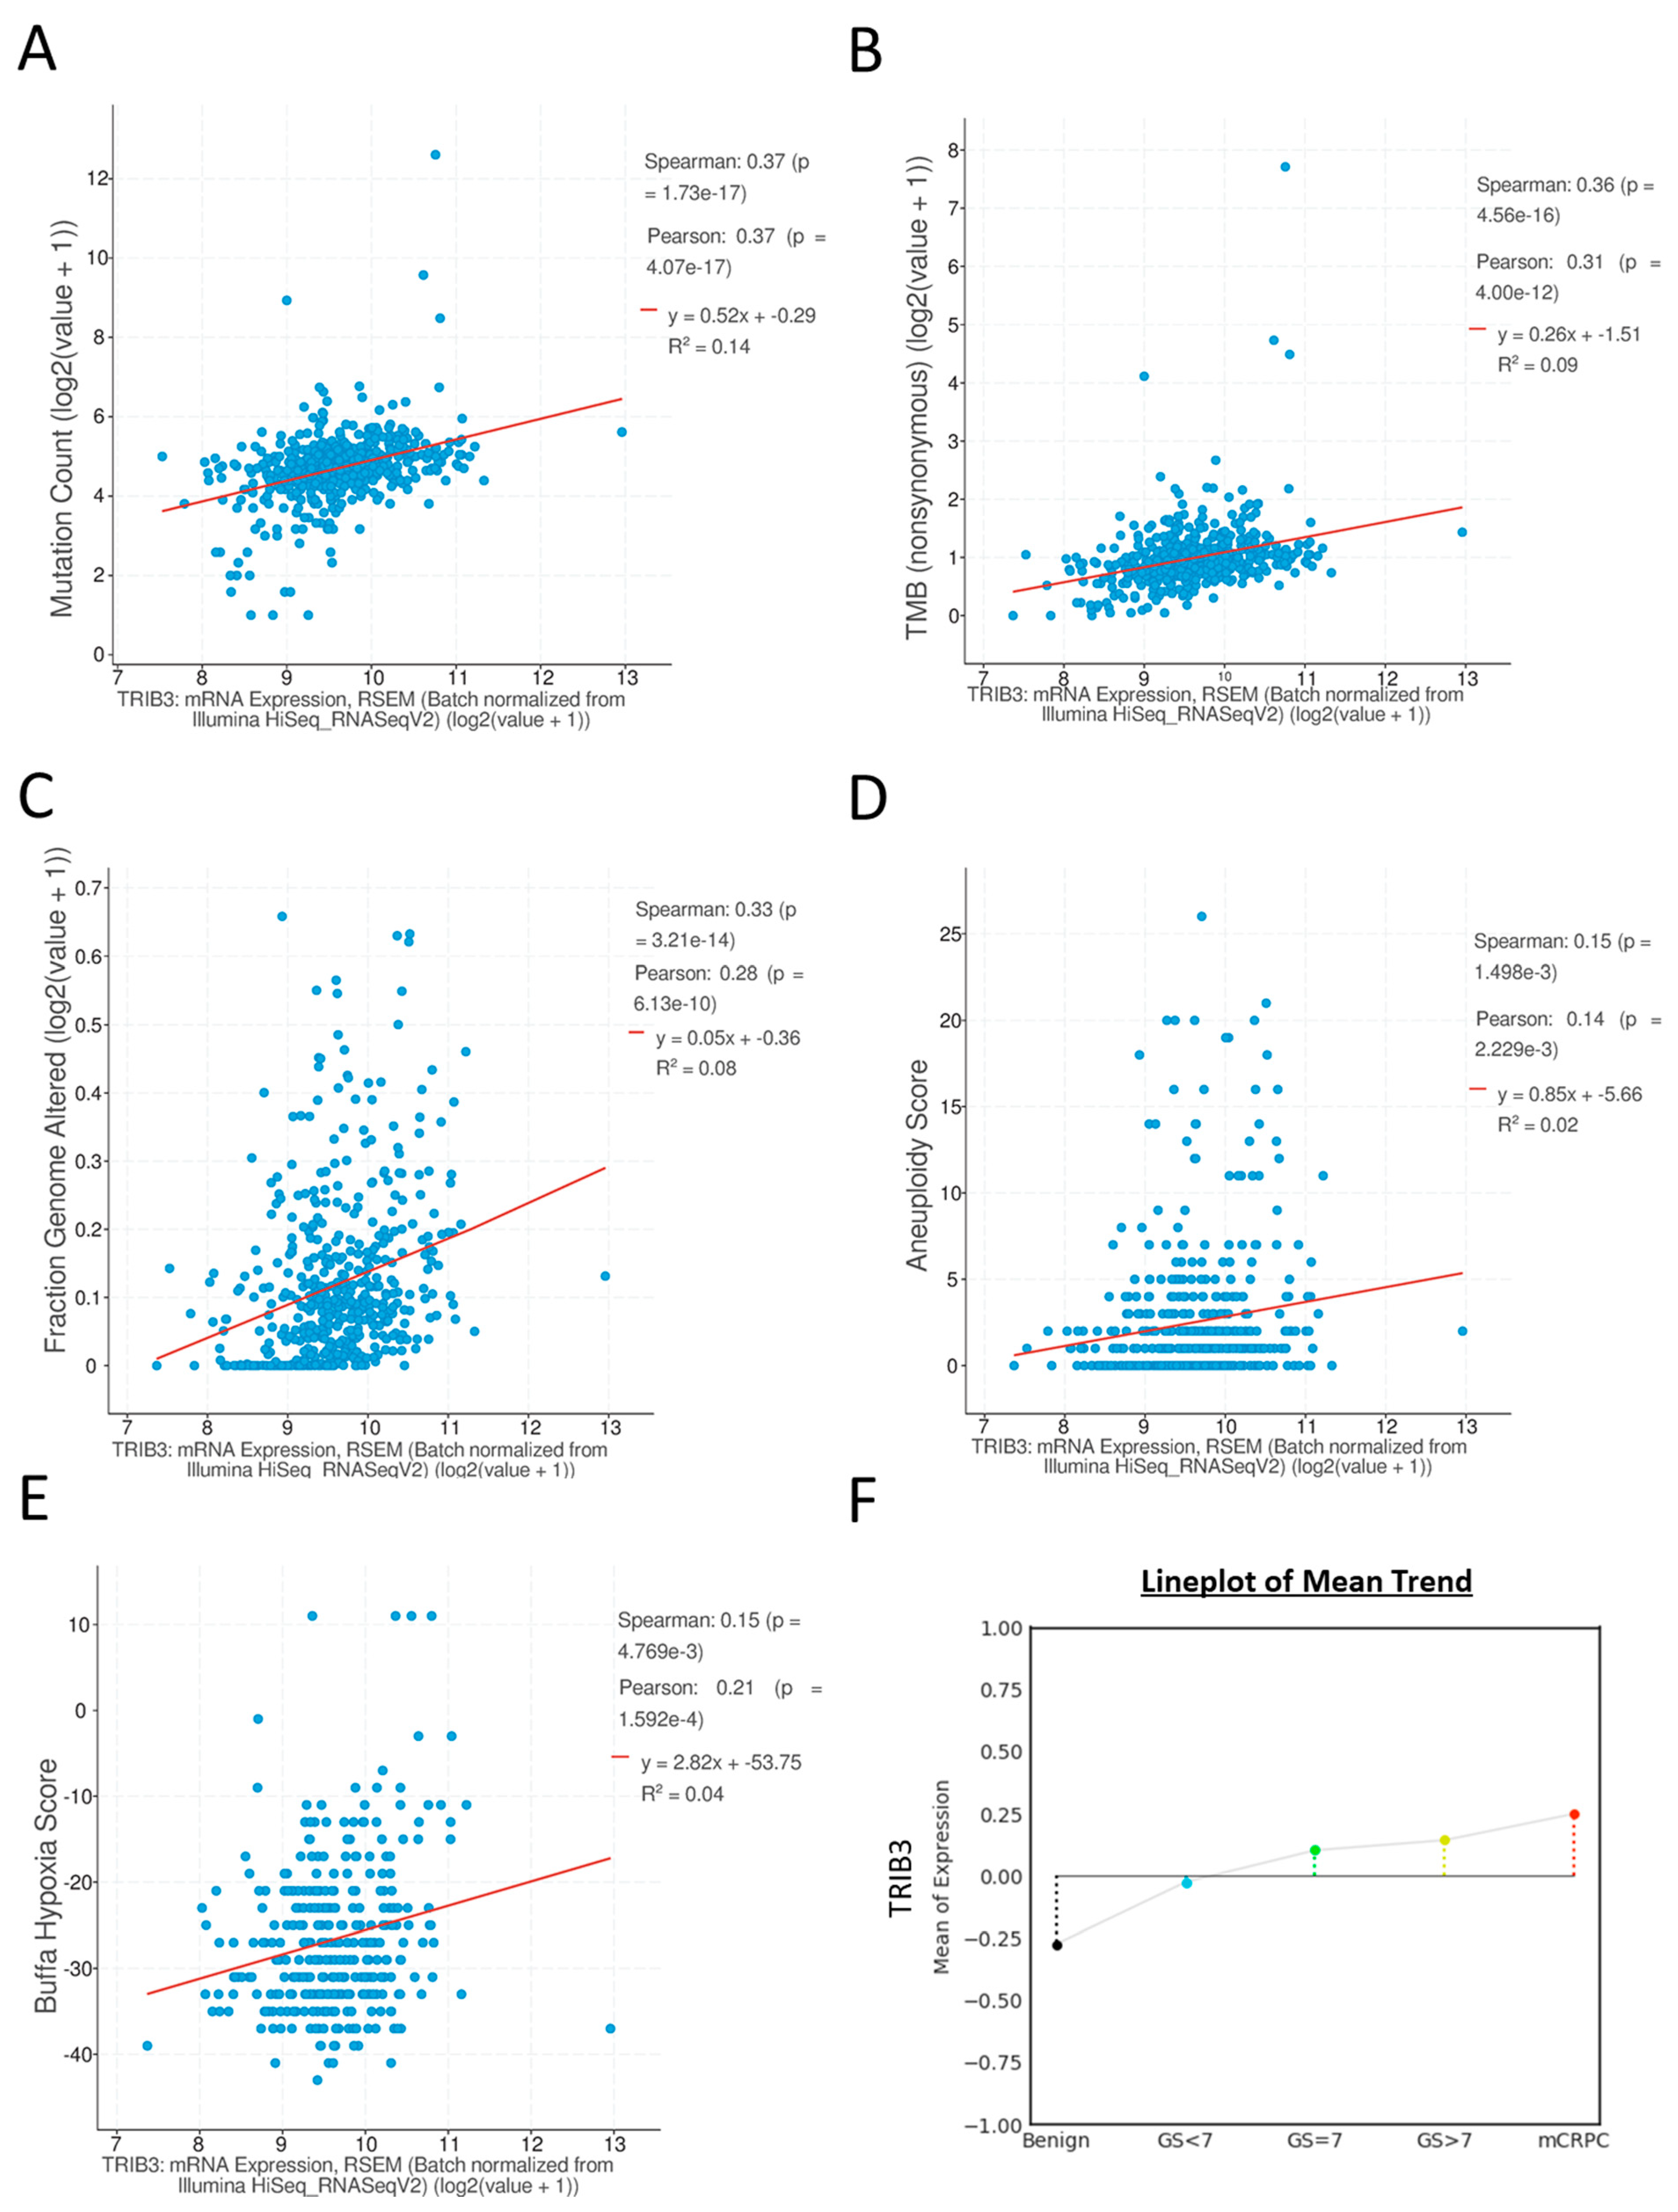
2.1. Expression of TRIB3 at mRNA Level in Prostate Cancers and Its Association with Genomic Mutations and Other Clinical Attributes

Aberrant gene expression of TRIB3 has been reported in various cancers, including breast, ovarian, oral, liver, and colorectal cancer [19,20]. To determine the expression pattern of the TRIB3 gene in prostate cancers, we performed in silico analyses using a public database (Prostate Adenocarcinoma TCGA, PanCancer Atlas, 494 samples/patients) [21,22,23,24,25,26] using cBioportal program (cbioportal.org, accessed on 15 November, 2024) [27,28,29]. In this TCGA database, the RNAseq data for expressed genes, including TRIB3, along with various parameters for genomic and clinical status, can be queried. It was found that the mRNA levels of TRIB3 were positively correlated with indications of genome instabilities including mutation count (Figure 1A, Spearman coefficient of 0.38, p = 5.74 × 10⁻¹⁸, and Pearson coefficient of 0.37, p = 4.04 × 10⁻¹⁷), tumor mutation burden (TMB) (Figure 1B, Spearman coefficient of 0.36. p = 2.10 × 10⁻¹⁶, and Pearson coefficient of 0.30, p = 5.18 × 10⁻¹²), fractions of genome altered (Figure 1C, Spearman coefficient of 0.33, p = 3.21 × 10⁻¹⁴, and Pearson coefficient of 0.26, p = 3.21 × 10⁻⁹), and to a less extent, aneuploidy scores (Figure 1D, Spearman coefficient of 0.15, p = 1.498 × 10⁻³, and Pearson coefficient of 0.14, p = 2.229 × 10⁻³). The data suggest certain associations between TRIB3 expression levels and parameters for tumor genomic instabilities.
It has been reported that TRIB3 expression can be modulated by hypoxia [14]. However, we only found slight but statistically significant positive correlations between TRIB3 mRNA levels and Buffa hypoxia scores (Figure 1E, Spearman coefficient of 0.15, p = 4.769 × 10⁻³, and Pearson coefficient of 0.21, 1.592 × 10⁻⁴).
The increased gene expression of TRIB3 in prostate cancers was revealed. in another public database (thepcta.org, accessed on 15 November 2024) [30]. From this database with transcriptome data comprised of 1321 clinical specimens from 38 PC cohorts, it was found that TRIB3 expression was higher in primary tumors when compared with benign tissues (Figure 1F, Ranksums-test: Fold change = 0.345, p-value ≤ 0.001). Further, TRIB3 expression in metastatic castration-resistant prostate cancer (mCRPC) was significantly increased when compared with the primary tumors (Figure 1F, Ranksums-test: Fold change = 0.179, p-value ≤ 0.001). Together, the data suggest that as prostate tumors progressed to advanced stages and mCRPC, TRIB3 expression steadily increased.

2.2. High mRNA Expression of TRIB3 Portends Poor Progression-Free or Poor Disease-Free Survival of Prostate Cancer Patients

As shown in Figure 2A, when using TRIB3 expression relative to the normal samples as the references, 26% of 494 samples in the TCGA Prostate Adenocarcinoma cohort (PanCancer Atlas, cbioportal.org) had increased expression of TRIB3 with the Z scores above 2, as denoted as the altered group in the Oncoprint. There was a trend of reduced progression-free survival of prostate cancer patients with high mRNA TRIB3 expression (the altered group), especially in the first five years, when compared with the rest of patients (the unaltered group), but the difference is not statistically significant with a Log-rank test p-value of 0.245 (Figure 2B).
If TRIB3 mRNA expression was profiled relative to the diploid samples, 7% of 494 samples in the same TCGA The prostate adenocarcinoma cohort had increased TRIB3 expression with Z scores. above 2, as denoted as the altered group in the Oncoprint (Figure 2C). The patients with high TRIB3 expression in tumors (the altered group) had significantly reduced progression-free survival when compared with the rest of the cohort (the unaltered group), with a hazard ratio (HR) of 2.324 and a Log-rank test p-value of 2.009 × 10⁻³ (Figure 2D). The analyses suggest that TRIB3 expression can be markedly stimulated in a subset of prostate cancers, with Z scores above 2, and the increased expression of TRIB3 is associated with reduced progression-free survival of the patients.
In another analysis, prostate tumors/samples with TRIB3 expression with the Z scores above 1 or below −1 relative to all samples were analyzed using Onco Query Language (ONL) available from the cBioportal program. As shown in Figure 2E, 15% of samples (n = 44) had high TRIB3 expression with the Z score above 1, and 14% samples (n = 43) had lower TRIB3 expression with the Z scores below −1 relative to all samples. The cohort with high TRIB3 expression had reduced disease-free survival with an HR of 6.838 when compared with the cohort with low TRIB3 expression with the Z scores below −1 (Figure 2F). The data suggest that prostate cancers with high mRNA expression of TRIB3 had an increased risk for reduced disease-free survival when compared with those with low TRIB3 expression.

2.3. Increased Expression of TRIB3 Leads to Cell Cycle Arrest and Reduced Tumor Cell Proliferation

TRIB3 expression can be stimulated by various stresses such as hypoxia or deprivation of amino acids [17,31,32]. As shown in Figure 3A, TRIB3 mRNA levels can be markedly stimulated in PC3 cells 11-fold by thapsigargin or 6-fold by tunicamycin. Both thapsigargin and tunicamycin can cause endoplasmic reticulum (ER) stresses [33]. TRIB3 mRNA levels can also be marked stimulated by glucose starvation (7.9 folds), hypoxia through CoCl2 (5.8 folds), or disruption of the electron transport chain (ETC) through rotenone treatment (41.7 folds) (Figure 3A). The data suggest that TRIB3 gene expression can be markedly stimulated by various metabolic stresses.
To determine the effects of increased TRIB3 expression on prostate tumor cells, TRIB3 was ectopically overexpressed in prostate cancer PC-3 cells using a pCMV6 TRIB3 (Trb3) expression vector with Myc and DDK tags. Derived from bone metastasis, PC3 cells are androgen-independent with PTEN deletion [34]. Increased TRIB3 expression at the protein level was confirmed by Western blot (Figure 3B). The growth rates of PC-3 cells with increased TRIB3 expression were monitored for four consecutive days. By day three, TRIB3 overexpressed cells started exhibiting a lower proliferation rate when compared with the pCMV6 vector control (Figure 3C). At day four, significant lower proliferative rates were clearly noted in PC-3 cells with increased TRIB3 expressions (groups denoted as Trb3-Myc DDK 2B and Trb3-DDK G, Figure 3C). The BrdU incorporation assay confirmed the antiproliferative effects of increased TRIB3 expression on PC-3 cells (Figure 3D). Cell cycle analyses revealed an increased cell cycle arrest at the G2/M phase in PC-3. cells with increased TRIB3 expression when compared with their pCMV6 vector control (Figure 3E). The data suggest that increased TRIB3 expression actually led to cell cycle arrest and reduced proliferation in prostate cancer PC-3 cells.

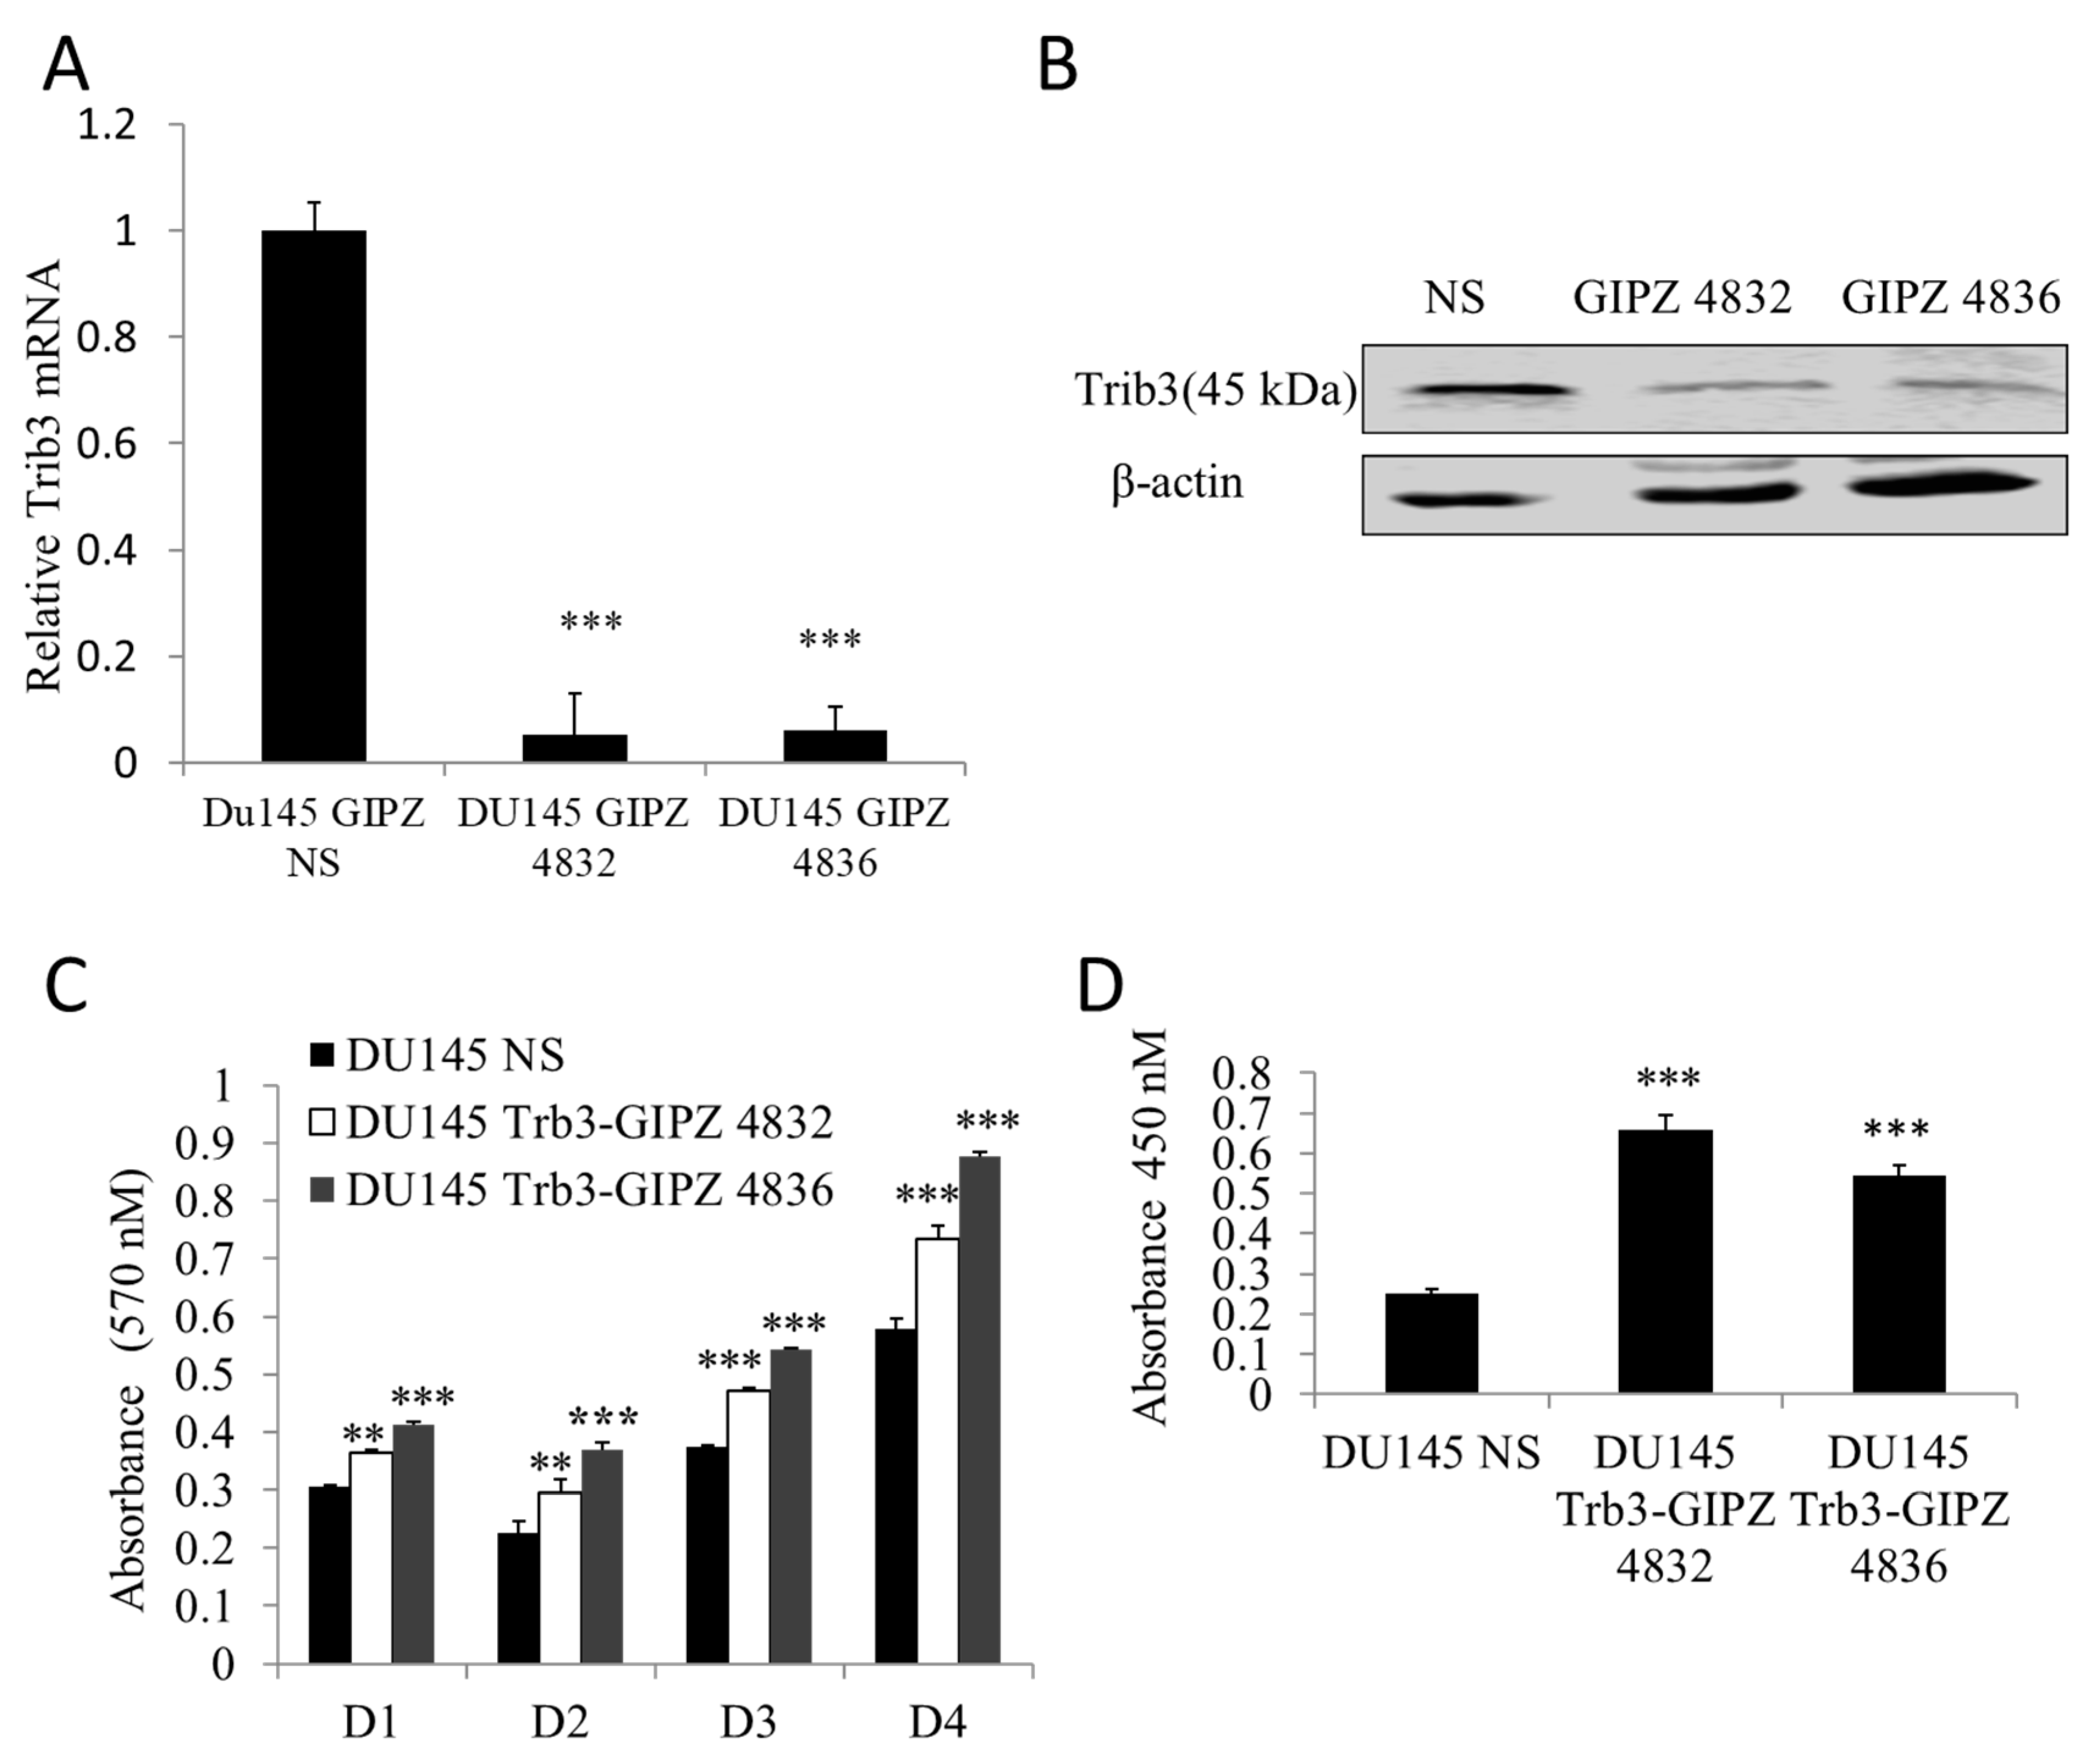
2.4. Depletion of TRIB3 in Prostate Cancer Cells Promotes Cellular Proliferation
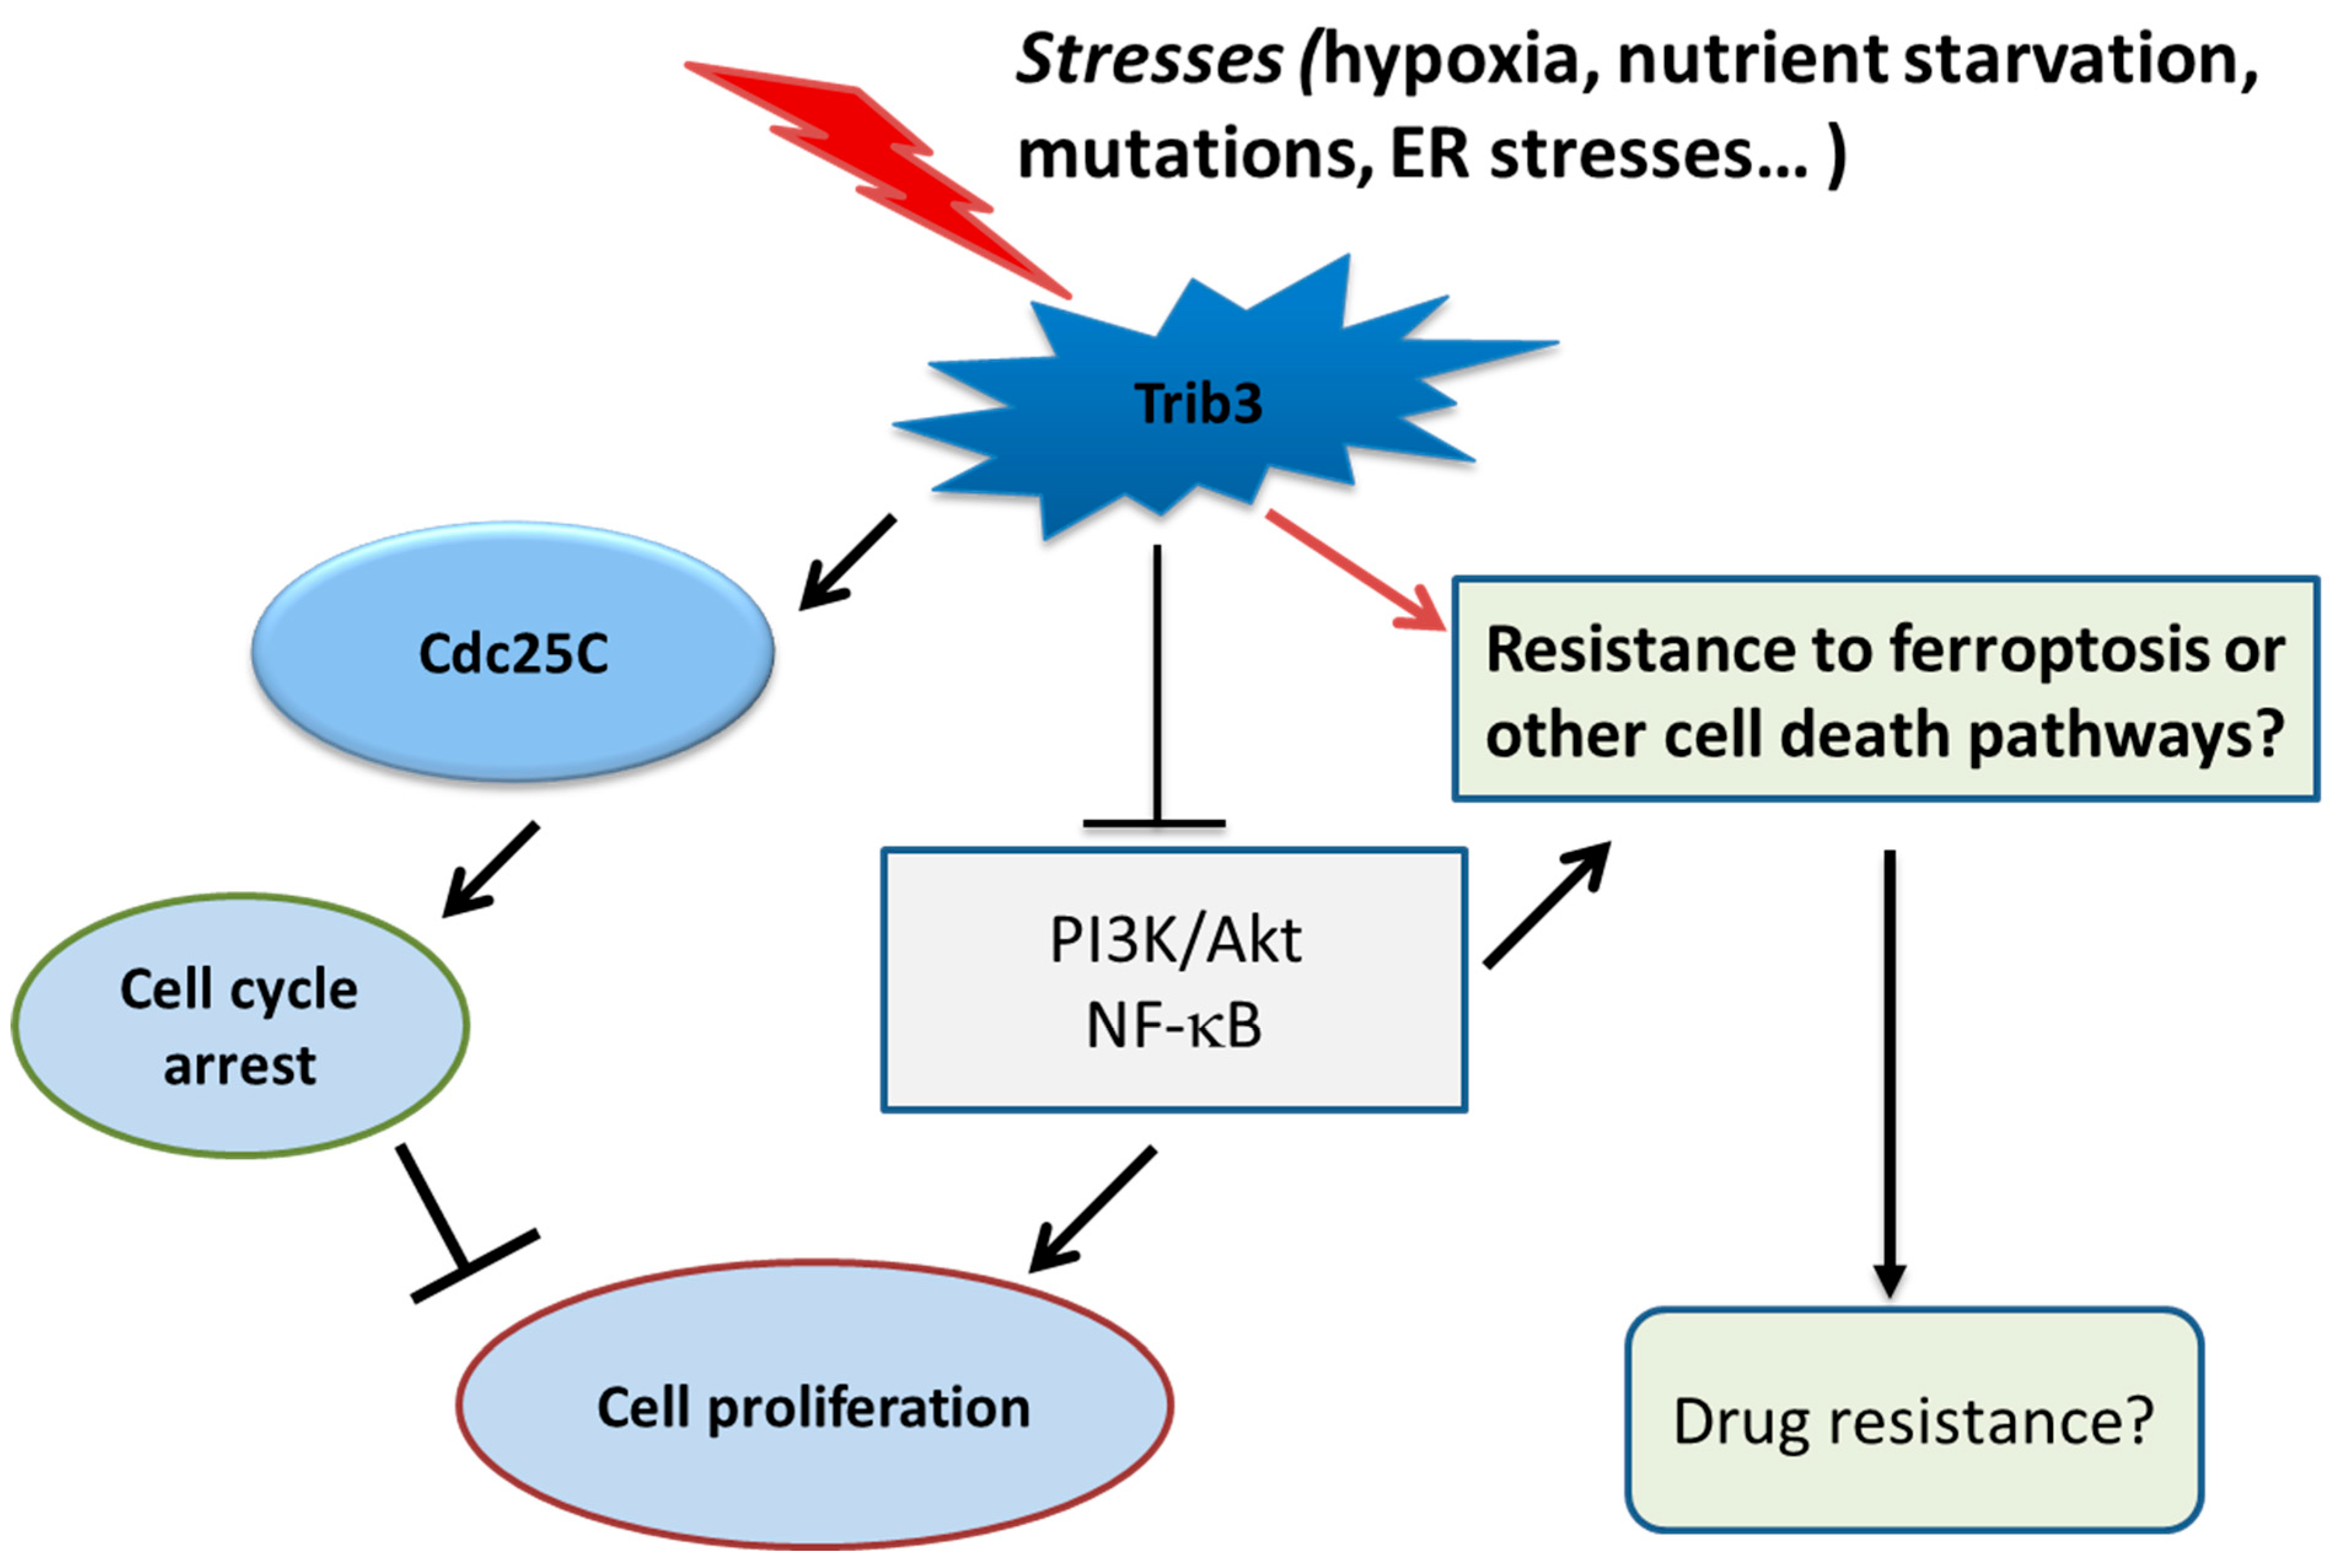
To determine the functional roles of TRIB3 in prostate cancer, TRIB3 expression was knocked down in DU145 cells using pGIPZ shRNA constructs. DU145 cells were chosen since they have functional PTEN, in contrast to PC3 cells in which PTEN is deleted [34]. The reduced TRIB3 expression was confirmed by both qPCR and Western blot analysis (Figure 4A,B). The growth of TRIB3-depleted cells was evaluated for a period of four consecutive days using MTS assays. As shown in Figure 4C, DU145 cells with TRIB3 expression reduced (denoted as GIPZ-4836 and GIPZ-4832) presented higher growth rates when compared with the non-silencing control (denoted as GIPZ-NS). The increased tumor cell proliferation after TRIB3 depletion was further confirmed using the BrdU incorporation assay. In this assay, the absorbance at 450 nM is proportional to the amount of BrdU incorporation into newly synthesized DNA. As shown in Figure 4D, TRIB3-depleted cells exhibited a higher proliferation rate when compared with the control. The data suggest that while TRIB3 expression can be increased in prostate cancers, TRIB3 actually slows down cell proliferation.
To further determine the effects of TRIB3 depletion on cell proliferation, cell cycle analyses were performed to assess the percentage of cells in each phase based on their DNA contents. DU145 Trb3-GIPZ-4832 and DU145 Trb3-GIPZ-4836, along with their vector controls, were stained with propidium iodide and subjected to flow cytometry analysis. An increase in distributions at the S phase was found in cells with TRIB3 expression depleted (GIPZ-4832 and GIPZ-4836), with concurrent reductions in the G0/G1 phase when compared with the vector control (NS) (Figure 5A,B). The data confirm that TRIB3 depletion stimulates tumor cell proliferation.
To determine the mechanism for the observed changes in cell proliferation rate as a result of TRIB3 knockdown, we examined the levels of different cell cycle proteins in DU145 tumor cells with TRIB3 depletion. As shown in Figure 5C, no obvious and consistent changes in cyclin D1 or CDK2 were observed in the cell lines tested, despite a weak but significant negative correlation of TRIB3 (TRIB3) and cyclin D1 (CCND1) at mRNA levels with a Spearman coefficient of −0.16 (p = 3.354 × 10⁻⁴) and Pearson coefficient of −0.16 (p = 2.73 × 10⁻⁴) in the TCGA PanCancer Atlas of Prostate Adenocarcinoma (Figure 5D). However, we noticed a consistent reduction of Cdc25C protein levels in cells with TRIB3 knockdown (GIPZ-4832 and GIPZ-4835) when compared with the non-silencing vector control (NS) (Figure 5C). Interestingly, the expression of TRIB3 (TRIB3) and Cdc25C at mRNA levels are significantly correlated with a Spearman coefficient of 0.35 (p = 7.99 × 10⁻¹⁶) and a Pearson coefficient of 0.35 (p = 6.74 × 10⁻¹⁴) in the same TCGA PanCancer Atlas of Prostate Adenocarcinoma (Figure 5E). Given the role of Cdc25C in cell cycle regulation, the data suggest that TRIB3 may affect cell cycle progression through Cdc25C. However, further studies are needed to determine whether TRIB3 can regulate the expression of Cdc25C and to what extent Cdc25C mediates the effects of TRIB3 on cell cycle progression.

3. Discussion

Aberrant expressions of TRIB3 have been reported in a number of cancers, with both oncogenic and tumor suppressive activities reported in different studies. In prostate cancer cells, TRIB3 expression can be stimulated by ER stresses or hypoxia or inhibited by inhibitors of PI3K-Akt signaling pathways [17], and further TRIB3 is found to confer prostate cancer cells with resistance to ferroptosis [18]. Through queries of different independent public databases, it is found that TRIB3 expression can be markedly increased in prostate cancers, with 26% of cases presenting with Z scores above 2, relative to the normal samples. Increased expression of TRIB3 is noted in the primary tumors when compared with the benign tissues, with the mean level of TRIB3 expression highest in mCRPC.
Our analyses also reveal that high TRIB3 expression is a potential indicator of poor prognosis of prostate cancer patients, such as disease-free or progression-free survival (Figure 2D,F). However, the correlation does not necessarily indicate that TRIB3 has a cause-and-effect relationship with the reduced survival of prostate cancer patients or TRIB3 is a driver for the lethal progression of prostate cancer, due to the marked induction of TRIB3 under increased genotoxic or metabolic stresses in a subset of prostate cancers. Indeed, the mRNA levels of TRIB3 in prostate cancers are significantly associated with clinical attributes of genomic instabilities, including mutation counts, TMB, fraction of genomes altered, and aneuploidy scores. The findings are consistent with a recent report linking TRIB3 with cancer immune-related genomic alterations [35]. However, further studies are needed to determine whether it is the genomic mutations that stimulate TRIB3 expression, in a way similar to p53, or whether increased TRIB3 expression reflects the cellular stresses sustained by increased genomic mutations.
Our studies find a regulatory role of TRIB3 in cell cycle progression and prostate tumor cell proliferation. When overexpressed in PC-3 cells, TRIB3 caused an increased cell cycle arrest at the G2/M phase and reduced cell proliferation. When endogenous expression of TRIB3 was knocked down in DU145 cells, there was increased tumor cell proliferation and DNA synthesis. Our gain-of-function or loss-of-function experiments suggest an important role of TRIB3 in regulating cell cycle progression in prostate cancers.
Most of the knowledge on tribbles, including TRIB3 in vivo, were obtained from developmental biology studies. For instance, tribbles play an essential role in the development of Drosophila, where they regulate String, the fly orthologue of mammalian Cdc25 [36]. Cdc25 is a phosphatase that plays a key role in regulating cell cycle progression beyond the G2 phase by dephosphorylating cyclin-dependent kinase Cdk1 (cdc2). Expression of String is associated with entry into mitosis. In the gastrulating mesoderm, tribbles regulate String to prevent entry into mitosis. These regulatory activities of TRIB3 during Drosophila development were also observed during oogenesis [1,37,38]. In this study, when TRIB3 was knocked down, there were reduced levels of Cdc25C protein (Figure 5C). Further, the mRNA levels of TRIB3 were positively correlated with those of Cdc25C in prostate tumor samples in the TCGA prostate adenocarcinoma database (Figure 5E). Cdc25C is a phosphatase responsible for dephosphorylating Cdc2, a crucial step in regulating the entry of all eukaryotic cells into mitosis. However, further studies are needed to determine whether Cdc25C is required for TRIB3 to regulate the cell cycle progression, in addition to its role in regulating the PI3K/Akt and NF-κB signaling pathways.
There are some weaknesses in our studies. The studies need to be expanded to more prostate tumor cells, including those with responsiveness to androgen. Given the frequent deregulation of the PI3K/Akt signaling pathway in prostate adenocarcinoma, the impacts of TRIB3 on PI3K/Akt needs to be systematically investigated. Further studies are needed to address the potential role of TRIB3 in regulating NF-kB and tumor immunity microenvironments.
In summary, as shown in Figure 6, in response to genomic and/or metabolic stresses, TRIB3 expression is stimulated in prostate cancer cells. Increased TRIB3 expression leads to increased cell cycle arrest, with Cdc25C as a possible mediator and reduced cell proliferation. Increased TRIB3 expression may also regulate cell survival and drug resistance through PI3K/Akt and NF-kB pathways as well. Our studies suggest a potential role of TRIB3 in prostate tumor growth, progression, and responses to treatments.

4. Materials and Methods

Bioinformatics analyses and queries of TRIB3 in public databases: Two independent public databases were used to query TRIB3 expression and its association with clinical attributes. The Prostate Adenocarcinoma TCGA public database (PanCancer Atlas, 494 samples/patients) [21,22,23,24,25,26] was used to analyze altered TRIB3 expression, as shown in Oncoprint, and its association with clinical attributes and patient survival using various query methods and parameters available from the cBioportal program [27,28,29]. Another public database (thepcta.org) [30], which contains transcriptome data comprised of 1321 clinical specimens from 38 PC cohorts, was used for queries of the expression and clinical relevance of TRIB3 in prostate cancers.
Cell cultures and treatments: Prostate cancer Cell lines PC-3 and DU145 were purchased from the American Type Culture Collection (ATCC, Manassas, VA, USA). Both PC-3 and DU145 were cultured in RPMI-1640 supplemented with 10% fetal bovine serum (FBS), penicillin (100 U/mL), and streptomycin (10 µg/mL) in a humidified incubator at 37 °C with 5% CO2. For treatments, cells were seeded in normal culture media overnight. Afterwards, the cells were treated with various compounds as indicated.
Overexpression of TRIB3: The pCMV6 vector (Cat# PS100001) and human TRIB3 (Trb3) open reading frame in pCMV6 with Myc and DKK tags (Cat# RC237699) were purchased from OriGene (Rockville, MD, USA). PC-3 cells transfected with pCMV6 or pCMV6-Trb3 were selected by G418 geneticin. The derived PC-3 sublines were characterized for increased TRIB3 expression at the mRNA level by RT-qPCR and at the protein level by Western blot.
Depletion of TRIB3 expression: TRIB3 depletion in DU145 cells was performed using pGIPZ shRNA lentiviral constructs targeting TRIB3 ORF (Cat# RHS4430-200227566, denoted as GIPZ 4832, with AAGTTGTCATCCAACTCCA as the mature antisense sequence; and RHS4430-200228460, denoted as GIPZ 4826, with TCCTGGACGGGGTACACCT as the mature antisense sequence, Horizon Discovery, Waltham, MA, USA). Their non-silencing vector (Cat# RHS4346) was used as the control. DU145 cells were transduced with the lentivirus indicated, and the transduced cells were sorted by flow cytometry based on the presence of GFP using Becton-Dickinson FACSAria II cell sorter with BDDIVA analysis software 6.0. The derived sublines, denoted as GIPZ 4832 and GIPZ 4826, along with the non-silencing vector control (NS), were characterized for TRIB3 expressions by RT-qPCR or Western blot.
Trypan blue cell proliferation assay: 0.2 million cells were seeded into a 12-well plate. The numbers of viable cells were counted each day for 4 consecutive days by the Via-Cell counter based on trypan blue staining (Beckham Coulter Vi-CELL Cell Viability Analyzer and Counter, Indianapolis, IN, USA). Each experiment was performed in triplicate, and the cell growth in TRIB3 overexpressed or depleted cells were compared to their respective vector controls.
Bromodeoxyuridine (BrdU) incorporation assay: The effects of TRIB3 depletion or overexpression on DNA synthesis in S phase were evaluated by a BrdU incorporation assay based on the manufacturer’s instructions (Cell Signaling, Danvers, MA, USA. Cat# 6813). Basically, 5000 cells were seeded into a 96-well plate. 24 h later, BrdU solutions were added to the wells and incubated at 37 °C. The next day, the cells were treated with 100 µL of fixing/denaturing solution at room temperature for 30 min. The solution was removed and 1× of detection antibody for one hour, washed, and then incubated with 1× HRP-conjugated secondary antibody at room temperature. 30 min later, cells were washed three times, and 100 µL of 1× 3,3′,5,5′-tetramethylbenzidine substrate was added. The reaction was stopped by adding 10 µL of stop solution. The absorbance was read at 450 nm using BioTek Synergy HTX Multi-Mode Microplate Reader (Agilent, Santa Clara, CA, USA). All experiments were performed in triplicates.
MTS assay (CellTiter 96® AQueous Non-Radioactive Cell Proliferation Assay): MTS and PMS Solutions (Promega, Madison, WI, USA) were prepared following the CellTiter 96® AQueous MTS Non-Radioactive Cell Proliferation Assay instruction and stored at −20 °C protected from light. 2500 cells were seeded into each well in 96-well plates under desired culture conditions, triplicates in the same column for each group. One column of wells was reserved for culture medium only as a background absorbance blanking adjustment. After the desired days of culturing, 20 μL of the combined MTS/PMS solutions were added into each well of the 96-well assay plate containing 100 μL of cells in culture medium. The medium was allowed to equilibrate, and cells were incubated for 2 h at 37 °C in a humidified, 5% CO2 atmosphere; the absorbance at 490 nm (OD490nm) was recorded using BioTek Synergy HTX Multi-Mode Microplate Reader Reader (Agilent, Santa Clara, CA, USA).
Flow cytometry analyses of the cell cycle: 0.5 × 10⁶ TRIB3-depleted and overexpressed cells were harvested and washed with 1× PBS, and fixed using absolute ethanol at 4 °C. One hour later, the cells were washed twice using 1× PBS and treated with 2 µg of RNAase for 30 min at 37 °C. Propidium iodide was added to the cells, which were then subjected to flow cytometry analyses based on their DNA contents using the Becton-Dickinson FACSAria II cell sorter with BD FACSDIVA software 6.0.
Western blot: Cells were harvested using 2× SDS lysis buffer with protease inhibitor cocktails on ice. The cell lysate was sonicated for 10 s and then followed by heating at 95 °C for 5 min. All samples were loaded at the same amount and separated by SDS-PAGE gel in a Bio-Rad Protean II system (Hercules, CA, USA). After transferring proteins to a polyvinylidene difluoride (PVDF) membrane, the membrane was blocked with 5% BSA for 60 min at room temperature and incubated with the primary antibody at appropriate dilutions in 5% BSA at 4 °C. After overnight incubation with appropriate primary antibodies, the membrane was washed three times with Tris-buffered saline (TBS) containing 0.1% Tween for 5 min each time and probed with fluorescently labeled secondary antibody (1:10,000) for 1 h at room temperature. The membrane was then washed three more times with TBS-T for a total of 15 min. The immunoblots were visualized by Odyssey Infrared Imaging Version 2.0.0. Densitometry was performed using Li-Cor’s Odyssey 2.0 Infrared Imaging System. The following antibodies used in this study were TRIB3 rabbit mAb (Abcam, Cat#75846, 1:1000), β-actin mAb (Cell Signaling, Cat#3700, 1:5000), Cdc25C rabbit mAB (Cell Signaling, Cat#4688, 1:1000), Cyclin D1 rabbit mAb (Cell Signaling Cat# 2978, 1:1000), CDK4 rabbit mAb (Cell Signaling Cat#12790, 1:1000), and CDK2 rabbit mAb (Cell Signaling Cat# 2546, 1:1000).
RT-qPCR analysis: Total RNAs were isolated from cells using the Trizol reagent method. For the reverse transcription quantitative PCR (RT-qPCR), RNAs were reverse transcribed to cDNAs using a kit (Bioline, Meridian Bioscience, Cincinnati, OH, USA) with oligo-dT as primers. The cDNA products were used as templates for real-time PCR with SYBR green qPCR mixture by SYBR green master mix (Promega) following the manufacturer’s protocol with specific primer sets. Human TRIB3 (Forward Primer 5′-AAGCGGTTGGAGTTGGATGAC-3′, Reverse Primer 5′-CACGATCTGGAGCAGTAGGTG-3′), and β-actin (forward: 5′ CATGTACGTTGCTATCCAGGC 3′ and 5′ CTCCTTAATGTCACGCACGAT 3′). Primers were designed using PrimerQuest Tool and then synthesized by Integrated DNA Technologies (IDT, Coralville, IA, USA). Applied Biosystem 7500 Real-Time PCR System with SDS software v.1.2.1 was used to perform qPCR analyses. The qPCR reactions started with a denaturing temperature of 95 °C for 10 min and an annealing temperature of 50 °C for two minutes and then proceeded for 40 cycles of 95 °C for 15 s and 60 °C for one minute. The quality of PCR products was evaluated by melt analysis or gel electrophoresis to ensure the right PCR product formed. For each sample, the reactions were performed in triplicate. The result ΔCt was normalized to human β-actin, and the relative expression of the target gene was calculated using the ΔΔCt method [39].
Statistical analysis: Statistical analyses of the bioinformatics data were obtained as part of the queries of the database with the methods or query parameters indicated. Experimental data were analyzed and visualized using Microsoft Excel or GraphPad Prism V (GraphPad, San Diego, CA, USA). For experimental data, a two-tailed Student’s t-test was performed to evaluate the statistical significance of differences between two indicated groups. Differences were considered statistically significant if p-value ≤ 0.05.

Author Contributions

Conceptualization, D.A. and D.N.; methodology, D.A. and J.W.; bioinformatic analyses, M.-T.W. and D.N.; validation, D.A. and D.N.; experiments and formal analysis, D.A.; resources, D.N.; data curation, D.A. and D.N.; writing—original draft preparation, D.A.; writing—review and editing, D.N.; visualization, D.A. and D.N.; supervision and project administration, D.N.; funding acquisition, D.N. All authors have read and agreed to the published version of the manuscript.

Funding

This research received no external funding.

Institutional Review Board Statement

Not applicable.

Informed Consent Statement

Not applicable.

Data Availability Statement

Data are available upon request.

Conflicts of Interest

The authors declare no conflicts of interest.

References

  1. Hegedus, Z.; Czibula, A.; Kiss-Toth, E. Tribbles: Novel regulators of cell function; evolutionary aspects. Cell. Mol. Life Sci. 2006, 63, 1632–1641. [Google Scholar] [CrossRef] [PubMed]
  2. Wilkin, F.; Savonet, V.; Radulescu, A.; Petermans, J.; Dumont, J.E.; Maenhaut, C. Identification and characterization of novel genes modulated in the thyroid of dogs treated with methimazole and propylthiouracil. J. Biol. Chem. 1996, 271, 28451–28457. [Google Scholar] [CrossRef]
  3. Wilkin, F.; Suarez-Huerta, N.; Robaye, B.; Peetermans, J.; Libert, F.; Dumont, J.E.; Maenhaut, C. Characterization of a phosphoprotein whose mRNA is regulated by the mitogenic pathways in dog thyroid cells. Eur. J. Biochem. 1997, 248, 660–668. [Google Scholar] [CrossRef] [PubMed]
  4. de Lorenzo, C.; Greco, A.; Fiorentino, T.V.; Mannino, G.C.; Hribal, M.L. Variants of insulin-signaling inhibitor genes in type 2 diabetes and related metabolic abnormalities. Int. J. Genom. 2013, 2013, 376454. [Google Scholar] [CrossRef] [PubMed]
  5. Prudente, S.; Sesti, G.; Pandolfi, A.; Andreozzi, F.; Consoli, A.; Trischitta, V. The mammalian tribbles homolog TRIB3, glucose homeostasis, and cardiovascular diseases. Endocr. Rev. 2012, 33, 526–546. [Google Scholar] [CrossRef]
  6. Beguinot, F. Tribbles homologue 3 (TRIB3) and the insulin-resistance genes in type 2 diabetes. Diabetologia 2010, 53, 1831–1834. [Google Scholar] [CrossRef]
  7. Ord, T.; Ord, D.; Adler, P.; Vilo, J.; Ord, T. TRIB3 enhances cell viability during glucose deprivation in HEK293-derived cells by upregulating IGFBP2, a novel nutrient deficiency survival factor. Biochim. Biophys. Acta 2015, 1853, 2492–2505. [Google Scholar] [CrossRef]
  8. Liu, J.; Zhang, W.; Chuang, G.C.; Hill, H.S.; Tian, L.; Fu, Y.; Moellering, D.R.; Garvey, W.T. Role of TRIB3 in regulation of insulin sensitivity and nutrient metabolism during short-term fasting and nutrient excess. Am. J. Physiol. Endocrinol. Metab. 2012, 303, E908–E916. [Google Scholar] [CrossRef]
  9. Du, K.; Herzig, S.; Kulkarni, R.N.; Montminy, M. TRB3: A tribbles homolog that inhibits Akt/PKB activation by insulin in liver. Science 2003, 300, 1574–1577. [Google Scholar] [CrossRef]
  10. Samper-Ternent, R.; Al Snih, S. Obesity in Older Adults: Epidemiology and Implications for Disability and Disease. Rev. Clin. Gerontol. 2012, 22, 10–34. [Google Scholar] [CrossRef] [PubMed]
  11. Salazar, M.; Lorente, M.; Garcia-Taboada, E.; Perez Gomez, E.; Davila, D.; Zuniga-Garcia, P.; Maria Flores, J.; Rodriguez, A.; Hegedus, Z.; Mosen-Ansorena, D.; et al. Loss of Tribbles pseudokinase-3 promotes Akt-driven tumorigenesis via FOXO inactivation. Cell Death Differ. 2015, 22, 131–144. [Google Scholar] [CrossRef]
  12. Salazar, M.; Lorente, M.; Garcia-Taboada, E.; Gomez, E.P.; Davila, D.; Zuniga-Garcia, P.; Flores, J.M.; Rodriguez, A.; Hegedus, Z.; Mosen-Ansorena, D.; et al. TRIB3 suppresses tumorigenesis by controlling mTORC2/AKT/FOXO signaling. Mol. Cell. Oncol. 2015, 2, e980134. [Google Scholar] [CrossRef] [PubMed]
  13. Dong, S.; Xia, J.; Wang, H.; Sun, L.; Wu, Z.; Bin, J.; Liao, Y.; Li, N.; Liao, W. Overexpression of TRIB3 promotes angiogenesis in human gastric cancer. Oncol. Rep. 2016, 36, 2339–2348. [Google Scholar] [CrossRef]
  14. Wennemers, M.; Bussink, J.; Scheijen, B.; Nagtegaal, I.D.; van Laarhoven, H.W.; Raleigh, J.A.; Varia, M.A.; Heuvel, J.J.; Rouschop, K.M.; Sweep, F.C.; et al. Tribbles homolog 3 denotes a poor prognosis in breast cancer and is involved in hypoxia response. Breast Cancer Res. 2011, 13, R82. [Google Scholar] [CrossRef]
  15. Yu, J.M.; Sun, W.; Wang, Z.H.; Liang, X.; Hua, F.; Li, K.; Lv, X.X.; Zhang, X.W.; Liu, Y.Y.; Yu, J.J.; et al. TRIB3 supports breast cancer stemness by suppressing FOXO1 degradation and enhancing SOX2 transcription. Nat. Commun. 2019, 10, 5720. [Google Scholar] [CrossRef]
  16. Salazar, M.; Lorente, M.; Orea-Soufi, A.; Davila, D.; Erazo, T.; Lizcano, J.; Carracedo, A.; Kiss-Toth, E.; Velasco, G. Oncosuppressive functions of tribbles pseudokinase 3. Biochem. Soc. Trans. 2015, 43, 1122–1126. [Google Scholar] [CrossRef]
  17. Schwarzer, R.; Dames, S.; Tondera, D.; Klippel, A.; Kaufmann, J. TRB3 is a PI 3-kinase dependent indicator for nutrient starvation. Cell Signal. 2006, 18, 899–909. [Google Scholar] [CrossRef]
  18. Zhang, Y.; Liu, C.; Yang, Y.; Ren, H.; Ren, T.; Huang, Y.; Zhang, S.; Sun, Q.; Huang, H. TRIB3 inhibition by palbociclib sensitizes prostate cancer to ferroptosis via downregulating SOX2/SLC7A11 expression. Cell Death Discov. 2024, 10, 425. [Google Scholar] [CrossRef] [PubMed]
  19. Xu, J.; Lv, S.; Qin, Y.; Shu, F.; Xu, Y.; Chen, J.; Xu, B.E.; Sun, X.; Wu, J. TRB3 interacts with CtIP and is overexpressed in certain cancers. Biochim. Biophys. Acta 2007, 1770, 273–278. [Google Scholar] [CrossRef] [PubMed]
  20. Zhang, J.; Wen, H.J.; Guo, Z.M.; Zeng, M.S.; Li, M.Z.; Jiang, Y.E.; He, X.G.; Sun, C.Z. TRB3 overexpression due to endoplasmic reticulum stress inhibits AKT kinase activation of tongue squamous cell carcinoma. Oral Oncol. 2011, 47, 934–939. [Google Scholar] [CrossRef] [PubMed]
  21. Hoadley, K.A.; Yau, C.; Hinoue, T.; Wolf, D.M.; Lazar, A.J.; Drill, E.; Shen, R.; Taylor, A.M.; Cherniack, A.D.; Thorsson, V.; et al. Cell-of-Origin Patterns Dominate the Molecular Classification of 10,000 Tumors from 33 Types of Cancer. Cell 2018, 173, 291–304 e296. [Google Scholar] [CrossRef]
  22. Ellrott, K.; Bailey, M.H.; Saksena, G.; Covington, K.R.; Kandoth, C.; Stewart, C.; Hess, J.; Ma, S.; Chiotti, K.E.; McLellan, M.; et al. Scalable Open Science Approach for Mutation Calling of Tumor Exomes Using Multiple Genomic Pipelines. Cell Syst. 2018, 6, 271–281 e277. [Google Scholar] [CrossRef] [PubMed]
  23. Taylor, A.M.; Shih, J.; Ha, G.; Gao, G.F.; Zhang, X.; Berger, A.C.; Schumacher, S.E.; Wang, C.; Hu, H.; Liu, J.; et al. Genomic and Functional Approaches to Understanding Cancer Aneuploidy. Cancer Cell 2018, 33, 676–689 e673. [Google Scholar] [CrossRef]
  24. Liu, J.; Lichtenberg, T.; Hoadley, K.A.; Poisson, L.M.; Lazar, A.J.; Cherniack, A.D.; Kovatich, A.J.; Benz, C.C.; Levine, D.A.; Lee, A.V.; et al. An Integrated TCGA Pan-Cancer Clinical Data Resource to Drive High-Quality Survival Outcome Analytics. Cell 2018, 173, 400–416 e411. [Google Scholar] [CrossRef] [PubMed]
  25. Sanchez-Vega, F.; Mina, M.; Armenia, J.; Chatila, W.K.; Luna, A.; La, K.C.; Dimitriadoy, S.; Liu, D.L.; Kantheti, H.S.; Saghafinia, S.; et al. Oncogenic Signaling Pathways in The Cancer Genome Atlas. Cell 2018, 173, 321–337 e310. [Google Scholar] [CrossRef]
  26. Bhandari, V.; Hoey, C.; Liu, L.Y.; Lalonde, E.; Ray, J.; Livingstone, J.; Lesurf, R.; Shiah, Y.J.; Vujcic, T.; Huang, X.; et al. Molecular landmarks of tumor hypoxia across cancer types. Nat. Genet. 2019, 51, 308–318. [Google Scholar] [CrossRef] [PubMed]
  27. Gao, J.; Aksoy, B.A.; Dogrusoz, U.; Dresdner, G.; Gross, B.; Sumer, S.O.; Sun, Y.; Jacobsen, A.; Sinha, R.; Larsson, E.; et al. Integrative analysis of complex cancer genomics and clinical profiles using the cBioPortal. Sci. Signal. 2013, 6, pl1. [Google Scholar] [CrossRef] [PubMed]
  28. Cerami, E.; Gao, J.; Dogrusoz, U.; Gross, B.E.; Sumer, S.O.; Aksoy, B.A.; Jacobsen, A.; Byrne, C.J.; Heuer, M.L.; Larsson, E.; et al. The cBio cancer genomics portal: An open platform for exploring multidimensional cancer genomics data. Cancer Discov. 2012, 2, 401–404. [Google Scholar] [CrossRef]
  29. de Bruijn, I.; Kundra, R.; Mastrogiacomo, B.; Tran, T.N.; Sikina, L.; Mazor, T.; Li, X.; Ochoa, A.; Zhao, G.; Lai, B.; et al. Analysis and Visualization of Longitudinal Genomic and Clinical Data from the AACR Project GENIE Biopharma Collaborative in cBioPortal. Cancer Res. 2023, 83, 3861–3867. [Google Scholar] [CrossRef] [PubMed]
  30. You, S.; Knudsen, B.S.; Erho, N.; Alshalalfa, M.; Takhar, M.; Al-Deen Ashab, H.; Davicioni, E.; Karnes, R.J.; Klein, E.A.; Den, R.B.; et al. Integrated Classification of Prostate Cancer Reveals a Novel Luminal Subtype with Poor Outcome. Cancer Res. 2016, 76, 4948–4958. [Google Scholar] [CrossRef] [PubMed]
  31. Ohoka, N.; Yoshii, S.; Hattori, T.; Onozaki, K.; Hayashi, H. TRB3, a novel ER stress-inducible gene, is induced via ATF4-CHOP pathway and is involved in cell death. Embo J. 2005, 24, 1243–1255. [Google Scholar] [CrossRef]
  32. Carraro, V.; Maurin, A.C.; Lambert-Langlais, S.; Averous, J.; Chaveroux, C.; Parry, L.; Jousse, C.; Ord, D.; Ord, T.; Fafournoux, P.; et al. Amino acid availability controls TRB3 transcription in liver through the GCN2/eIF2alpha/ATF4 pathway. PLoS ONE 2010, 5, e15716. [Google Scholar] [CrossRef]
  33. Abdullahi, A.; Stanojcic, M.; Parousis, A.; Patsouris, D.; Jeschke, M.G. Modeling Acute ER Stress in Vivo and in Vitro. Shock 2017, 47, 506–513. [Google Scholar] [CrossRef] [PubMed]
  34. Chetram, M.A.; Odero-Marah, V.; Hinton, C.V. Loss of PTEN permits CXCR4-mediated tumorigenesis through ERK1/2 in prostate cancer cells. Mol. Cancer Res. 2011, 9, 90–102. [Google Scholar] [CrossRef]
  35. Hu, C.; Li, Q.; Xiang, L.; Luo, Y.; Li, S.; An, J.; Yu, X.; Zhang, G.; Chen, Y.; Wang, Y.; et al. Comprehensive pan-cancer analysis unveils the significant prognostic value and potential role in immune microenvironment modulation of TRIB3. Comput. Struct. Biotechnol. J. 2024, 23, 234–250. [Google Scholar] [CrossRef] [PubMed]
  36. Hegedus, Z.; Czibula, A.; Kiss-Toth, E. Tribbles: A family of kinase-like proteins with potent signalling regulatory function. Cell Signal. 2007, 19, 238–250. [Google Scholar] [CrossRef] [PubMed]
  37. Rorth, P.; Szabo, K.; Texido, G. The level of C/EBP protein is critical for cell migration during Drosophila oogenesis and is tightly controlled by regulated degradation. Mol. Cell 2000, 6, 23–30. [Google Scholar] [CrossRef] [PubMed]
  38. Seher, T.C.; Leptin, M. Tribbles, a cell-cycle brake that coordinates proliferation and morphogenesis during Drosophila gastrulation. Curr. Biol. 2000, 10, 623–629. [Google Scholar] [CrossRef] [PubMed]
  39. Livak, K.J.; Schmittgen, T.D. Analysis of relative gene expression data using real-time quantitative PCR and the 2(-Delta Delta C(T)) Method. Methods 2001, 25, 402–408. [Google Scholar] [CrossRef] [PubMed]
Figure 1. Association of TRIB3 expression with clinical attributes of prostate cancers. (AD). Positive correlation of TRIB3 mRNA levels with mutation counts (A), nonsynonymous TMB (B), fraction of genome altered (C), and aneuploidy scores (D) in prostate adenocarcinoma. (E) Slight but statistically significant correlation of TRIB3 mRNA levels with Buffa hypoxia scores in prostate adenocarcinoma. (F) Expression of TRIB3 in benign prostate tissues, prostate tumor tissues of different Gleason scores (GS < 7, GS = 7, GS > 7), and mCRPC, presented as a Line plot of mean expression levels.
Kinasesphosphatases 03 00002 g001
Figure 2. Association of TRIB3 expression with the survival of prostate cancer patients. (A) Oncoprint for the increased TRIB3 mRNA level with the Z-scores above 2.0 relative to normal samples in 26% of prostate tumors. (B) Progression-free survival of prostate cancer patients with increased tumor TRIB3 expression with Z-scores above 2.0 relative to normal samples (the altered group, n = 129) when compared with the rest (the unaltered group, n = 364). (C) Oncoprint for the increased TRIB3 expression with Z-scores above 2.0 relative to diploid samples in 7% of prostate tumors. (D) Progression-free survival of prostate cancer patients with increased tumor TRIB3 expression with Z-scores above 2.0 relative to diploid samples (the altered group, n = 34) when compared with the rest (the unaltered group, n = 459). (E) Oncoprint for high TRIB3 mRNA levels with Z-scores above 1.0 in 15% patient samples and for low TRIB3 levels with Z-scores below −1.0 in 14% patient samples. (F) Disease-free survival of prostate cancer patients with high TRIB3 mRNA levels (TRIB3: EXP > 1.0, n = 44) when compared with those with low levels (TRIB3: EXP < −1.0, n = 43).
Kinasesphosphatases 03 00002 g002
Figure 3. Increased TRIB3 expression by ER and metabolic stresses and the effects of TRIB3 on tumor cell proliferation. (A) Increased TRIB3 mRNA levels in PC3 cells after treatment with thapsigargin, tunicamycin, lack of glucose, CoCl2, or rotenone. (B) Generation of PC-3 sublines (A, 2B, G) with increased TRIB3 expression through a pCMV6-Trb3 expression vector with Myc and DDK tags. (C) Growth of PC-3 cells with different TRIB3 expression levels. (D) BrdU incorporation in PC-3 cells with different TRIB3 expression levels. (E) Cell cycle analyses of PC-3 cells with different TRIB3 expression levels. Data were presented as the average with one standard deviation as the error bar. **, *** denote p < 0.01 and 0.001 when compared with the vector controls, respectively.
Kinasesphosphatases 03 00002 g003
Figure 4. TRIB3 depletion promotes prostate tumor cell proliferation. (A) Knockdown of TRIB3 mRNA expression in DU145 cells by shRNA. (B) Reduced TRIB3 protein levels in DU145 cells after TRIB3 knockdown. (C) Increased cell growth in tumor cells with TRIB3 expression knockdown. TRIB3-depleted DU145 cells and non-silencing controls were seeded into a 96-well plate. The cell proliferation rate was measured each day for four days by subjecting the cells to MTS reagent for 3 h. The experiments were performed in triplicate. (D) Increased BrdU incorporation in DU145 cells with TRIB3 expression knockdown. 5000 cells were seeded into a 96-well plate, and BrdU was added the following day. Data were presented as the average with one standard deviation as the error bar. **, *** denote p < 0.01 and 0.001 when compared with the vector controls, respectively.
Kinasesphosphatases 03 00002 g004
Figure 5. Effects of TRIB3 depletion on cell cycle progression. (A,B) Flow cytometry analyses of cells with TRIB3 expression depleted (GIPZ 4832 and GIPZ 4836) and their non-silencing vector control (NS). Data were presented as the average with one standard deviation as the error bar. **, *** denote p < 0.01 and 0.001, respectively. ns, not significant. (C) Western blot analyses of select cell cycle regulatory proteins after TRIB3 knockdown. β-actin was used as a loading control. (D) Inverse correlation of TRIB3 mRNA levels with cyclin D1 (CCND1) in prostate carcinoma. (E) Positive correlation of TRIB3 mRNA levels with Cdc25C in prostate carcinoma.
Kinasesphosphatases 03 00002 g005
Figure 6. Schematic flowchart of TRIB3 induction and its subsequent effects on cell cycle progression, cell proliferation, cell death (ferroptosis and apoptosis), and drug resistance. TRIB3 expression is stimulated in tumor cells when they are under stress, which includes increased genomic instabilities and mutations, lack of nutrients or oxygen, and ER stresses. The increased TRIB3 levels can cause cell cycle arrest and reduced cell proliferation, likely through Cdc25C or inhibition of PI3K/Akt and NF-κB signaling pathways. Increased TRIB3 levels also have impacts on tumor cell survival through modulation of ferroptosis or apoptosis, which can modify drug resistance.
Kinasesphosphatases 03 00002 g006
Disclaimer/Publisher’s Note: The statements, opinions and data contained in all publications are solely those of the individual author(s) and contributor(s) and not of MDPI and/or the editor(s). MDPI and/or the editor(s) disclaim responsibility for any injury to people or property resulting from any ideas, methods, instructions or products referred to in the content.

