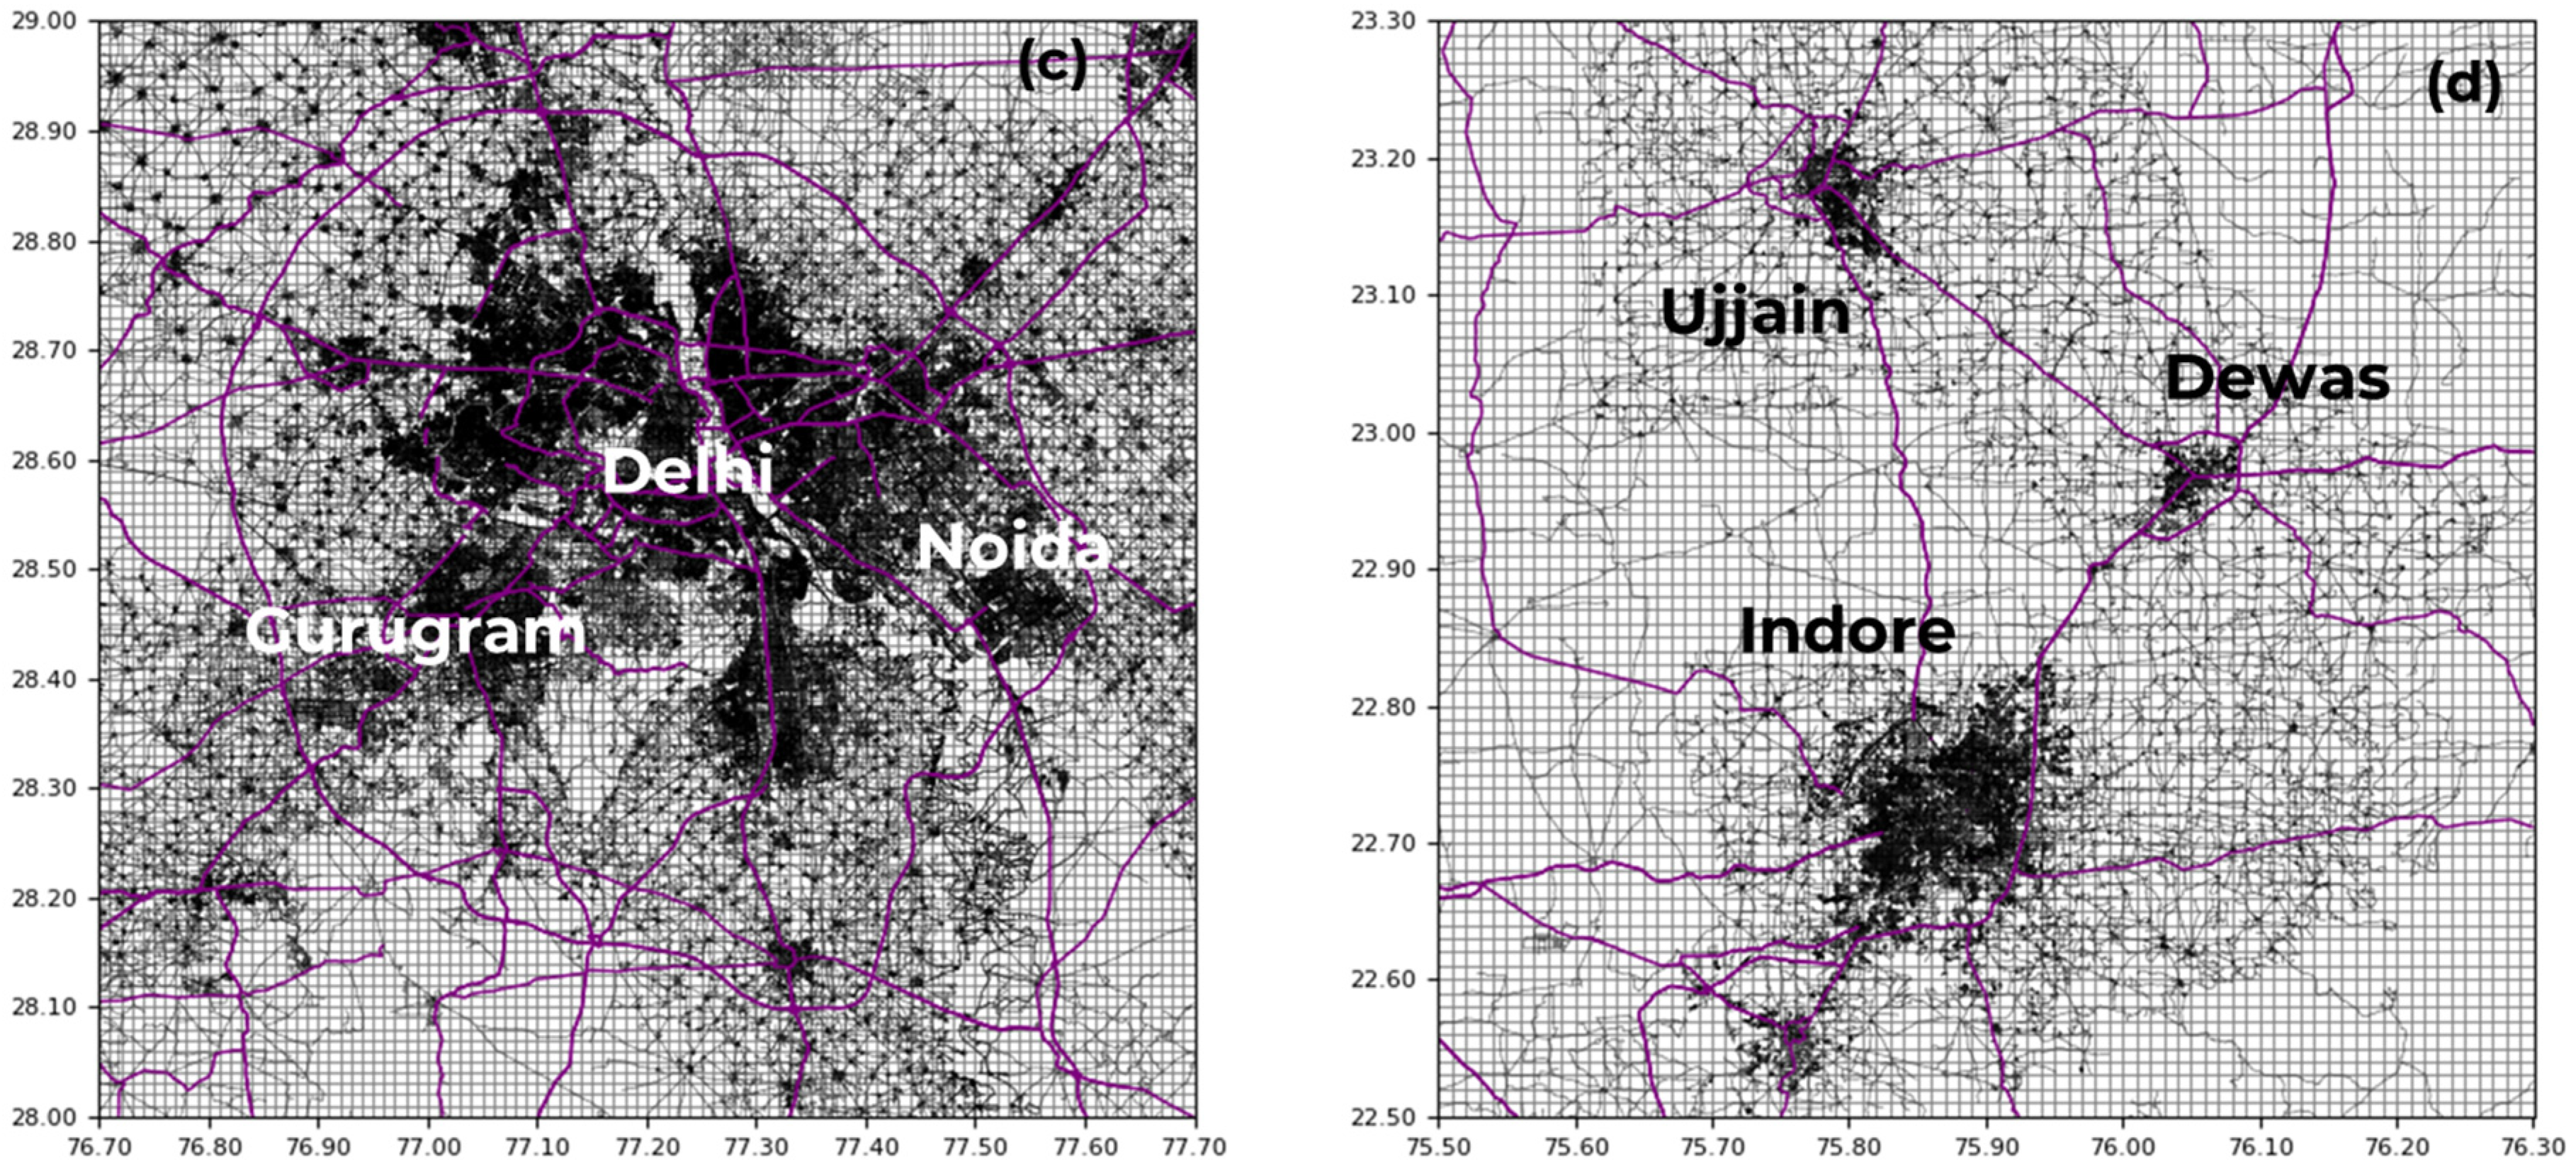
Designating Airsheds in India for Urban and Regional Air Quality Management
Abstract
1. Introduction
2. Methods and Materials
3. Results and Discussion
3.1. Designating Urban Airsheds
3.2. Designating Regional Airsheds
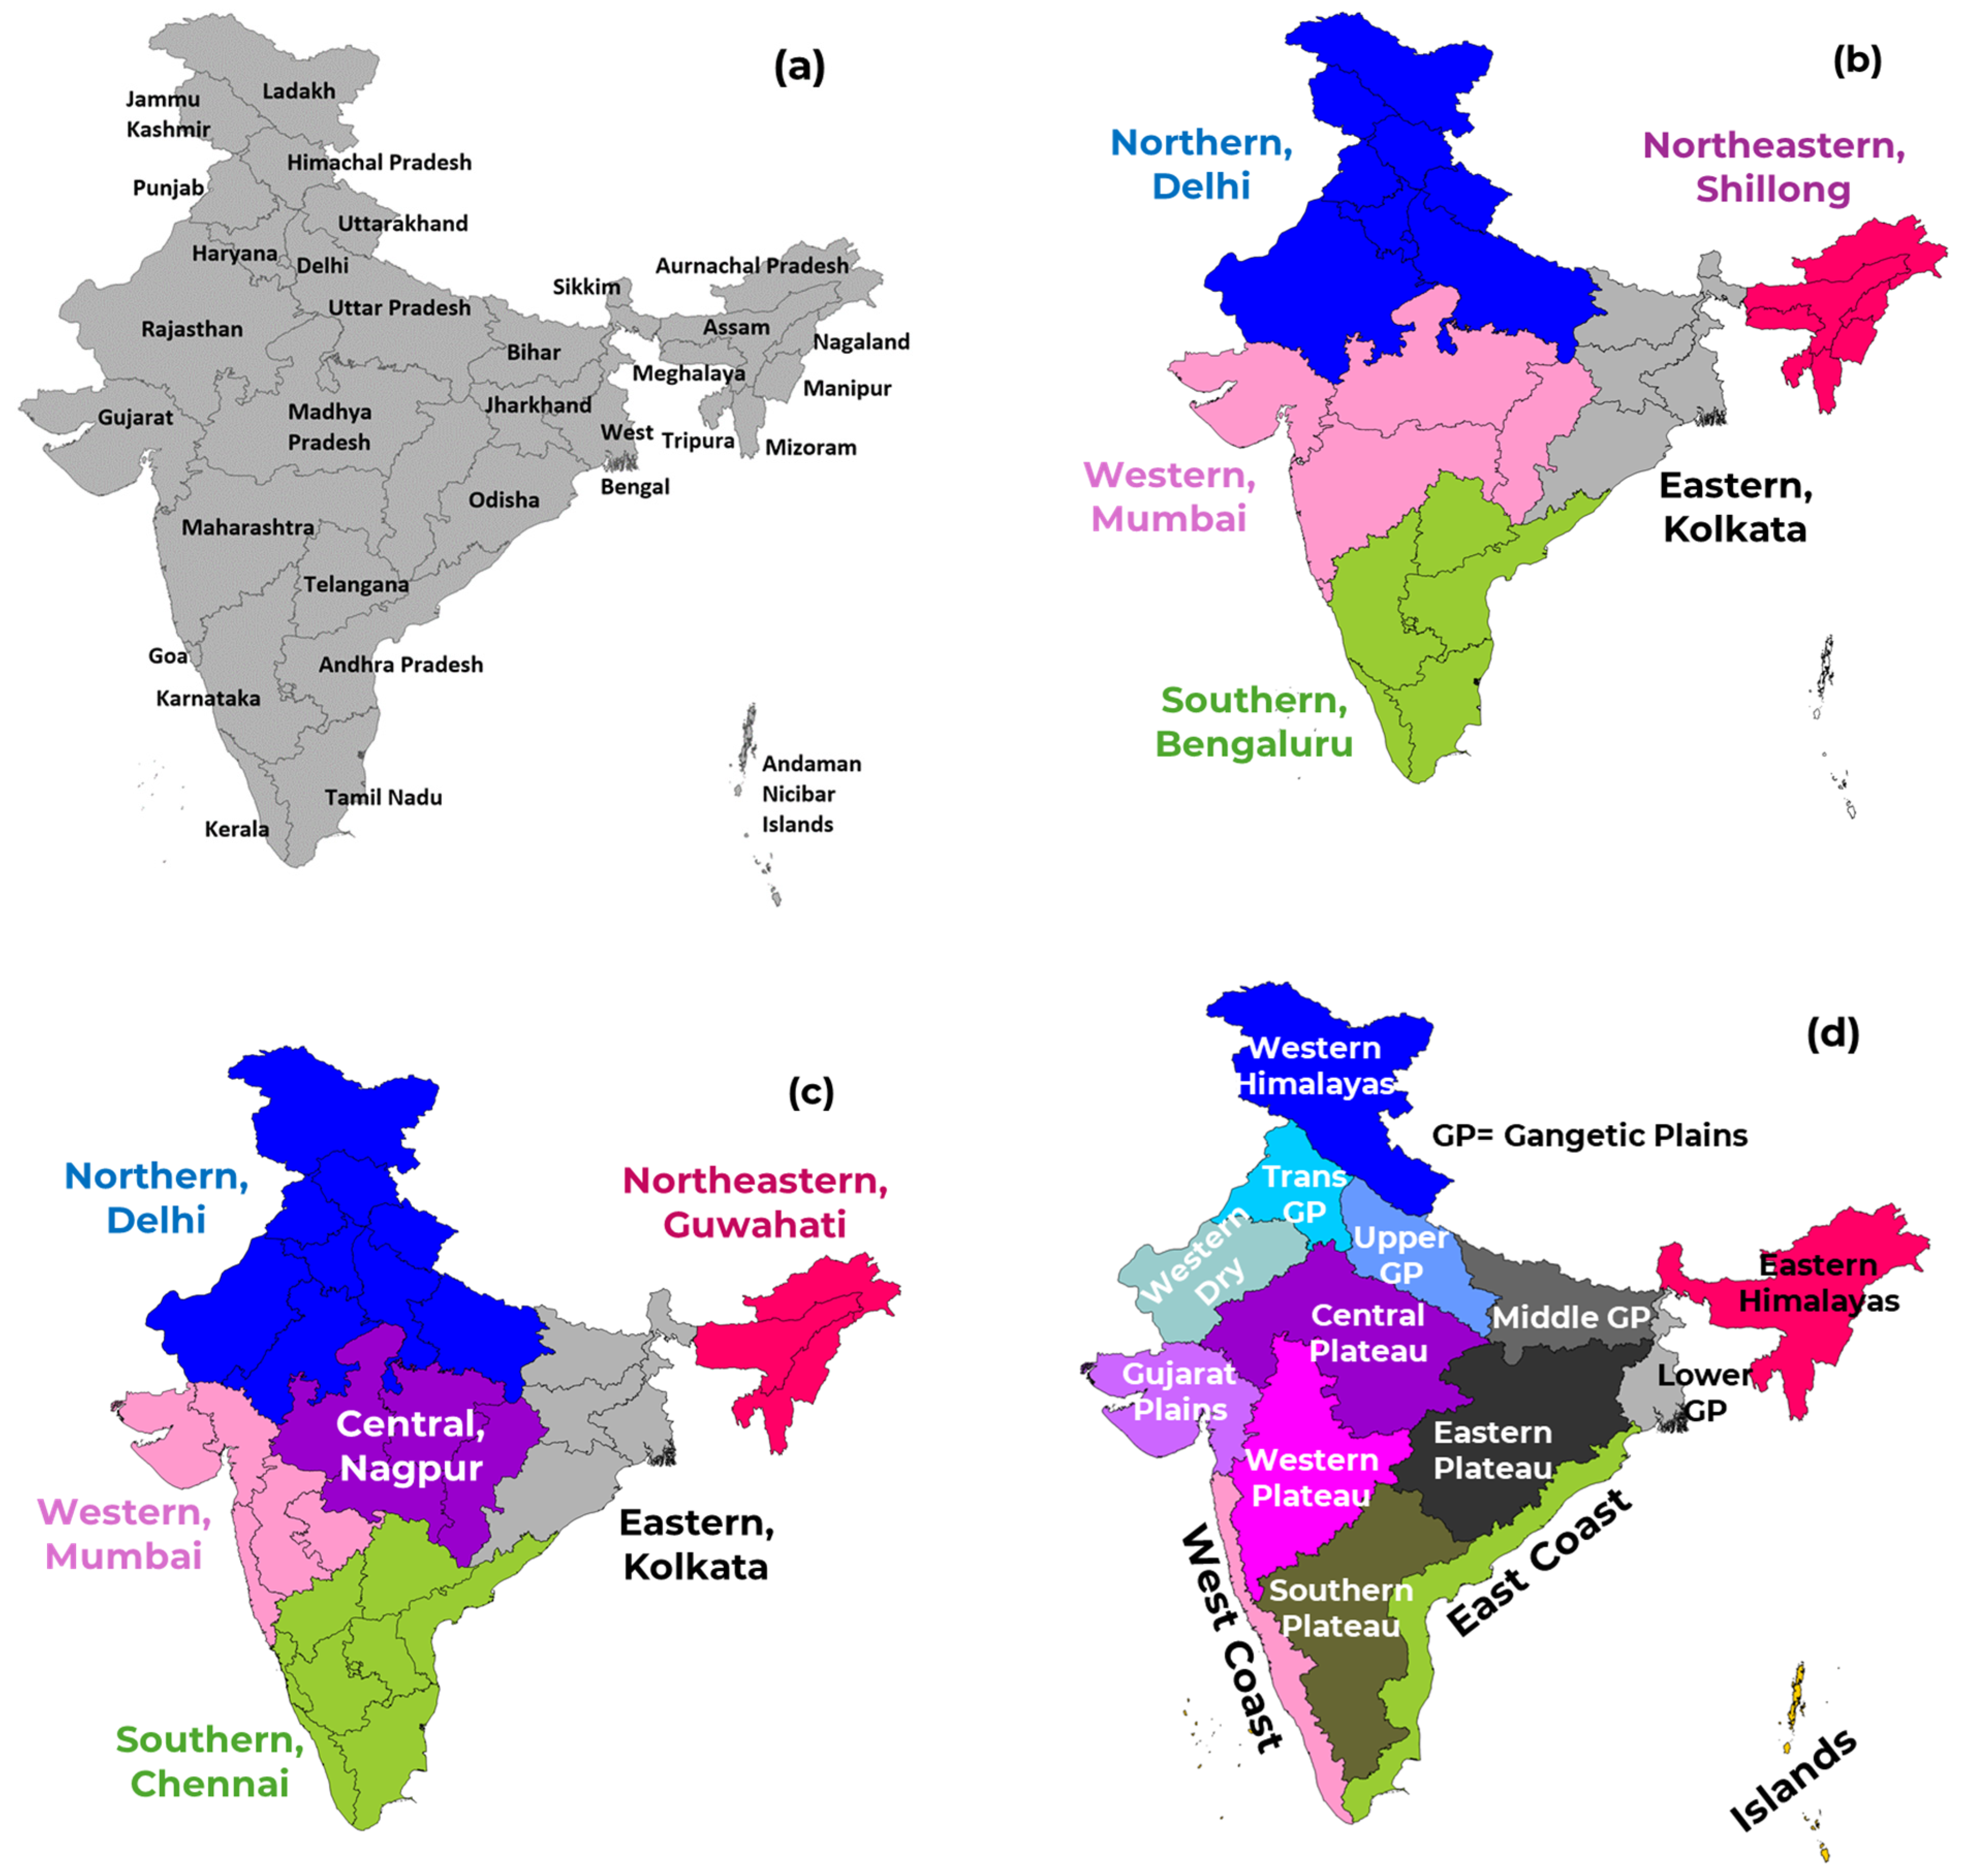
- State administrative boundaries: There are 28 states and eight union territories (UTs) in India (Figure 2a), covering a total of 755 districts (as of December 2023). The district boundaries are not considered in this discussion as it becomes cumbersome to govern so many airsheds. All the states operate a pollution control board (PCB), and union territories operate a pollution control committee under a central governing body—the Central Pollution Control Board (CPCB, New Delhi, India). If there is no need to revamp the coordination program, each of the states can be an airshed, capable of monitoring, auditing, and evaluating the air pollution trends and formulating clean air action plans. In this case, the states can prepare individual implementation plans (SIPs) including not only the emission intensities within the state administrative boundary but also the contributions of the neighboring states. Excluding the UTs, which are small and can be absorbed into the neighboring states, this framework will result in 28 regional airsheds under the existing governing setup.
- Power load dispatch centers: At the end of FY 2023–2024, India’s installed power generation capacity is 440 GW and split between fossil and renewables at 55% and 45%, respectively. Data on fuel use, power generation, and power transmission from all the power plants are recorded and uploaded to the national power portal (https://npp.gov.in—accessed on 1 May 2024). The data on the transmissions are also maintained at sub-grid and sub-regional levels by five load dispatch centers (LDCs) (Figure 2b)—Northern, Northeastern, Eastern, Western, and Southern. This is a good example of seamless regional coordination for data collation from power plants and consumer grids, which is an important barrier for air quality management. However, only having five divisions to share the workload across the country to coordinate big states and large emission producers is daunting.
- Meteorological sub-regional and regional divisions: This is an ideal framework for air quality management since the sub-regional divisions are based on long-term weather patterns, and the system comes with an operational modeling framework for meteorology for all of India, extending to the Indian Subcontinent. The meteorological systems, under the auspices of the Indian Meteorological Department (IMD), can be further extended to also include air quality modeling systems at various spatial and temporal scales. The framework includes 36 sub-regional divisions and 6 regional divisions (Figure 2c). A major barrier to this merger is likely the seamless integration of independent departments under two different ministries—PCBs under the Ministry of Environment, Forests, and Climate Change and IMD under the Ministry of Earth Science. Like LDCs, only six regional airsheds is a smaller number, and 36 is larger than the number of states to coordinate.
- Agro-climatic zones: These zones are based on soil types, rainfall intensity, temperature variations, and ground and rain-fed water availability for agriculture. This is the most ideal framework, in terms of the number of regional airsheds, the size of the individual airsheds, geographical commonality in the airsheds, and weather patterns. More on this is discussed in the following section.
- Other example frameworks include ten biogeographic zones, 20 water basins, and 24 land-use categories. The last category is too fragmented to define clear airsheds.
3.3. Proposed Regional Airshed Framework for India
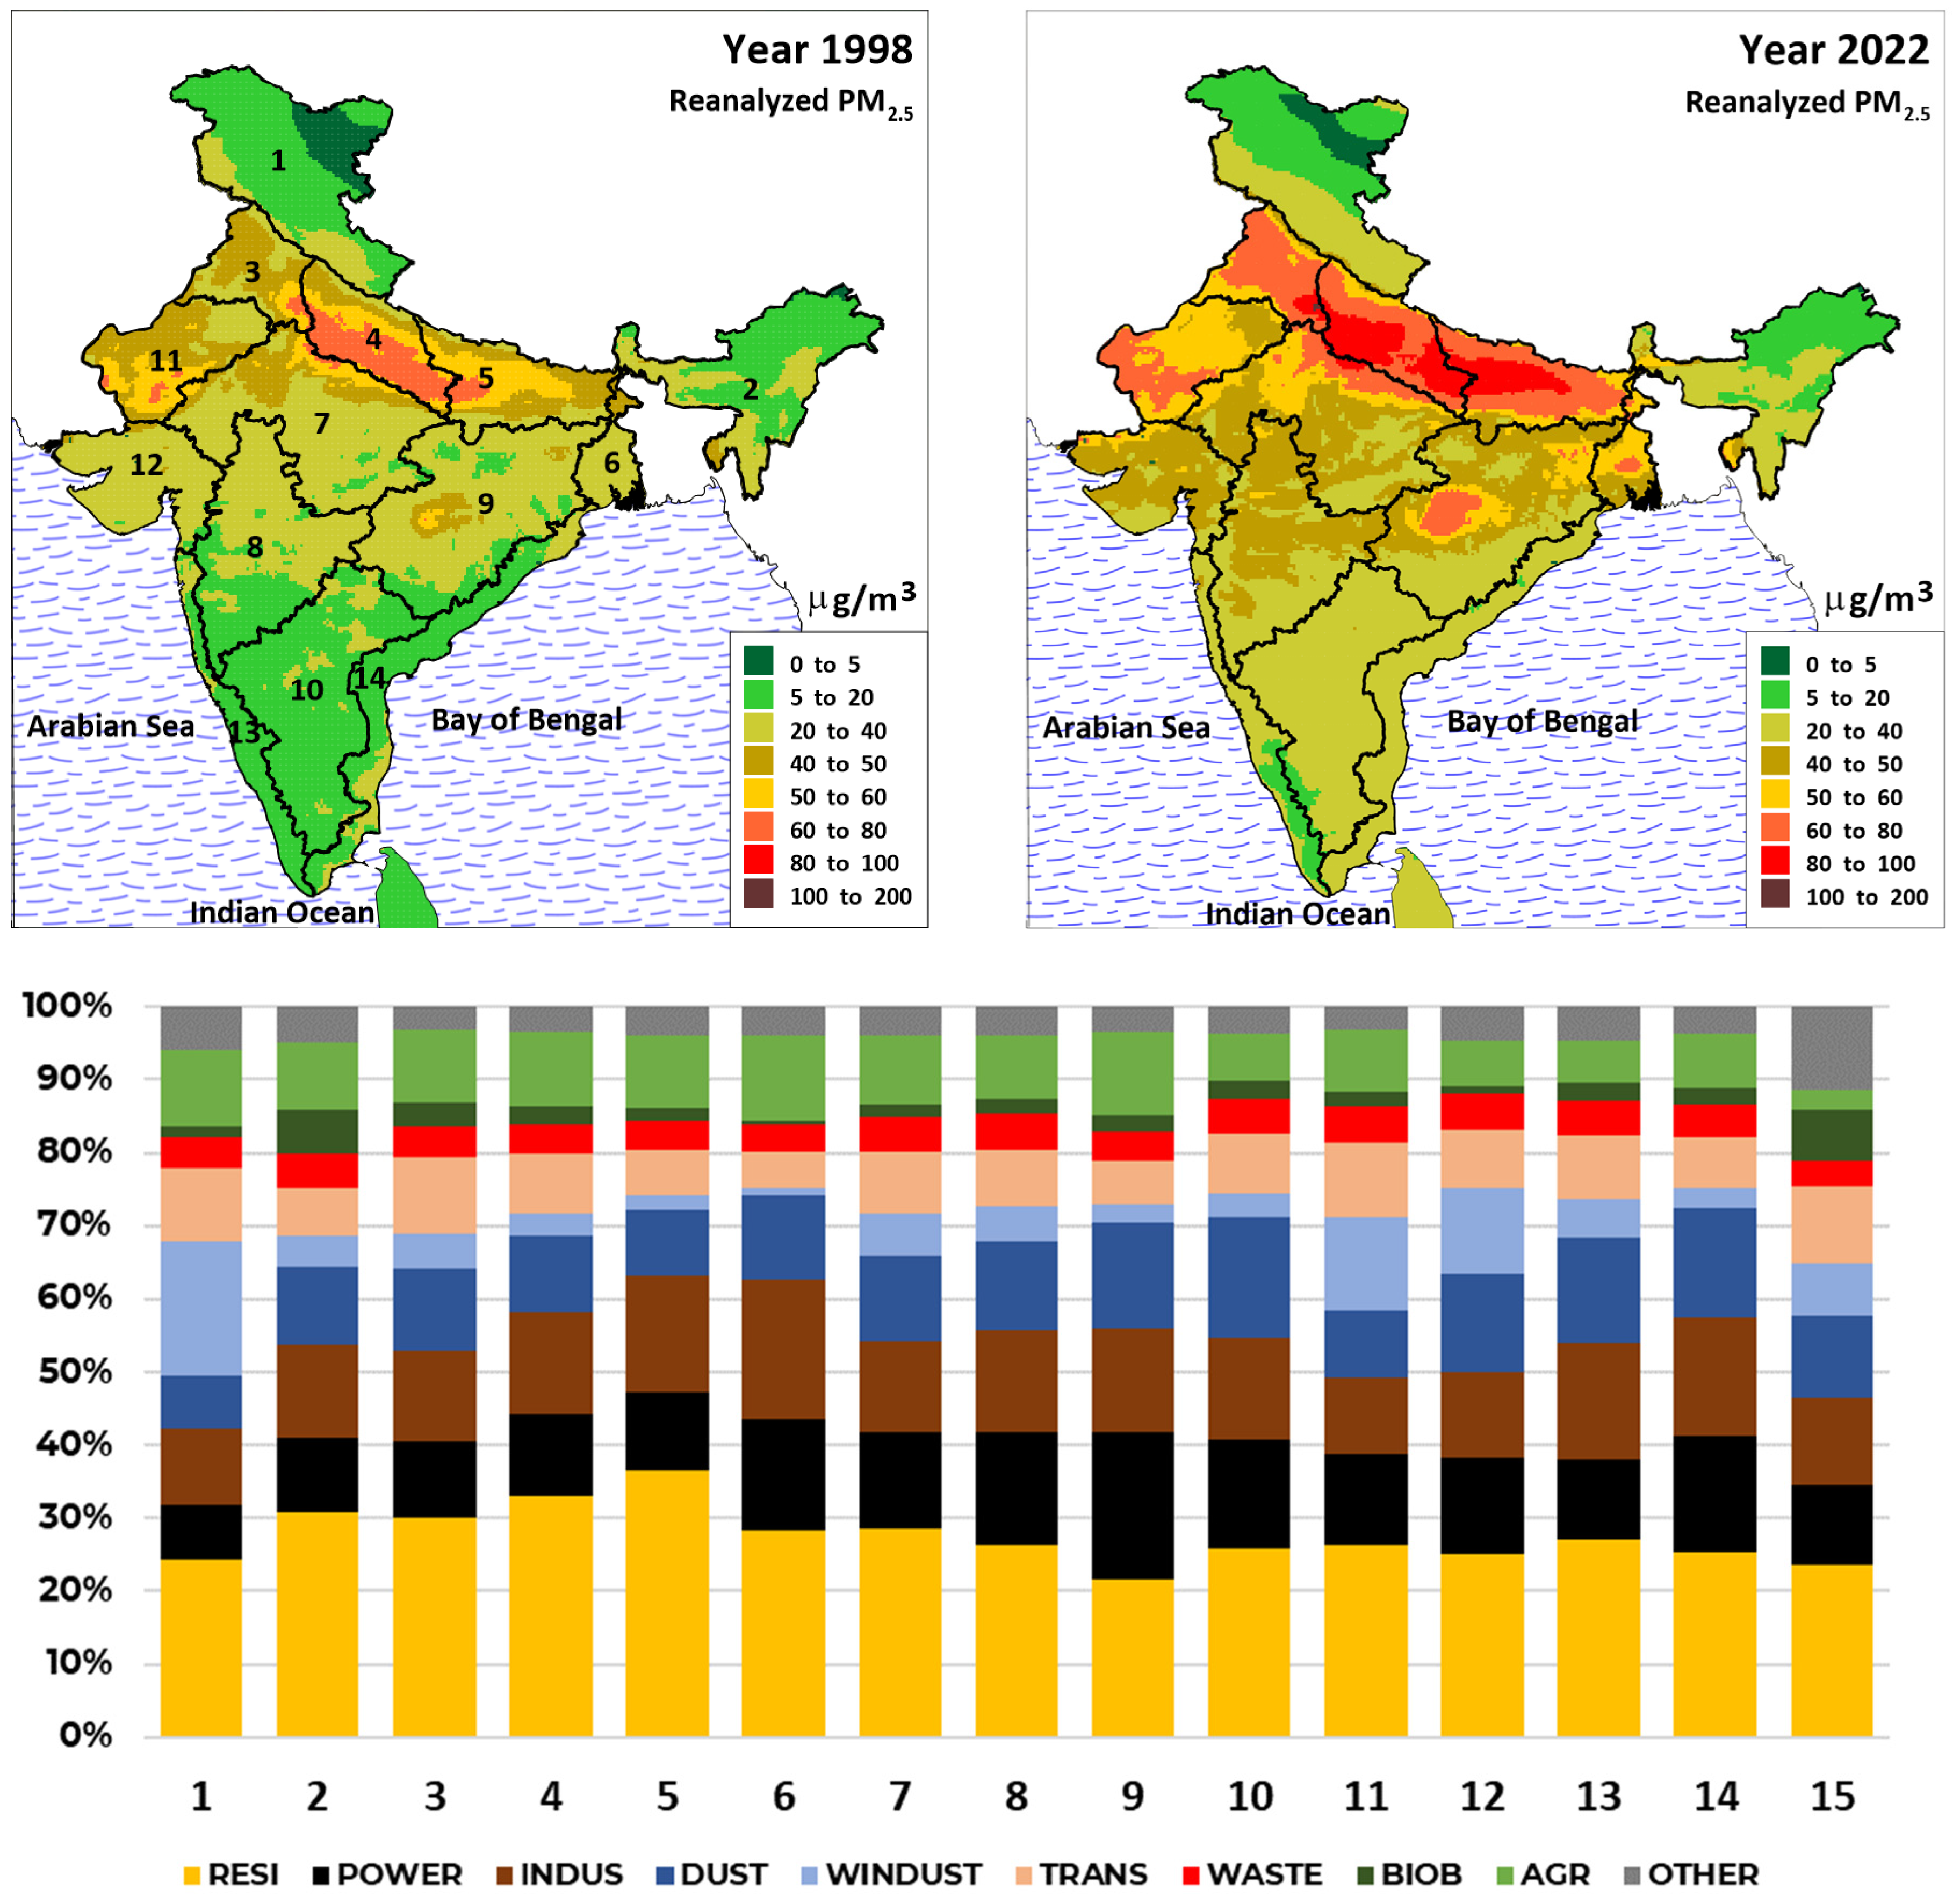
- The Gangetic Plains continue to be the most polluted. The IGP is the most populated region of India (and the Indian Subcontinent), also representing a large emission footprint from residential cooking and heating (especially during the winter months), power plants, and other large point sources, a large cluster of brick kilns (to meet the growing construction demand), open waste burning, dust, and vehicles supporting passenger and freight movement.
- The Plateau region between the Eastern and the Western Ghats (mountain ranges), the second most populated block in India, experienced the largest increase in the annual PM2.5 pollution averages. This is an indication of the growing urbanization and delated demand for transport, industrial, and commercial amenities.
- The Coastal block is crucial for industrial economy and an increase in the annual averages here, despite the benefits of land–sea breeze, is an indication of growing shipping emissions and overall growth in the emissions and pollution levels at most of the coastal cities—Mundra, Surat, Mumbai, Goa, Mangalore, Kochi, Thiruvananthapuram, Chennai, Visakhapatnam, Paradip, and Haldia.
- The Arid/Desert region’s high annual averages for PM pollution are due to wind erosion, a natural emission zone.
- The Himalayan block and islands are the cleanest, compared to the national standard, only as an average. The urban settlements like Jammu, Dehradun, Guwahati, and other state capital cities experience averages above the standards.

4. Conclusions
4.1. Need for a Centralized National-Scale Assessment System
4.2. Who Is Involved in Managing Urban and Regional Airsheds?
4.3. What Is the Target Pollutant?
4.4. Modeling Airshed Contributions
4.5. Need for Indian Subcontinent-Scale Assessment System
Supplementary Materials
Funding
Institutional Review Board Statement
Informed Consent Statement
Data Availability Statement
Acknowledgments
Conflicts of Interest
References
- Fowler, D.; Brimblecombe, P.; Burrows, J.; Heal, M.R.; Grennfelt, P.; Stevenson, D.S.; Jowett, A.; Nemitz, E.; Coyle, M.; Liu, X.; et al. A chronology of global air quality. Philos. Trans. R. Soc. A Math. Phys. Eng. Sci. 2020, 378, 20190314. [Google Scholar] [CrossRef] [PubMed]
- Sokhi, R.S.; Moussiopoulos, N.; Baklanov, A.; Bartzis, J.; Coll, I.; Finardi, S.; Friedrich, R.; Geels, C.; Grönholm, T.; Halenka, T. Advances in air quality research–current and emerging challenges. Atmos. Chem. Phys. Discuss. 2021, 22, 4615–4703. [Google Scholar] [CrossRef]
- Khan, A.A.; Kumar, P.; Gulia, S.; Khare, M. A critical review of managing air pollution through airshed approach. Sustain. Horiz. 2024, 9, 100090. [Google Scholar] [CrossRef]
- Jacob, D.J.; Crawford, J.H.; Kleb, M.M.; Connors, V.S.; Bendura, R.J.; Raper, J.L.; Sachse, G.W.; Gille, J.C.; Emmons, L.; Heald, C.L. Transport and Chemical Evolution over the Pacific (TRACE-P) aircraft mission: Design, execution, and first results. J. Geophys. Res. Atmos. 2003, 108. [Google Scholar] [CrossRef]
- Wang, L.; Zhang, F.; Pilot, E.; Yu, J.; Nie, C.; Holdaway, J.; Yang, L.; Li, Y.; Wang, W.; Vardoulakis, S.; et al. Taking Action on Air Pollution Control in the Beijing-Tianjin-Hebei (BTH) Region: Progress, Challenges and Opportunities. Int. J. Environ. Res. Public Health 2018, 15, 306. [Google Scholar] [CrossRef] [PubMed]
- Gardiner, B. Choked: Life and Breath in the Age of Air Pollution; University of Chicago Press: Chicago, IL, USA, 2019. [Google Scholar]
- Guttikunda, S.K.; Nishadh, K.A.; Jawahar, P. Air pollution knowledge assessments (APnA) for 20 Indian cities. Urban Clim. 2019, 27, 124–141. [Google Scholar] [CrossRef]
- Gu, Y.; Fang, T.; Yim, S.H.L. Source emission contributions to particulate matter and ozone, and their health impacts in Southeast Asia. Environ. Int. 2024, 186, 108578. [Google Scholar] [CrossRef]
- CPCB. National Clean Air Programme (NCAP), Portal for Regulation of Air-pollution in Non-Attainment Cities (PRANA). Available online: https://prana.cpcb.gov.in (accessed on 1 May 2024).
- Guttikunda, S.; Ka, N.; Ganguly, T.; Jawahar, P. Plugging the ambient air monitoring gaps in India’s national clean air programme (NCAP) airsheds. Atmos. Environ. 2023, 301, 119712. [Google Scholar] [CrossRef]
- van Donkelaar, A.; Hammer, M.S.; Bindle, L.; Brauer, M.; Brook, J.R.; Garay, M.J.; Hsu, N.C.; Kalashnikova, O.V.; Kahn, R.A.; Lee, C.; et al. Monthly Global Estimates of Fine Particulate Matter and Their Uncertainty. Environ. Sci. Technol. 2021, 55, 15287–15300. [Google Scholar] [CrossRef]
- Sims, K.; Reith, A.; Bright, E.; Kaufman, J.; Pyle, J.; Epting, J.; Gonzales, J.; Adams, D.; Powell, E.; Urban, M.; et al. LandScan Global 2022; Oak Ridge National Laboratory: Oak Ridge, TN, USA, 2023.
- Hammer, M.S.; van Donkelaar, A.; Li, C.; Lyapustin, A.; Sayer, A.M.; Hsu, N.C.; Levy, R.C.; Garay, M.J.; Kalashnikova, O.V.; Kahn, R.A.; et al. Global Estimates and Long-Term Trends of Fine Particulate Matter Concentrations (1998–2018). Environ. Sci. Technol. 2020, 54, 7879–7890. [Google Scholar] [CrossRef]
- Guttikunda, S.; Ka, N. Evolution of India’s PM2.5 pollution between 1998 and 2020 using global reanalysis fields coupled with satellite observations and fuel consumption patterns. Environ. Sci. Atmos. 2022, 2, 1502–1515. [Google Scholar] [CrossRef]
- Chatterjee, D.; McDuffie, E.E.; Smith, S.J.; Bindle, L.; van Donkelaar, A.; Hammer, M.S.; Venkataraman, C.; Brauer, M.; Martin, R.V. Source Contributions to Fine Particulate Matter and Attributable Mortality in India and the Surrounding Region. Environ. Sci. Technol. 2023, 57, 10263–10275. [Google Scholar] [CrossRef] [PubMed]
- McDuffie, E.E.; Martin, R.V.; Spadaro, J.V.; Burnett, R.; Smith, S.J.; O’Rourke, P.; Hammer, M.S.; van Donkelaar, A.; Bindle, L.; Shah, V.; et al. Source sector and fuel contributions to ambient PM2.5 and attributable mortality across multiple spatial scales. Nat. Commun. 2021, 12, 3594. [Google Scholar] [CrossRef] [PubMed]
- Gao, M.; Gao, J.; Zhu, B.; Kumar, R.; Lu, X.; Song, S.; Zhang, Y.; Jia, B.; Wang, P.; Beig, G. Ozone pollution over China and India: Seasonality and sources. Atmos. Chem. Phys. 2020, 20, 4399–4414. [Google Scholar] [CrossRef]


| Airshed | Airshed | Major | Percent | Percent | PM2.5 Average (μg/m3) | ||
|---|---|---|---|---|---|---|---|
| Code | Name | Urban Center | Landmass | Pop 2021 | 1998 | 2022 | % Increase |
| 1 | Western Himalayas | Dehradun | 11.0% | 2.9% | 12.3 | 16.6 | 35% |
| 2 | Eastern Himalayas | Guwahati | 9.1% | 4.9% | 17.9 | 22.1 | 24% |
| 3 | Trans Gangetic Plain | Delhi | 4.0% | 7.3% | 42.3 | 63.8 | 51% |
| 4 | Upper Gangetic Plain | Kanpur | 4.1% | 10.0% | 56.1 | 75.8 | 35% |
| 5 | Middle Gangetic Plain | Patna | 5.5% | 15.7% | 46.4 | 68.5 | 48% |
| 6 | Lower Gangetic Plain | Kolkata | 2.4% | 7.5% | 32.9 | 51.0 | 55% |
| 7 | Central Plateau | Indore | 11.3% | 10.0% | 33.6 | 47.9 | 42% |
| 8 | Western Plateau | Nagpur | 9.1% | 7.7% | 21.4 | 40.0 | 87% |
| 9 | Eastern Plateau | Raipur | 11.3% | 9.2% | 27.2 | 43.0 | 58% |
| 10 | Southern Plateau | Bengaluru | 10.0% | 9.6% | 16.4 | 27.5 | 68% |
| 11 | Arid Desert | Jaipur | 5.2% | 2.9% | 45.5 | 57.0 | 25% |
| 12 | Gujarat Coast and Plains | Ahmedabad | 5.6% | 5.4% | 31.0 | 42.2 | 36% |
| 13 | West Coast | Mumbai | 3.8% | 4.2% | 13.0 | 23.7 | 83% |
| 14 | East Coast | Chennai | 6.8% | 2.9% | 17.2 | 26.4 | 53% |
| 15 | Islands | -- | 0.7% | 0.001% | 8.3 | 9.1 | 9% |
Disclaimer/Publisher’s Note: The statements, opinions and data contained in all publications are solely those of the individual author(s) and contributor(s) and not of MDPI and/or the editor(s). MDPI and/or the editor(s) disclaim responsibility for any injury to people or property resulting from any ideas, methods, instructions or products referred to in the content. |
© 2024 by the author. Licensee MDPI, Basel, Switzerland. This article is an open access article distributed under the terms and conditions of the Creative Commons Attribution (CC BY) license (https://creativecommons.org/licenses/by/4.0/).
Share and Cite
Guttikunda, S.K. Designating Airsheds in India for Urban and Regional Air Quality Management. Air 2024, 2, 247-257. https://doi.org/10.3390/air2030015
Guttikunda SK. Designating Airsheds in India for Urban and Regional Air Quality Management. Air. 2024; 2(3):247-257. https://doi.org/10.3390/air2030015
Chicago/Turabian StyleGuttikunda, Sarath K. 2024. "Designating Airsheds in India for Urban and Regional Air Quality Management" Air 2, no. 3: 247-257. https://doi.org/10.3390/air2030015
APA StyleGuttikunda, S. K. (2024). Designating Airsheds in India for Urban and Regional Air Quality Management. Air, 2(3), 247-257. https://doi.org/10.3390/air2030015


