Article

Saharan Dust Contributions to PM10 Levels in Hungary

HungaroMet, Kitaibel 1, H-1024 Budapest, Hungary
*
Author to whom correspondence should be addressed.
Air 2024, 2(3), 325-336; https://doi.org/10.3390/air2030019
Submission received: 15 July 2024 / Revised: 30 August 2024 / Accepted: 2 September 2024 / Published: 5 September 2024

Abstract

:
There are meteorological situations when huge amounts of Saharan dust are transported from Africa to Europe. These natural dust events may have a significant impact on particulate matter concentrations at monitoring sites. This phenomenon affects mainly the countries in Southern Europe; however, some strong advections can bring Saharan dust to higher latitudes too. The number of Saharan dust events in the Carpathian Basin is believed to increase due to the changing patterns in the atmospheric circulation over the Northern Hemisphere’s mid-latitudes. The jet stream becomes more meandering if the temperature difference between the Arctic areas and the lower latitudes decreases. This favours the northward transport of the North African dust. The European regulation makes it possible to subtract the concentration of Saharan-originated aerosol from the measured PM10 concentration. This manuscript describes the methodology used by the HungaroMet to calculate the amount of natural dust contributing to measured PM10 concentrations.

1. Introduction

Mineral dust emissions from arid and semiarid regions are crucial to the Earth’s atmospheric dynamics and have extensive effects on climate, air quality, and ecosystems [1], as well as on photovoltaic energy generation [2]. The primary source areas for dust are situated in the subtropical latitudes of the Northern Hemisphere, stretching from the West coast of North Africa and the Middle East to Central and South Asia, reaching as far as China [3]. Among these regions, North African dust hotspots, particularly in the Sahara Desert, make a significant contribution to the global mineral dust budget. Air masses rich in dust from these hotspots can be transported over long distances [4], extending thousands of kilometres across continents and oceans. These dust plumes are frequently carried by atmospheric circulation patterns, such as the Saharan Air Layer, and can affect distant areas, including North and South America, Europe, and the Middle East. Although this phenomenon primarily impacts countries in Southern Europe, strong advection events can also transport Saharan dust to higher latitudes [5]. Dust outbreaks can notably elevate ambient PM levels recorded by air quality monitoring networks [6,7,8]. This is especially relevant in Southern Europe but in the last decade, it has occurred more often in the area of the Carpathian Basin [9].
Air quality monitoring networks play a crucial role in assessing and managing ambient air pollution levels [10]. However, dust outbreaks present challenges for air quality in general and for human health in particular, as they can lead to abrupt spikes in PM concentrations that exceed regulatory standards and guidelines. Monitoring stations may register temporary breaches in PM levels during dust events [11,12], triggering alerts and necessitating immediate response measures to mitigate health risks and inform the public about potential hazards associated with poor air quality conditions.
The 2008 ambient air quality directive (2008/50/CE European directive) [13] sets limits for concentrations of major air pollutants in ambient air. The daily limit value for PM10 is currently 50 µg/m3 (which can be exceeded up to 35 times a year). Each country of the European Union has reporting obligations. The Commission may start infringement procedures against countries that fail to meet the requirements of air quality. In several locations in Hungary, there are exceedances of the limit values of PM10. The main source of particulate matter pollution in Hungary is residential heating [14]. The highest concentrations occur during the heating season. Besides the anthropogenic emissions, the meteorological situation and the activity of natural sources also contribute to the evolution of the PM10 concentrations over a year. The purpose of quantifying the natural contribution to PM10 is to keep only those exceedances that are under the control of the country.
There are meteorological situations when huge amounts of Saharan dust are transported from Africa to Europe. The number of Saharan dust events in the Carpathian Basin is believed to increase due to the changing patterns in the atmospheric circulation over the Northern Hemisphere’s mid-latitudes [15]. The jet stream becomes more meandering if the temperature difference between the Arctic areas and the lower latitudes decreases. This favours the northward transport of the North African dust [9]. The crustal load within PM10 generally corresponds to the amount of dust during an episode. However, measurements of the chemical composition of PM10, especially crustal components (Ca, Mg, Fe, Si, K), are sparse. Estimating the amount of desert dust based on different techniques (using measured or modelled concentrations) is therefore a beneficial task when subtracting the natural contribution from the PM10 values. The FAIRMODE (https://fairmode.jrc.ec.europa.eu/ accessed on 15 July 2024) community was launched in 2007 to facilitate cooperation and exchange of experience between air quality modelling experts. FAIRMODE is divided into working groups dealing with different areas of modelling, such as assessment, source apportionment, planning, and emissions. FAIRMODE aims to promote harmonised air quality modelling across Europe. The common CAMS (Copernicus Atmosphere Monitoring Service)—FAIRMODE (Forum for Air Quality Modeling in Europe) WG8 (Working Group 8) exercise was a collaborative effort aimed at enhancing the use of CAMS dust modelling products. The primary focus of the joint dust exercise was on understanding and managing natural contributions to air quality exceedances, particularly in the context of the Ambient Air Quality Directive. The first objective of the exercise was to establish best practices for utilising CAMS dust modelling products in the assessment of natural contributions to air quality exceedances. The second objective was to prepare recommendations for the inclusion of reference to CAMS dust products in a possible revision of the air quality directives guidelines for the deduction of natural contributions to exceedances.
Calculating the dust contribution to air quality measurements is essential for accurately assessing exceedances of air quality standards, particularly for particulate matter (PM) concentrations. Various methods can be employed to estimate the contribution of natural dust to air quality measurements. Each method has its strengths and limitations, and the choice of method depends on the specific context and available data. Studies on the impact of Saharan dust on PM10 concentrations in the Mediterranean countries have a longer history, as this is the region most affected by dust advection [16,17]. In general, it can be said that measurement-based methods are most commonly used to separate desert dust loads within PM10. The European Commission has prepared a document with recommendations for identifying desert dust storm episodes and quantifying the dust load [18]. This method serves as a reference for the EU policy and is based on a previous extensive study by Escudero and colleagues [19]. The methodology consists of using different model results (dust simulations from chemical transport models, HYSPLIT backward trajectories) and meteorological information (satellite images, sea-level distribution maps) to select the episode situations, and then applying a statistical methodology to quantify the amount of dust using PM10 time series measured at regional background stations. This method relies on calculating the 30-day moving 40th percentile value (or 50th percentile value as in the EU recommendation) of the PM10 values after excluding the data corresponding to the dust episode days. This 40th percentile value, as a regional background, can be subtracted from the daily PM10 concentration measured at monitoring sites during the dust period to obtain the dust load at the given site. The method is sensitive to the selection of episode days, the length of the window, the threshold for the percentile calculation, and the choice of the regional background site. The chosen site should also be representative of the atmospheric transport process valid at the other concerned sites. This methodology, recommended by the European Commission, has been used in several studies. Querol and colleagues [17] evaluated the impact of natural dust on PM2.5 and PM10 concentrations across Spain during 2001–2016. Cuspilici and colleagues [7] studied how Saharan dust storm events affected the number of daily PM10 exceedances over Sicily between 2013 and 2015. Lotrecchiano and colleagues [20] also used the EU method for quantifying the amount of dust at two stations in the Campania region (Italy), pointing out that in urban environments, the calculation of the PM2.5/PM10 ratio is a good indicator of the presence of Saharan dust in the atmosphere. Tel Aviv University has also developed a method based on PM10 measurements to determine the amount of desert dust within PM10. According to their method, an episode situation is caused by desert dust when the half-hour PM10 average is above 100 µg/m3, this level is maintained for at least 3 h and the maximum concentration measured is above 180 µg/m3 [21]. The dust contribution is calculated as the difference between the average PM10 for the full time period and the average PM10 without the half-hours of the dust storm. This method works with hourly measurements and thus has the potential to mistakenly interpret PM increments from local dust sources as dust events. Viana and colleagues [22] compared the Tel Aviv University method with the European Commission method and with the results of a Positive Matrix Factorisation (PMF) receptor model at three monitoring sites in Spain. They found that the results of the Tel Aviv University method and the European Commission method were in relatively good agreement (R2 = 0.58) and that the PMF dust contribution was relatively high. In addition to the PMF modelling technique, which calculates the contribution of different sources to total PM10 concentrations, there are other models that can quantify the amount of dust during an episode situation. Gonzalez-Calvo and colleagues [23] estimated the concentrations of Saharan dust in the Canary Islands through the use of artificial neural networks. One of the most widely used regional dust models in the Mediterranean is DREAM [24]. It calculates the total dust amount for the entire atmospheric column and the total dust concentration in the first model layer. Petroselli and colleagues [16] analysed the decadal trends in the Saharan dust transport at a rural regional background station. They used the EU methodology, the results of the DREAM model and a method specifically developed for Central Italy (DIAPASON) [25,26]. By integrating multiple approaches, a more comprehensive and reliable assessment of dust contributions can be achieved, which is essential for effective air quality management and regulatory compliance.
The present study aims to describe the methodology used by the Hungarian Meteorological Service to calculate the amount of natural dust contributing to measured PM10 concentrations. We aim to produce time series at the monitoring stations that are free from natural contributions and can be reported within the framework of the ambient air quality directive.

2. Materials and Methods

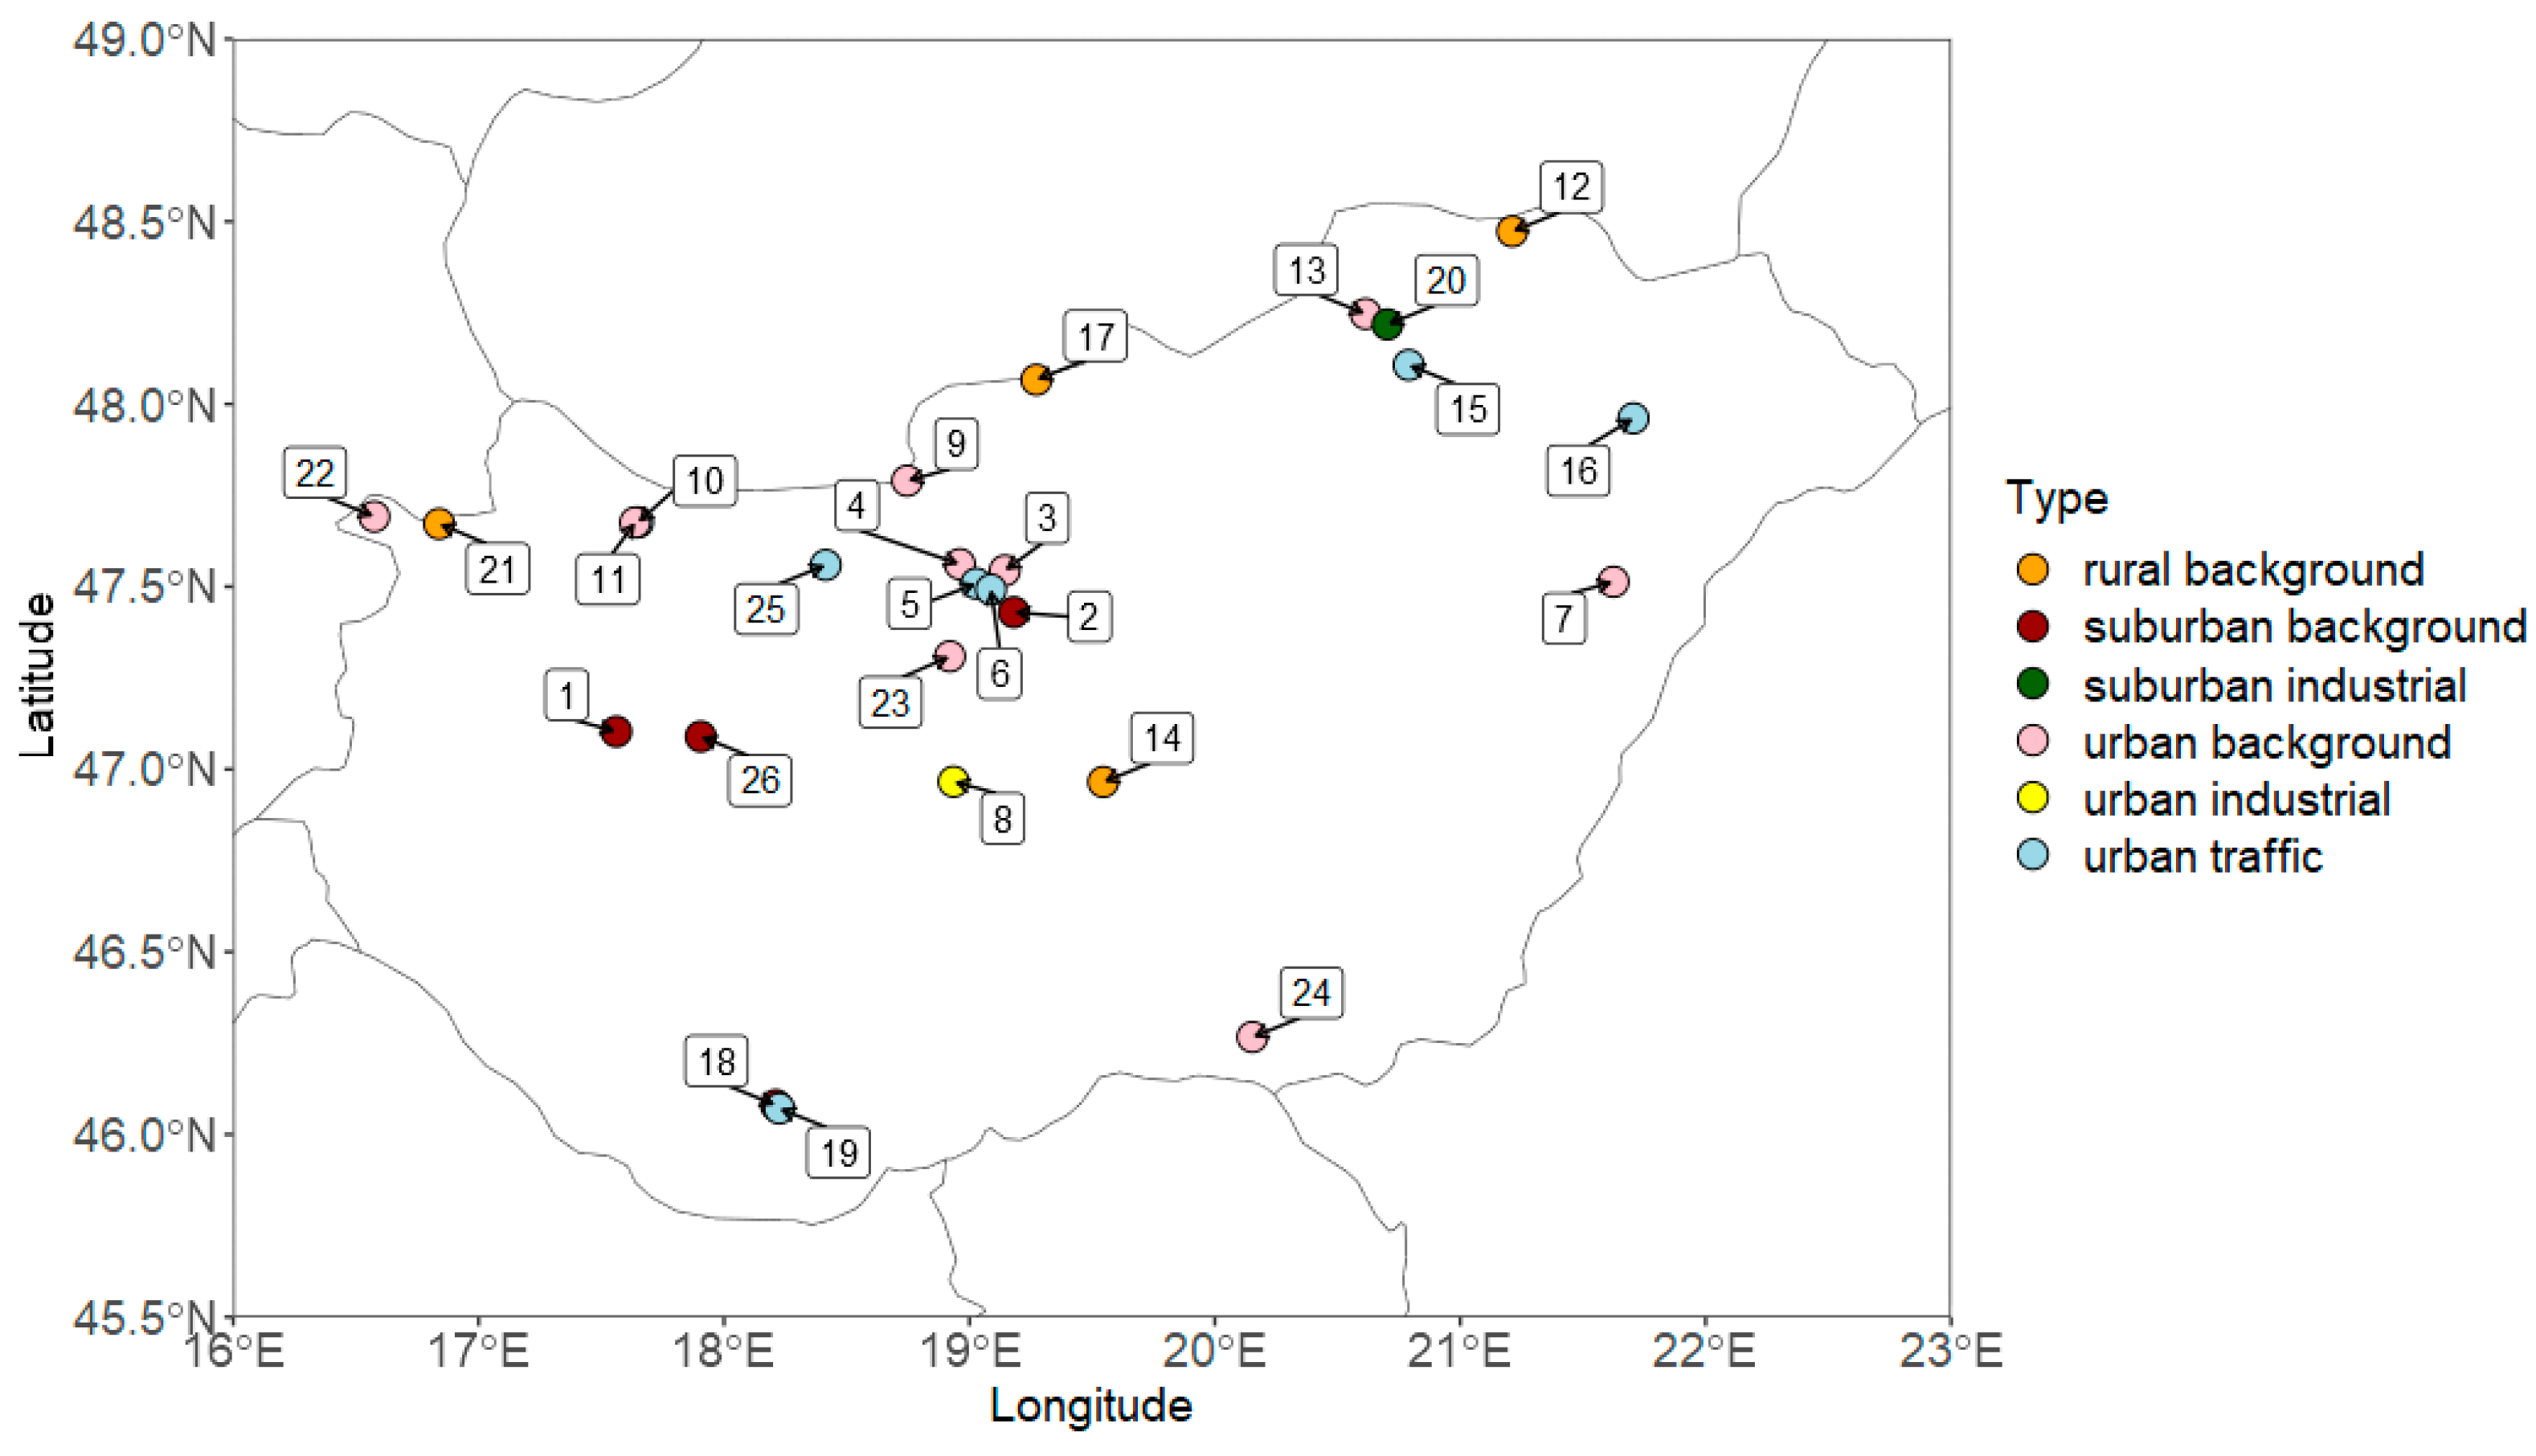
2.1. Air Quality Monitoring Data

The PM10 data that are used in this analysis are based on data from the Air Quality Monitoring Network of Hungary. The Monitoring Network is a comprehensive system established to detect air quality across Hungary. The network has been managed by HungaroMet, Hungarian Meteorological Service since 2024. The network aims to provide accurate and up-to-date information on the levels of various pollutants in the air, contributing to environmental protection and public health in Hungary. The network comprises several monitoring stations considered well-placed throughout the country. These stations are equipped with advanced instruments that continuously measure the concentrations of key air pollutants, including PM10 and PM2.5, O3, SO2, NO2 and CO. Calibration procedures and measurements of standards are used for air data quality control. The instruments and measurement methods fulfil the requirements of the EU standards. The monitoring stations collect data continuously, which are then transmitted to the central database. These data are processed and analysed to assess air quality levels, identify trends, and detect any exceedances of air quality standards. The information is made available to the public through various platforms (https://legszennyezettseg.met.hu/ accessed on 15 July 2024).
There are currently 26 sites in Hungary that provide PM10 measurements for international reporting. Figure 1 shows the location of the PM10 stations of the Hungarian Air Quality Monitoring Network. The colour of the dots indicates the station types. Unfortunately, chemical composition measurements of PM10 are not performed at these stations, which does not allow for a direct comparison of the dust fraction with measurements.

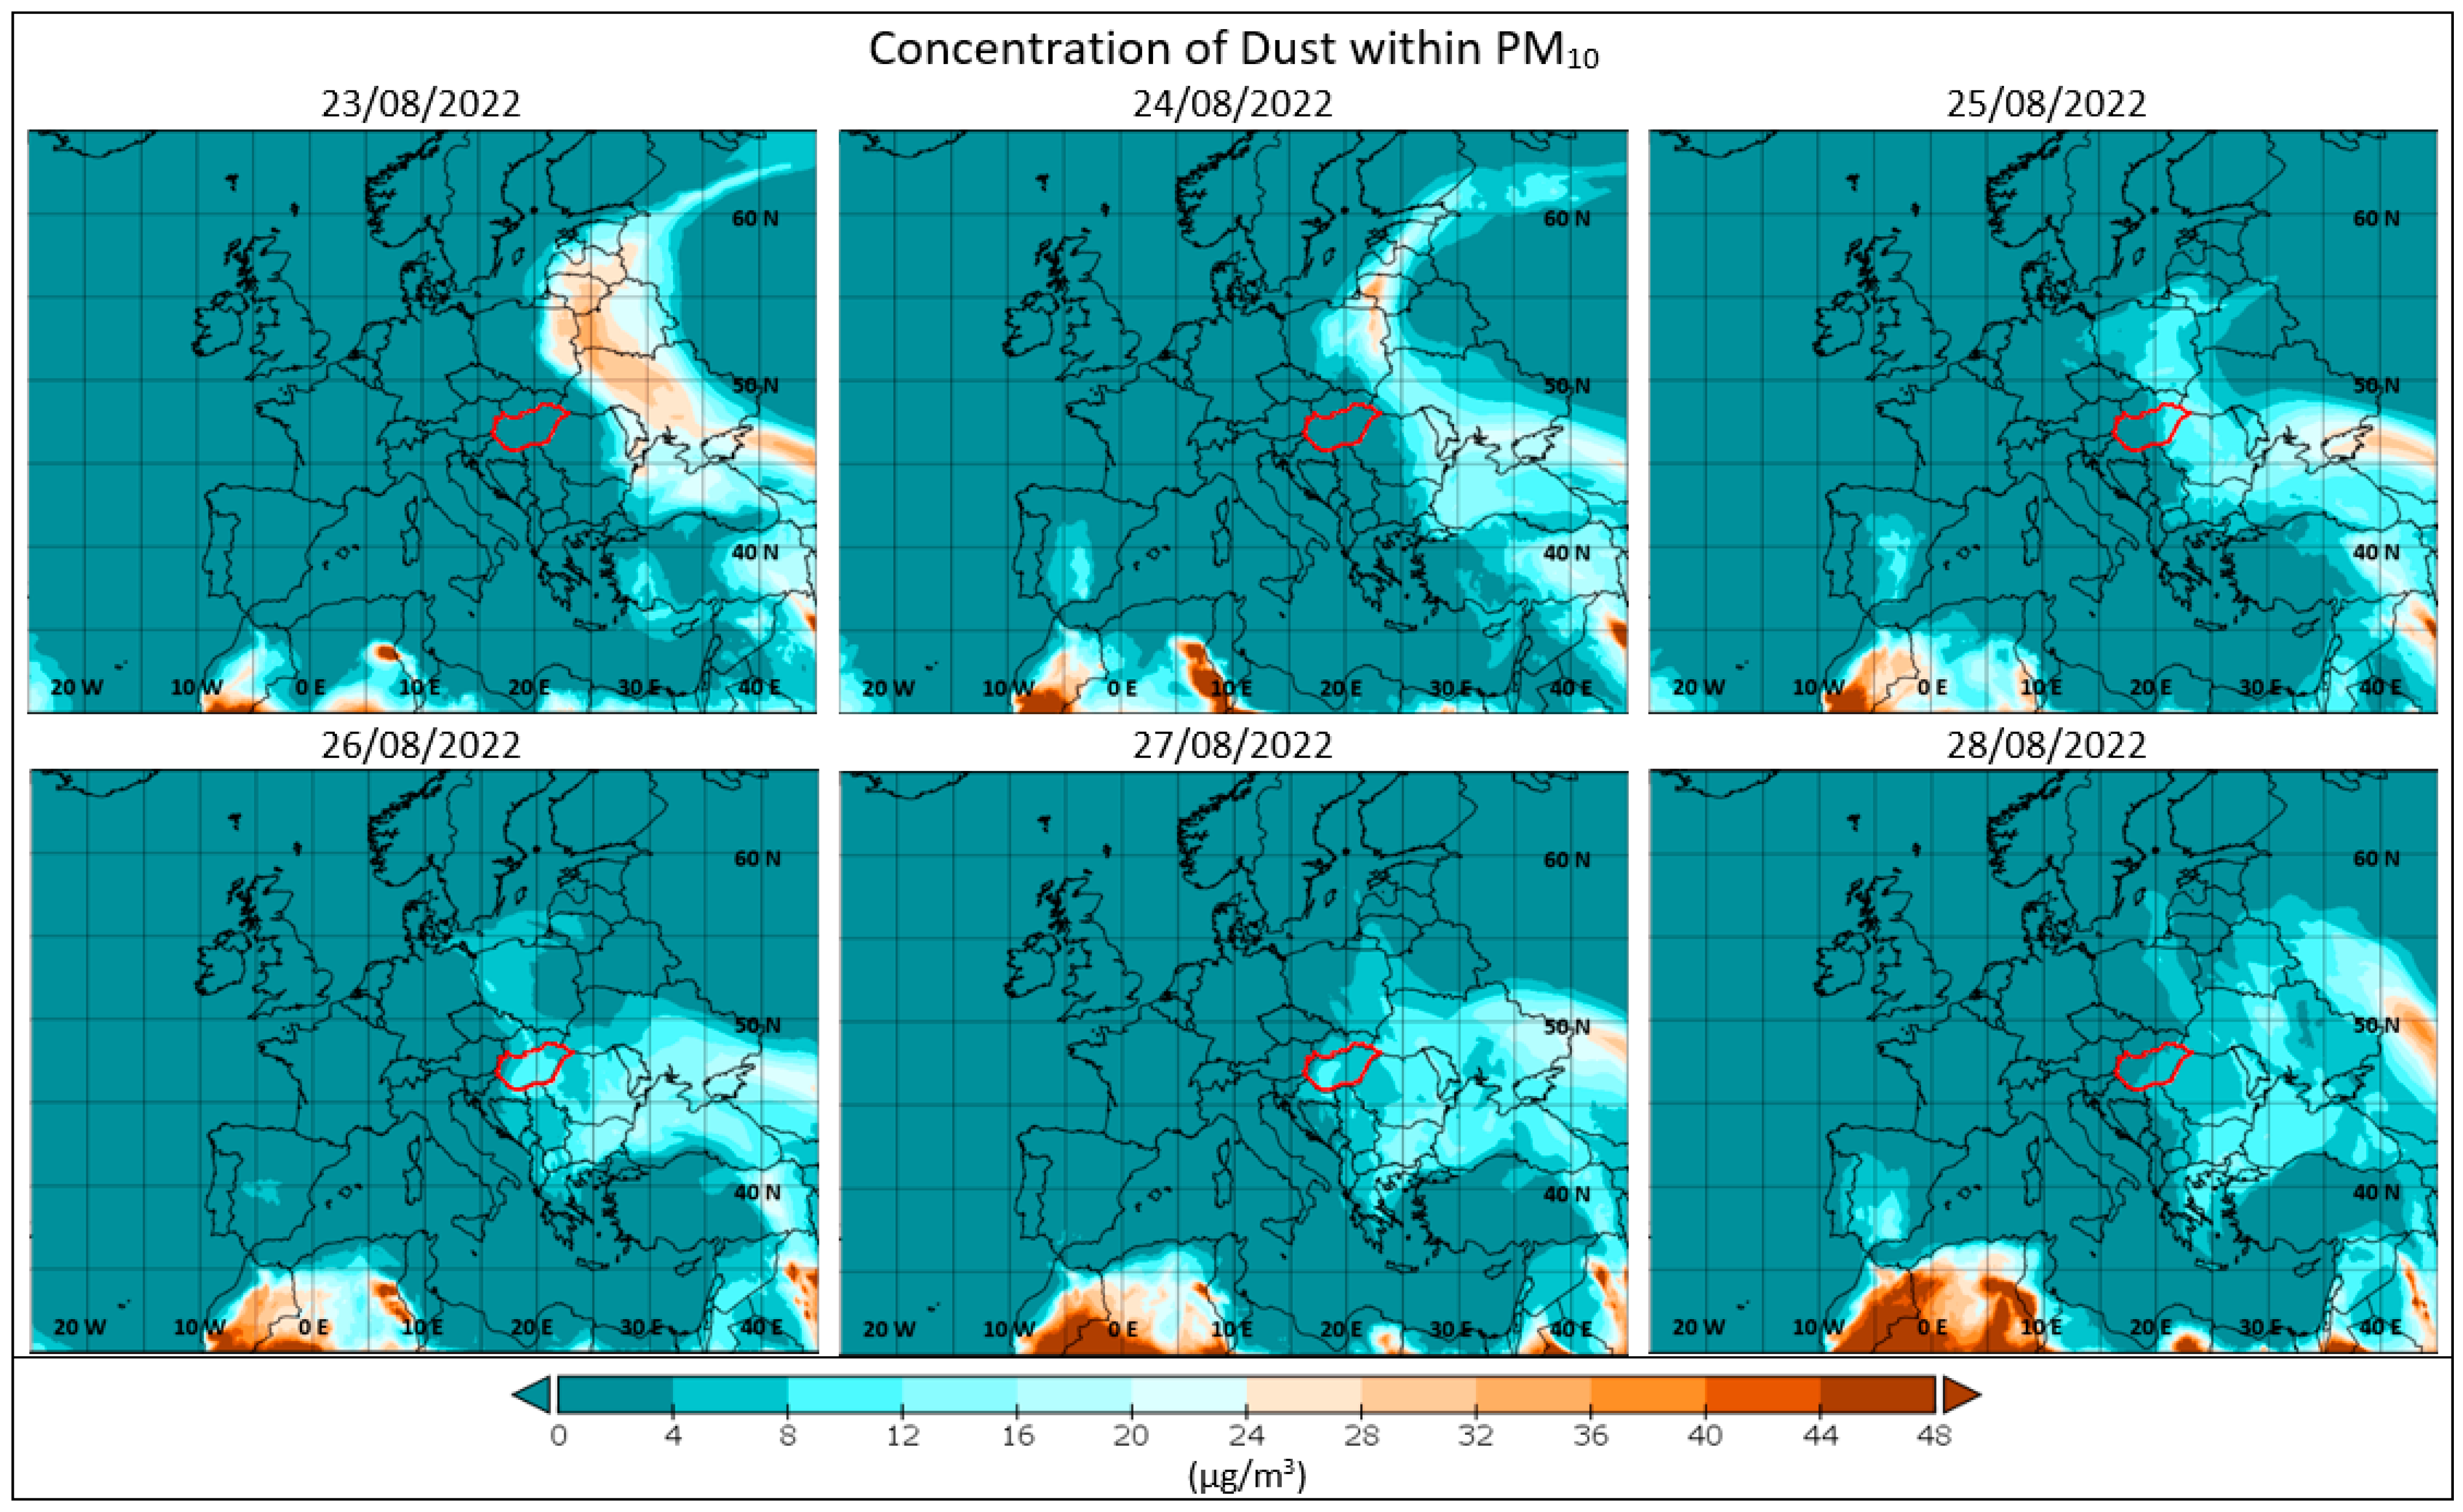
2.2. CAMS Model Results

The main database for calculating the natural dust contribution to the measured PM10 concentrations is the CAMS European Interim Reanalysis data [27]. This dataset provides annual air quality reanalyses for Europe based on both unvalidated (interim) and validated observations for the European domain at the spatial resolution of 0.1 degrees. The production is currently based on an ensemble of eleven air quality models with data assimilation systems across Europe. A median ensemble is calculated from individual outputs since ensemble products yield on average better performance than the individual model products. The spread between the eleven models can be used to provide an estimate of the analysis uncertainty. An interim reanalysis is provided each year for the year before based on the unvalidated near-real-time observation data stream that has not undergone full quality control by the data providers yet. Once the fully quality-controlled observations are available from the data provider, typically with an additional delay of about 1 year, a final validated annual reanalysis is provided. Both reanalyses are available at hourly time steps at different levels.
This gridded dataset contains reliable information to describe the air quality situation in Europe over a year. We can easily access and download the reanalysis data from the Atmosphere Data Store. For our work, we need the hourly concentration data of the particulate matter < 10 µm (PM10) and the PM10 dust fraction variables for a whole year. We selected the year 2022 to develop the methodology. The dataset has a 0.1° × 0.1° (approximately 10 km × 10 km) horizontal resolution and although the concentrations are given at different height levels, we only retrieved the surface data. We have chosen the time series of dust fraction and PM10 at the nearest grid cell to each monitoring site.

2.3. The Formula for Calculating the Dust Contribution to Measurements

The dust fraction within the PM10 is available in the CAMS Interim Reanalysis datasets. However, this value comes from modelled data (an ensemble of models), and we would like to deduct the natural part from the PM10 measurements. The dust reanalysis information approximates the real amount of dust in the atmosphere. It is possible that there is a bias in the CAMS model calculations, so it is not recommended to subtract the “raw” dust reanalysis concentration from the measurements. We assume that the same bias applies to the dust fraction within PM10 as to the total PM10 concentration. We correct the CAMS dust component for bias and use this corrected value for deducting the natural Saharan dust contribution from the observed PM10 concentrations.
We work with the daily average concentrations of dust fraction and PM10 reanalysis and measured data. We correct the CAMS dust fraction with the following formula:
C o r r e c t e d D u s t = R e a n a l y s i s D u s t R e a n a l y s i s P M 10 × O b s e r v e d P M 10
This formula indicates that the direction of bias between the corrected dust data and the reanalysis dust data aligns with the direction of bias between the measured PM10 and the reanalysis PM10 data. The correction is made on the daily average dust concentrations for the whole year. However, we only deduct this corrected dust value from the PM10 daily averages on the days of the dust episodes we have found in 2022, to have time series of PM10 without the natural contribution.
Considering the sensitivity of our method, the results depend on the accuracy of the CAMS data. The annual air quality reanalysis data (interim) is based on unvalidated observations; therefore, the validated reanalysis can provide more accurate information on PM10 levels. Not only the observations but also the model characteristics have an effect on the accuracy of the PM10 and PM10 dust fraction data. The different models in the CAMS system determine the amount of dust within the PM10 variously. Some of them include only the natural windblown dust, others also the traffic resuspension and agricultural dust. This makes it difficult to identify the portion of dust that came from the Sahara or other deserted areas. The results of this method are also influenced by the selection of the temporal resolution for the correction of the modelled dust values. The hourly PM10 values are more sensitive to the influence of local sources, therefore the correction of the dust fraction based on hourly PM10 data could be excessive. In the correction formula, the difference between the observed and modelled PM10 daily average is divided by the modelled average. The difference could also be normalised by the observation, but this would cause lower dust concentrations as the observed PM10 values are higher than the modelled values. Nevertheless, the expression is multiplied by the modelled dust fraction, so the correct way is to normalise the difference by the modelled PM10.

2.4. Experiences with the EU Methodology

The purpose of this paragraph is to present our main findings regarding the EU methodology. K-puszta is the only rural background station that could be considered as a regional background site adequate for the EU methodology as it has the highest spatial representativeness and does not reside over a complex terrain. The background concentration was calculated as the 30 days moving 50th percentile from the PM10 measurements. The calculated dust loads were overall higher than the dust concentrations obtained from our CAMS-based method at K-puszta. There were some days (mostly during the episode in March), during which the measured daily average PM10 was lower than the calculated background concentration. This can happen when the wrong percentile is chosen to calculate the background pollution of PM10 at the site, or if the dust days are not defined correctly. Thus, a sensitivity analysis is needed to find the best percentile value for the application of the EU methodology in the case of Hungary. However, the lower percentile value could lead to a higher dust load. In the future, chemical composition measurements are needed to validate our results. Considering the timing of the dust events, the maximum of the dust load quantified with the EU methodology did not coincide with the maximum PM10 value at other measurement sites. This highlights that more background stations are needed to provide the dust load accurately in time for different parts of the country.
The methodology presented in this article resolves the time-shift issue emerging from estimating the dust load at various sites from one background site in case of the EU methodology. The dust fraction data are formed by the modelled atmospheric transportation and are valid over a given grid cell, at a given time. For each station, the dust value is determined from the data of the grid cell closest to it. Due to the different sampling heights of the stations, the dust load calculated using the EU method may be higher than the daily PM10 average. In contrast, our correction method ensures that there are no negative concentrations after the deduction of the dust value.

3. Results

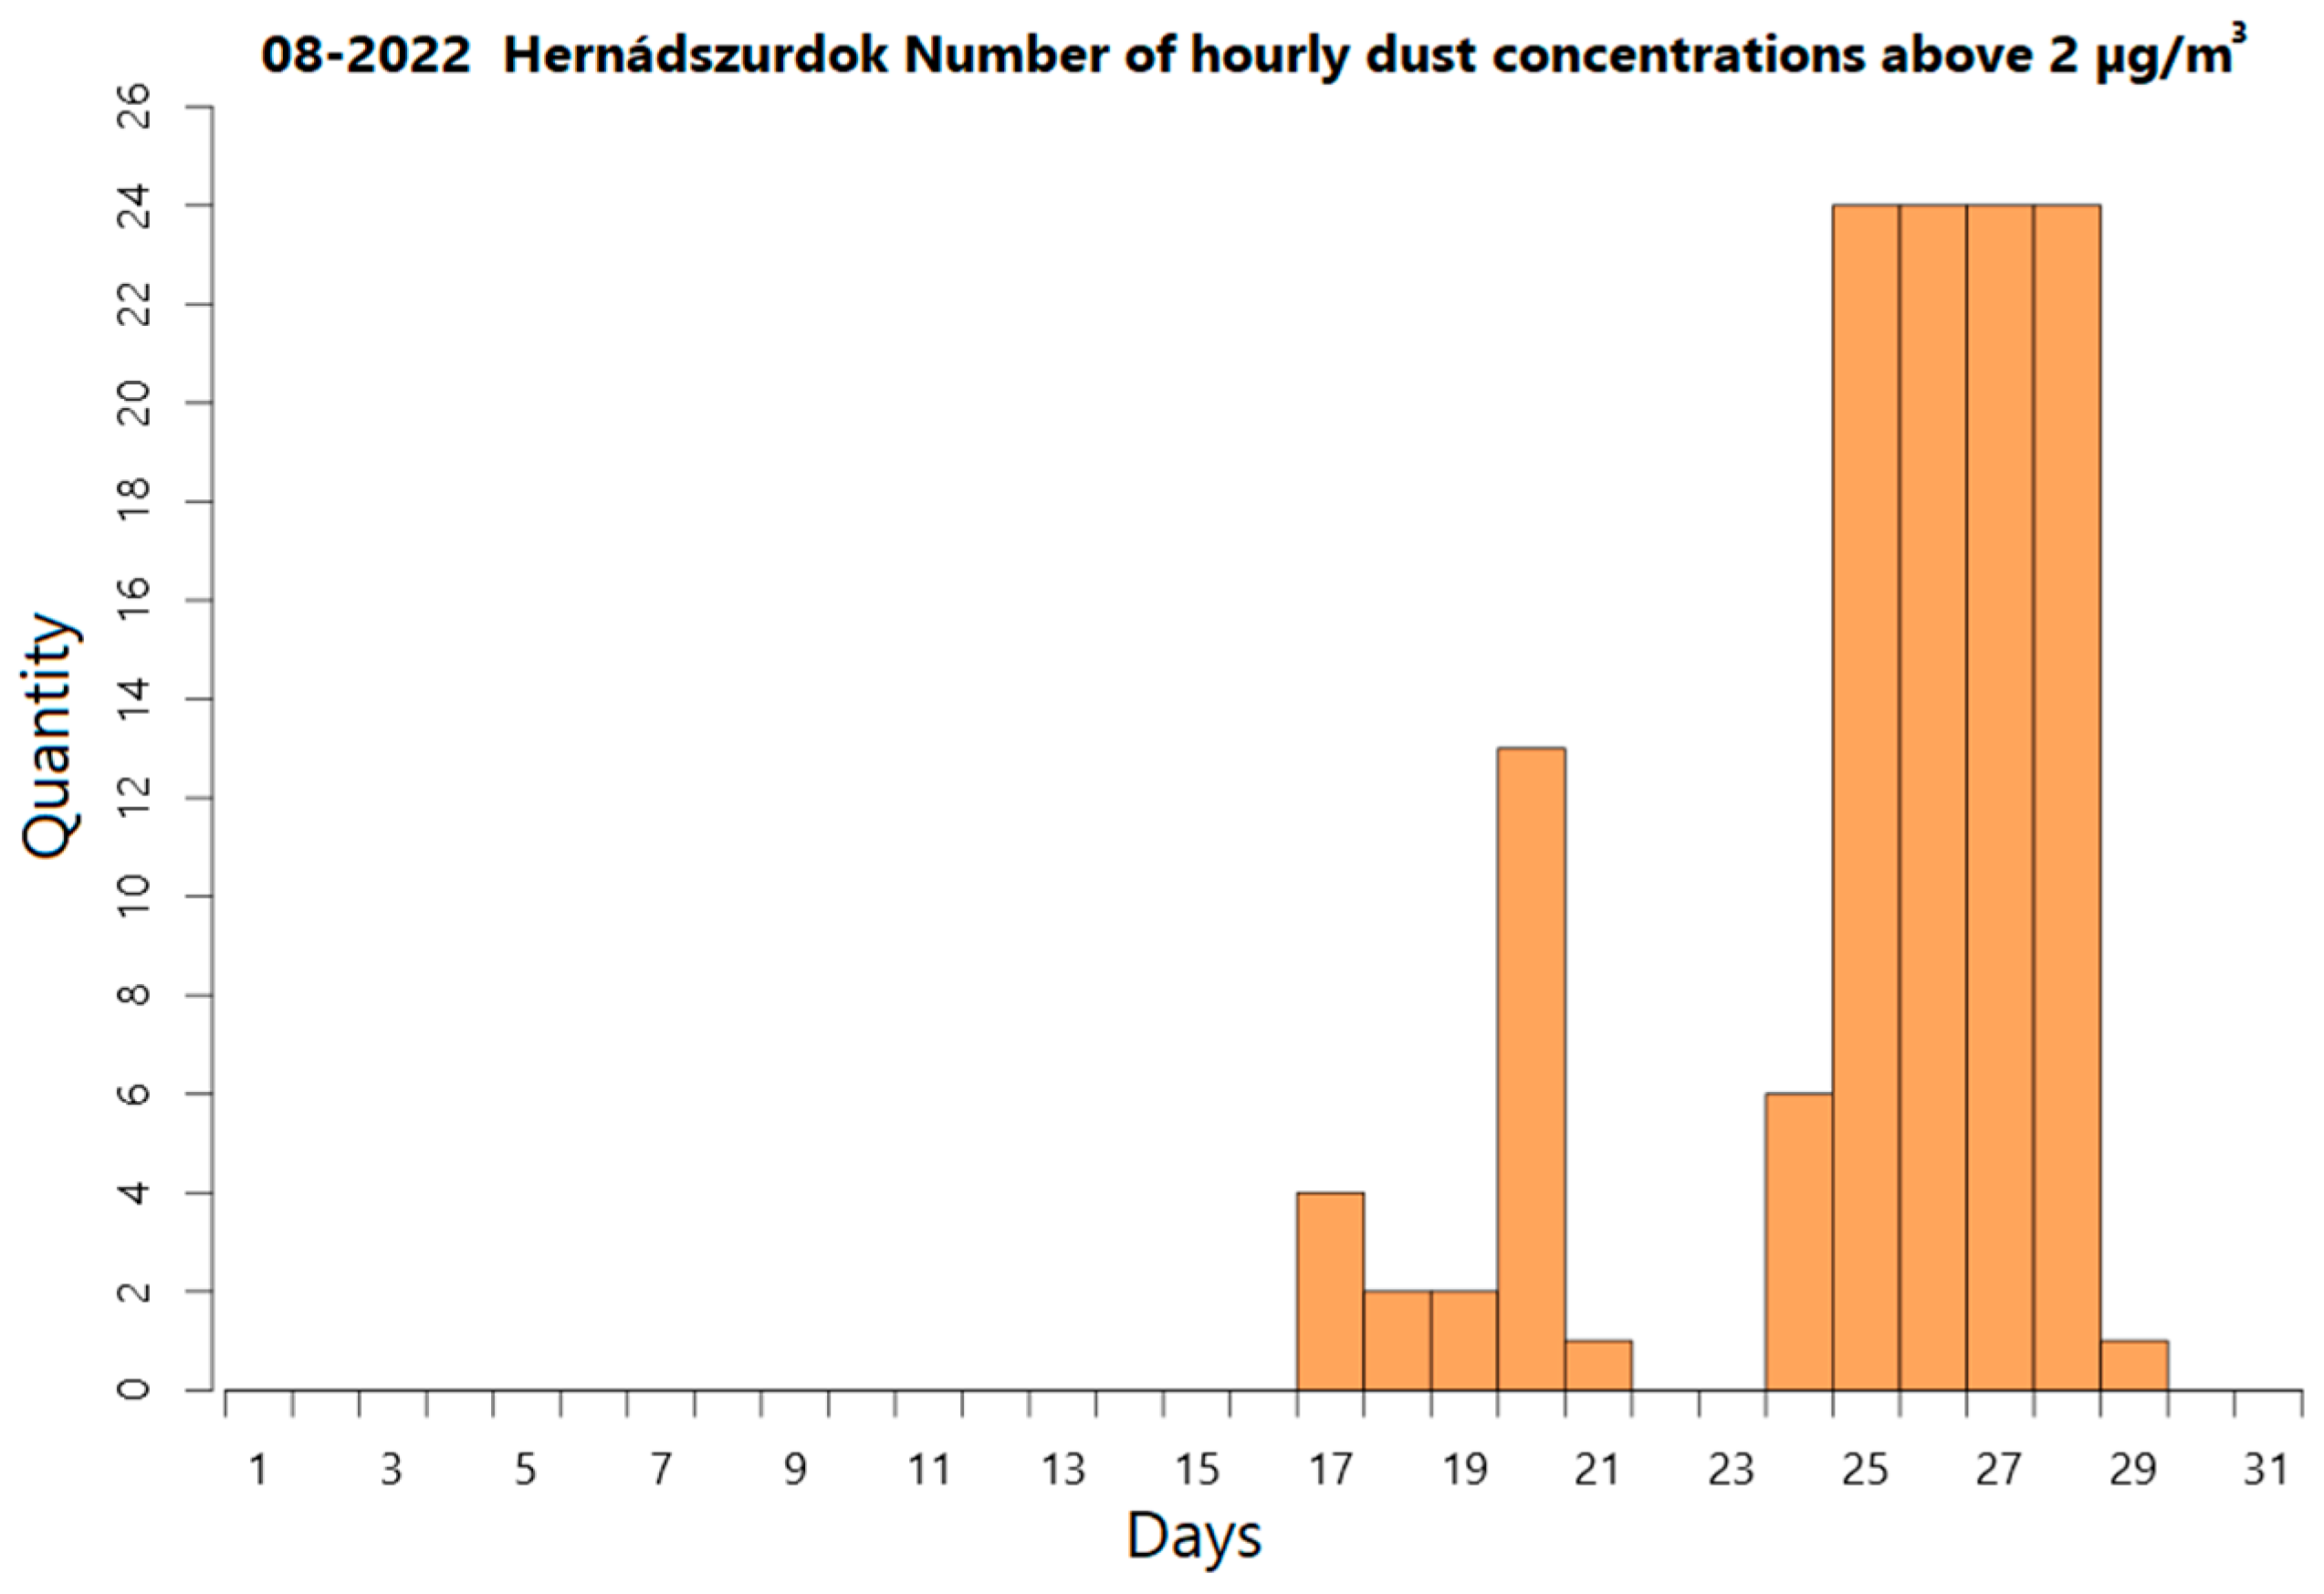
3.1. Selection of Dust Episodes

As a first step, the CAMS dust reanalysis data were examined to search for periods when dust plumes could reach Hungary in 2022. It was assumed that Saharan dust storm events reaching Hungary would be less intense and shorter in duration than those in Mediterranean countries, as the dust plume would have to travel a long distance to reach the higher latitudes. Because of the known underestimation of PM10 by the CAMS ensemble model, the modelled dust fraction was also considered to be underestimated. According to the chemical composition data provided by the CAMS policy support service, the ratio of dust within the daily average PM10 values in the concentration class of 30–40 µg/m3 was 7% in 2022, which is equivalent to 2 µg/m3. For these reasons, the 2 µg/m3 value was chosen to be a threshold above which the frequent occurrences of the hourly dust values may indicate an episode situation. Days with a high number of hourly occurrences of dust (concentration above 2 µg/m3) have been selected for the analysis (Figure 2). Daily averaged dust reanalysis maps for these high-dust days were used to follow dust plumes over Europe and assess whether they reached Hungary. In Figure 3, there are maps with daily dust reanalysis averages over Europe. The figure shows the evolution of the dust plume coming from the southeast in August 2022. With the help of the bar charts and the visualisation of daily dust averages on maps, we could select six dust episodes in 2022 that Hungary was affected by. (Dust episodes: 24–31 March, 25 June–3 July, 20–23 July, 18–21 August, 24–29 August, 21 October–5 November).
Figure 4 shows an example of the dust deduction on a graph. During the dust episode of 24–29 August, the daily measured concentrations (yellow line) and the CAMS dust reanalysis averages (green line) had a peak, which indicates the presence of natural dust in the air. After the deduction of the corrected dust values the new PM10 measurements decreased by 18 µg/m3 on 25 August.

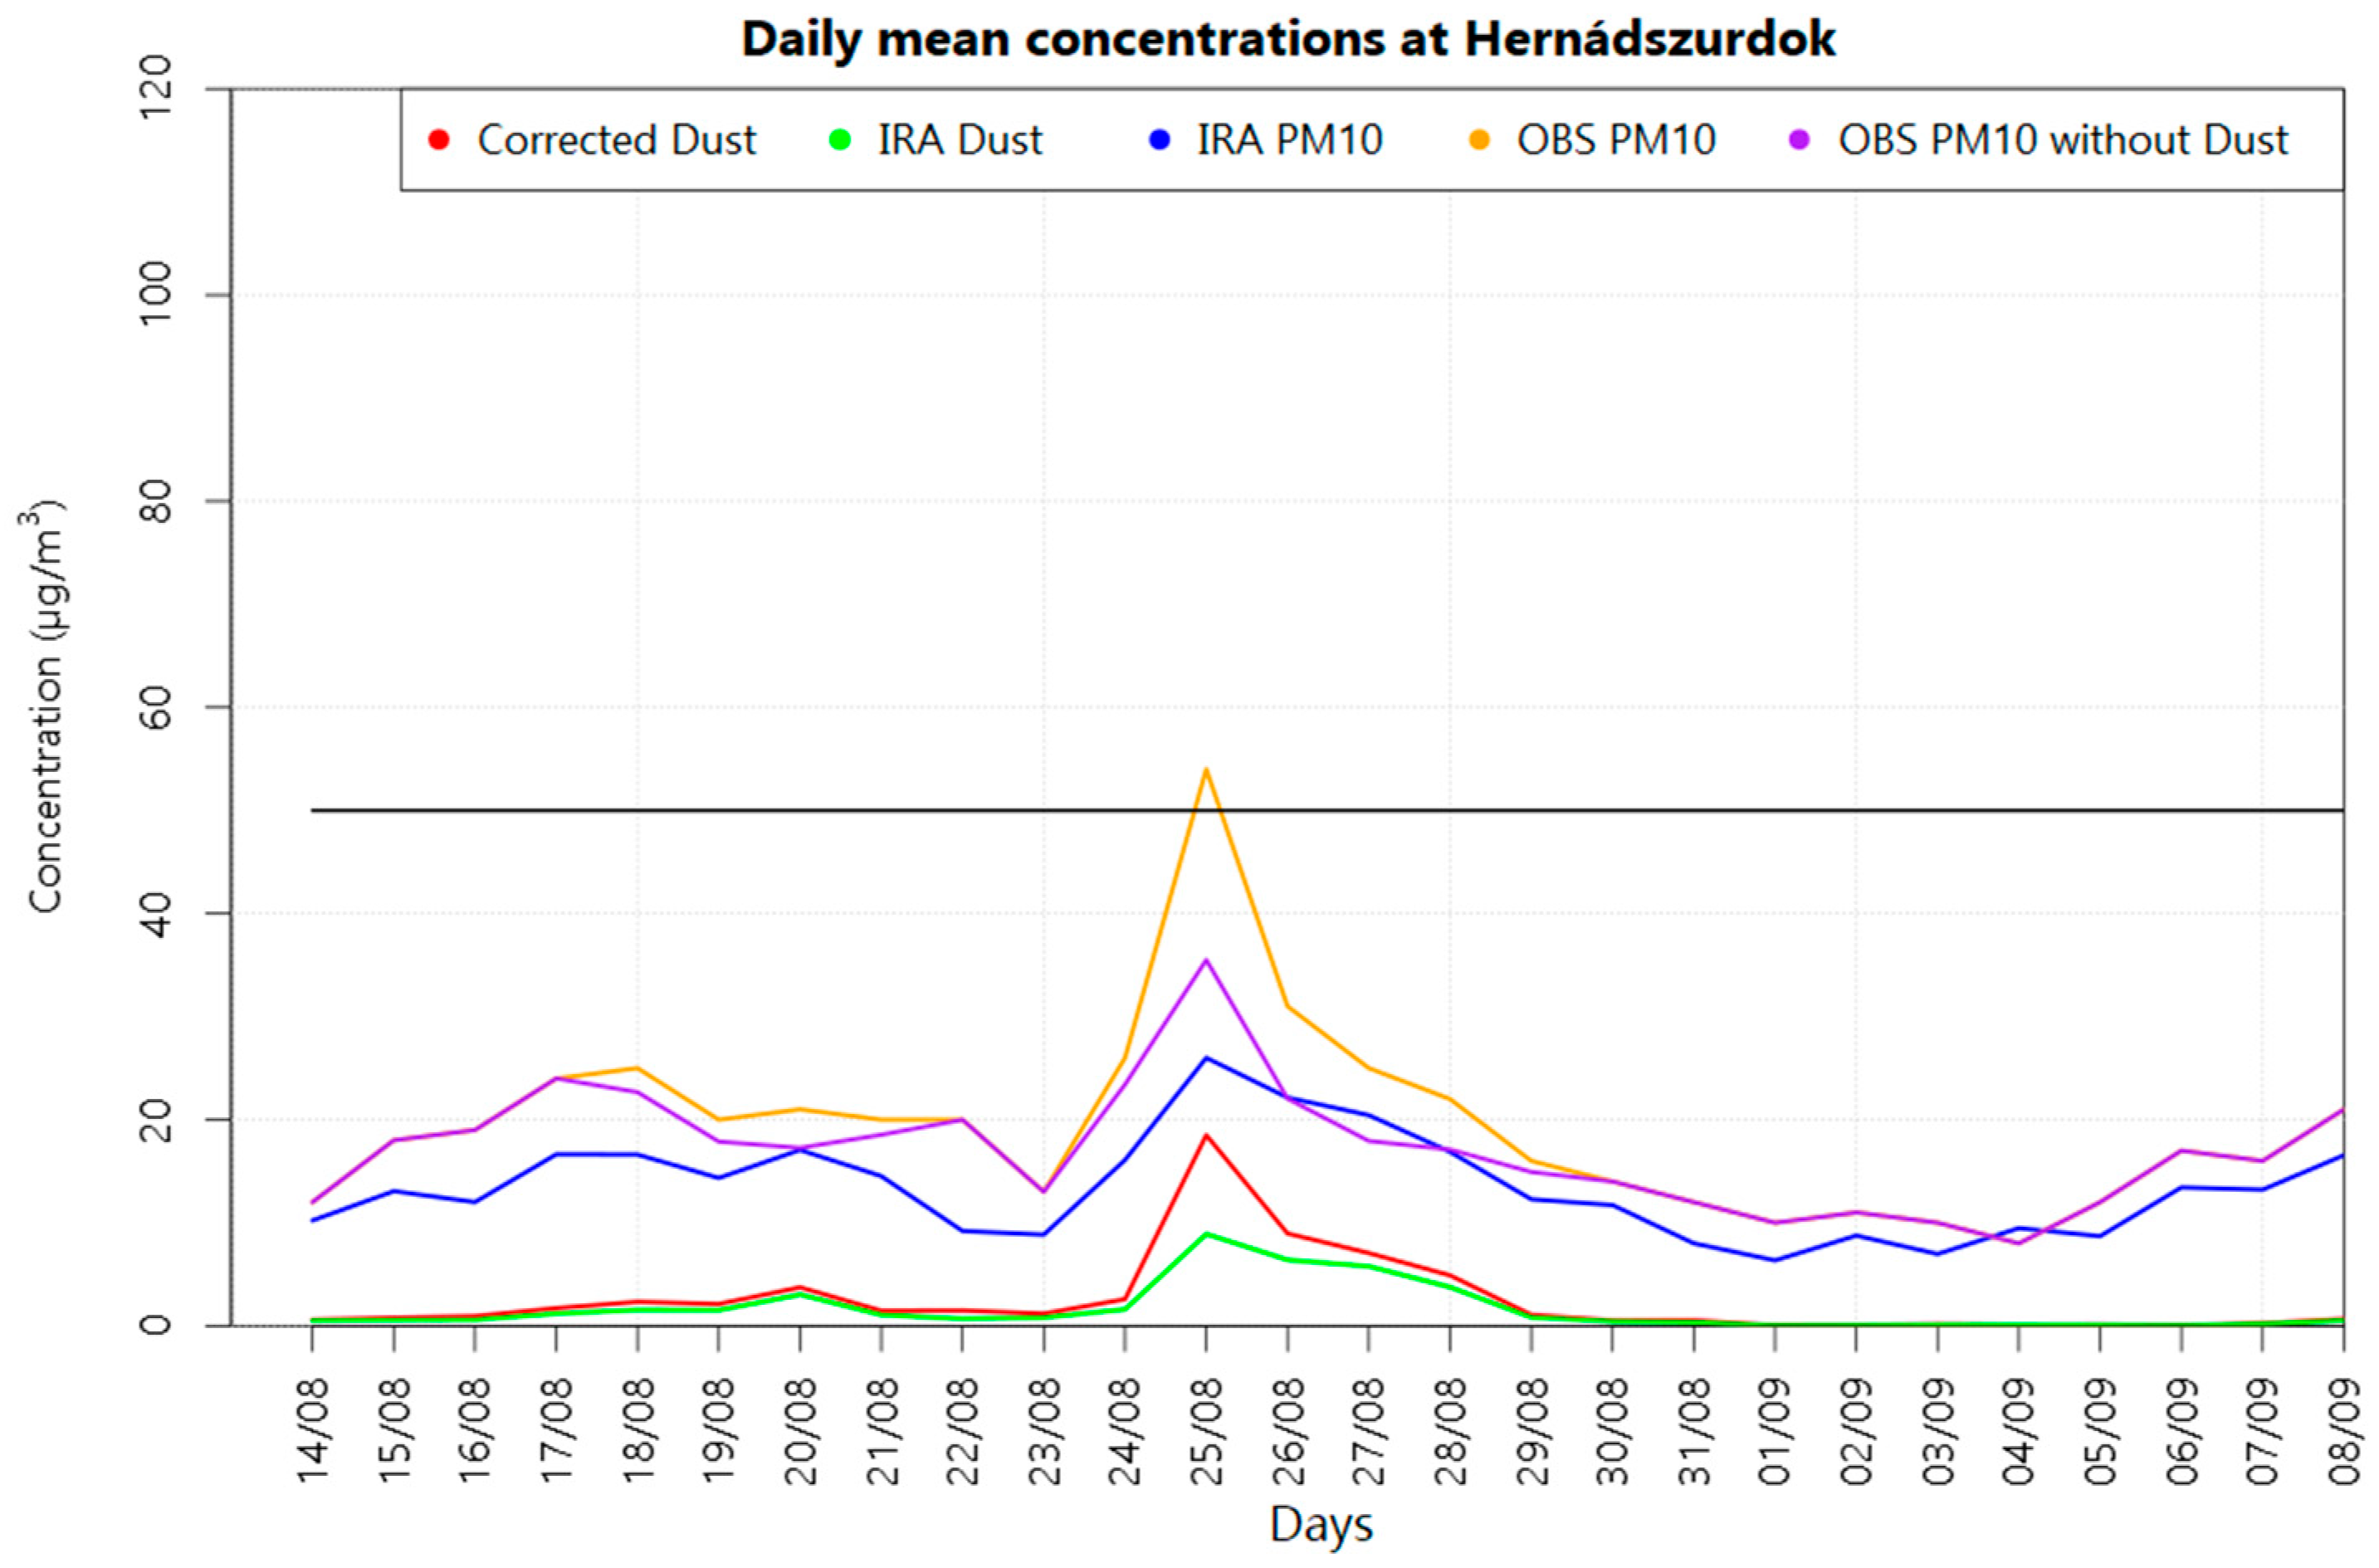
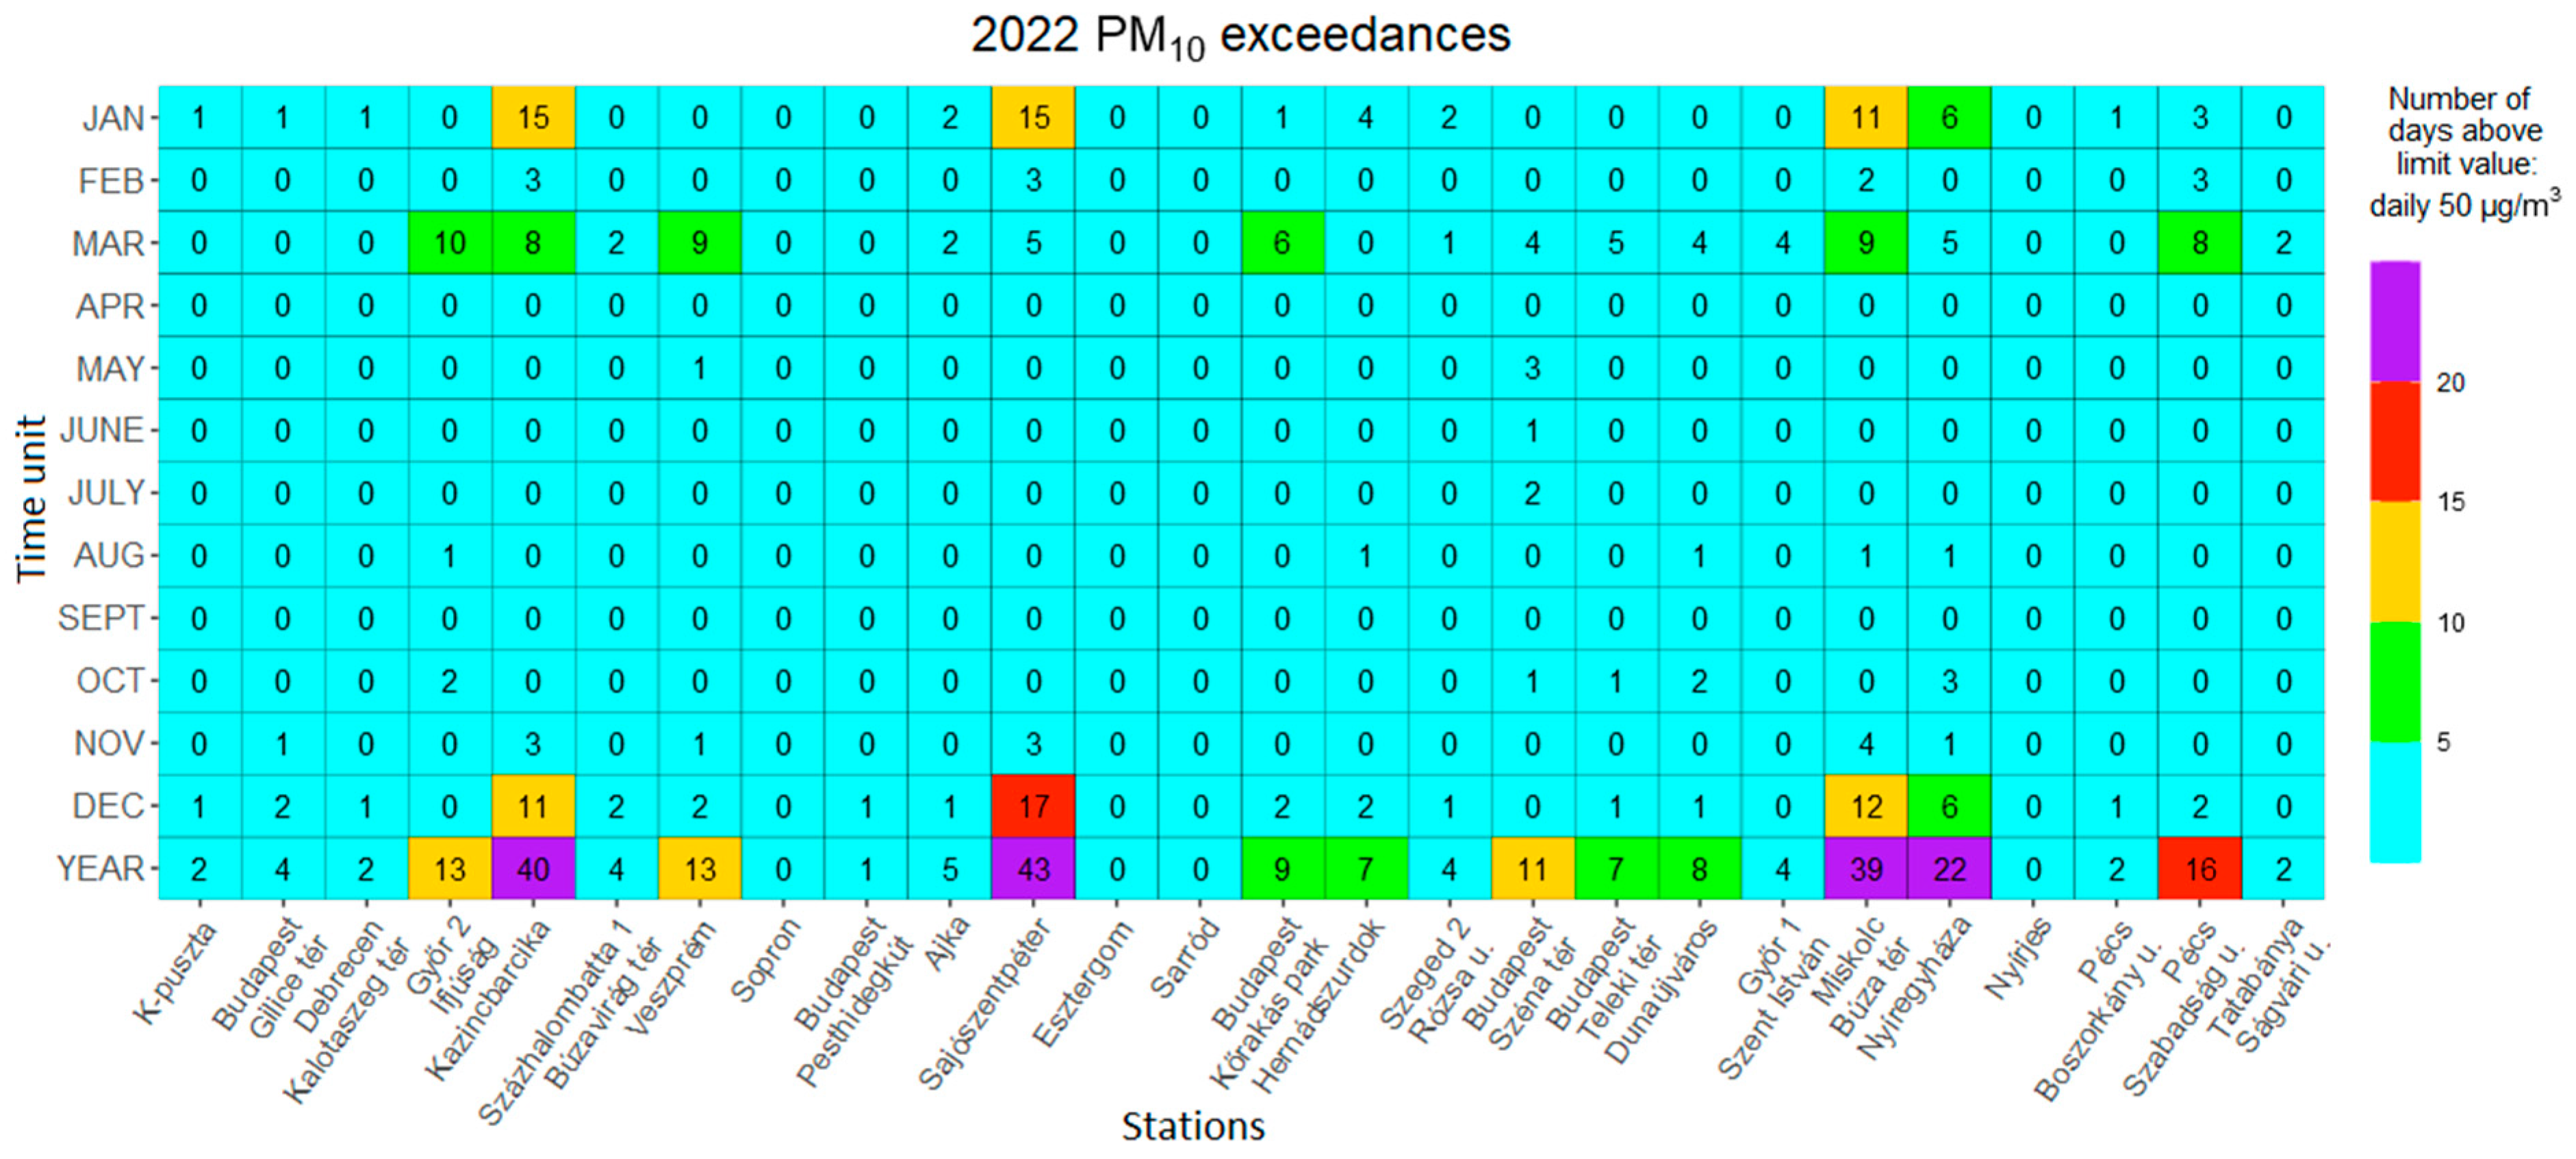
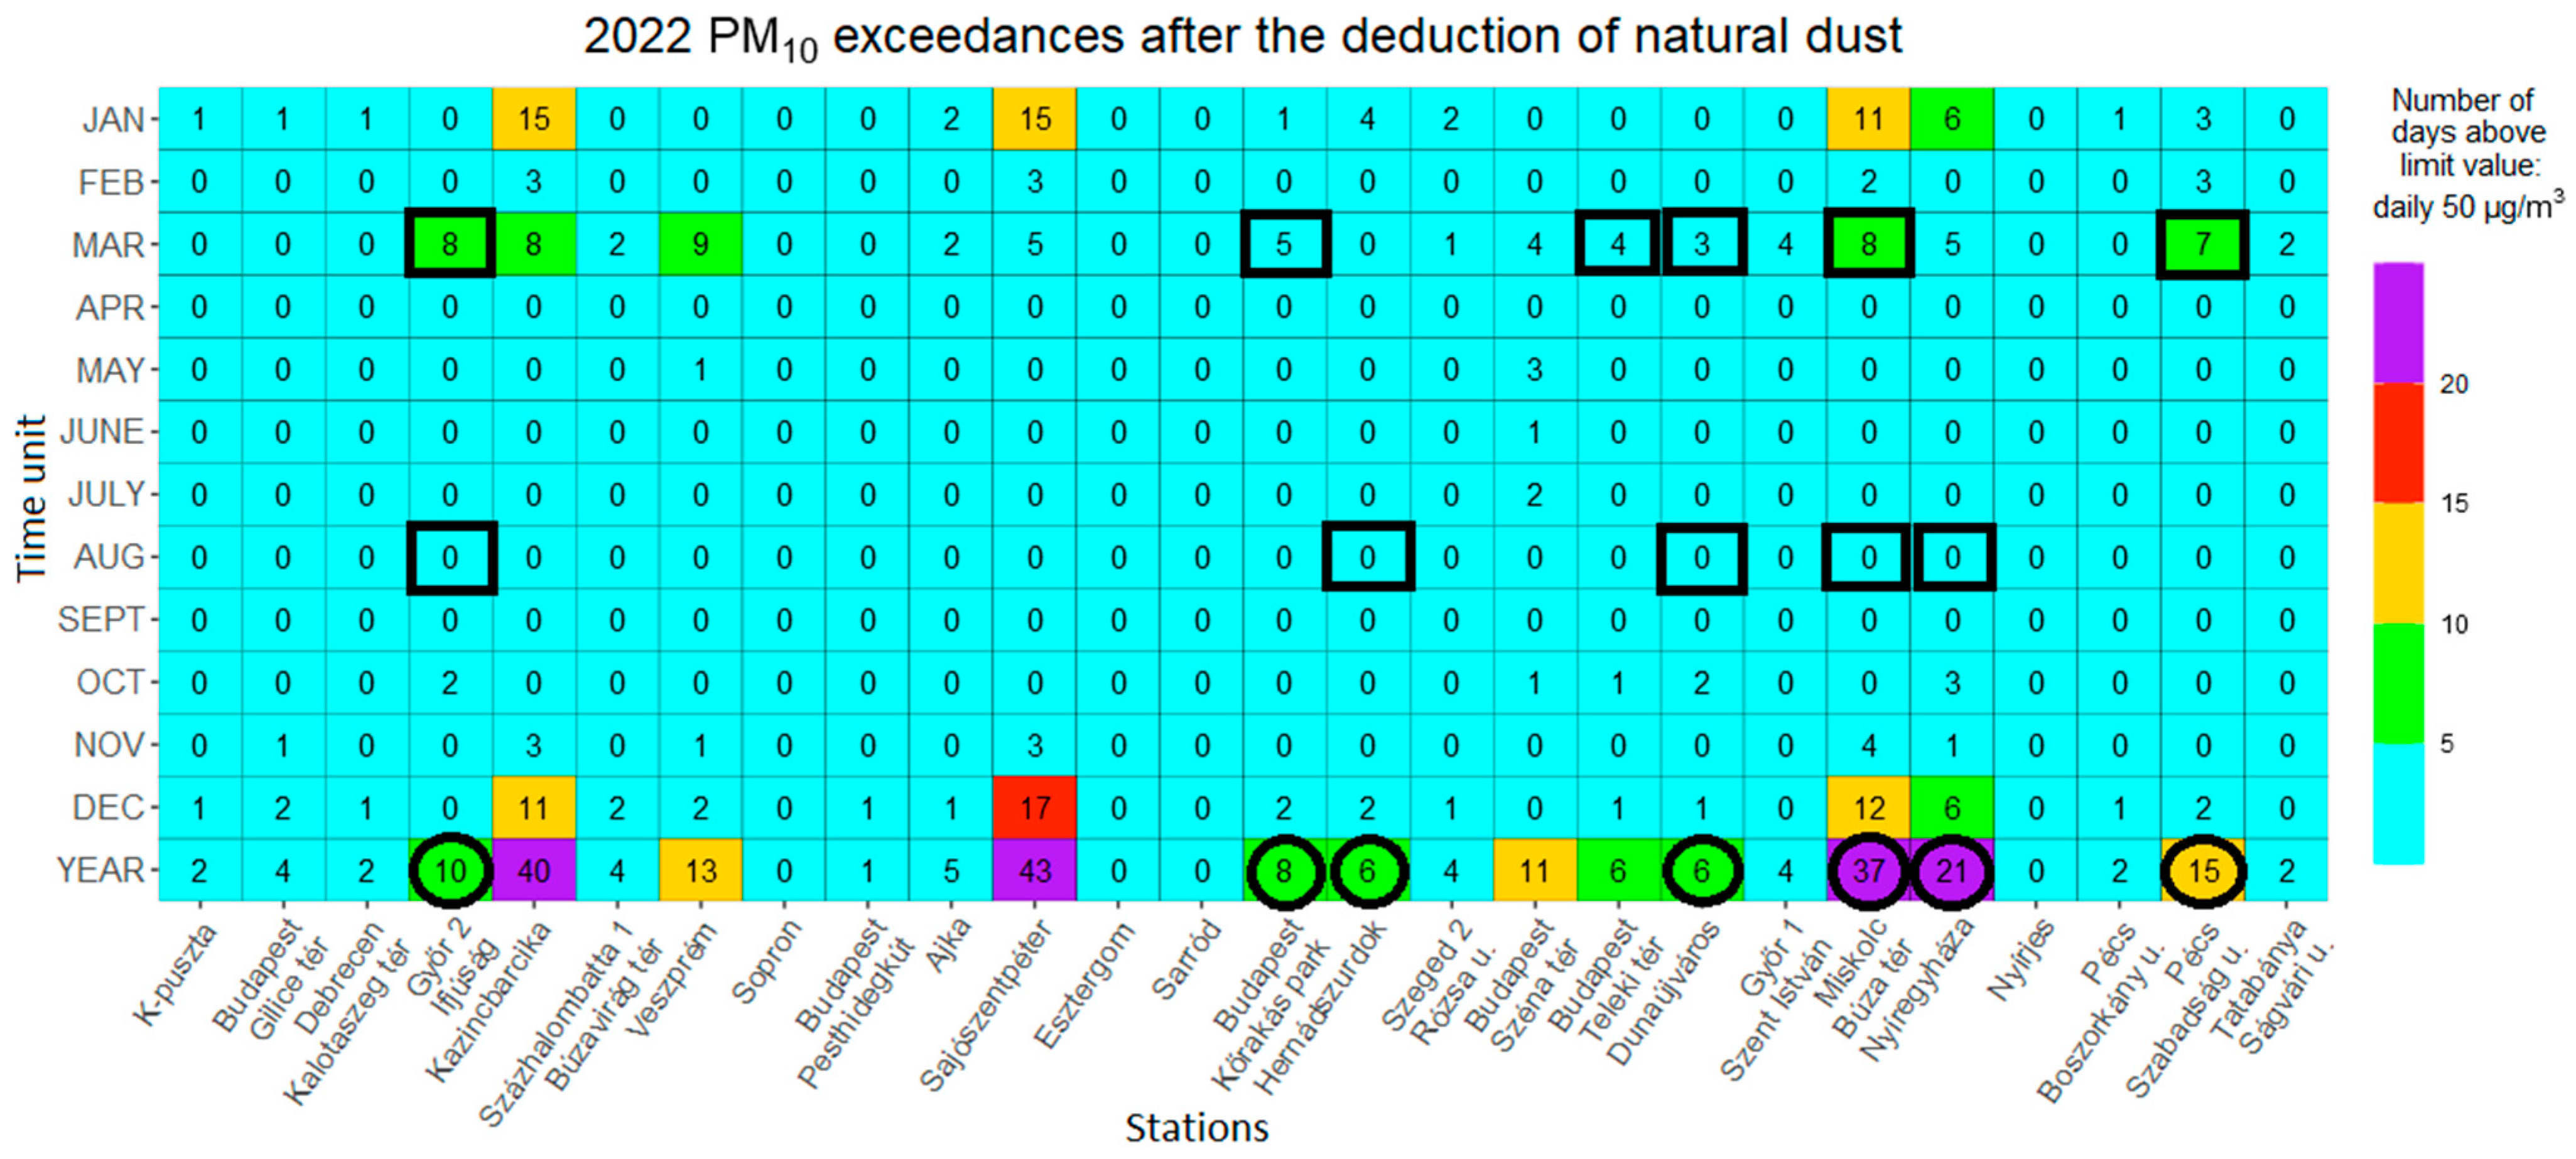
3.2. The Achieved Changes in the PM10 Concentrations

Figure 5 shows the number of exceedances of the daily 50 µg/m3 limit value at the PM10 stations. There are exceedances in each month in the first 12 rows, and the last row summarises the occurrences for the whole year.
The area with the most particulate matter pollution is the northeastern part of the country. The number of exceedances there is often above the target value (35). Therefore, it is important to find a way to define the natural contribution and to deduct it from the daily PM10 averages before reporting the number of exceedances to the EU.
In Table 1, we see the changes in the monthly averages of the PM10 measurements due to the deduction of the natural dust from the daily averages. The biggest changes occurred in August and in October.
We also saw changes in the number of the exceedances of the daily 50 µg/m3 limit value at some stations. In Figure 6, we see the number of exceedances in 2022 after the deduction of the natural dust. The changes in the monthly number of exceedances are highlighted with black squares, and the changes in the annual occurrences are highlighted with black circles. In August, we could fully eliminate the exceedances that occurred. The exceedances decreased also in March, at Győr 2 Ifjúság station with 2 days, at Budapest Kőrakás Park, Budapest Teleki, Dunaújváros, Hernádszurdok, Miskolc Búza tér, Nyíregyháza and Pécs Szabadság u. stations with 1 day. However, the annual number of exceedances is still above the 35 target value at Kazincbarcika, Sajószentpéter and Miskolc Búza tér.

4. Conclusions

North African dust hotspots in the Sahara Desert significantly contribute to the global mineral dust budget, with implications extending far beyond their geographical boundaries. The long-distance transport of dust-laden air masses originating from these hotspots influences climate, air quality, and ecosystems in remote regions across the globe. Understanding the dynamics of North African dust emissions and their impacts is crucial for addressing environmental challenges, promoting sustainable development, and safeguarding human health in a globally interconnected world.
Dust outbreaks significantly influence ambient PM levels recorded in air quality monitoring networks, posing challenges for public health and environmental management. These events underscore the importance of proactive measures to mitigate the impacts of dust pollution on air quality and safeguard vulnerable populations from exposure to elevated concentrations of PM.
The CAMS Interim Reanalysis data includes concentrations of PM10 and dust fraction within PM10. We chose the ensemble median information of these two variables to work with. We wanted to deduct the natural contributions from the PM10 concentrations. Since there might be a bias in the calculations of the dust fraction, the correction of the dust concentrations is needed before we do the deduction. During dust events, mineral dust represents a large fraction of PM10 mass concentration [28]. It was therefore assumed that the same BIAS could be applied to dust fraction as to PM10 in case of the episode situation. In the future, this assumption could be validated with chemical speciation measurements at Hungarian monitoring sites. At each station, based on the bias between the reanalysis and measured PM10 daily averages, we corrected the CAMS dust fraction daily values. With this method, we believe that the corrected dust concentration is closer to reality. We deduct this corrected dust daily average from the daily average of the PM10 concentration.
The dust fraction data from the reanalysis database helps to identify episodes of Saharan dust reaching Hungary. There are also other sources of information that show that Saharan dust is in the air over Hungary, like satellite products. Furthermore, the study of backward trajectories can be important too.
We see from the results that the contribution of natural dust to the measured PM10 daily average concentrations can be significant. Moreover, in 2022 we found 12 exceedances (daily PM10 concentrations above 50 µg/m3), which probably would not have occurred without the natural contribution.

Author Contributions

Conceptualization, Z.F.; methodology A.T., writing—review and editing, Z.F. and A.T. All authors have read and agreed to the published version of the manuscript.

Funding

This research received no external funding.

Data Availability Statement

The PM10 and PM10 dust fraction reanalysis data used in this study are available at Copernicus Atmosphere Monitoring Service (CAMS) Atmosphere Data Store (ADS) (https://ads.atmosphere.copernicus.eu/cdsapp#!/dataset/cams-europe-air-quality-reanalyses?tab=form, last access 23 April 2023); and the PM10 observation data are published by HungaroMet (https://legszennyezettseg.met.hu/, last access 15 July 2024).

Acknowledgments

The research was funded by the Sustainable Development and Technologies National Programme of the Hungarian Academy of Sciences (FFT NP FTA).

Conflicts of Interest

The authors declare no conflict of interest.

References

  1. Olarewaju, O.O.; Fajinmi, O.O.; Davies, T.C.; Arthur, G.D.; Naidoo, K.K.; Coopoosamy, R.M. The Saharan dust plume: Current knowledge on the impact on health, human activities, and the ecosystem, with comments on research gaps. ESS Open Arch. 2023, Preprint. [Google Scholar] [CrossRef]
  2. Varga, G.; Gresina, F.; Szeberényi, J.; Gelencsér, A.; Rostási, Á. Effect of Saharan dust episodes on the accuracy of photovoltaic energy production forecast in Hungary (Central Europe). Renew. Sustain. Energy Rev. 2024, 193, 114289. [Google Scholar] [CrossRef]
  3. Prospero, J.M.; Ginoux, P.; Torres, O.; Nicholson, S.E.; Gill, T.E. Environmental characterization of global sources of atmospheric soil dust identified with the Nimbus 7 Total Ozone Mapping Spectrometer (TOMS) absorbing aerosol product. Rev. Geophys. 2002, 40, 2-1–2-31. [Google Scholar] [CrossRef]
  4. Millán-Martínez, M.; Sánchez-Rodas, D.; de la Campa, A.M.S.; de la Rosa, J. Contribution of anthropogenic and natural sources in PM10 during North African dust events in Southern Europe. Environ. Pollut. 2021, 290, 118065. [Google Scholar] [CrossRef] [PubMed]
  5. Salvador, P.; Pey, J.; Pérez, N.; Querol, X.; Artíñano, B. Increasing atmospheric dust transport towards the western Mediterranean over 1948–2020. NPJ Clim. Atmos. Sci. 2022, 5, 34. [Google Scholar] [CrossRef]
  6. Querol, X.; Pey, J.; Pandolfi, M.; Alastuey, A.; Cusack, M.; Pérez, N.; Moreno, T.; Viana, M.; Mihalopoulos, N.; Kallos, G.; et al. African dust contributions to mean ambient PM10 mass-levels across the Mediterranean Basin. Atmos. Environ. 2009, 43, 4266–4277. [Google Scholar] [CrossRef]
  7. Cuspilici, A.; Monforte, P.; Ragusa, M.A. Study of Saharan dust influence on PM10 measures in Sicily from 2013 to 2015. Ecol. Indic. 2017, 76, 297–303. [Google Scholar] [CrossRef]
  8. Conte, M.; Merico, E.; Cesari, D.; Dinoi, A.; Grasso, F.M.; Donateo, A.; Guascito, M.R.; Contini, D. Long-term characterisation of African dust advection in south-eastern Italy: Influence on fine and coarse particle concentrations, size distributions, and carbon content. Atmos. Res. 2020, 233, 104690. [Google Scholar] [CrossRef]
  9. Varga, G. Changing nature of Saharan dust deposition in the Carpathian Basin (Central Europe): 40 years of identified North African dust events (1979–2018). Environ. Int. 2020, 139, 105712. [Google Scholar] [CrossRef] [PubMed]
  10. Milford, C.; Cuevas, E.; Marrero, C.L.; Bustos, J.J.; Gallo, V.; Rodríguez, S.; Romero-Campos, P.M.; Torres, C. Impacts of desert dust outbreaks on air quality in urban areas. Atmosphere 2019, 11, 23. [Google Scholar] [CrossRef]
  11. Kabatas, B.; Unal, A.; Pierce, R.B.; Kindap, T.; Pozzoli, L. The contribution of Saharan dust in PM10 concentration levels in Anatolian Peninsula of Turkey. Sci. Total Environ. 2014, 488, 413–421. [Google Scholar] [CrossRef] [PubMed]
  12. Çapraz, Ö.; Deniz, A. Particulate matter (PM 10 and PM 2.5) concentrations during a Saharan dust episode in Istanbul. Air Qual. Atmos. Health 2021, 14, 109–116. [Google Scholar] [CrossRef]
  13. European Council: On Ambient Air Quality and Cleaner Air for Europe 2008/50/EC. Off. J. Eur. Union 2008, 1, 1–44. Available online: https://eur-lex.europa.eu/legal-content/EN/TXT/PDF/?uri=CELEX:32008L0050&from=en (accessed on 21 November 2023).
  14. Furu, E.; Angyal, A.; Szoboszlai, Z.; Papp, E.; Török, Z.; Kertész, Z. Characterization of aerosol pollution in two Hungarian cities in winter 2009–2010. Atmosphere 2022, 13, 554. [Google Scholar] [CrossRef]
  15. Russo, A.; Sousa, P.M.; Durão, R.M.; Ramos, A.M.; Salvador, P.; Linares, C.; Díaz, J.; Trigo, R.M. Saharan dust intrusions in the Iberian Peninsula: Predominant synoptic conditions. Sci. Total Environ. 2020, 717, 137041. [Google Scholar] [CrossRef] [PubMed]
  16. Petroselli, C.; Crocchianti, S.; Vecchiocattivi, M.; Moroni, B.; Selvaggi, R.; Castellini, S.; Corbucci, I.; Bruschi, F.; Marchetti, E.; Galletti, M.; et al. Decadal trends (2009–2018) in Saharan dust transport at Mt. Martano EMEP station, Italy. Atmos. Res. 2024, 304, 107364. [Google Scholar] [CrossRef]
  17. Querol, X.; Pérez, N.; Reche, C.; Ealo, M.; Ripoll, A.; Tur, J.; Pandolfi, M.; Pey, J.; Salvador, P.; Moreno, T.; et al. African dust and air quality over Spain: Is it only dust that matters? Sci. Total Environ. 2019, 686, 737–752. [Google Scholar] [CrossRef]
  18. European Union. Establishing Guidelines for Demonstration and Subtraction of Exceedances Attributable to Natural Sources under the Directive 2008/50/EC on Ambient Air Quality and Cleaner Air for Europe; European Comission Comission Staff Working Paper; SEC(2011) 208 Final; European Union: Brussels, Belgium, 2011. [Google Scholar]
  19. Escudero, M.; Querol, X.; Pey, J.; Alastuey, A.; Pérez, N.; Ferreira, F.; Alonso, S.; Rodríguez, S.; Cuevas, E. A methodology for the quantification of the net African dust load in air quality monitoring networks. Atmos. Environ. 2007, 41, 5516–5524. [Google Scholar] [CrossRef]
  20. Lotrecchiano, N.; Capozzi, V.; Sofia, D. An innovative approach to determining the contribution of Saharan dust to pollution. Int. J. Environ. Res. Public Health 2021, 18, 6100. [Google Scholar] [CrossRef]
  21. Ganor, E.; Stupp, A.; Alpert, P. A method to determine the effect of mineral dust aerosols on air quality. Atmos. Environ. 2009, 43, 5463–5468. [Google Scholar] [CrossRef]
  22. Viana, M.; Salvador, P.; Artíñano, B.; Querol, X.; Alastuey, A.; Pey, J.; Latz, A.J.; Cabañas, M.; Moreno, T.; Santos, S.G.D.; et al. Assessing the performance of methods to detect and quantify African dust in airborne particulates. Environ. Sci. Technol. 2010, 44, 8814–8820. [Google Scholar] [CrossRef] [PubMed]
  23. Gonzalez-Calvo, D.; Aguilar, R.; Criado-Hernandez, C.; Gonzalez-Mendoza, L. Multivariate influence through neural networks ensemble: Study of Saharan dust intrusion in the Canary Islands. Appl. Soft Comput. 2021, 107, 107497. [Google Scholar] [CrossRef]
  24. Basart, S.; Pérez, C.; Nickovic, S.; Cuevas, E.; Baldasano, J.M. Development and evaluation of the BSC-DREAM8b dust regional model over Northern Africa, the Mediterranean and the Middle East. Tellus B Chem. Phys. Meteorol. 2012, 64, 18539. [Google Scholar] [CrossRef]
  25. Barnaba, F.; Bolignano, A.; Di Liberto, L.; Morelli, M.; Lucarelli, F.; Nava, S.; Perrino, C.; Canepari, S.; Basart, S.; Costabile, F.; et al. Desert dust contribution to PM10 loads in Italy: Methods and recommendations addressing the relevant European Commission Guidelines in support to the Air Quality Directive 2008/50. Atmos. Environ. 2017, 161, 288–305. [Google Scholar] [CrossRef]
  26. Barnaba, F.; Romero, N.A.; Bolignano, A.; Basart, S.; Renzi, M.; Stafoggia, M. Multiannual assessment of the desert dust impact on air quality in Italy combining PM10 data with physics-based and geostatistical models. Environ. Int. 2022, 163, 107204. [Google Scholar] [CrossRef]
  27. Institut National de L’environnement Industriel et des Risques (Ineris); Aarhus University, Norwegian Meteorological Institute (MET Norway); Jülich Institut für Energie-und Klimaforschung (IEK); Institute of Environmental Protection—National Research Institute (IEP-NRI); Koninklijk Nederlands Meteorologisch Instituut (KNMI); METEO FRANCE; Nederlandse Organisatie voor Toegepast-Natuurwetenschappelijk Onderzoek (TNO); Swedish Meteorological and Hydrological Institute (SMHI); Finnish Meteorological Institute (FMI); Italian National Agency for New Technologies; et al. CAMS European Air Quality Forecasts, ENSEMBLE Data. Copernicus Atmosphere Monitoring Service (CAMS) Atmosphere Data Store (ADS). 2022. Available online: https://ads.atmosphere.copernicus.eu/cdsapp#!/dataset/cams-europe-air-quality-reanalyses?tab=overview (accessed on 24 April 2023).
  28. Remoundaki, E.; Bourliva, A.; Kokkalis, P.; Mamouri, R.; Papayannis, A.; Grigoratos, T.; Samara, C.; Tsezos, M. PM10 composition during an intense Saharan dust transport event over Athens (Greece). Sci. Total Environ. 2011, 409, 4361–4372. [Google Scholar] [CrossRef]
Figure 1. PM10 stations in Hungaryz: 1—Ajka, 2—Budapest Gilice tér, 3—Budapest Kőrakás park, 4—Budapest Pesthidegkút, 5—Budapest Széna tér, 6—Budapest Teleki tér, 7—Debrecen Kalotaszeg tér, 8—Dunaújváros, 9—Esztergom, 10—Győr 2 Ifjúság, 11—Győr 1 Szent István, 12—Hernádszurdok, 13—Kazincbarcika, 14—K-puszta, 15—Miskolc Búza tér, 16—Nyíregyháza, 17—Nyírjes, 18—Pécs Boszorkány u., 19—Pécs Szabadság u., 20—Sajószentpéter, 21—Sarród, 22—Sopron, 23—Százhalombatta Búzavirág tér, 24—Szeged 2 Rózsa u., 25—Tatabánya Ságvári u., 26—Veszprém.
Air 02 00019 g001
Figure 2. Bar chart with the number of hourly dust reanalysis concentrations above 2 µg/m3 at Hernádszurdok in August 2022.
Air 02 00019 g002
Figure 3. The change in daily average dust concentrations (CAMS reanalysis) over Europe, 23–28 August 2022. Hungary is circled in red.
Air 02 00019 g003
Figure 4. The daily concentrations of the CAMS dust fraction (green) and PM10 (blue), the corrected dust (red), the measured PM10 (yellow) and the PM10 without natural contribution (purple) at Hernádszurdok (the black line indicates the 50 µg/m3 limit value), 14 August–8 September 2022.
Air 02 00019 g004
Figure 5. Number of PM10 exceedances at the monitoring sites in 2022.
Air 02 00019 g005
Figure 6. Number of exceedances at the monitoring sites in 2022 after the deduction of the natural dust. The squares highlight the changes in the monthly number and the circles the changes in the annual number of exceedances.
Air 02 00019 g006
Table 1. Changes in monthly averages at monitoring sites in March, June, July, August, October and November.
Values in µg/m3MAR JUNEJULYAUGOCTNOV
Ajka−0.71−0.58−0.40−1.51−1.84−0.76
Budapest Gilice−0.70−0.64−0.80−1.77−0.02
Budapest Kőrakás park−0.89−0.63−0.67−1.33−1.70−0.66
Budapest Pesthidegkút−0.71−0.62−0.67−1.43−1.14−0.59
Budapest Széna tér−0.96−0.18−0.96−1.15−1.39−0.53
Budapest Teleki tér−0.88−0.86−0.87−1.41−1.36−0.61
Debrecen Kalotaszeg−0.65−0.38−0.79−1.92−0.85−1.03
Dunaújváros−0.83−0.79−0.88−2.32−1.92−0.96
Esztergom−0.59−0.40−0.36−1.50−0.95−0.40
Győr 1 Szent István−0.73−0.58−1.38−0.63
Győr 2 Ifjúság−0.72−0.51−0.42−1.86−0.92
Hernádszurdok−0.51−0.29−0.59−1.70−0.66−0.79
Kazincbarcika−0.74−0.36−0.73−2.24−1.02−1.08
K-puszta−0.76−0.56−0.69−1.63−1.48−0.92
Miskolc Búza tér−0.85−0.52−0.99−2.00−1.12−0.99
Nyíregyháza−0.92−0.42−0.98−2.58−1.13−1.21
Nyírjes−0.76−0.30−0.41−1.11−0.63−0.45
Pécs Boszorkány u.−0.70−0.89−0.80−2.48−1.60−0.90
Pécs Szabadság u.−0.93−1.16−0.71−1.61−1.63−1.04
Sajószentpéter−0.64−0.46−0.82−1.40−1.28−1.07
Sarród−2.43−0.45−0.13−1.09−1.16−0.40
Sopron−0.61−1.08−1.00
Százhalombatta−0.71−0.29−0.66−1.46−1.66−0.74
Szeged 2 Rózsa u.−0.51−0.76−0.96−2.14−1.12−0.39
Tatabánya Ságvári u.−0.62−0.44−0.33−1.38−0.58
Veszprém−0.70−0.54−0.39−1.99−1.00−0.31
Disclaimer/Publisher’s Note: The statements, opinions and data contained in all publications are solely those of the individual author(s) and contributor(s) and not of MDPI and/or the editor(s). MDPI and/or the editor(s) disclaim responsibility for any injury to people or property resulting from any ideas, methods, instructions or products referred to in the content.

