Article

Raman Spectra of Blood Serum as Holistic Biomarker for Differential Auxiliary Diagnoses of Attention Deficit and Hyperactivity Disorder (ADHD) in Adults

1
Department of Physics, Faculty of Sciences and Letters, Istanbul Kultur University, 34158 Istanbul, Turkey
2
Department of Physics, Faculty of Sciences, Istanbul University, 31134 Istanbul, Turkey
3
Department of Psychiatry, Faculty of Medicine, Istanbul Aydın University, 34310 Istanbul, Turkey
4
Department of Psychiatry, Faculty of Medicine, Selcuk University, 42130 Konya, Turkey
5
Department of Psychiatry, Elbistan State Hospital, 46300 Kahramanmaras, Turkey
6
CQC-IMS, Department of Chemistry, University of Coimbra, 3004-535 Coimbra, Portugal
*
Author to whom correspondence should be addressed.
Spectrosc. J. 2024, 2(2), 53-67; https://doi.org/10.3390/spectroscj2020004
Submission received: 1 February 2024 / Revised: 3 April 2024 / Accepted: 11 April 2024 / Published: 14 April 2024
(This article belongs to the Special Issue Feature Papers in Spectroscopy Journal)

Abstract

:
Attention deficit and hyperactivity disorder (ADHD) is a prevalent neurodevelopmental condition, impacting approximately 10% of children globally. A significant proportion, around 30–50%, of those diagnosed during childhood continue to manifest ADHD symptoms into adulthood, with 2–5% of adults experiencing the condition. The existing diagnostic framework for ADHD relies on clinical assessments and interviews conducted by healthcare professionals. This diagnostic process is complicated by the disorder’s overlap in symptoms and frequent comorbidities with other neurodevelopmental conditions, particularly bipolar disorder during its manic phase, adding complexity to achieving accurate and timely diagnoses. Despite extensive efforts to identify reliable biomarkers that could enhance the clinical diagnosis, this objective remains elusive. In this study, Raman spectroscopy, combined with multivariate statistical methods, was employed to construct a model based on the analysis of blood serum samples. The developed partial least-squares discriminant analysis (PLS-DA) model demonstrated an ability to differentiate between individuals with ADHD, healthy individuals, and those diagnosed with bipolar disorder in the manic phase, with a total accuracy of 97.4%. The innovative approach in this model involves utilizing the entire Raman spectrum, within the 450–1720 cm−1 range, as a comprehensive representation of the biochemical blood serum setting, thus serving as a holistic spectroscopic biomarker. This method circumvents the necessity to pinpoint specific chemical substances associated with the disorders, eliminating the reliance on specific molecular biomarkers. Moreover, the developed model relies on a sensitive and reliable technique that is cost-effective and rapid, presenting itself as a promising complementary diagnostic tool for clinical settings. The potential for Raman spectroscopy to contribute to the diagnostic process suggests a step forward in addressing the challenges associated with accurately identifying and distinguishing ADHD from other related conditions.

Graphical Abstract

1. Introduction

Attention deficit and hyperactivity disorder (ADHD) stands out as one of the most common neurobehavioral diseases. It is classified as a neurodevelopmental disorder, typically manifesting during childhood, thus being primarily associated with infancy and adolescence, where symptoms are also more pronounced [1,2,3]. ADHD affects 9–10% of the population under 17, with boys exhibiting a prevalence that is over twice that of girls [4,5,6,7]. Notably, ca. 30–50% of the children diagnosed with ADHD continue to show symptoms into adulthood, resulting in an incidence of the disorder in adults ranging from 2–5% [4,5,6,7].
While factors such as genetics, nutrition, and disruptions in the central nervous system during development are thought to contribute significantly to the onset of the disease, its etiology remains uncertain and appears to differ from one case to another [8,9,10,11,12]. ADHD is influenced by various determinants, including age, sex, and environmental factors, both prenatal, such as smoking and alcohol use during pregnancy, and postnatal, like early exposure to neurotoxic chemicals and stress [8,9,10,11,12,13,14,15].
The disease impacts executive functions that are essential for assessing, planning, and sustaining individuals’ ongoing lives [16]. As mentioned above, ADHD symptoms are generally more subtle in adults than in children and adolescents, with a significant decrease in hyperactivity, while inattentiveness tends to persist [6,7]. Signs of the condition in adults include impulsivity (inconsistent behavior), inattentiveness (difficulty concentrating and focusing), and emotional dysregulation. Typical behaviors in ADHD adults encompass poor organizational skills, mood swings, irritability, quick temper, difficulty handling stress, frequent and loud talking, struggles with keeping quiet, impatience, ongoing misplacement of items, and a tendency to take risks in activities with little concern for one’s personal safety or the safety of others (e.g., engaging in risky driving) [1,2,3,4,5,6,7]. Adults with ADHD may exhibit comorbidity with other neurobehavioral conditions, including personality, obsessive–compulsive, and bipolar disorders [1,2,3,4,5,6,7,17,18].
Diagnosing ADHD poses a challenge for clinicians. The current diagnostic approach is based on the criteria outlined in the Diagnostic and Statistical Manual of Mental Disorders (Fifth Edition; DSM-5) and relies on a clinical evaluation, involving interviews and the assessment of symptom clusters [1]. However, this diagnostic procedure has been criticized for not allowing for sufficiently reliable and valid diagnoses [19]. This is particularly evident because ADHD shares clinical symptoms with various other disorders, most notably the manic episodes of bipolar disorder [17,18,20,21], which exhibit many behavioral parallels with ADHD, such as difficulties in focusing, impulsive behavior, and hyperactivity [17,18,20,21,22,23,24]. The substantial overlap in symptoms often leads to misdiagnoses, resulting in delays in appropriate treatment and unnecessary additional suffering for patients.
Unfortunately, like for many other neurodevelopmental diseases, there are currently no molecular-level diagnostic techniques for ADHD to support the clinical diagnosis. Several studies have explored different approaches (such as neuroimaging and metabolic and genetic investigations) to find explicit biochemical changes associated with ADHD in the search for specific biomarkers in patients, but with very limited success [13,19,25]. Indeed, despite their promise and some indications that biochemicals related to the dopaminergic and noradrenergic systems might be associated with the ADHD status [19], the search for biomarkers of ADHD (and for psychiatric disorders in general) has largely proven elusive. In a comprehensive review prepared by the task force on biological markers of the World Federation of Societies of Biological Psychiatry (WFSBP) and the World Federation of ADHD [25], the authors concluded that according to their stringent criteria, no single biomarker is available for diagnosing ADHD, while clusters of reliable molecular biomarkers for the condition have also not been identified yet.
Delving into specific molecular biomarkers of a disease is invariably a challenging task, requiring sophisticated and often costly advanced analytical techniques. To overcome these challenges, we have recently proposed an alternative approach that overcomes the need to pinpoint any specific chemical substance related with the disorder. This methodology uses information extracted from the Raman or infrared spectra of blood serum samples of patients, together with multivariate statistical methods, as a spectroscopic biomarker that provides a holistic representation of the biochemical environment of the blood serum. Such an approach was successfully applied to a series of neurobehavioral diseases, including autism spectrum disorder [26,27], schizophrenia, and different phases of bipolar disorder [28], as well as ADHD in children and adolescents [29]. While this holistic approach does not yield information about specific metabolic mechanisms or precise chemical species involved in the disease, it offers a more dependable overall description of the samples and simplifies their distinction from controls, because no information is overlooked, and the entire biochemical environment is subjected to examination.
Body fluids are easily accessible and are widely employed in medical diagnostics. The utilization of vibrational spectroscopy, whether Raman or infrared, in analyzing body fluids has increasingly garnered recognition from clinicians as a complementary diagnostic instrument. This approach offers distinct advantages over other techniques, being a sensitive, reliable, cost-effective, rapid, and easily adaptable methodology within the clinical setting [26,30]. When coupled with contemporary chemometric methods, Raman and infrared spectroscopies have demonstrated their efficacy as powerful analytical instruments for efficient examination of the biochemical environment of a given biological sample [26,27,28,29,30,31,32,33,34,35,36,37,38,39].
In our prior investigation of ADHD in children and adolescents [29], infrared spectroscopy, coupled with hierarchical clustering (HC) and partial least-squares discriminant analysis (PLS-DA), was employed to construct a model based on the spectra of blood serum samples. This model successfully differentiated ADHD patients from healthy individuals. In particular, the PLS 2D score plot (Factor-1 vs. Factor-2) of the model clearly demonstrated discrimination between the ADHD and control groups, and the classification rendered no mismatches (100% accuracy for the tested samples). These results encouraged us to apply a similar approach to investigate ADHD in adults, where the disease has received comparatively less attention from researchers. It is worth mentioning that, as noted above, ADHD symptoms in adults are less pronounced compared to those in children and adolescents, making diagnosis more challenging with the current clinical methods and underscoring the need for finding reliable complementary diagnosis methods in this context. Furthermore, in the quest to contribute to helping clinicians make a differential diagnosis between ADHD and bipolar disorder, in the present study, our goal was to develop a chemometric analytical model that is capable of distinguishing not only ADHD patients from healthy individuals but also from those who are clinically diagnosed as bipolar (in the manic phase). As shown below, the obtained results suggest that this approach holds potential for application in the clinical environment as a supplementary differential diagnostic tool for ADHD in adulthood.

2. Materials and Methods

2.1. Clinical Phase

2.1.1. Patient and Control Group Selection

Blood serum samples were obtained from a set of clinically characterized (according to the DSM-5 criteria [1]) ADHD and bipolar manic phase (BP-M) patients, who were under treatment at the Marmara University Pendik Training and Research (Department of Psychiatrics) Hospital, Istanbul Aydın University V. M. Medical Park Florya Hospital, and Selcuk University Faculty of Medicine Psychiatry Outpatient Clinics, Konya, Turkey. The diagnoses encompassed detailed medical and psychiatric interviews that used the ADHD Self Report Scaling Test (ASRS) and the Young Mania Rating Scale (YMRS) and Hamilton Depression Rating Scale (HDRS) [40,41,42] for ADHD and BP-M, respectively. Individuals with a history of lifetime drug or alcohol use and comorbidities with other mental disorders were excluded from the study. For each group (ADHD or BP-M), subjects were chosen from patients undergoing identical medical treatment.
Blood serum samples were obtained from 41 patients placed in the BP-M group and 49 in the ADHD group. Furthermore, 49 healthy individuals were chosen from the staff members and students of Istanbul Kultur University to form the control group (C group). The selected members of the C group had no history of psychopathology or major medical conditions, including Alzheimer’s and Parkinson’s diseases, heart attack, angina, cancer, diabetes, and rheumatoid arthritis. The distributions of gender (C: 29 women, 20 men; ADHD: 27 women, 22 men; BP-M: 22 women, 19 men) and age of participants in the various groups are identical. In the case of the ages, mean, standard deviation, and variance of the distributions for the C, ADHD, and BP-M groups, they are 22.02, 3.0855, and 9.5204; 21.88, 3.3269, and 11.0680; and 22.93, 3.3793, and 11.4195, respectively, with t-test values for the pairs C/ADHD, C/BP-M, and ADHD/BP-M, at the 0.05 significant level, being −1.30931, −1.3182, and −1.4774 (different variances assumed), which correspond to p-values of 0.1967, 0.1949, and 0.1474, indicating that the distributions are identical to the used confidence level.
This study was approved by the Ethics Committees of the Istanbul Aydın University V. M. Medical Park Florya Hospital, Istanbul, Turkey (date: 19 May 2021), and Koç University, Istanbul, Turkey (date: 24 February 2016). Every participant was given a written informed consent form and received a comprehensive explanation of the study.

2.1.2. Samples Preparation

Five milliliters of the gathered blood samples were permitted to clot and subsequently centrifuged at 14,000 rpm for 10 min to separate the serum from the cellular material. The resulting serum samples were then aliquoted into Eppendorf tubes and promptly frozen at −80 °C. The maximum time of storage of the frozen samples until Raman spectra collection was two weeks.

2.2. Spectroscopic Phase

2.2.1. Sample Measurements

In the present investigation, Raman spectroscopy was used instead of infrared spectroscopy (which was used in our previous study on children and adolescents) [29]. The main advantage of Raman spectroscopy for the purposes of this study is that this technique is much less sensitive to the presence of water (which is a strong IR absorber but a weak Raman scatterer), so that drying of the samples prior to spectra collection is not required, simplifying the experimental procedure. For obtaining the Raman spectra, the unfrozen blood serum samples (1 μL) were placed on an aluminum foil and used without additional treatment. The spectra were recorded on the top of the drops using a micro-Raman (50× Metrohm objective RML150A, infinity-corrected, working distance 9.15 mm, focal length 4 mm, numerical aperture 0.55) B&W-Tek i-Raman Plus-785 system, equipped with a High-Quantum-Efficiency CCD Array (−25 °C) with excitation at 785 nm (laser power at the sample: 280 mW), an integration time of 30 s, and 32 scans. For each sample, five spectra (within the 450–3050 cm−1 spectral range) were collected from different locations. These spectra were used in the subsequent spectral and statistical analyses.

2.2.2. Data Pre-Processing

Before statistical analysis, the Raman spectra were only pre-processed by performing baseline correction and normalization. The baseline correction was applied simultaneously to all samples using the “adaptive algorithm” implemented in Spectragryph [43], with the coarseness parameter being equal to 8 and no offset. The “adaptive algorithm” creates a baseline that tightly fits to the bottom of spectra, allowing us to remove broad underlying features (like fluorescence background in Raman spectra) while keeping actual peaks. The coarseness parameter defines the tightening of the fit. The algorithm is a single-run, non-iterating algorithm. It creates a baseline by applying a 0% percentile smoothing, followed by a moving average smoothing, with the same interval size for both steps (coarseness translates to interval size) [43]. After the base line correction, all spectra were area-normalized in UnscramblerTM (Version 10.5) [44], and, in order to detect outliers, the obtained data were subjected to Principal Component Analysis (PCA) [45,46,47] using the NIPALS (Nonlinear Iterative Partial Least-Squares) algorithm [48]. The average spectra for each sample were then obtained, which formed the data matrix (139 × 1348 dimensional). The global mean spectra for a given group (ADHD, BP-M, C) were also obtained for comparison purposes.

2.3. Statistical Phase

Classification Model Development and Testing

Hierarchical clustering (HC) was applied to all samples as a first non-supervised approach to examine their similarity according to Ward’s criterion with squared Euclidean metrics [49,50]. Partial least-squares discriminant analysis (PLS-DA) [51,52,53,54] was chosen to develop the classification model, with internal full cross-validation being used in the calibration procedure [55].
For developing and testing the classification model, a total of 139 samples were used, 41 belonging to the BP-M group, and 49 to the ADHD and C groups. The calibration set included 100 samples (30 for BP-M and 35 for the remaining groups), whereas the test set was formed by 11 samples belonging to the BP-M group and 14 samples of each one of the other two groups, making a total of 39 samples. The samples used for calibration and testing were randomly chosen.
The chemometrics analyses were performed using UnscramblerTM (Version 10.5) [44].

3. Results and Discussion

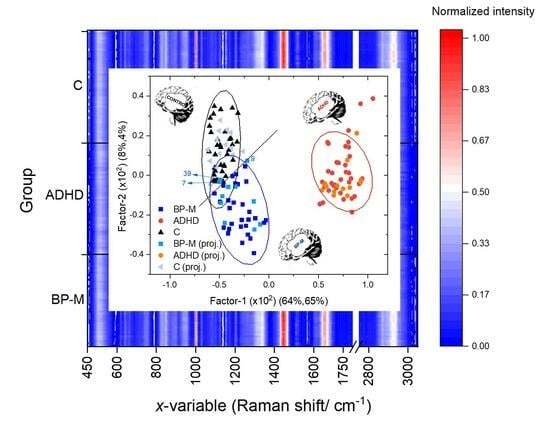
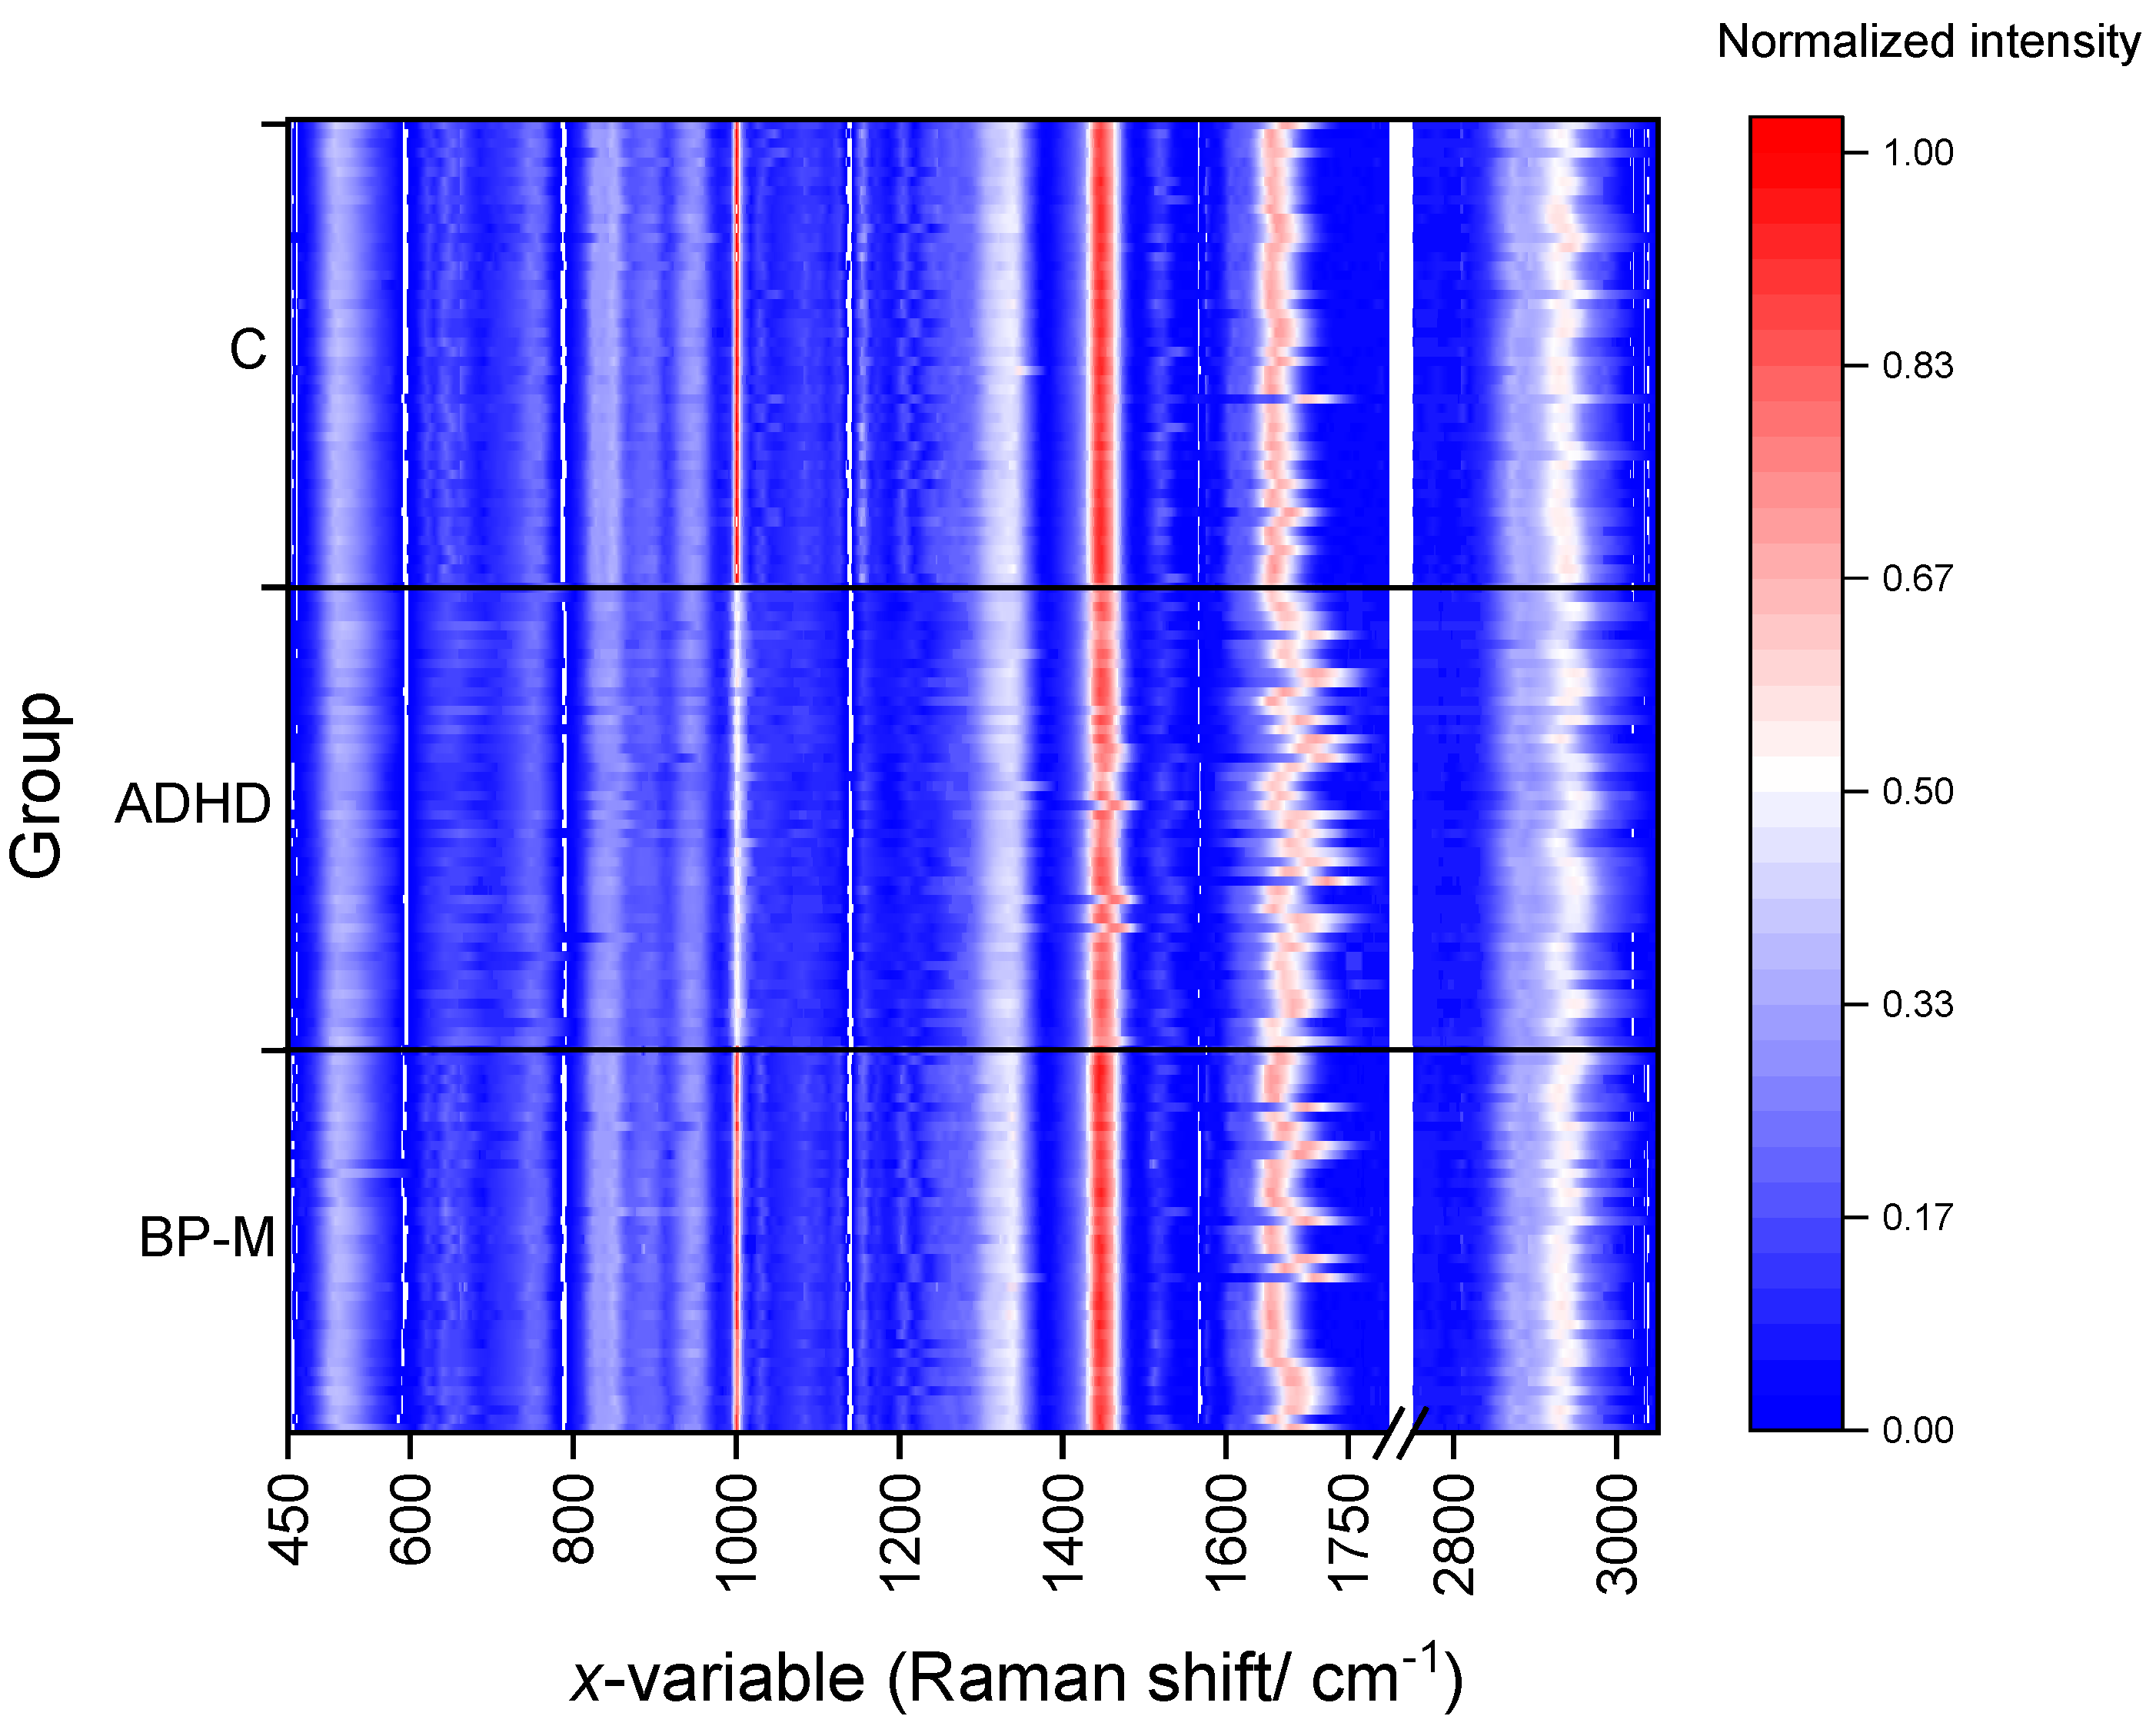
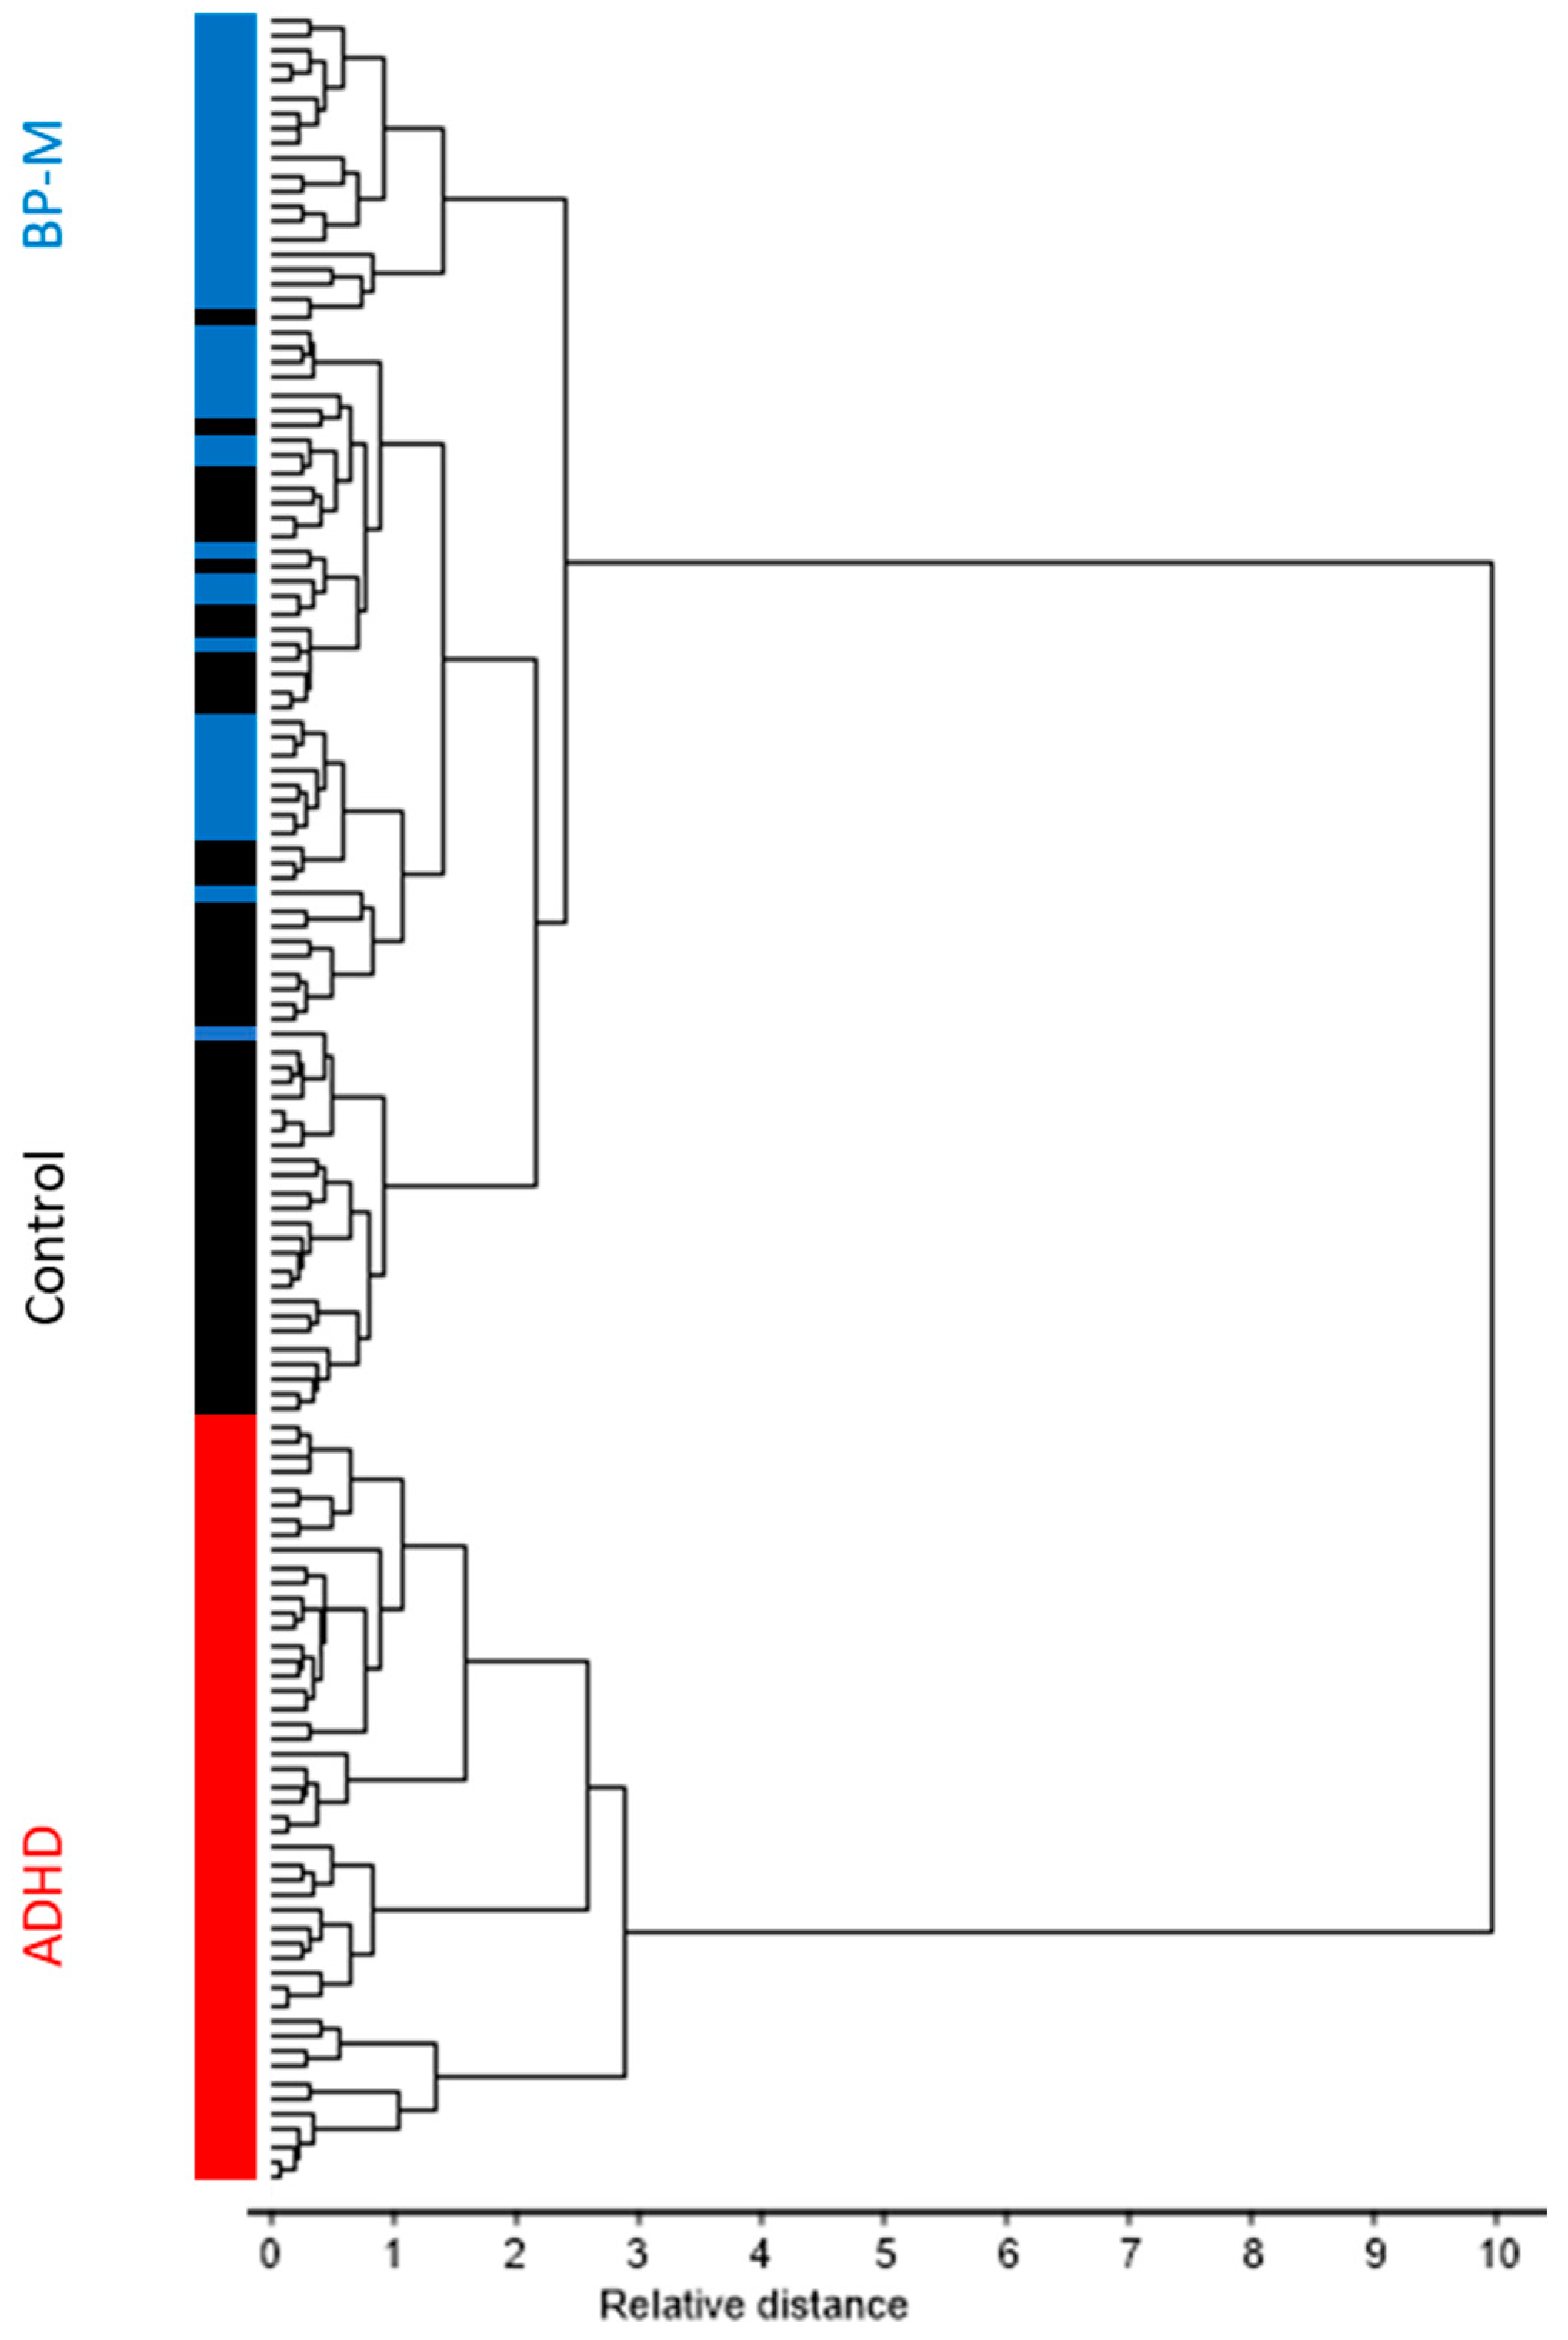
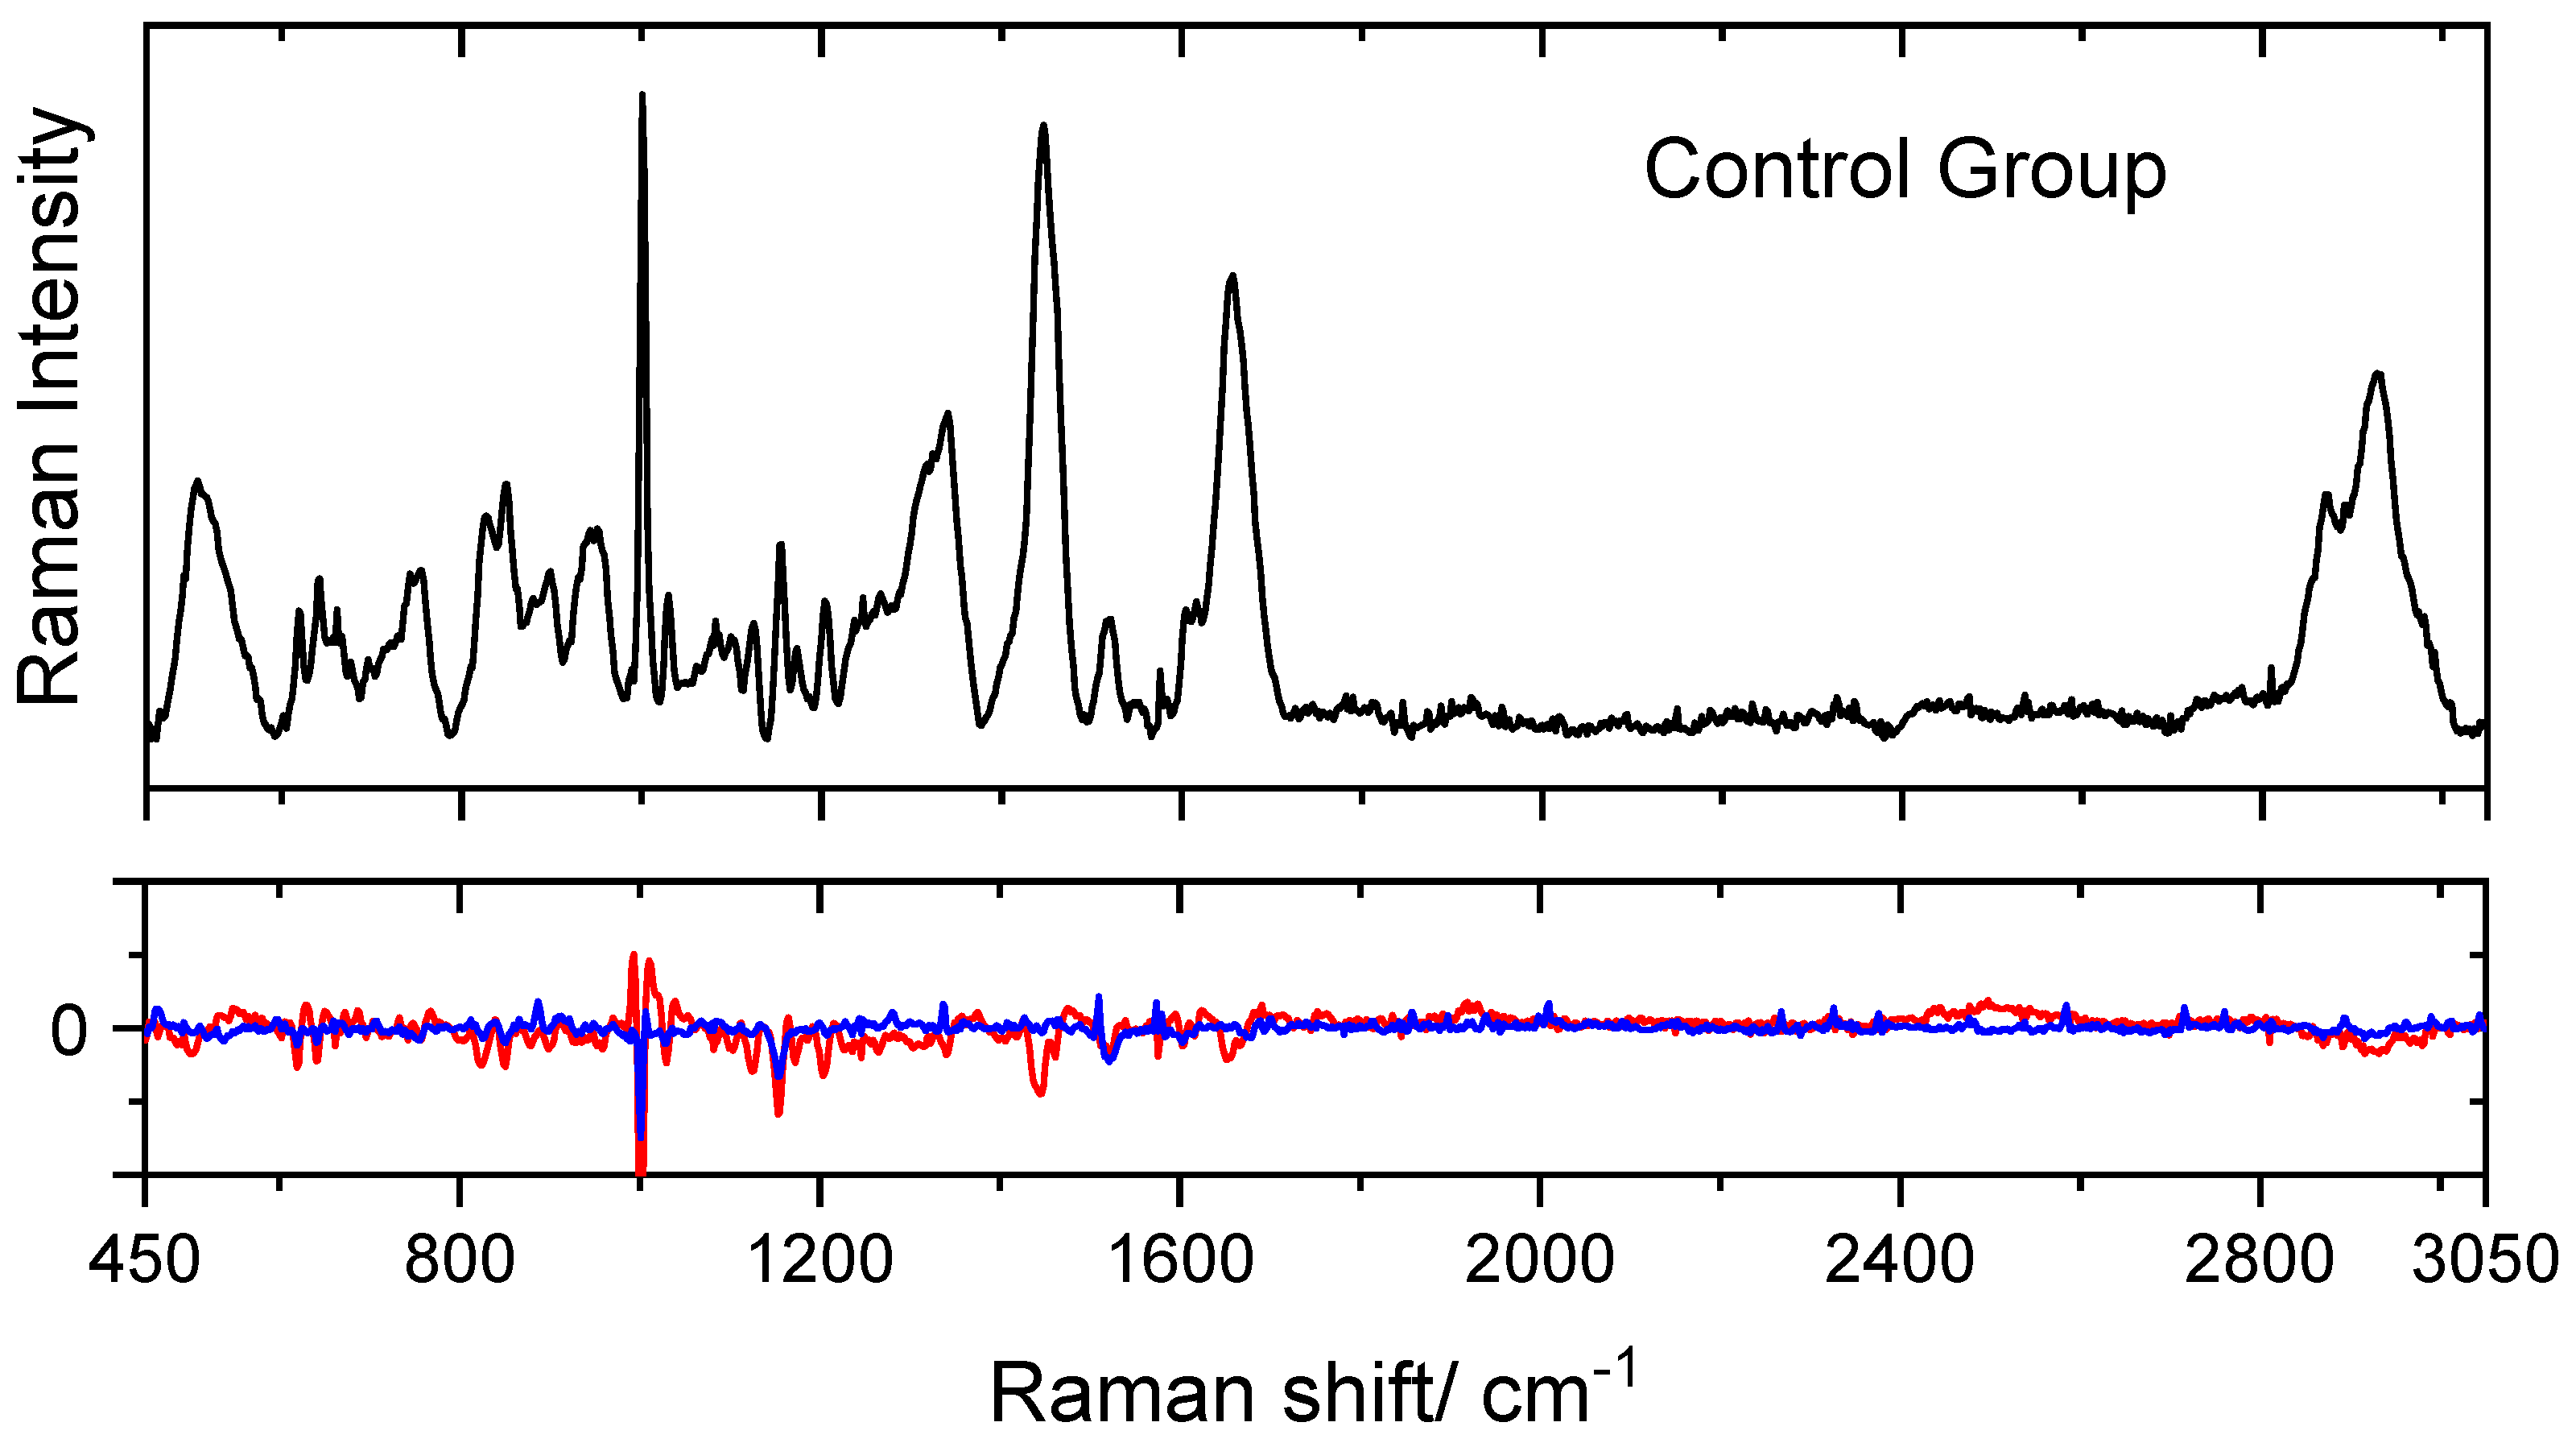
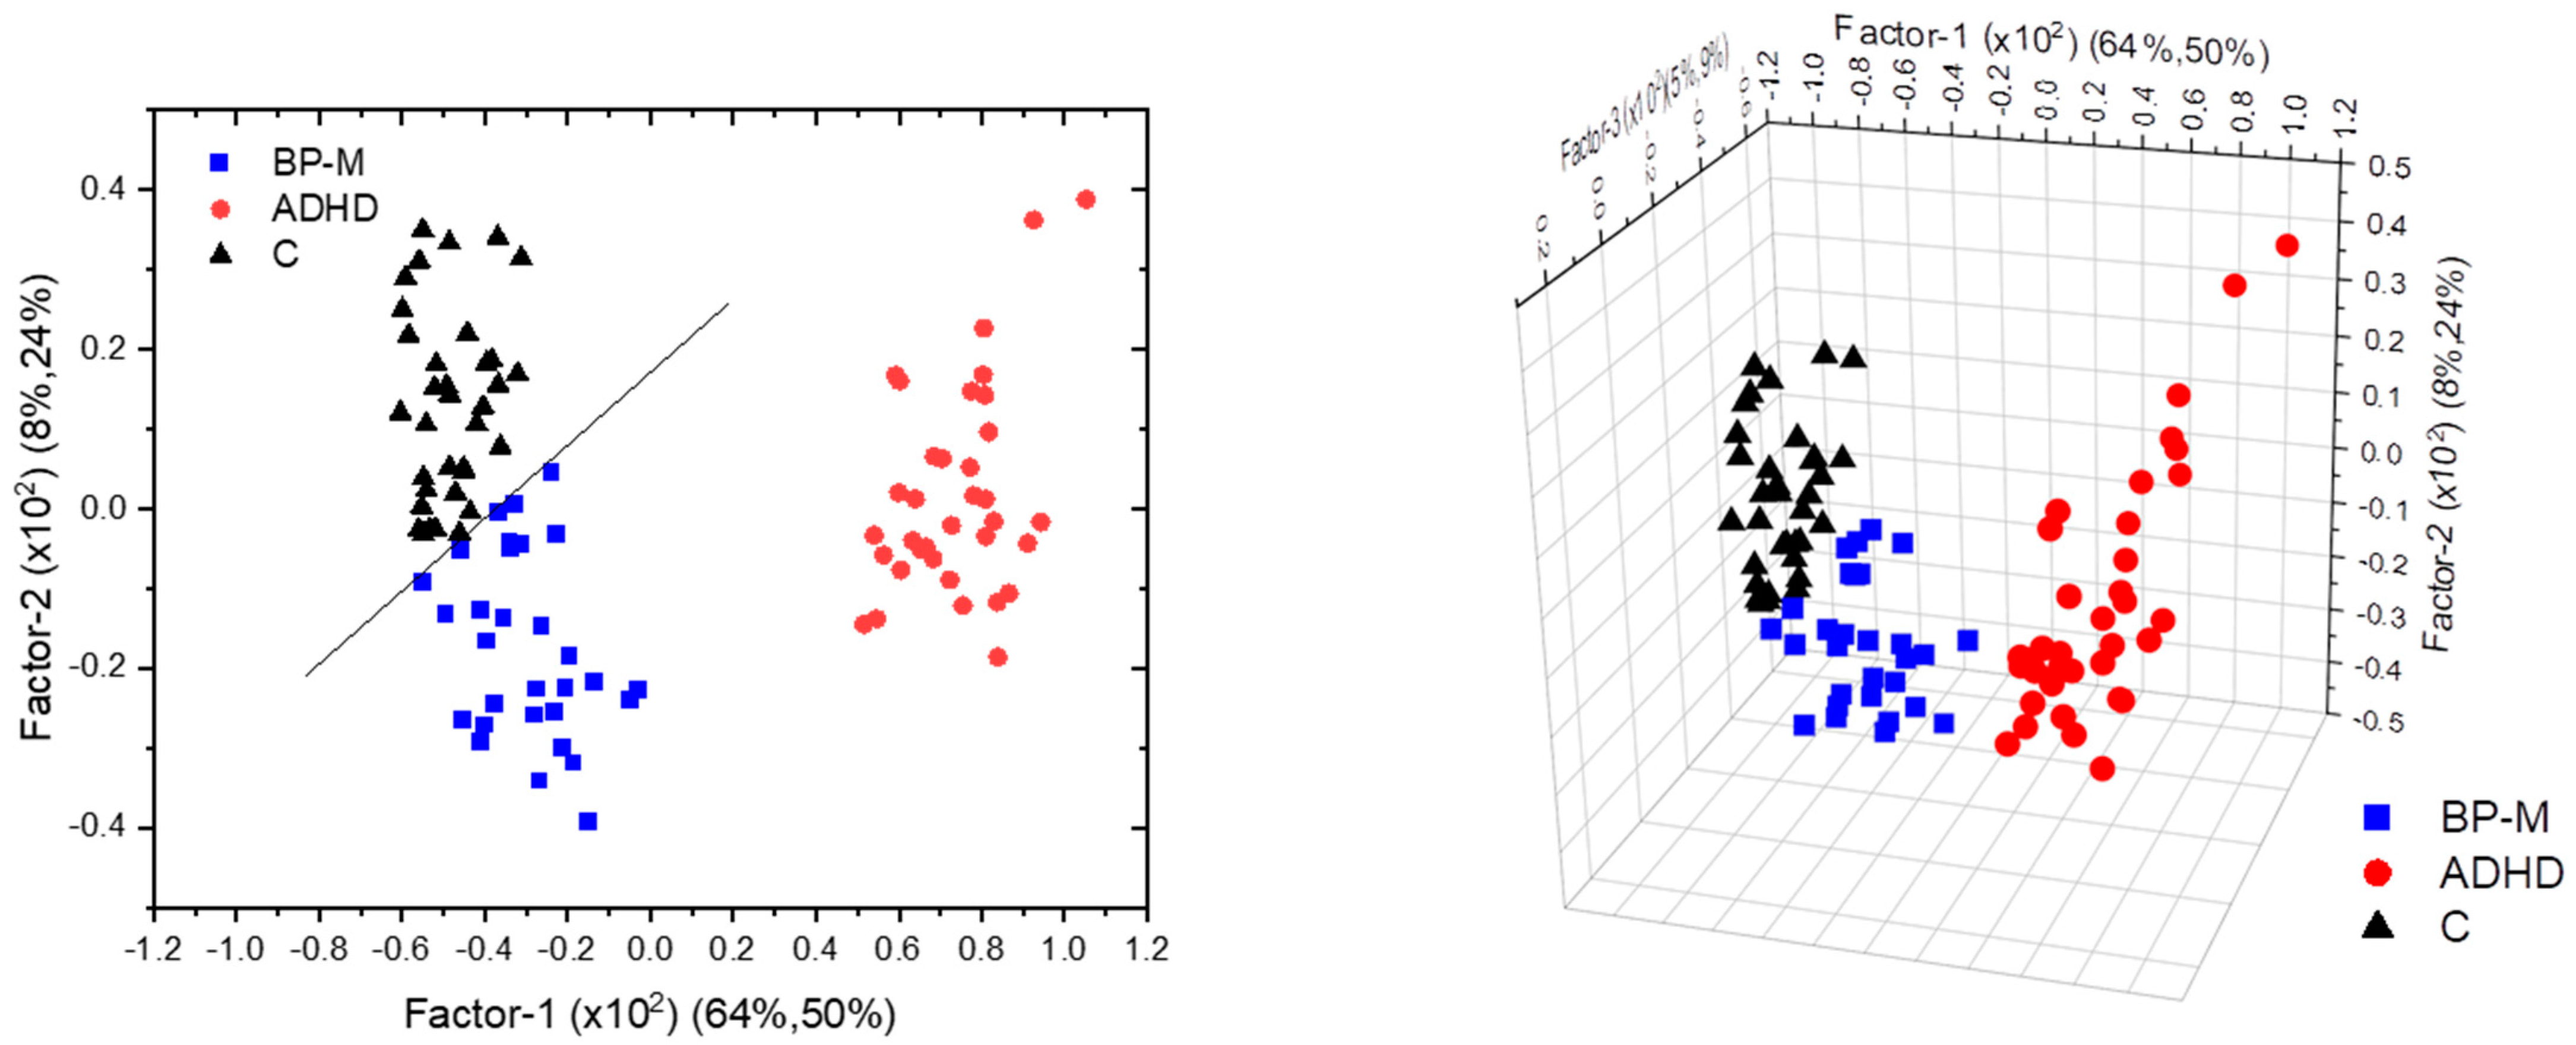
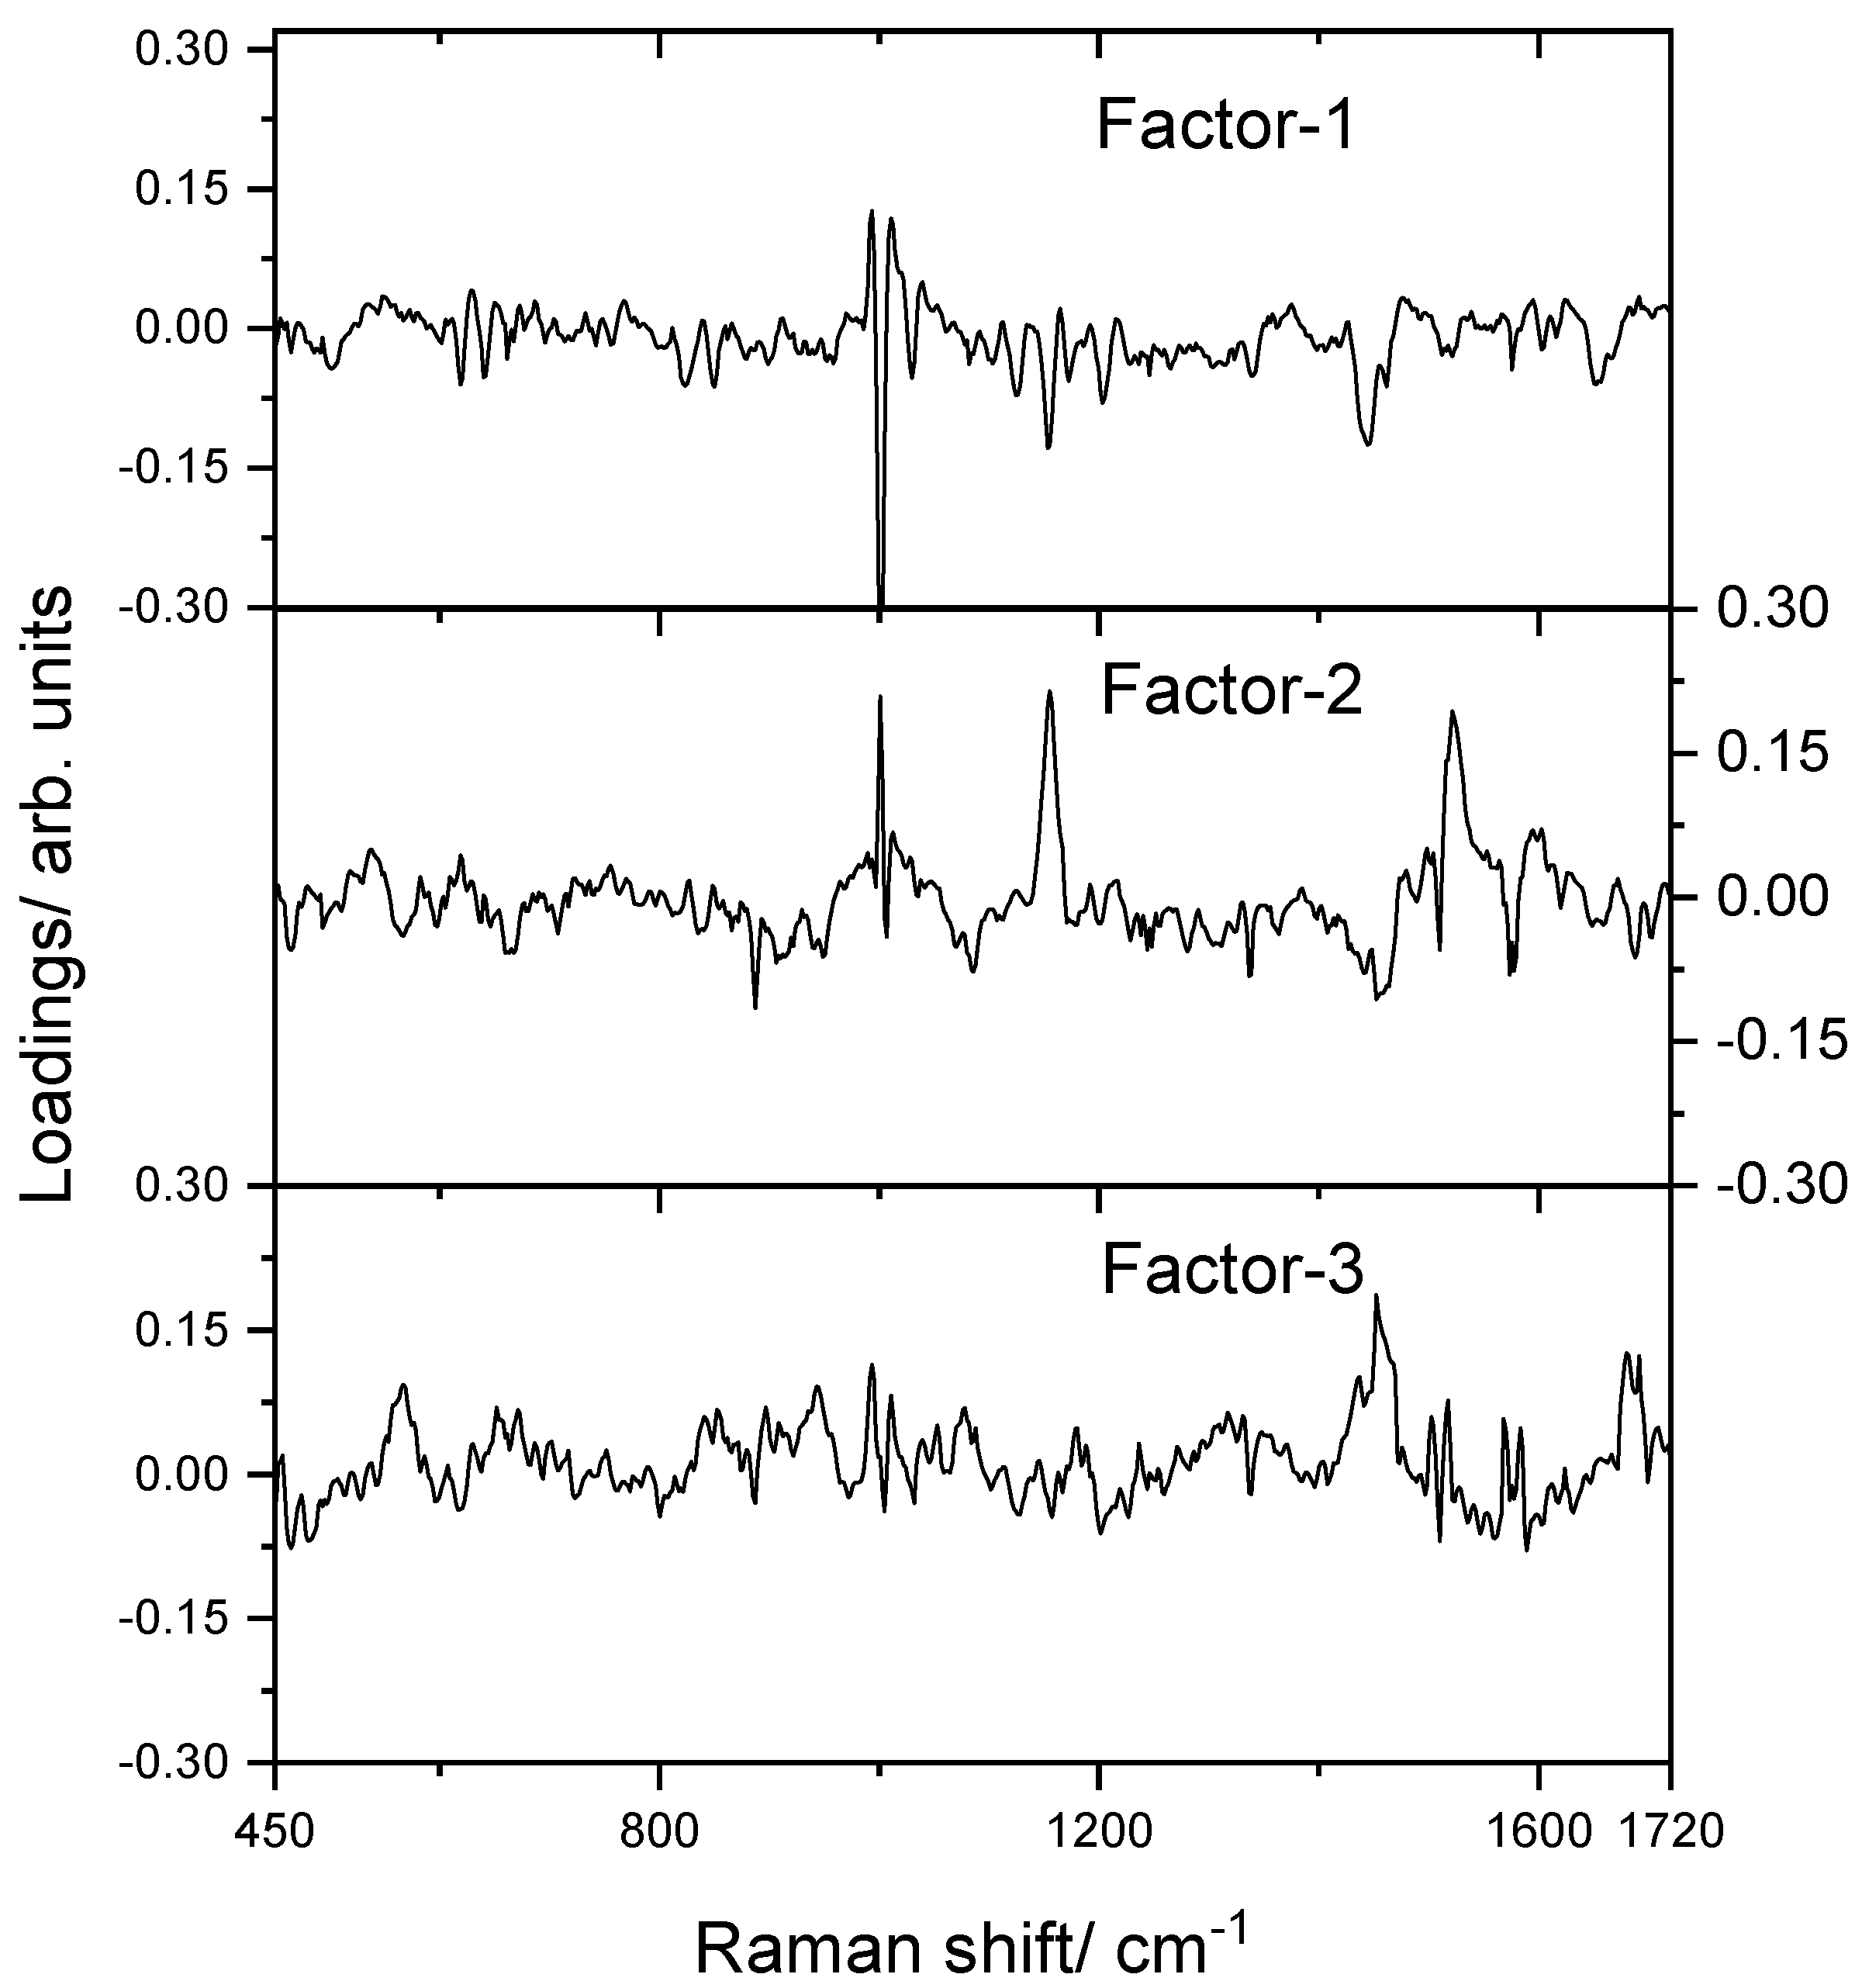
3.1. Preliminary Analysis of the Data

Following pre-processing, the data were first examined using the analysis of the global mean spectra difference profiles, the heat map method (which is a general graphical scheme allowing us to visualize attribute values by class in a two-way matrix [56]), and hierarchical cluster analysis. The spectra show the usual Raman profile of blood serum, and the band assignments are summarized in Table 1 according to the literature [28,57,58,59,60,61], although one must note that these assignments are necessarily an oversimplification due to the extensive band overlapping of different types of constituents of the studied material.
After pre-processing as described in Section 2.2.2., the normalized spectra of the C, BP-M, and ADHD groups show an average standard deviation in the variables of 9.9%, 11.6%, and 16.5%, respectively, indicating that the samples of the control group are more similar to each other than those belonging to the ADHD and BP-M groups, which could be anticipated considering the illnesses’ variability, which should impact the blood serum’s biochemistry.
Figure 1 depicts the global mean Raman spectrum of the control group, together with the difference Raman spectra generated upon subtraction of this spectrum from the global mean spectra of the ADHD and BP-M groups. Figure 2 presents the heat map for the samples, where the values (normalized Raman intensities) are represented by colors, and the X and Y axes relate to variables (Raman shifts) and samples, respectively, the latter being gathered according to their class: C, ADHD, and BP-M.
Although, as could be expected, the global mean spectra of the different groups look rather similar, both the difference spectra profiles shown in Figure 1 and the heat map method presented in Figure 2 reveal that the different groups of samples (more visibly ADHD samples compared to the remaining) exhibit discernible patterns, a result that is also clearly shown in the similarity test performed on the samples by using the hierarchical clustering method (Figure 3).
In the low-frequency region (in the ca. 500–600 cm−1 range), the spectra of ADHD patients exhibit a generally slightly higher intensity in comparison with those of the control healthy individuals, while those of the BP-M patients exhibit the opposite trend. On the other hand, between ca. 1050 and 1500 cm−1, as well as between 2900 and 3000 cm−1, the spectra of the ADHD samples are somewhat less intense than those of the control group (and BP-M group) (see Figure 1). The region between 900 and 1100 cm−1, where the most prominent band is found due to phenylalanine (around 1000 cm−1), also shows clearly distinct patterns in the average spectra of the three groups. We will avoid speculating on the assignment of these changes in the band intensities to variations in the relative amount of specific types of biomolecules that are present in the samples of the different groups of individuals, due to the compositional complexity of the studied samples and, as noted above, extensive band overlapping.
It is worth noting that the hierarchical clustering analysis dendrogram (Figure 3) also reveals that the samples of the control group are more similar to each other than those belonging to the ADHD and BP-M groups, which is in consonance with the results of the relative average standard deviations in the variables that is exhibited by the spectra of the groups.

3.2. Classification Model Development
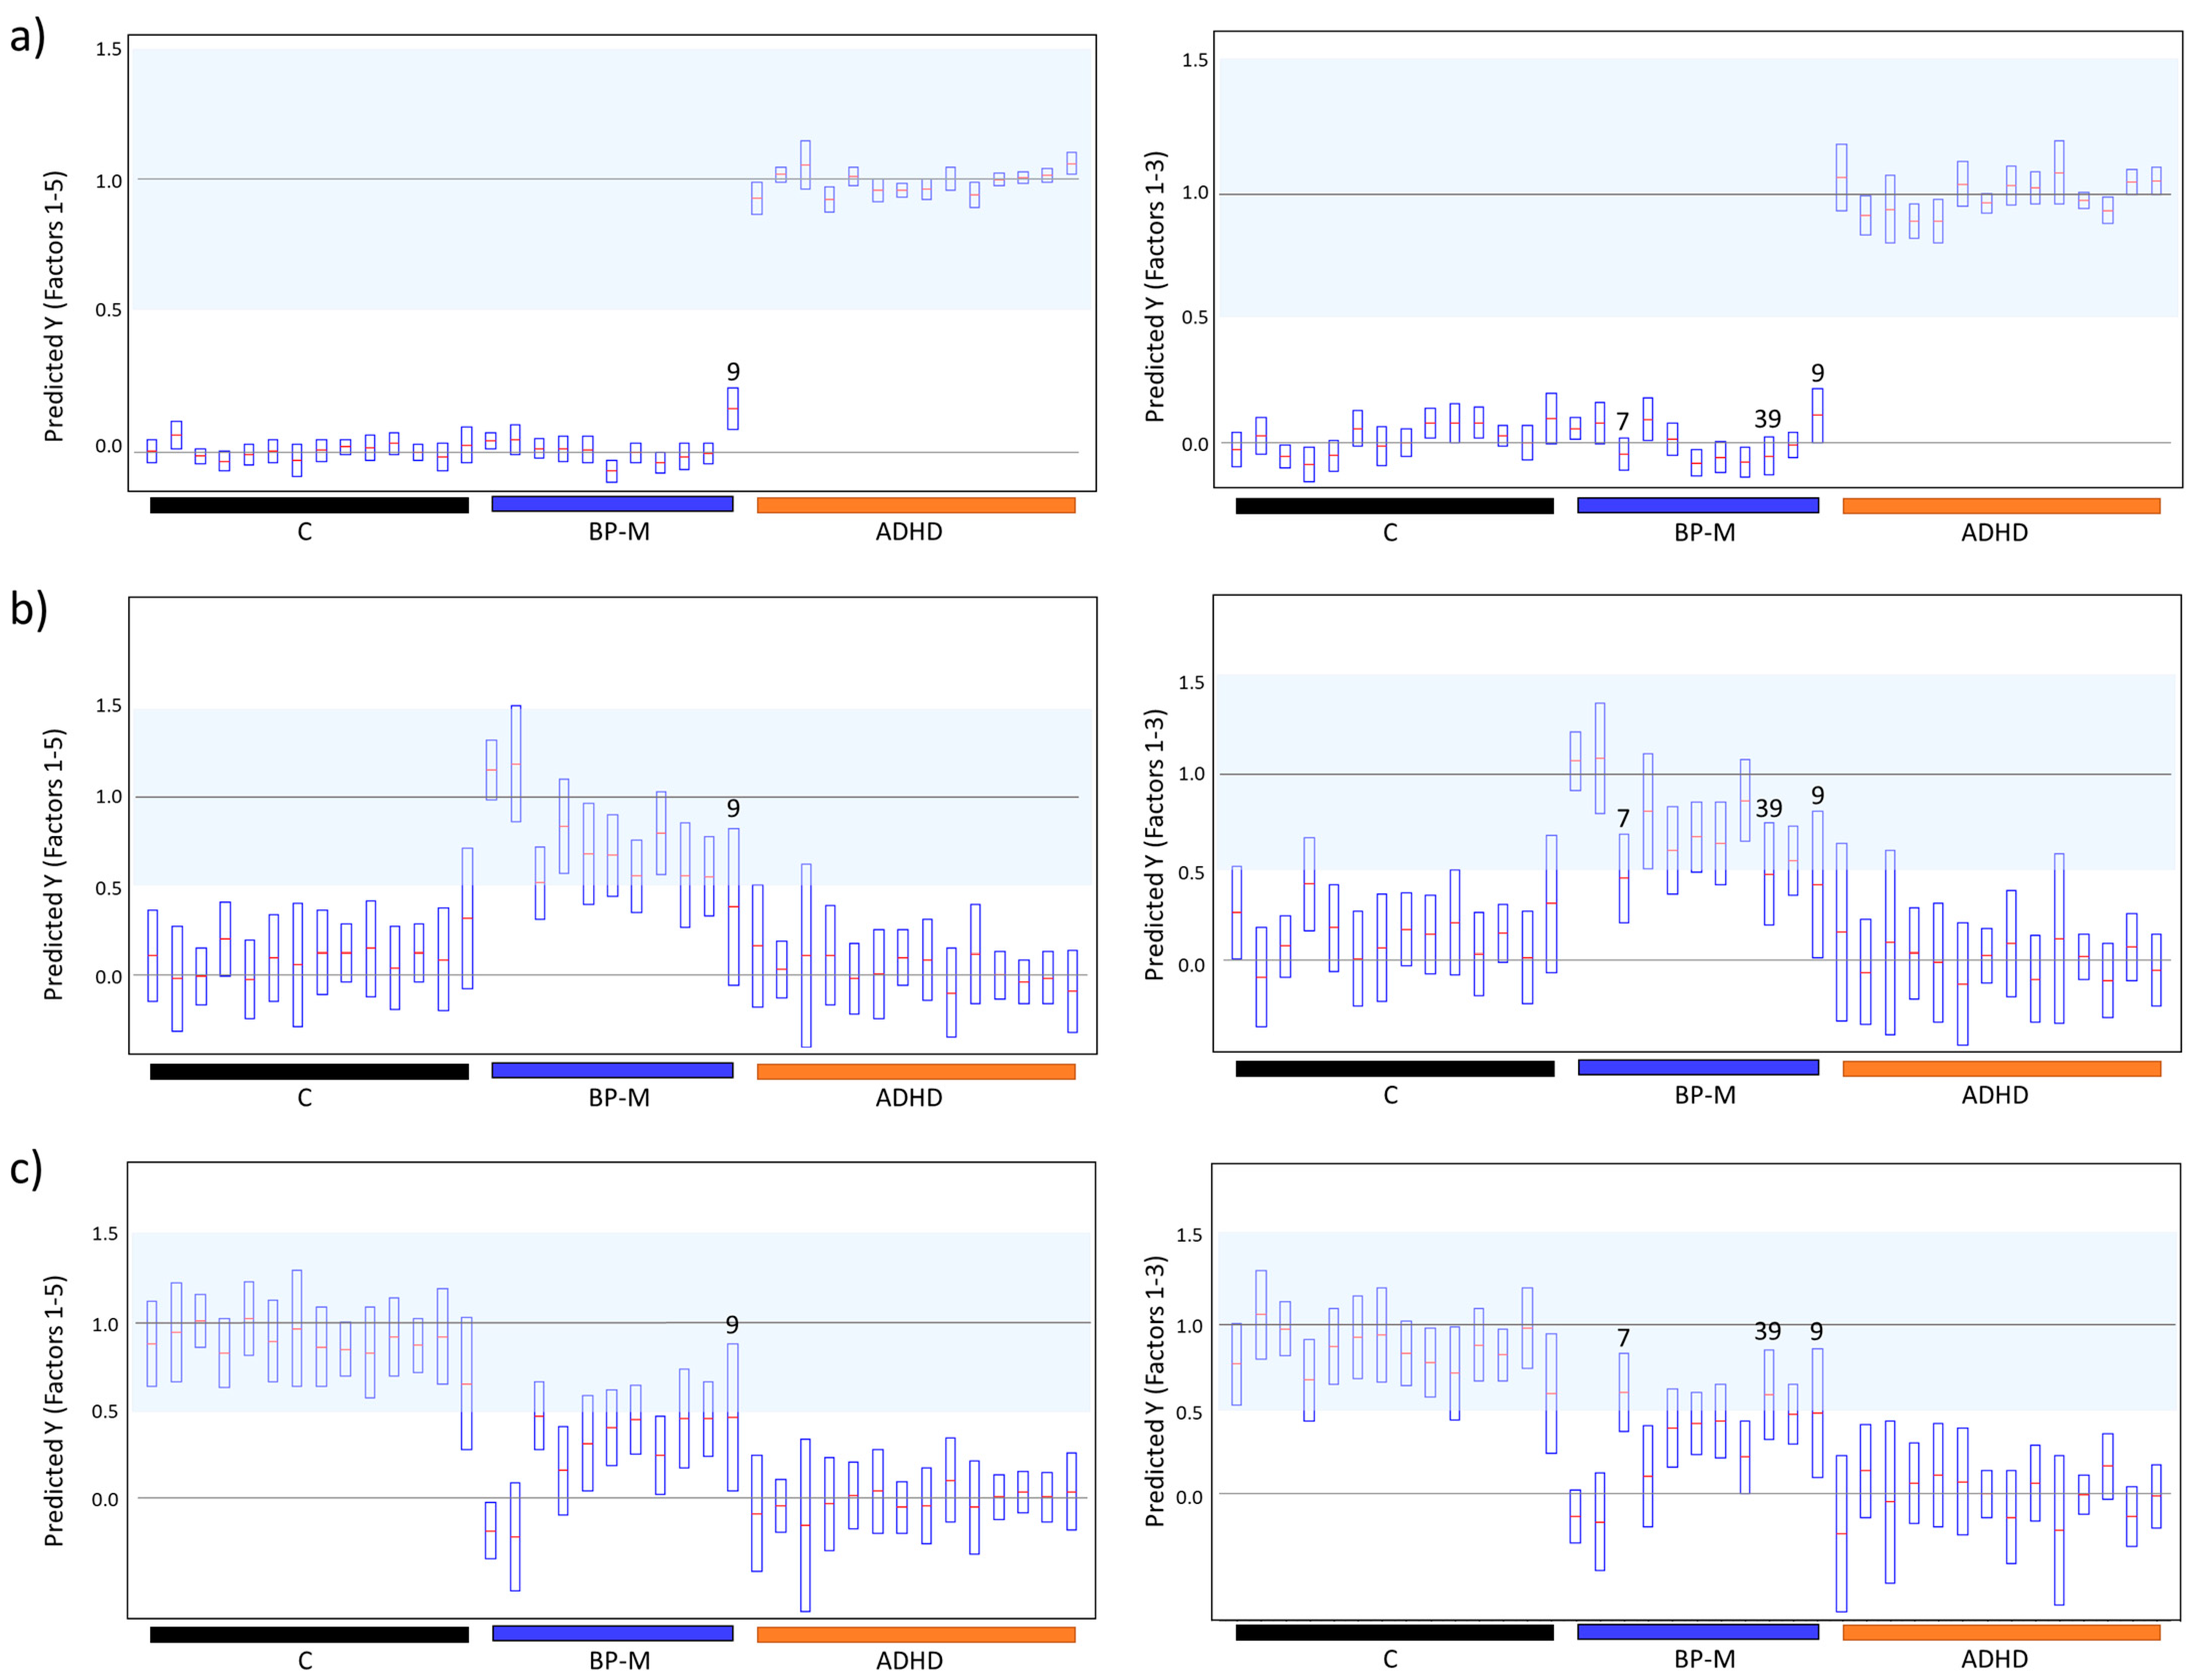
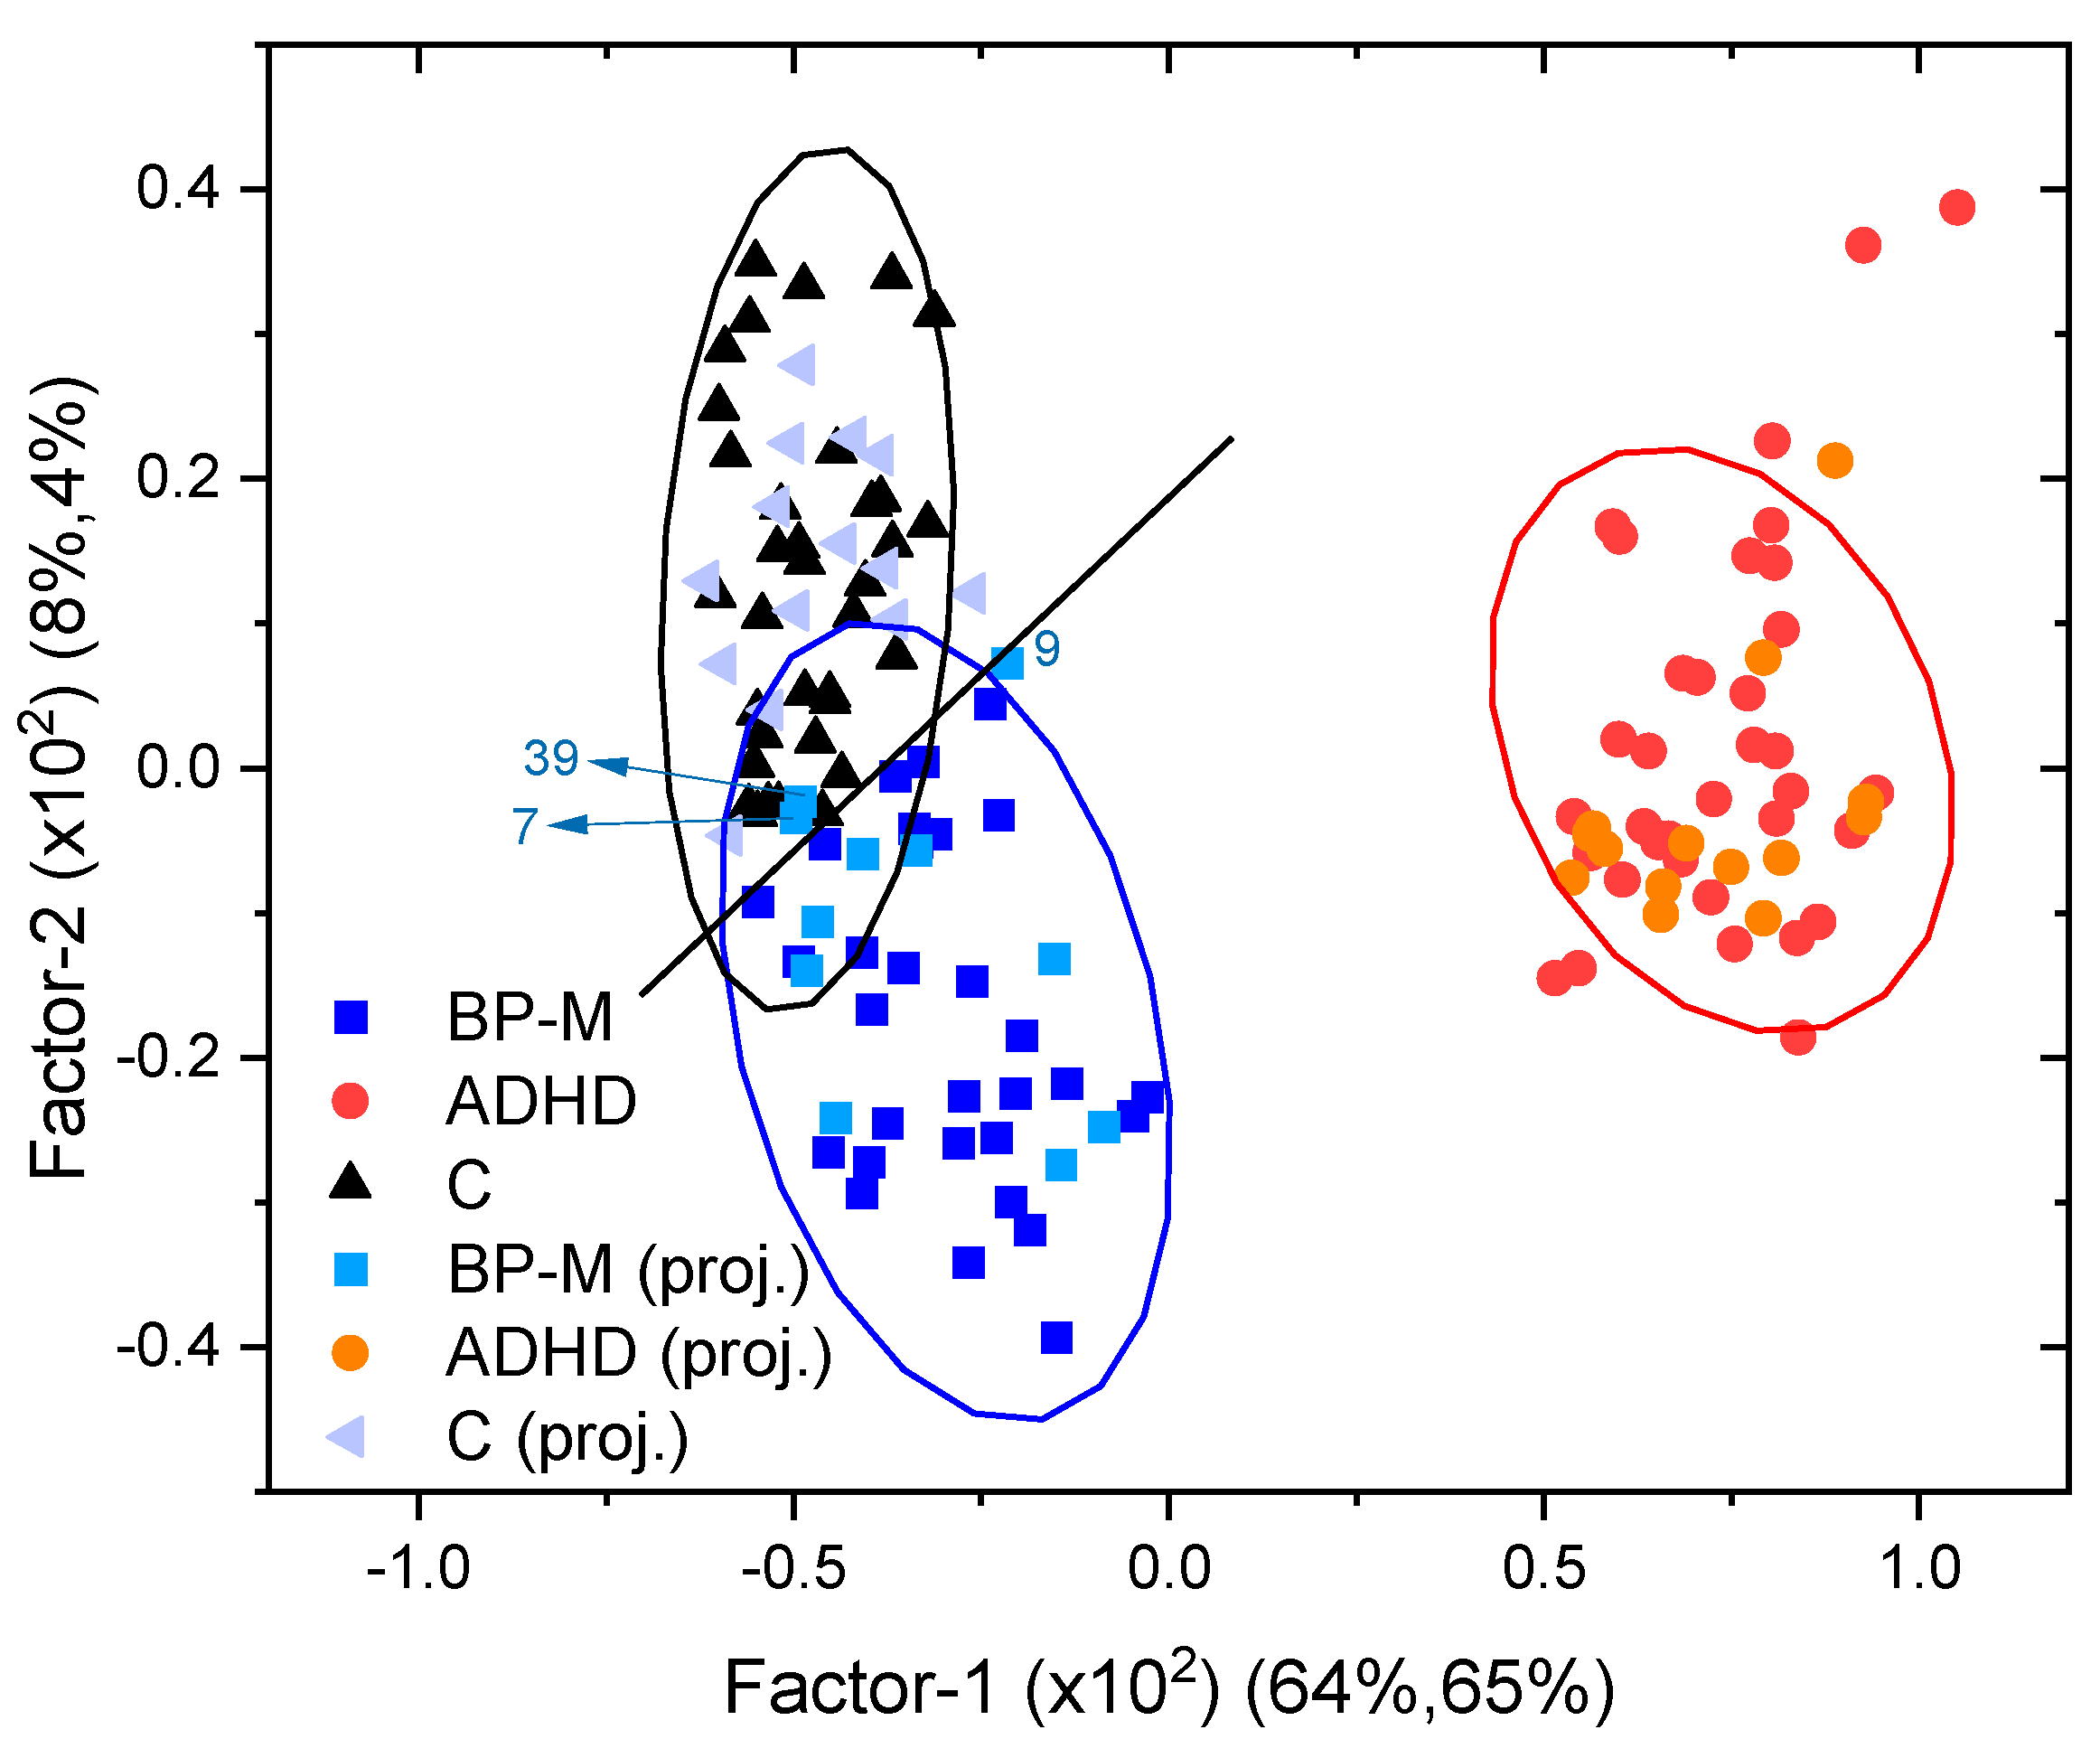
The PLS-DA approach was chosen to construct the classification model. The dataset used in the calibration of the model comprised 100 samples (30 for the BP-M and 35 for the ADHD and C groups), which were randomly chosen. The 450–1720 cm−1 Raman shift range was selected for the model development, with the used data matrix then being 100 × 660-dimensional. Seven latent variables (factors) were used to develop the model, with the first three factors accounting for more than 77% and 83% of variance in the X and Y variables, respectively, in the training set (Factor-1: X, 64%; Y, 50%; Factor-2: X, 8%, Y, 24%; Factor-3: X, 5%, Y, 9%), and 75% and 80% in X and Y in the validation set (Factor-1: X, 63%; Y, 49%; Factor-2: X, 7%, Y, 22%; Factor-3: X, 5%, Y, 9%).
Figure 4 shows the obtained score plots (2D: Factor-2 vs. Factor-1, and 3D: Factor-1 vs. Factor-2 vs. Factor 3), where the samples belonging to each of the three groups (C, ADHD, or BP-M) give rise to separated clusters. The ADHD samples are discriminated along Factor-1 from the control and BP-M groups, while along Factor-2, the ADHD samples are discriminated from the control ones. Within each group, the samples are mostly scattered along Factors-2 and -3, as shown in the depicted 3D score graph.
The loadings graphs for Factor-1, Factor-2, and Factor-3 are shown in Figure 5. The spectra of the loadings of Factor-1 and Factor-2, which discriminate the ADHD group from both the control and BP-M groups and the BP-M and control groups from each other, respectively, share many similarities with the ADHD minus control and the inverse of the BP-M minus control global means difference spectra that are shown in Figure 4. The similarity is greater in the first case, as could be expected, because the ADHD group appears to be more separated from the control group than the BP-M group (as shown in the score plot shown in Figure 4, and also in consonance with the information extracted from the hierarchical clustering analysis shown in Figure 3). The loadings of Factor-3 express variability in the samples within each group and has (small) contributions from the whole investigated spectral region.

3.3. Predictions

The prediction accuracy of the constructed PLS-DA model was examined using 11 samples belonging to the BP-M group and 14 samples from both the ADHD and control groups that were not used for the model calibration and, as mentioned before, were chosen randomly from the whole set of samples. The test set spectra were pre-processed in the same way as those belonging to the calibration set.
The results of applying the model to the test set are summarized in Figure 6 and Figure 7. The criterion adopted for classification of the samples in a given group was that its predicted y-value falls within ±0.5 relative to the corresponding y reference value, which was taken as 1. The limiting value corresponds to the half distance between the reference y value of the tested class and that of the reference values for the samples that do not belong to the class. According to the used criterion, samples whose predicted y values are < 0.5 for all classes or > 0.5 for more than one class are defined as “outliers” to the classification model. As shown below, the first of these conditions is obeyed by one sample (BP-M-9), while no samples were found to obey the second condition.
Using the first five factors (Factors-1 to -5), the model is able to correctly classify all the tested samples except the BP-M-9 sample (classified as an “outlier”; total accuracy of 97.4%), with the predicted y-values staying within the range of values allowing for their classification into the proper class. Using only the first three factors (Factor-1, Factor-2, and Factor-3), the classifications are still correct for all ADHD and C samples, but in this case, two samples belonging to the BP-M group (samples BP-M-7 and BP-M-39) are incorrectly classified as belonging to the C group (sample BP-M-9 is again classified as an “outlier”), reducing the accuracy of the classification to 92.3%. The deviation parameter, calculated using the Unscrambler software (10.5.1), that is used in this work is a measure of the uncertainty of the predicted y value, and consequently, of the classification. However, problems associated with the practical use of this parameter have been reviewed [62,63]. We will refrain from commenting in detail on the significance of the obtained results in light of this parameter, but in any case, it should be mentioned that when deviations are taken into account, the classification of samples that was achieved by considering five as well as only three factors is still robust in relation to samples belonging to both the ADHD and C groups (with zero and one sample, respectively, showing deviations that extend to outside of the region for the correct classification of the samples in the case of the five-factor classification, and zero and three samples in the case of the classification with only three factors), while the classification of the BP-M samples appears to be less secure, with only four samples being predicted with the extreme values of their deviation within the region for their correct classification (for both three- and five-factor classifications).
A simple additional illustration of the classification capability of the model can be seen in Figure 7, which shows the projections of the test samples on the 2D Factor-2 vs. Factor-1 model score plot. In the figure, the 95% confidence ellipses [64] of the classes for the calibration set are also depicted. It can be seen that only one ADHD sample (ADHD-49) and one BP-M sample (BP-M-9) are projected outside the corresponding 95% confidence ellipse, with all the C samples being projected inside the C group’s 95% ellipse. Figure 7 also clearly shows the intersection area between the ellipses of the C and BP-M groups and highlights the position in the score plot of the two BP-M samples that were classified as C by the three-factor classification (the BP-M-7 and BP-M-39 samples), as well as that of the sample that was classified as an “outlier” by both the three- and five-factor classification (BP-M-9).

4. Conclusions

In the present investigation, Raman spectroscopy and multivariate statistical methods were used to build a prediction model for ADHD vs. BP-M adult patients based on the spectra of their blood serum (a bodily fluid that is easily accessible and widely employed in medical diagnostics). The model is based on an inexpensive and fast spectroscopic technique that is reliable and very sensitive to compositional changes in samples. These qualities facilitate the practical application of the model, which was able to correctly classify all the samples in the test set, with a single exception, when five factors were used to perform the classification (accuracy = 97.4%), indicating that the applied approach is promising for use as a complementary diagnostic instrument in the clinical setting. The present investigation extends our previous study on ADHD in children and adolescents [29] to adults, demonstrating that even in this latter case, where the disorder symptoms are more subtle [1,2,3], the used approach still works appropriately. Furthermore, in the quest to contribute to helping clinicians make a differential diagnosis between ADHD and bipolar disorder (in the manic phase, which shows many behavioral parallels with ADHD [17,18,20,21]), the model was built to be capable of differentiating not only ADHD patients from healthy individuals but also from those who are clinically diagnosed as bipolar (in the main episode).
An important advantage of the approach used here to develop the model is that it considers the whole Raman spectrum (in the 450–1720 cm−1 range) as a holistic signature of the biochemical blood serum’s compositional characteristics (spectroscopic biomarker), surpassing the necessity to search for any specific chemical substance related to the disorders (molecular biomarkers) and the well-known practical difficulties of this approach.
As a final note, it is interesting to mention that the problem investigated in the present study is very complex in nature, and that many variables might be thought to affect the results. Controlling for these multitude of variables is, in practical terms, an impossible task. In this investigation, everything was done to reduce, as much as possible, the putative interference of some of these multiple variables on the results, like, for example, by selecting individuals without known comorbidities and a history of drug or alcohol use, which correspond to variables that are easier to control. Other variables that can putatively interfere with the results were only briefly mentioned here, since it is impossible in the practice to know all the information that is required to judge their effective relevance. Medication and doses being taken by the patients, for example, are among these latter factors, since the responses of individuals to psychiatric medications are known to be very much variable. The assumption adopted in the present study was, then, that the differences due to variables like specific medication and doses (and individuals’ responses to them) are less important in biochemical terms than the effects of the diseases themselves. One can state that this assumption appeared to be validated by the results obtained in the present study, but it has also been corroborated in general terms by many other studies that adopted a similar methodological approach [26,27,28,29,30,31,32,33,34,35,36,37,38,39]. The same reasoning applies also when one considers the fact that the two groups of patients who were investigated herein were distinguishable, even while under treatment.

Author Contributions

Conceptualization: G.O.I.; Spectroscopic and chemometric analyses, manuscript writing, and fund raising: G.O.I. and R.F.; Raman spectroscopy measurements: G.Y.D., G.H. and D.K. Medical investigations: U.M.A., A.K., E.Y. and S.K. All authors have read and agreed to the published version of the manuscript.

Funding

This work is supported by the Scientific and Technological Research Council of Turkey-TUBITAK 1001 Project (project number: 116Z294) and TUBITAK 1002 Project (project number: 121Z110). The CQC-IMS is supported by the Fundação para a Ciência e a Tecnologia (FCT) through projects UI0313B/QUI/2020 (DOI: 10.54499/UIDB/00313/2020), UI0313P/QUI/2020 (DOI: 10.54499/UIDP/00313/2020) and LA/P/0056/2020.

Institutional Review Board Statement

The study was conducted according to the guidelines of the Declaration of Helsinki and approved by the Ethics Committees of the Istanbul Aydın University V. M. Medical Park Florya Hospital, Istanbul, Turkey (date: 19 May 2021), and Koç University, Istanbul, Turkey (date: 24 February 2016).

Informed Consent Statement

Informed consent was obtained from all subjects involved in the study.

Data Availability Statement

Data are contained within the article.

Conflicts of Interest

The authors declare no conflicts of interest.

References

  1. American Psychiatric Association. Diagnostic and Statistical Manual of Mental Disorders, 5th ed.; American Psychiatric Association: Arlington, VA, USA, 2013. [Google Scholar]
  2. Ramsay, J.R. Cognitive Behavioral Therapy for Adult ADHD; Routledge: Oxfordshire, UK, 2007; pp. 25–26. [Google Scholar]
  3. Steinau, S. Diagnostic Criteria in Attention Deficit Hyperactivity Disorder—Changes in DSM 5. Front. Psychiatry 2013, 4, 49. [Google Scholar] [CrossRef]
  4. Kooij, S.J.; Bejerot, S.; Blackwell, A.; Caci, H.; Casas-Brugué, M.; Carpentier, P.J.; Edvinsson, D.; Fayyad, J.; Foeken, K.; Fitzgerald, M.; et al. European Consensus Statement on Diagnosis and Treatment of Adult ADHD: The European Network Adult ADHD. BMC Psychiatry 2010, 10, 67. [Google Scholar] [CrossRef] [PubMed]
  5. Bálint, S.; Czobor, P.; Mészáros, A.; Simon, V.; Bitter, I. Neuropsychological Impairments in Adult Attention Deficit Hyperactivity Disorder: A Literature Review. Psychiatr. Hung. 2008, 23, 324–335. [Google Scholar] [PubMed]
  6. Ginsberg, Y.; Quintero, J.; Anand, E.; Casillas, M.; Upadhyaya, H.P. Underdiagnosis of Attention-Deficit/Hyperactivity Disorder in Adult Patients: A Review of the Literature. Prim. Care Companion CNS Disord. 2014, 16, PCC.13r01600. [Google Scholar] [CrossRef] [PubMed]
  7. Cross River Therapy. ADHD Statistics: How Many People Have ADHD? Key ADHD Statistics and Facts. Available online: https://www.crossrivertherapy.com/adhd-statistics (accessed on 6 January 2024).
  8. Sroubek, A.; Kelly, M.; Li, X. Inattentiveness in Attention-Deficit/Hyperactivity Disorder. Neurosci. Bull. 2013, 29, 103–110. [Google Scholar] [CrossRef] [PubMed]
  9. Faraone, S.V.; Rostain, A.L.; Blader, J.; Busch, B.; Childress, A.C.; Connor, D.F.; Newcorn, J.H. Practitioner Review: Emotional Dysregulation in Attention-Deficit/Hyperactivity Disorder—Implications for Clinical Recognition and Intervention. J. Child Psychol. Psychiatry Allied Discip. 2019, 60, 133–150. [Google Scholar] [CrossRef] [PubMed]
  10. Tenenbaum, R.B.; Musser, E.D.; Morris, S.; Ward, A.R.; Raiker, J.S.; Coles, E.K.; Pelham, W.E. Response Inhibition, Response Execution, and Emotion Regulation among Children with Attention-Deficit/Hyperactivity Disorder. J. Abnorm. Child Psychol. 2019, 47, 589–603. [Google Scholar] [CrossRef]
  11. Millichap, J.G. Chapter 2: Causative Factors. In Attention Deficit Hyperactivity Disorder Handbook: A Physician’s Guide to ADHD, 2nd ed.; Springer Science: New York, NY, USA, 2010. [Google Scholar]
  12. Thapar, A.; Cooper, M.; Eyre, O.; Langley, K. What have we learnt about the causes of ADHD? J. Child Psychol. Psychiatry Allied Discip. 2013, 54, 3–16. [Google Scholar] [CrossRef] [PubMed]
  13. Mourek, J.; Pokorny, J. ADHD—What is the Meaning of Sex-dependent Incidence Differences? Prague Med. Rep. 2022, 123, 215–224. [Google Scholar] [CrossRef]
  14. Momany, A.M.; Kamradt, J.M.; Ullsperger, J.M.; Elmore, A.L.; Nigg, J.T.; Nikolas, M.A. Sex Moderates the Impact of Birth Weight on Child Externalizing Psychopathology. J. Abnorm. Psychol. 2017, 126, 244–256. [Google Scholar] [CrossRef]
  15. Shaw, J.C.; Crombie, G.K.; Zakar, T.; Palliser, H.K.; Hirst, J.J. Perinatal Compromise Contributes to Programming of GABAergic and Glutamatergic Systems Leading to Long-term Effects on Offspring Behaviour. J. Neuroendocrinol. 2020, 32, e12814. [Google Scholar] [CrossRef] [PubMed]
  16. National Institute for Health and Care Excellence. Attention Deficit Hyperactivity Disorder: Diagnosis and Management; National Guideline Centre: London, UK, 2019. [Google Scholar]
  17. Walitza, S.; Drechsler, R.; Ball, J. The School Child with ADHD. Ther. Umsch. 2012, 69, 467–473. [Google Scholar] [CrossRef] [PubMed]
  18. Wilens, T.E.; Spencer, T.J. Understanding Attention-Deficit/Hyperactivity Disorder from Childhood to Adulthood. Postgrad. Med. 2010, 122, 97–109. [Google Scholar] [CrossRef] [PubMed]
  19. Faraone, S.V.; Bonvicini, C.; Scassellati, C. Biomarkers in the Diagnosis of ADHD—Promising Directions. Curr. Psych. Rep. 2014, 16, 497. [Google Scholar] [CrossRef] [PubMed]
  20. Levent, L.; Tümkaya, S.; Ateşçi, F.; Tüysüzoğlu, H.; Varma, G.; Oğuzhanoğlu, N. A Neuropsychological Comparison of Bipolar Disorder and Adult Attention Deficit Hyperactivity Disorder. Turk Psikiyatri Derg. 2014, 23, 1–8. [Google Scholar]
  21. Marangoni, C.; De Chiara, L.; Faedda, G.L. Bipolar Disorder and ADHD: Comorbidity and Diagnostic Distinctions. Curr. Psych. Rep. 2015, 17, 67. [Google Scholar] [CrossRef] [PubMed]
  22. Tas, C.; Brown, E.C.; Aydemir, O.; Brüne, M.; Lysaker, P.H. Metacognition in Psychosis: Comparison of Schizophrenia with Bipolar Disorder. Psychiatry Res. 2014, 219, 464–469. [Google Scholar] [CrossRef] [PubMed]
  23. Yang, E.; Tadin, D.; Glasser, D.; Hong, S.W.; Blake, R.; Park, S. Visual Context Processing in Bipolar Disorder: A Comparison with Schizophrenia. Front. Psychol. 2013, 4, 569. [Google Scholar] [CrossRef] [PubMed]
  24. Mueser, K.T.; Drake, R.E.; Wallach, M.A. Dual Diagnosis: A Review of Etiological Theories. Addict. Behav. 1998, 23, 717–734. [Google Scholar] [CrossRef]
  25. Thome, J.; Ehlis, A.C.; Fallgatter, A.J.; Krauel, K.; Lange, K.W.; Riederer, P.; Romanos, M.; Taurines, R.; Tucha, O.; Uzbekov, M.; et al. Biomarkers for attention-deficit/hyperactivity disorder (ADHD). A consensus report of the WFSBP task force on biological markers and the World Federation of ADHD. World J. Biol. Psychiatry 2012, 13, 379–400, This is a comprehensive review on clinical, imaging, genetic and proteomic markers and ADHD. The review concluded that, although some promising candidates such as olfactory sensitivity, substantial echogenicity, no biomarkers for ADHD are available. [Google Scholar] [CrossRef]
  26. Ogruc Ildiz, G.; Bayari, S.; Yorguner, N.; Fausto, R. Blood Serum Infrared Spectra Based Chemometric Models for Auxiliary Diagnosis of Autism Spectrum Disorder. In Autism Spectrum Disorder: Diagnosis and Treatment; El-Bazm, A.S., Mahmoud, A., Eds.; Elsevier Science: Amsterdam, The Netherlands, 2021; Volume 1: Imaging and Signal Analysis, Chapter 10; pp. 185–213. [Google Scholar]
  27. Ogruc Ildiz, G.; Bayari, S.; Karadag, A.; Kaygisiz, E.; Fausto, R. Fourier Transform Infrared Spectroscopy Based Complementary Diagnosis Tool for Autism Spectrum Disorder in Children and Adolescents. Molecules 2020, 25, 2079. [Google Scholar] [CrossRef] [PubMed]
  28. Ogruc Ildiz, G.; Bayari, S.; Aksoy, U.M.; Yorguner, N.; Bulut, H.; Yilmaz, S.S.; Halimoglu, G.; Nur Kabuk, H.; Yavuz, G.; Fausto, R. Auxiliary Differential Diagnosis of Schizophrenia and Phases of Bipolar Disorder Based on the Blood Serum Raman Spectra. J. Raman Spectrosc. 2020, 51, 2233–2244. [Google Scholar] [CrossRef]
  29. Ogruc Ildiz, G.; Karadag, A.; Kaygisiz, E.; Fausto, R. PLS-DA Model for the Evaluation of Attention Deficit and Hyperactivity Disorder in Children and Adolescents through Blood Serum FTIR Spectra. Molecules 2021, 26, 3400. [Google Scholar] [CrossRef] [PubMed]
  30. Shaw, R.A.; Mantsch, H.H. Infrared Spectroscopy of Biological Fluids in Clinical and Diagnostic Analysis. In Encyclopedia of Analytical Chemistry; John Wiley & Sons, Ltd.: Hoboken, NJ, USA, 2006; Volume 2, pp. 1–24. [Google Scholar]
  31. Ahmed, S.S.S.J.; Santosh, W.; Kumar, S.; Christlet, T.H.T. Neural Network Algorithm for the Early Detection of Parkinson’s Disease from Blood Plasma by FTIR Micro-Spectroscopy. Vib. Spectrosc. 2010, 53, 181–188. [Google Scholar] [CrossRef]
  32. Deleris, G.; Petibois, C. Applications of FT-IR Spectrometry to Plasma Contents Analysis and Monitoring. Vib. Spectrosc. 2003, 32, 129–136. [Google Scholar] [CrossRef]
  33. Khanmohammadi, M.; Ghasemi, K.; Garmarudi, A.B.; Ramin, M. Diagnostic Prediction of Renal Failure from Blood Serum Analysis by FTIR Spectrometry and Chemometrics. Spectrochim. Acta Part A Mol. Biomol. Spectrosc. 2015, 136, 1782–1785. [Google Scholar] [CrossRef] [PubMed]
  34. Mostaco-Guidolin, L.B.; Bachmann, L. Application of FTIR Spectroscopy for Identification of Blood and Leukemia Biomarkers: A Review over the Past 15 Years. Appl. Spectrosc. Rev. 2011, 46, 388–404. [Google Scholar] [CrossRef]
  35. Erukhimovitch, V.; Talyshinsky, M.; Souprun, Y.; Huleihel, M. FTIR Spectroscopy Examination of Leukemia Patients Plasma. Vibrat. Spectrosc. 2006, 40, 40–46. [Google Scholar] [CrossRef]
  36. Lewis, P.D.; Lewis, K.E.; Ghosal, R.; Bayliss, S.; Lloyd, A.J.; Wills, J.; Godfrey, R.; Kloer, P.; Mur, L.A.J. Evaluation of FTIR Spectroscopy as a Diagnostic Tool for Lung Cancer Using Sputum. BMC Cancer 2010, 10, 640. [Google Scholar] [CrossRef]
  37. Mordechai, S.; Shufan, E.; Katz Porat, B.S.; Salman, A. Early Diagnosis of Alzheimer’s Disease Using Infrared Spectroscopy of Isolated Blood Samples Followed by Multivariate Analyses. Analyst 2017, 142, 1276–1284. [Google Scholar] [CrossRef]
  38. Krimm, S.; Bandekar, J. Vibrational Spectroscopy and Conformation of Peptides, Polypeptides and Proteins. Adv. Protein Chem. 1986, 38, 181–364. [Google Scholar] [PubMed]
  39. Liu, K.Z.; Shi, M.H.; Mantsch, H.H. Molecular and Chemical Characterization of Blood Cells by Infrared Spectroscopy: A New Optical Tool in Hematology. Blood Cells Mol. Dis. 2005, 35, 404–412. [Google Scholar] [CrossRef] [PubMed]
  40. Ustun, B. The World Health Organization Adult Attention-Deficit/Hyperactivity Disorder Self-Report Screening Scale for DSM-5. JAMA Psychiatry 2018, 74, 520–527. [Google Scholar] [CrossRef] [PubMed]
  41. Young, R.C.; Biggs, J.T.; Ziegler, V.E.; Meyer, D.A. A Rating Scale for Mania: Reliability, Validity and Sensitivity. Br. J. Psychiatry 1978, 133, 429–435. [Google Scholar] [CrossRef] [PubMed]
  42. Hedlund, J.L.; Wieweg, B.W. The Hamilton Rating Scale for Depression: A Comprehensive Review. Operat. Psychiatry 1979, 10, 149–165. [Google Scholar]
  43. Menges, F. Spectragryph—Optical Spectroscopy Software (v. 1.2.16.1). 2021. Available online: www.effemm2.de/spectragryph/ (accessed on 1 January 2024).
  44. CAMO Software Inc. The UnscramblerTM Version 10.5; CAMO A/S: Trondheim, Norway, 2018. [Google Scholar]
  45. Pearson, K. On Lines and Planes of Closest Fit to Systems of Points in Space. Phil. Mag. 1901, 2, 559–572. [Google Scholar] [CrossRef]
  46. Hotelling, H. Analysis of a Complex of Statistical Variables into Principal Components. J. Educat. Psychol. 1933, 24, 417–441, ibidim 498–520. [Google Scholar] [CrossRef]
  47. Hotelling, H. Relations Between Two Sets of Variates. Biometrika 1936, 28, 321–377. [Google Scholar] [CrossRef]
  48. Wold, H. Quantitative Sociology: International Perspectives on Mathematical and Statistical Model Building; Academic Press: New York, NY, USA, 1975; pp. 307–357. [Google Scholar]
  49. Ward, J.H.J. Hierarchical Grouping to Optimize an Objective Function. J. Am. Stat. Assoc. 1963, 58, 236–244. [Google Scholar] [CrossRef]
  50. Murtagh, F.; Legendre, P. Ward’s Hierarchical Agglomerative Clustering Method: Which Algorithms Implement Ward’s Criterion? J. Classif. 2014, 31, 274–295. [Google Scholar] [CrossRef]
  51. Wold, S.; Sjöström, M.; Eriksson, L. PLS-Regression: A Basic Tool of Chemometrics. Chemom. Intell. Lab. Sys. 2001, 58, 109–130. [Google Scholar] [CrossRef]
  52. Wold, H. Estimation of Principal Components and Related Models by Iterative Least Squares. In Multivariate Analysis; Krishnaiah, P.R., Ed.; Academic Press: New York, NY, USA, 1966; pp. 391–420. [Google Scholar]
  53. Bair, E.; Hastie, T.; Paul, D.; Tibshirani, R. Prediction by Supervised Principal Components. J. Am. Stat. Assoc. 2006, 101, 119–137. [Google Scholar] [CrossRef]
  54. Lee, L.C.; Liong, C.-Y.; Jemain, A.A. Partial Least Squares-Discriminant Analysis (PLS-DA) for Classification of High-Dimensional (HD) Data: A Review of Contemporary Practice Strategies and Knowledge Gaps. Analyst 2018, 143, 3526–3539. [Google Scholar] [CrossRef]
  55. Barker, M.; Rayens, W. Partial Least Squares for Discrimination. J. Chemom. 2003, 17, 166–173. [Google Scholar] [CrossRef]
  56. Wilkinson, L.; Friendly, M. The History of the Cluster Heat Map. Am. Stat. 2009, 63, 179–184. [Google Scholar] [CrossRef]
  57. Shao, L.; Zhang, A.; Rong, Z.; Wang, C.; Jia, X.; Zhang, K.; Xiao, R.; Wang, S. Fast and Non-Invasive Serum Detection Technology Based on Surface-Enhanced Raman Spectroscopy and Multivariate Statistical Analysis for Liver Disease. Nanomed. Nanotechnol. Biol. Med. 2018, 14, 451–459. [Google Scholar] [CrossRef]
  58. Pérez, A.; Prada, Y.A.; Cabanzo, R.; González, C.I.; Mejía-Ospin, E. Diagnosis of Chagas Disease from Human Blood Serum Using Surface-Enhanced Raman Scattering (SERS) Spectroscopy and Chemometric Methods. Sens. Bio-Sens. Res. 2018, 21, 40–45. [Google Scholar] [CrossRef]
  59. Atkins, C.G.; Buckley, K.; Blades, M.W.; Turner, R.F.B. Raman Spectroscopy of Blood and Blood Components. Appl. Spectrosc. 2017, 71, 767–793. [Google Scholar] [CrossRef]
  60. Nargis, H.F.; Nawaz, H.; Ditta, A.; Mahmood, T.; Majeed, M.I.; Rashid, N.; Muddassar, M.; Bhatti, H.N.; Saleem, M.; Jilani, K.; et al. Raman Spectroscopy of Blood Plasma Samples from Breast Cancer Patients at Different Stages. Spectrochim. Acta Part A Mol. Biomolec. Spectrosc. 2019, 222, 117210. [Google Scholar] [CrossRef]
  61. Saade, J.; Silva, J.N.; Farias, P.M.A.; Lopes, D.F.; Santos, C.T.; Farias, B.A.; Rodrigues, K.C.; Martin, A.A. Glicemical Analysis of Human Blood Serum Using FT-Raman: A New Approach. Photomed. Laser Surg. 2012, 30, 388–392. [Google Scholar] [CrossRef]
  62. Faber, K.; Kowalski, K.F. Prediction Error in Least Squares Regression: Further Critique on the Deviation Used in the Unscrambler. Chemom. Intellig. Lab. Syst. 1996, 34, 283–292. [Google Scholar] [CrossRef]
  63. De Vries, S.; Ter Braak, C.J.F. Prediction Error in Partial Least Squares Regression: A Critique on the Deviation Used in the Unscrambler. Chemom. Intell. Lab. Syst. 1995, 30, 239–245. [Google Scholar] [CrossRef]
  64. Brereton, R.G. The Mahalanobis Distance and Its Relationship to Principal Component Scores. J. Chemom. 2015, 29, 143–145. [Google Scholar] [CrossRef]
Figure 1. Area-normalized global mean Raman spectrum of the control group (C group) and difference Raman spectra generated upon subtraction of this spectrum from the global mean spectra of the ADHD (red) and BP-M (blue) groups.
Spectroscj 02 00004 g001
Figure 2. Heat map of the studied samples.
Spectroscj 02 00004 g002
Figure 3. Results of the performed hierarchical clustering analysis.
Spectroscj 02 00004 g003
Figure 4. Two-dimensional score plot (Factor-1 vs. Factor-2) and three-dimensional score plot (Factor-1 vs. Factor-2 vs. Factor-3) for the developed PLS-DA model. The % numbers in parenthesis correspond to the explained variance in the x and y variables.
Spectroscj 02 00004 g004
Figure 5. Loadings of Factor-1, Factor-2, and Factor-3 for the developed PLS-DA model.
Spectroscj 02 00004 g005
Figure 6. Predicted y values of test samples using the first 5 factors (Factor-1, Factor-2, Factor-3, Factor-4, and Factor-5) (left) and using the first 3 factors (Factor-1, Factor-2, and Factor-3) (right). The predicted values are indicated by the red lines and the deviation by the blue boxes. In (a), samples belonging to the ADHD group define Class 1 (value 1 for y), and samples belonging to C and BP-M define Class 2 (value 0 for y). In (b), samples belonging to the BP-M group define Class 1 (value 1 for y), and samples belonging to C and BP-M define Class 2 (value 0 for y). In (c), samples belonging to the C group define Class 1 (value 1 for y), and samples belonging to ADHD and BP-M define Class 2 (value 0 for y). Sample BP-M-9 appears as an outlier to the classification in both the 3- and 5-factor classifications; samples BP-M-7 and BP-M-39 are classified as belonging to the C group when 3 factors are used, but are predicted correctly when 5 factors are used for classification.
Spectroscj 02 00004 g006
Figure 7. Two-dimensional score plot (Factor-2 vs. Factor-1) of the constructed PLS-DA model, depicting the calibration and projected test (proj.) samples. The % numbers in parenthesis correspond to the explained variance in the x variable in the calibration and test sets. The 95% confidence ellipses for the calibration set are shown. BP-M samples 7, 39, and 9 are indicated.
Spectroscj 02 00004 g007
Table 1. Assignment of major bands of Raman spectra of blood serum a.
Raman ShiftAssignmentRaman ShiftAssignment
2929Lipids ν(CH)1205Amino acids ν(C=C)
1655Protein (Amide I) ν(C=O)1173Cytosine, guanine
1609Phenylalanine ν(C=C)1002Phenylalanine ν(C–H)
1445Lipoproteins, phospholipids,945Phenylalanine ν(C–C)
δ(CH2), δ(CH3)850Tyrosine
1338Proteins (tryptophan)754Guanine, thymine
1267Phospholipids δ(CH)654Amide IV (proteins) δ(NC=O)
513Cystine ν(S–S)
a The assignments follow those of references [28,57,58,59,60,61]. Raman shifts (in cm−1) are measured for the C group’s global mean spectrum and match those reported in Ref. [28].
Disclaimer/Publisher’s Note: The statements, opinions and data contained in all publications are solely those of the individual author(s) and contributor(s) and not of MDPI and/or the editor(s). MDPI and/or the editor(s) disclaim responsibility for any injury to people or property resulting from any ideas, methods, instructions or products referred to in the content.

