Article

Laminated Information Encryption with Printer Using Laser-Induced Breakdown Spectroscopy

Tianjin Key Laboratory of Quantum Optics and Intelligent Photonics, School of Science, Tianjin University of Technology, Tianjin 300384, China
*
Author to whom correspondence should be addressed.
Spectrosc. J. 2024, 2(4), 322-331; https://doi.org/10.3390/spectroscj2040019
Submission received: 30 September 2024 / Revised: 5 December 2024 / Accepted: 5 December 2024 / Published: 8 December 2024
(This article belongs to the Special Issue Feature Papers in Spectroscopy Journal)

Abstract

:
In order to improve the security of information encryption, this paper proposes a novel method based on laser-induced breakdown spectroscopy (LIBS) technology in conjunction with a commercial general-purpose inkjet printer. A “sandwich” model, comprising three layers of a black ink block, a blue ink layer containing encrypted information, and another black ink block in order to render the information layer undetectable by other conventional optical imagers, was proposed. Because of the lower resolution requirements and better error tolerance of the Quick Response (QR) code, it was used as encryption information carrier. The “sandwich” structure was printed onto original paper using a commercial inkjet printer. The spatial distribution of the “LIBS secret key” on the paper was analyzed by LIBS spectra at different locations. After baseline removal, normalization, and spectral superposition, the contrast of decrypted images is enhanced to extract hidden information effectively. This method has the advantages of high security, low cost, and simple fabrication. It provides a new method with a potential application prospect for LIBS in the field of information encryption.

1. Introduction

In today’s rapidly evolving context of globalization and digitization, the issue of product authenticity is becoming increasingly severe, resulting in significant losses for both consumers and businesses. At the same time, with the surge in data volume, it has become particularly important to protect sensitive information from unauthorized access or tampering. To safeguard brand value and maintain personal privacy, finding ways to achieve information encryption, anti-counterfeiting, and secure transmission has become a major challenge faced by various organizations and individuals. Information encryption generally refers to the process of converting plaintext into unintelligible ciphertext using an encryption key, which can only be decrypted by the recipient using a decryption key [1]. From as early as 58 BC, the Caesar cipher played an important role in military applications by shifting each letter in the plaintext three positions forward or backward to obtain ciphertext [2]. The optical encryption technology based on double random phase encoding (DRPE) has developed rapidly over the past thirty years [3], leading to many new optical encryption techniques such as computational ghost imaging [4], interferometry [5], holography [6], and layered imaging [7]. Furthermore, research into information encryption based on encryption media, such as proteins [8], DNA [9], and nanomaterials, has been conducted [10].
The keys of these encryption techniques are typically combinatorial arrangements of specific molecules or basic units [11], which have the drawbacks of complicated sample preparation and poor long-term storage. It is therefore imperative to identify an encryption method that is straightforward to manufacture, simple to install, highly secure, and cost-effective. Laser-induced breakdown spectroscopy (LIBS) is an atomic spectroscopy technique first proposed by Breech and Cross in 1962. It has been praised as the “future super star” in analytical chemistry [12,13]. LIBS is an elemental analysis technique based on atomic emission spectroscopy, characterized by its real-time, in situ, multi-element, and micro-destructive capabilities [14]. And it is worth mentioning that portable laser-induced breakdown spectroscopy devices have also been reported [15]. Additionally, portable LIBS devices suitable for commercial use have now been developed. These devices are being deployed for the detection of food fraud, offering a promising solution to the challenges posed by this issue [16]. Undoubtedly, portable LIBS has expanded its application scenarios and given this technology wings. Based on these advantages of LIBS, LIBS has made varying degrees of progress in various fields, including coal, metallurgy, water, soil, food, biomedicine, deep-sea, nuclear energy, geochemistry, and paleoclimatology [17,18,19,20,21]. Additionally, because of the fact that LIBS can be used for the in situ analysis of elemental composition, LIBS is widely used for the elemental imaging of sample surfaces, such as materials and biomedical applications [22]. Therefore, LIBS technology can also be applied to information encryption. In a recent publication, Yin et al. put forth a cryptographic method based on laser-induced breakdown spectroscopy (LIBS) and steganography. In this method, the encrypted information is written with “LIBS ink” containing varying concentrations of Cu and Ag. The distribution of Cu and Ag elements in the ink is then analyzed by combining LIBS and machine learning, allowing for the decryption of the hidden information [23]. However, “LIBS ink” containing Cu and Ag elements is not common in daily life, which limits the wider application of LIBS in information encryption. Therefore, Han et al. proposed an encryption method using the common zinc gluconate using LIBS [24]. It is worth noting that Yin et al. and Han et al. both used handwritten encrypted information in their works, which could not produce large quantities of encrypted documents, and the information had poor fault tolerance.
Quick Response (QR) codes are a type of two-dimensional barcode that can store a large amount of data. They consist of black and white square modules or dots and can connect the physical world to the digital realm. This allows for the transmission of information in the form of links to videos, websites, maps, and other digital resources. Compared to traditional barcodes, QR codes can store more information and feature an efficient error correction mechanism [25]. Meanwhile, QR codes have garnered attention for their convenience and wide range of applications, but concerns regarding their security have also emerged. For instance, during the transmission process, unauthorized access to QR codes can lead to security issues such as information leakage and tampering. To address these challenges, we propose encrypting the QR codes by combining them with LIBS technology; its low-resolution recognition requirements and error correction mechanisms are perfectly aligned with the scanning capabilities of LIBS.
Based on the above reasons, this work proposes a method for information encryption and anti-counterfeiting using printed QR codes and LIBS technology. Producing a sandwich model with a printer and standard ink is straightforward, rapid, and cost-effective, ensuring the security of information during transit. Capitalizing on the advantages of LIBS for rapid and in situ detection without the need for sample pre-treatment, the extraction of information is swift and efficient. Meanwhile, the self-correction mechanism of QR codes ensures that LIBS can decrypt accurate information effectively.

2. Materials and Methods

A schematic representation of the LIBS experimental apparatus is provided in Figure 1. The laser, generated by a computer-controlled homemade Nd:YAG laser at a wavelength of 1064 nm, was focused on the surface of original paper on the sample stage through a plano-convex lens with a focal length of 60 mm. This lens was positioned after passing through three mirrors. The laser pulse energy was approximately 100 mJ, the pulse duration was approximately 20 ns, and the repetition frequency was 10 Hz. The original paper was ablated by the laser at high energy, resulting in the production of plasma with an ablation crater of less than 100 μm. The emitted light from the plasma de-excitation is coupled into the optical fiber through four plano-convex lenses with focal lengths of 60 mm, 150 mm, 60 mm, and 10 mm, then the light is transmitted to a four-channel CCD spectrometer (AvaSpec2048-USB2*, Avantes, The Netherlands), which is triggered by the laser, with a range of 300–950 nm and a spectral resolution between 0.1 and 0.15 nm. The different focal lengths of the four plano-convex lenses in the optical collection system serve two main purposes: firstly, to collect more emitted light, and secondly, to improve the efficiency of the optical fiber coupling. In order to avoid the impact of continuous radiation of bremsstrahlung and recombination radiation, the spectrometer initiated the collection of optical signals 1.3 μs after the laser interacted with the samples, with an integration time of 1.05 ms. The original paper was affixed to the two-dimensional electronically controlled displacement stage with double-sided adhesive tape, enabling two-dimensional spectroscopic imaging through serpentine scanning. In order to avoid the influence between different ablation craters, the interval between adjacent ablation craters was set to 0.3 mm, with laser–sample interactions occurring in air at ambient temperature and pressure.
The original paper was printed by a commercial inkjet printer (Deskjet 2050 J510 series, Hewlett-Packard, Beijing, China), with four color blocks of RGB codes #FF0000, #FFFF00, #0000FF, and #000000 for red, yellow, blue, and black, respectively. The LIBS spectra of the four blocks were compared with that of the original paper for finding the characteristic elements different from the original paper to be used as the encryption keys.
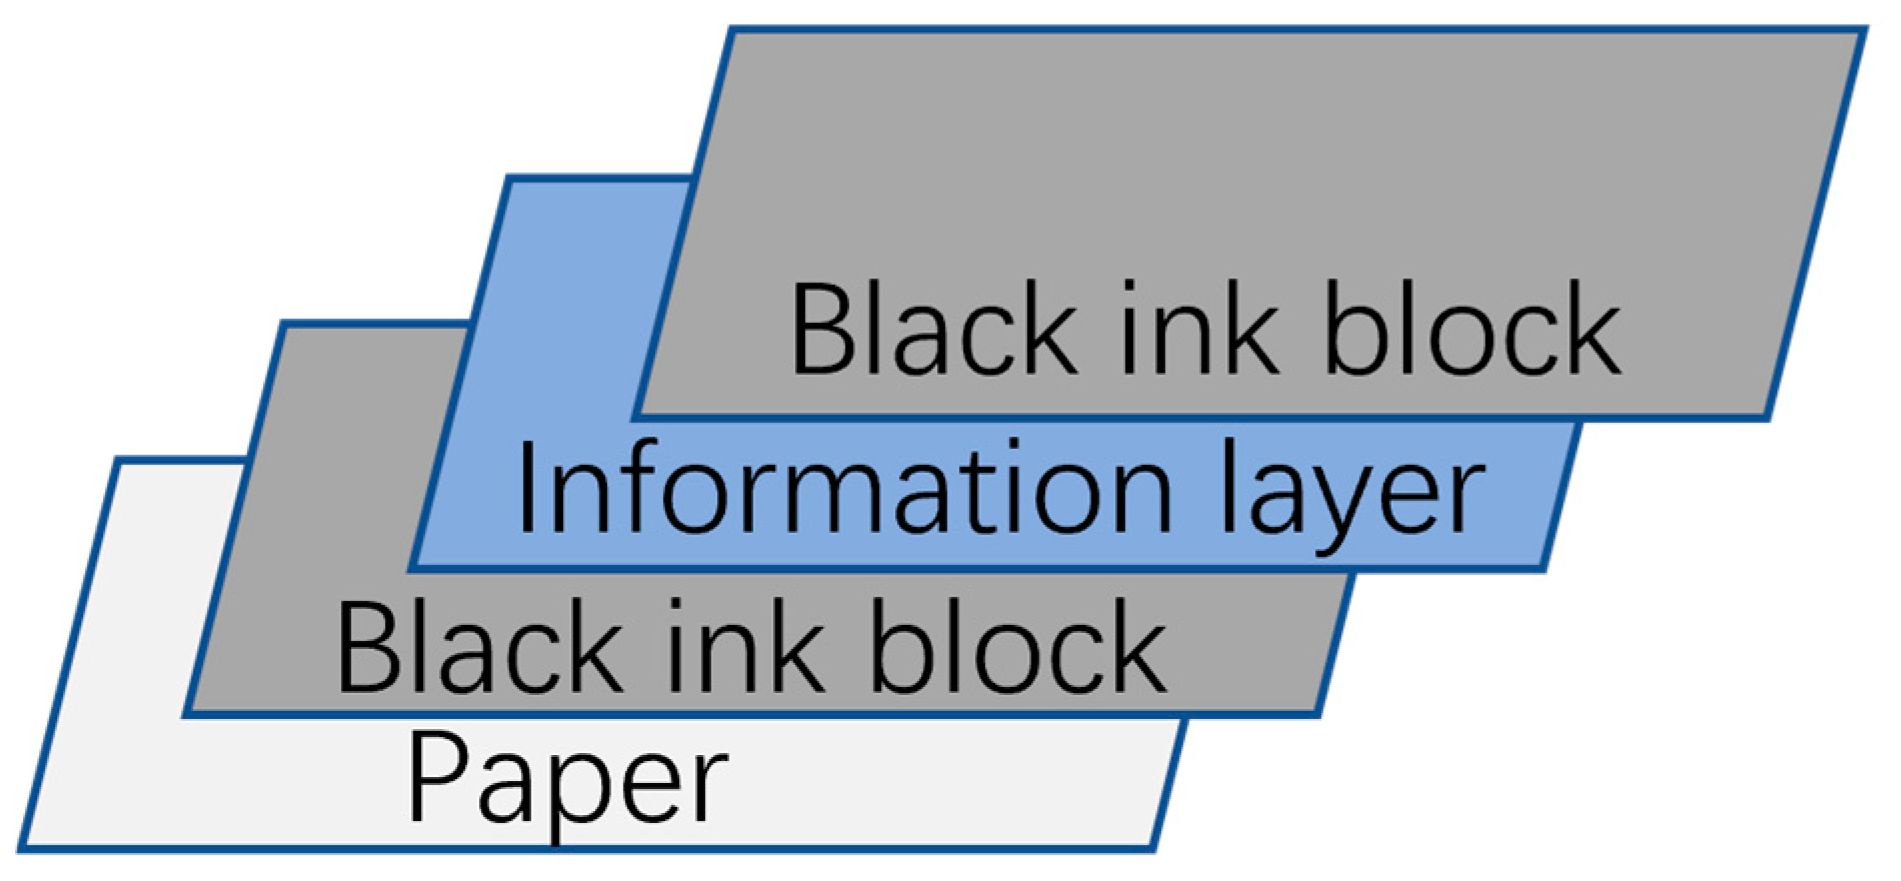
The “sandwich” model, crafted with precision using an inkjet printer, is a sophisticated three-tiered structure designed for secure information embedding, as shown in Figure 2. At the foundation of this model lies a solid black ink block, serving as the base layer. This initial layer is crucial for the overall integrity and opacity of the sandwich model, ensuring that the underlying encrypted information is well protected from unauthorized access or visual detection. Sitting in the middle of this sandwich model is the blue ink layer, which is the heart of the model and contains the encrypted information. This layer is meticulously printed with blue ink that has been selected for its unique properties, allowing it to carry the encryption key without compromising the security or readability of the information. Capping the sandwich model is another black ink block, which mirrors the base layer in both color and function. This top layer acts as a protective shield, safeguarding the sensitive blue ink layer from environmental factors such as light, moisture, and physical damage. It also plays a role in maintaining the structural integrity of the entire sandwich model, preventing any accidental peeling or separation that could compromise the security of the encrypted data. The sandwich model’s design is not only a testament to the ingenuity of combining traditional printing methods with advanced cryptographic techniques, but also a practical solution for secure information transmission. The layers work in unison to provide a robust barrier against tampering, while the blue ink’s compatibility with LIBS technology ensures that the information can be swiftly and accurately retrieved when needed. This model exemplifies the convergence of simplicity in design with the sophistication of modern security measures, making it an effective method for protecting sensitive data in various applications.
Therefore, for the information layer, a QR code was chosen as the encrypted information, as shown in Figure 3. The size of the sandwich model is 2 cm × 2 cm. The information layer consists of a QR code for the homepage of Tianjin University of Technology, http://www.tjut.edu.cn (accessed on 6 May 2023).
Regarding repeatability, the sample can be scanned multiple times at the same location, consistently yielding reliable results. Additionally, when the sample is scanned a sufficient number of times, the decrypted image may experience a decrease in contrast. To enable further scanning without compromising result quality, LIBS can be focused between the points of the initial scan, allowing for additional scans on the same sample. This approach helps maintain image clarity while maximizing data collection, thereby enhancing the robustness of this technique for applications requiring repeatable measurements.

3. Results

3.1. Analysis of the LIBS Spectra of Inks and Original Paper

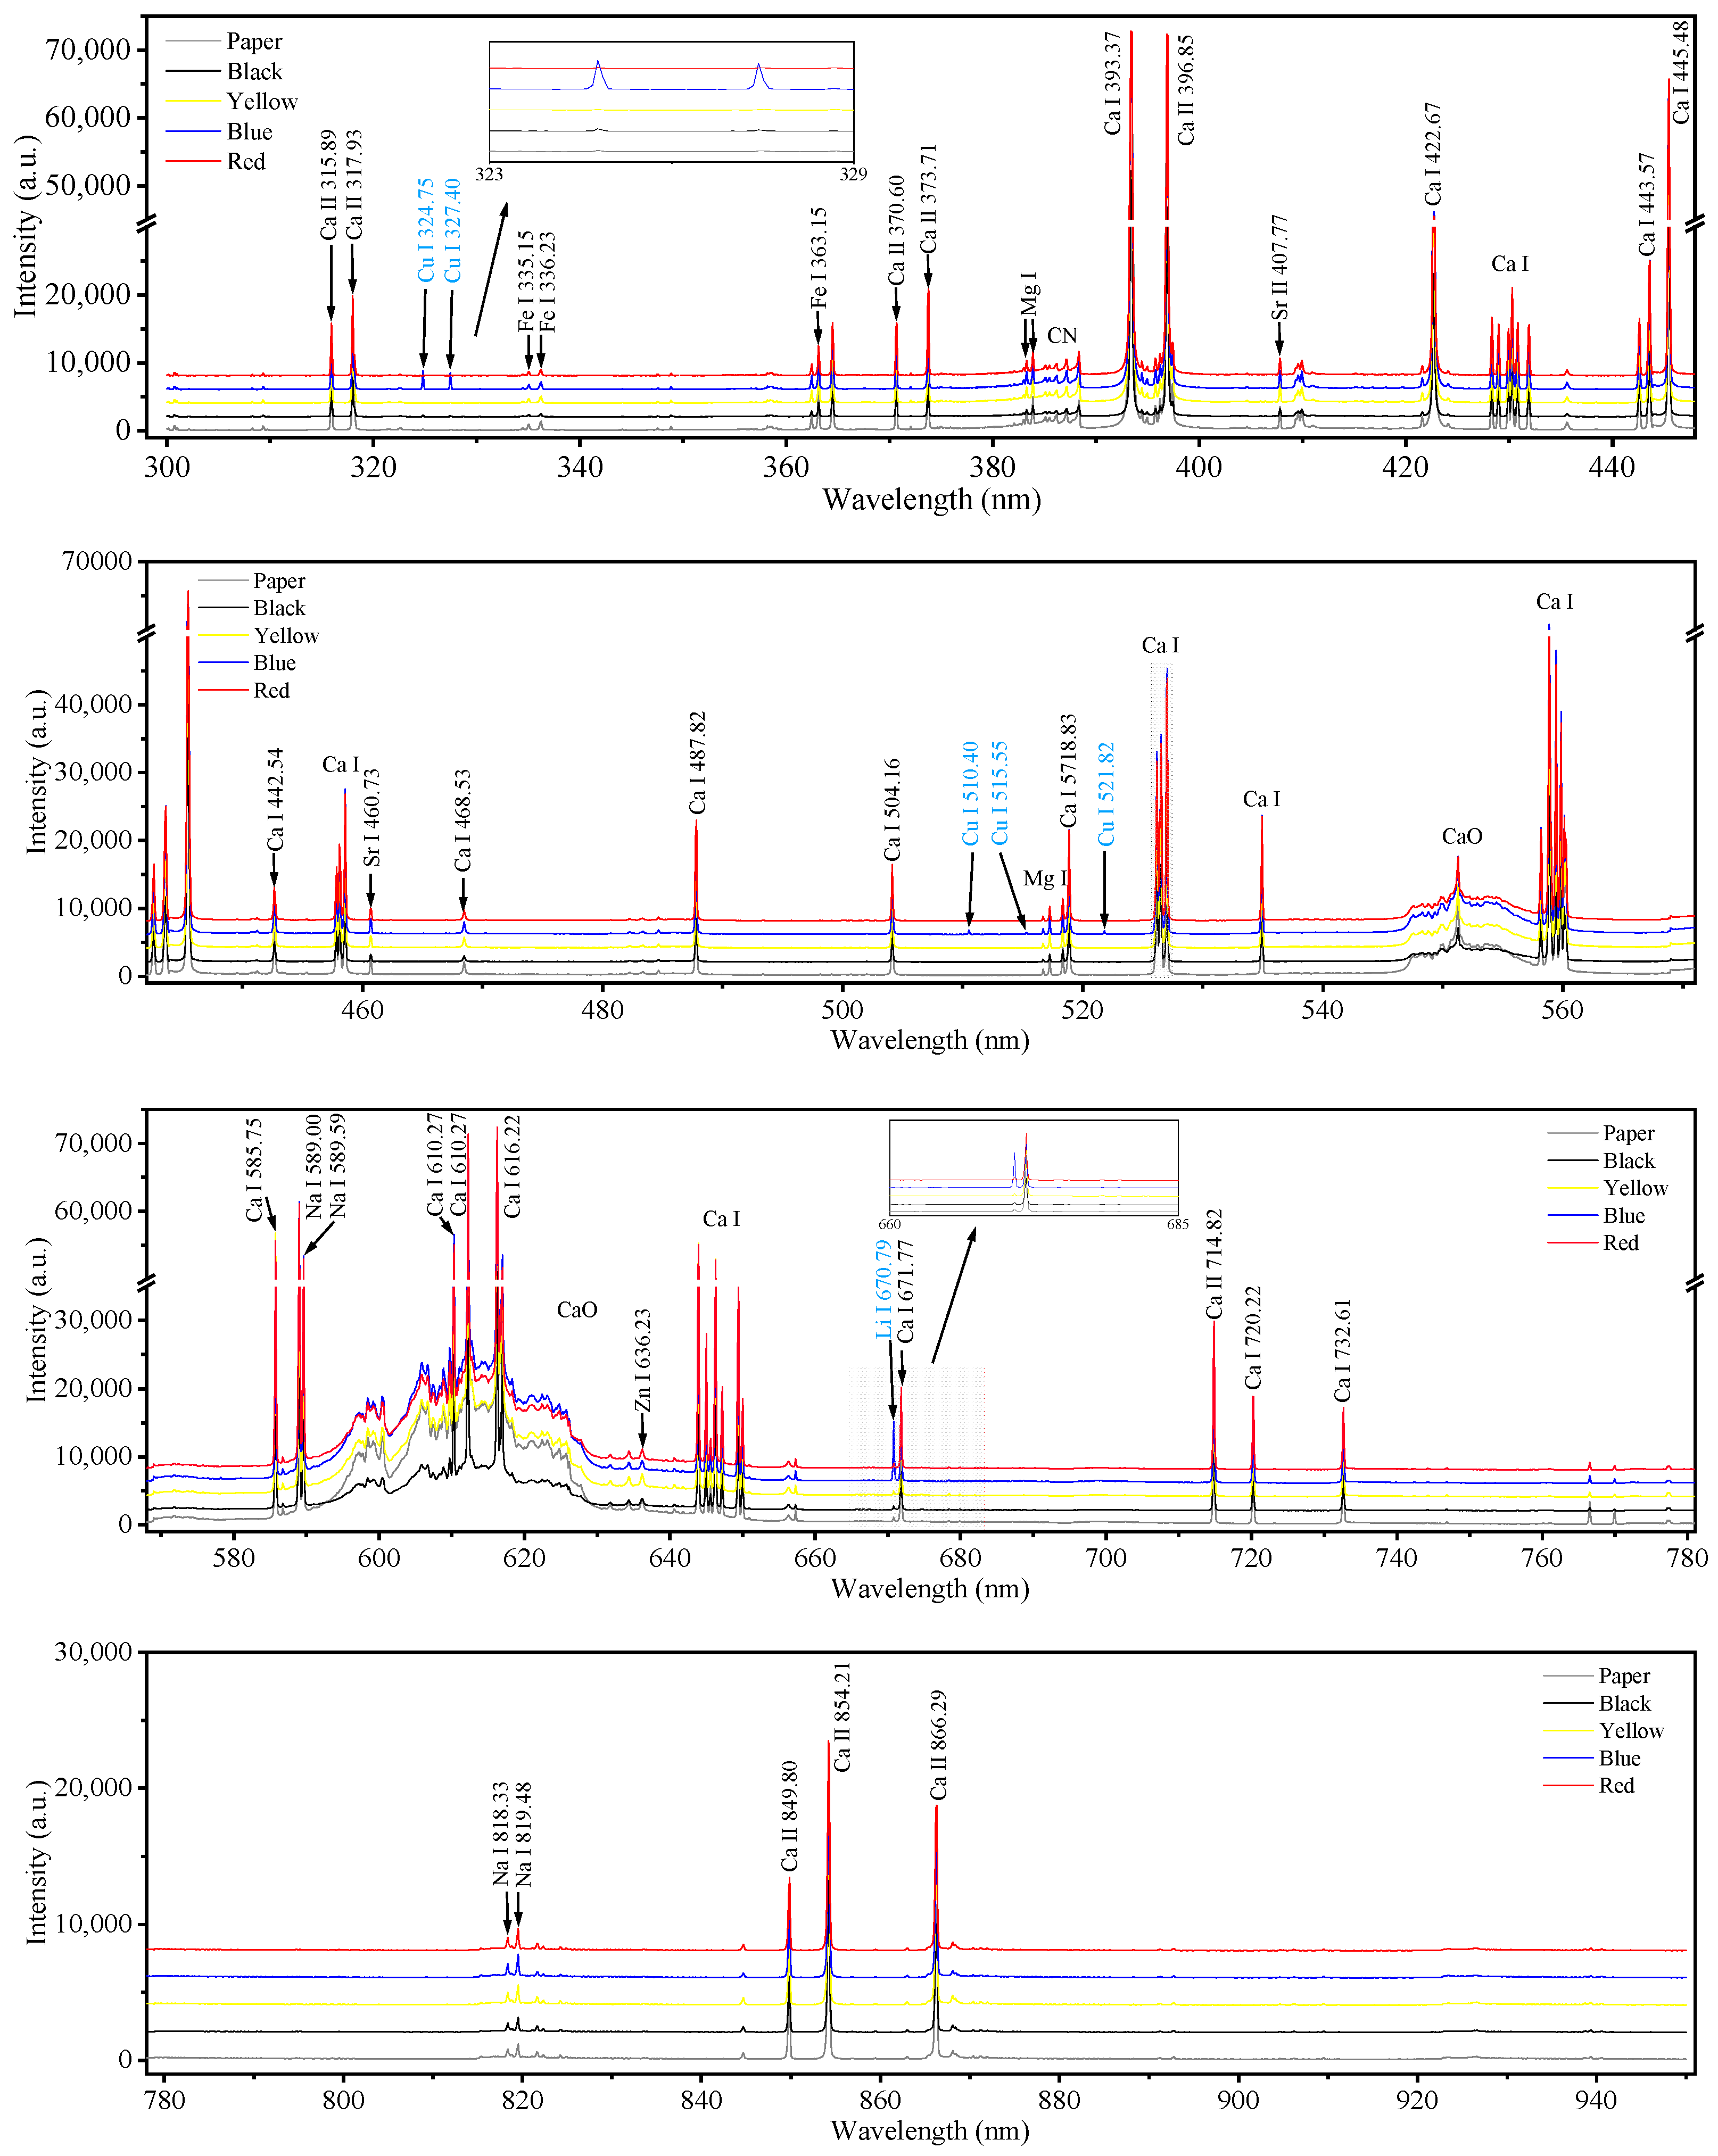
Figure 4 shows the spectra of four different color inks on paper and original paper, with a wavelength range of 300–950 nm. Based on the NIST [26] database, we identified possible elements from spectral lines and bonds of different colored inks and attempted to distinguish them. By observing the spectra, spectra lines of Ca element and CaO free radical were both founded in the LIBS spectra of four different color inks on paper and original paper. This is related to the manufacturing process of paper. Calcium plays a significant role in the papermaking process, primarily through its presence as calcium carbonate and calcium ions. Calcium carbonate is widely used as a filler and coating material in paper manufacturing due to its cost-effectiveness and ability to enhance optical properties such as whiteness and opacity [27,28]. It helps in improving the printing properties of paper. Moreover, the CaO radical is mainly composed of Ca from the sample and O from the air or from the sample itself.
Observing the spectrum in Figure 4, it reveals the presence of metal elements such as Fe, Na, Mg, Zn, and Sr, as well as the elements C, N, O, and H that make up organic matter. In addition, free radical spectra of CN are observed in the spectrum, where the CN radical may be formed by the combination of C atoms in the sample with N atoms in the surrounding air. The above elements and free radicals have slight differences in intensity. This is due to small differences in material content, fluctuations in the energy of the laser, and uneven flatness of the ablation crater [29]. However, the differences are not “haves” or “have nots” and cannot be used as a basis for encryption or decryption.
It was found that the blue block has special differences from other blocks. It has five characteristic spectral lines of Cu element at 324.75 nm, 327.40 nm, 510.55 nm, 515.32 nm, and 521.82 nm, and one Li element spectral line at 670.79 nm, which is related to the presence of copper and lithium ions in blue ink. Therefore, in this work, blue ink was selected as the encryption material, and the two most distinct, 324.75 nm and 327.40 nm, spectral lines among the five characteristic spectral lines of Cu, and the 670.79 nm spectral line of Li, were used as the encryption key.

3.2. Sandwich Model Decryption

Only blue ink contains the elements Cu and Li, so Cu and Li can help us easily distinguish blue ink from other combinations.
  • The decrypted image obtained from the spatial distribution of the Cu element at 324.75 nm is shown in Figure 5. This spatially resolved decrypted image can be scanned through WeChat recognition on mobile applications, which is a URL composed of strings. However, the image still contains some noise. The intensity of the feature peaks is not uniform. The noise is particularly high at the edges, with some areas showing slightly higher levels. This will result in a decrypted image with poor contrast that cannot be recognized.
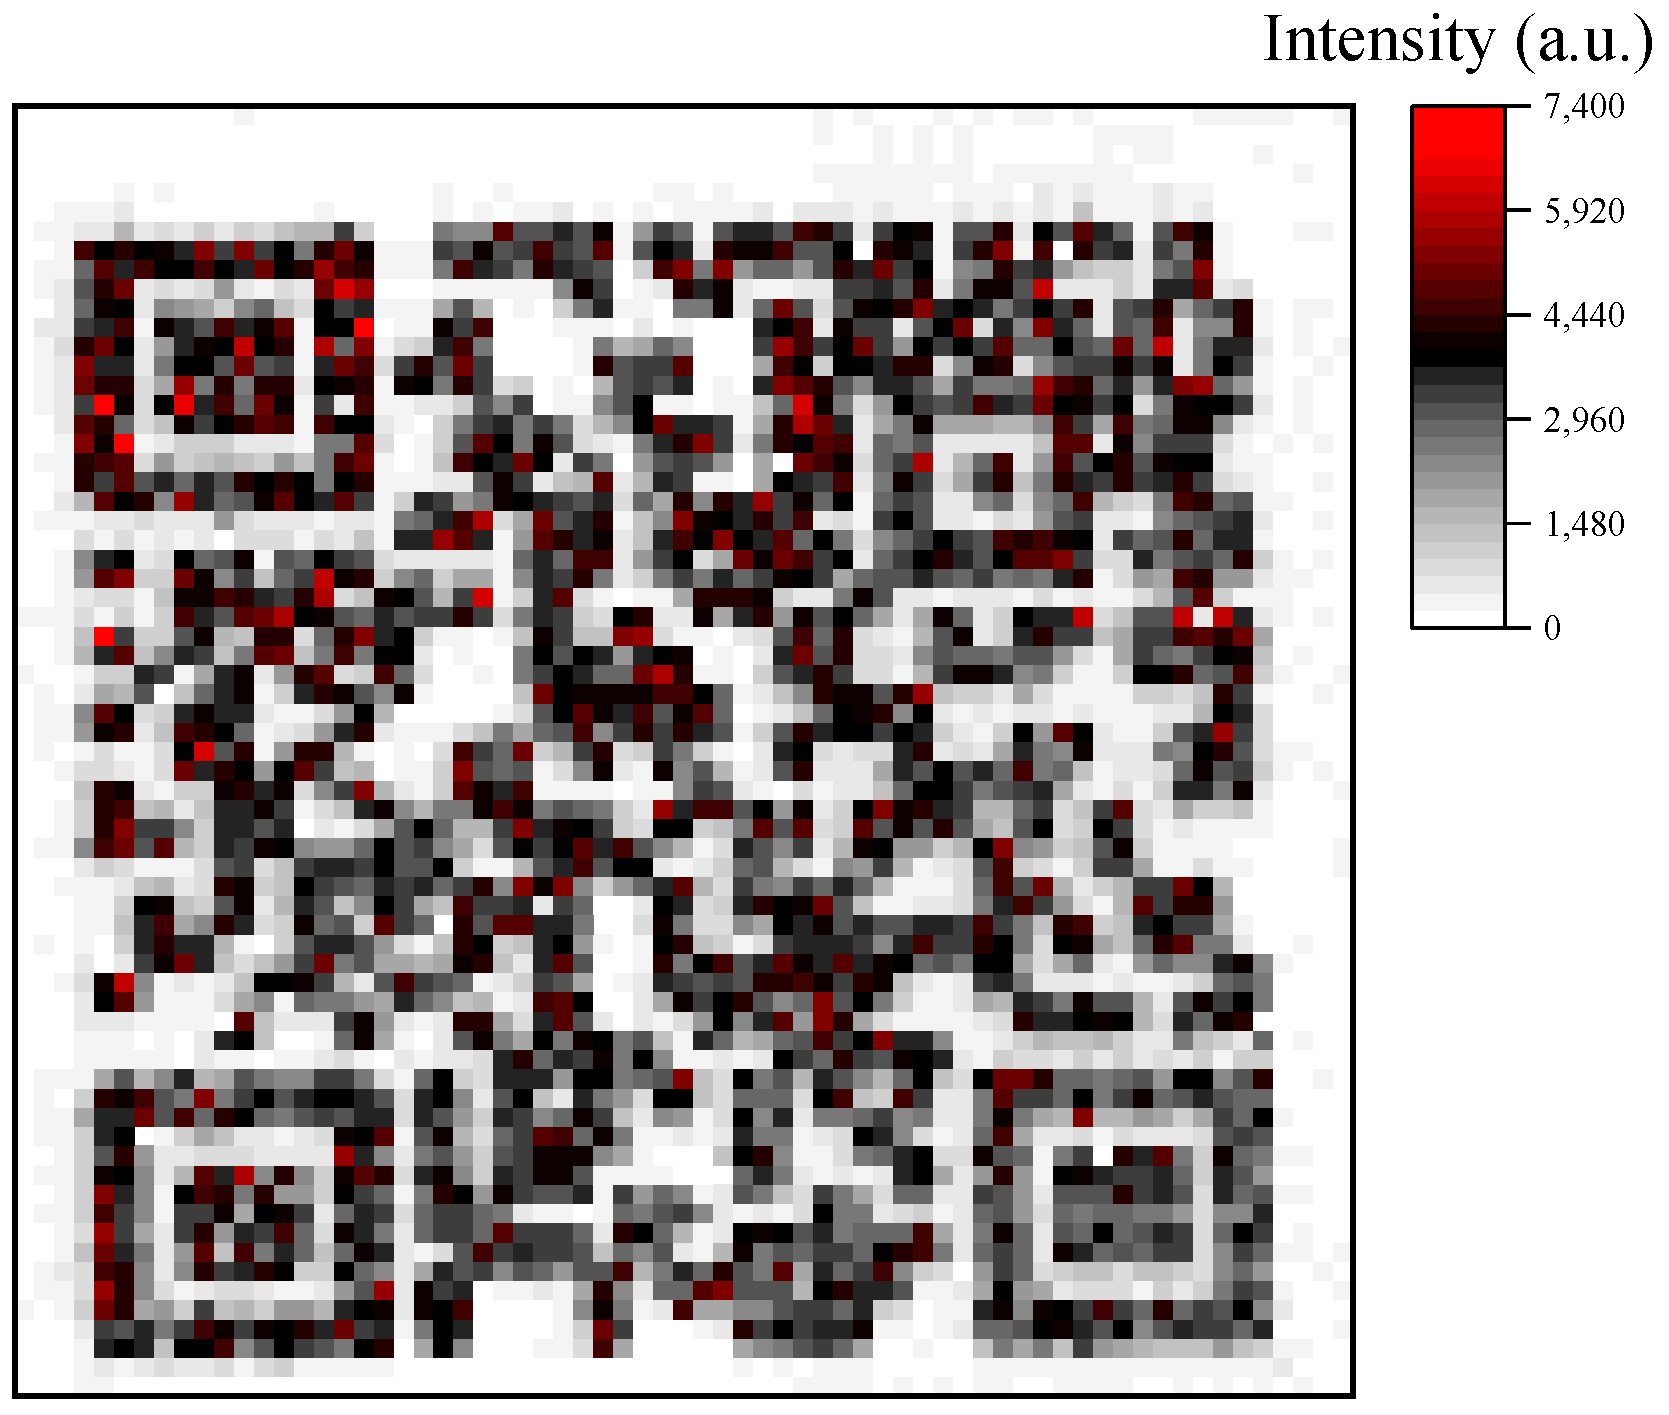
  • The decrypted image using the spectral line 327.40 nm is shown in Figure 6. It can be seen that compared with the result of the decrypted image using the spectral line 324.75 nm, there is less noise, the intensity of the characteristic spectral peaks is more uniform and the peaks are much stronger, and the contrast is higher and better.
  • The decrypted image using the spectral line 670.79 nm of Li element is shown in Figure 7. The spectral line intensity of Li is stronger than that of Cu. Although the overall recognizability is good, the baseline intensity remains high, and there is potential to further enhance recognizability by baseline subtraction.

3.3. Decrypted Image Quality Assessment

To quantitatively evaluate the quality of the recognized image, we employ peak signal-to-noise ratio (PSNR) [30]. PSNR is defined as
P s n r = 10 log 10 I m a x 2 M s e ,
where Imax is the maximum value of the image, and Mse is the mean square error given by
M s e = 1 M N i = 1 M   j = 1 N   I r ( i , j ) I o ( i , j ) 2 ,
where Ir(i, j) and Io(i, j) are the values of the reconstructed image and the original image with M × N pixels, respectively. In our work, both M and N are 67. The PSNRs of Cu I 324.75 nm and 327.40 nm are 14.0894 and 14.2315, which are smaller than the PSNR values, 14.5451, of Li I 670.79 nm. From this result, it can be seen that the quality of the recognized image using the Li spectral line is better than those of Cu.

4. Discussion

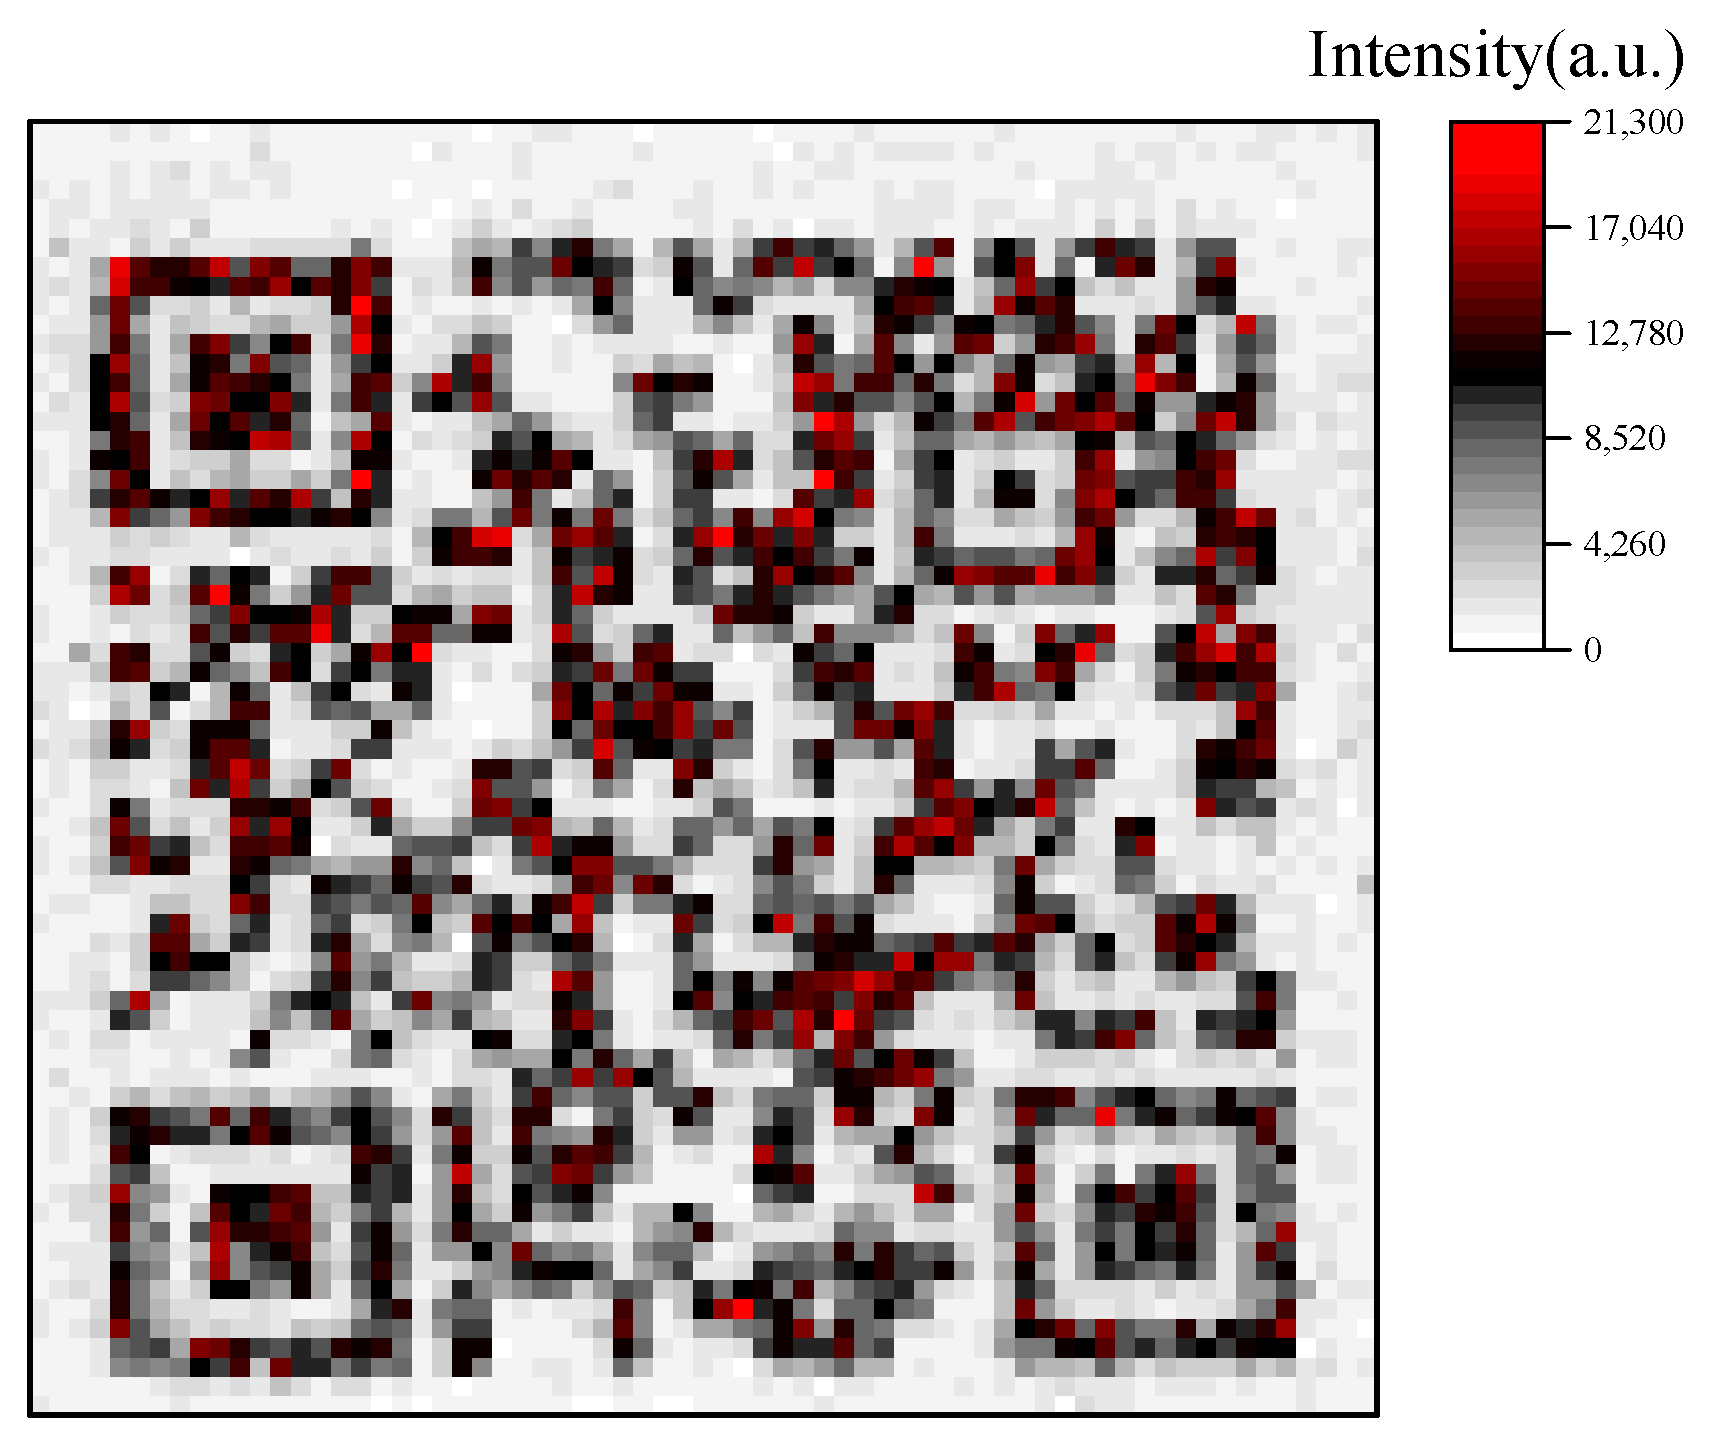
To address the issues of baseline and intensity fluctuations in the spectral peaks, the spectral intensity at 325.90 nm is selected to subtract the baseline from the spectral peaks of the Cu element at 324.75 nm and 327.40 nm. Correspondingly, for the Li element, the spectral intensity at the 670.24 nm position is chosen to remove the baseline from the spectral peak at 670.79 nm. In the same sample, the spectral line of Ca at 315.89 nm in the paper is relatively stable, and this spectral line is unsaturated, so the intensity of this spectral line can be correlated with the laser energy. To remove the effect of laser energy fluctuations on the spectral lines, we selected the peak intensity of Ca II at 315.89 nm as the normalization reference peak and normalized the two Cu and one Li spectral lines accordingly. To further enhance the image contrast and improve the accuracy of the extracted information, the intensities of these three peaks were accumulated to obtain a spatial distribution mapping of the total intensity, as shown in Figure 8.
The contrast of the image has been enhanced and the delineation of the display is more distinctly outlined relative to the spatial resolution of individual spectral lines. The PSNR of the recognized image, after background removal and normalization, is 20.0753, which is higher than the PSNR values obtained from single spectral lines.

5. Conclusions

The use of LIBS spectral technology allows for the easy extraction of hidden information from the surface of samples, offering advantages such as high safety, strong reliability, low cost, and convenience in production. This study utilized the Cu and Li elements in the blue ink of a standard inkjet printer as a key, providing a more standardized and rapid method for printing hidden information compared to the handwritten “LIBS ink”. Due to the presence of metal elements such as Ca, Fe, Na, Mg, Zn, and Sr, as well as organic elements like C, N, O, and H in original paper, especially the numerous and strong spectral peaks of Ca, it is necessary to exclude spectral lines that overlap with those of other elements when extracting hidden information from the Cu spectral lines. By analyzing the spectra of original paper and the printer’s blue ink, two Cu I spectral peaks at 324.75 nm, 327.40 nm, and a Li spectral peak at 670.79 nm were selected. The baselines were removed and normalized separately for the three spectral peaks, and finally, the three peaks were summed up to arrange the intensities according to their spatial distribution. The result is a further improvement in the contrast and clarity of the plotted images.
The findings of this study indicate that the combination of printer QR codes with LIBS technology not only facilitates the encryption of information but also serves as an effective means of anti-counterfeiting for products. The application of this novel information concealment technique is set to revolutionize the field of information security, providing robust technical support for the protection of intellectual property rights and the combat against counterfeit and inferior goods. As portable LIBS technology continues to mature and gain wider adoption, there is every reason to believe that laser-induced breakdown spectroscopy will assume a significant role in the future market for information encryption and anti-counterfeiting measures.

Author Contributions

Conceptualization, L.S.; methodology, L.S. and X.H.; investigation, X.H.; resources, L.S.; data curation, X.H., L.Y. and Y.L.; writing—original draft preparation, X.H.; writing—review and editing, L.S.; supervision, L.S.; project administration, L.S.; funding acquisition, L.S. and X.H. All authors have read and agreed to the published version of the manuscript.

Funding

This research was funded by the Tianjin Enterprise Science and Technology Special Agent Project (24YDTPJC00220), and the National College Students’ Innovative Entrepreneurial Training Plan Program (202210060010).

Institutional Review Board Statement

Not applicable.

Informed Consent Statement

Not applicable.

Data Availability Statement

The original contributions presented in the study are included in the article, further inquiries can be directed to the corresponding authors.

Conflicts of Interest

The authors declare no conflicts of interest.

References

  1. Zhu, Q.Y.; Zhang, F.R.; Du, Y.; Zhang, X.X.; Lu, J.Y.; Yao, Q.F.; Huang, W.T.; Ding, X.Z.; Xia, L.Q. Graphene-based steganographically aptasensing system for information computing, encryption and hiding, fluorescence sensing and in vivo imaging of fish pathogens. ACS Appl. Mater. Interfaces 2019, 11, 8904–8914. [Google Scholar] [CrossRef] [PubMed]
  2. Manasrah, A.M.; Al-Din, B.N. Mapping private keys into one public key using binary matrices and masonic cipher: Caesar cipher as a case study. Secur. Commun. Netw. 2016, 9, 1450–1461. [Google Scholar] [CrossRef]
  3. Wu, K.N.; Hu, J.S.; Wu, X. Optical encryption for information security. Laser Optoelectron. Prog. 2008, 45, 30–38. [Google Scholar]
  4. Clemente, P.; Durán, V.; Torres-Company, V.; Tajahuerce, E.; Lancis, J. Optical encryption based on computational ghost imaging. Opt. Lett. 2010, 35, 2391–2393. [Google Scholar] [CrossRef]
  5. Zhang, Y.; Wang, B. Optical image encryption based on interference. Opt. Lett. 2008, 33, 2443–2445. [Google Scholar] [CrossRef]
  6. Javidi, B.; Nomura, T. Securing information by use of digital holography. Opt. Lett. 2000, 25, 28–30. [Google Scholar] [CrossRef]
  7. Shi, Y.S.; Li, T.; Wang, Y.L.; Gao, Q.K.; Zhang, S.G.; Li, H.F. Optical image encryption via ptychography. Opt. Lett. 2013, 38, 1425–1427. [Google Scholar] [CrossRef]
  8. Bu, Z.Q.; Yao, Q.F.; Liu, Q.Y.; Quan, M.X.; Lu, J.Y.; Huang, W.T. Peptide-based sensing, logic computing, and information security on the antimonene platform. ACS Appl. Mater. Interfaces 2022, 14, 8311–8321. [Google Scholar] [CrossRef]
  9. Clelland, C.T.; Risca, V.; Bancroft, C. Hiding messages in DNA microdots. Nature 1999, 399, 533–534. [Google Scholar] [CrossRef]
  10. Zhang, X.; Hou, L.; Samorì, P. Coupling carbon nanomaterials with photochromic molecules for the generation of optically responsive materials. Nat. Commun. 2016, 7, 11118. [Google Scholar] [CrossRef]
  11. Liang, L.; Sun, H.; Wu, Y.; Liu, G.; Li, L.; Chen, X.; Zhang, Y. Surface-enhanced Raman scattering-encoded gold nanostars for multiplexed steganographic anticounterfeiting labels. ACS Appl. Nano Mater. 2024, 7, 21791–21799. [Google Scholar] [CrossRef]
  12. Winefordner, J.D.; Gornushkin, I.B.; Correll, T.; Gibb, E.; Smith, B.W.; Omenetto, N. Comparing several atomic spectrometric methods to the super stars: Special emphasis on laser induced breakdown spectrometry, LIBS, a future super star. J. Anal. At. Spectrom. 2004, 19, 1061–1083. [Google Scholar] [CrossRef]
  13. Guo, L.B.; Li, X.Y.; Xiong, W.; Zeng, X.Y.; Lu, Y.F. Recent technological progress in Asia from the First Asian Symposium on Laser-induced Breakdown Spectroscopy. Front. Phys. 2016, 11, 115208. [Google Scholar] [CrossRef]
  14. Yao, L.X.; Li, J.W.; Liu, Y.; Shen, L.; Wang, C. Traceability of cold medications with similar ingredients based on laser-induced breakdown spectroscopy. J. Anal. At. Spectrom. 2024, 39, 735–742. [Google Scholar] [CrossRef]
  15. Rakovsky, J.; Cermák, P.; Musset, O.; Veis, P. A review of the development of portable laser induced breakdown spectroscopy and its applications. Spectrochim. Acta Part B At. Spectrosc. 2014, 101, 269–287. [Google Scholar] [CrossRef]
  16. Wu, X.; Shin, S.; Gondhalekar, C.; Patsekin, V.; Bae, E.; Robinson, J.P.; Rajwa, B. Rapid food authentication using a portable laser-induced breakdown spectroscopy system. Foods 2023, 12, 402. [Google Scholar] [CrossRef]
  17. Guo, L.B.; Zhang, D.; Sun, L.X.; Yao, S.C.; Zhang, L.; Wang, Z.Z.; Wang, Q.Q.; Ding, H.B.; Lu, Y.; Hou, Z.Y.; et al. Development in the application of laser-induced breakdown spectroscopy in recent years: A review. Front. Phys. 2021, 16, 25. [Google Scholar] [CrossRef]
  18. Harmon, R.S.; Senesi, G.S. Laser-induced breakdown spectroscopy—A geochemical tool for the 21st century. Appl. Geochem. 2021, 128, 55. [Google Scholar] [CrossRef]
  19. García-Escárzaga, A.; Martínez-Minchero, M.; Cobo, A.; Gutiérrez-Zugasti, I.; Arrizabalaga, A.; Roberts, P. Using Mg/Ca ratios from the limpet patella depressa pennant, 1777 measured by laser-induced breakdown spectroscopy (LIBS) to reconstruct paleoclimate. Appl. Sci. 2021, 11, 2959. [Google Scholar] [CrossRef]
  20. Nanou, E.; Pliatsika, N.; Couris, S. Rapid authentication and detection of olive oil adulteration using laser-induced breakdown spectroscopy. Molecules 2023, 28, 7960. [Google Scholar] [CrossRef]
  21. Harefa, E.; Zhou, W. Laser-induced breakdown spectroscopy combined with nonlinear manifold learning for improvement aluminum alloy classification accuracy. Sensors 2022, 22, 3129. [Google Scholar] [CrossRef] [PubMed]
  22. Gardette, V.; Motto-Ros, V.; Alvarez-Llamas, C.; Sancey, L.; Duponchel, L.; Busser, B. Laser-induced breakdown spectroscopy imaging for material and biomedical applications: Recent advances and future perspectives. Anal. Chem. 2023, 95, 49–69. [Google Scholar] [CrossRef] [PubMed]
  23. Yin, P.K.; Yang, E.L.; Chen, Y.Y.; Peng, Z.Y.; Li, D.; Duan, Y.X.; Lin, Q.Y. Multiplexing steganography based on laser-induced breakdown spectroscopy coupled with machine learning. Chem. Commun. 2021, 57, 7312–7315. [Google Scholar] [CrossRef] [PubMed]
  24. Han, X.; Yao, L.X.; Zhang, X.; Tian, X.Y.; Su, X.; Lou, J.L.; Shen, L. Information encryption based on laser-induced breakdown spectroscopy. Laser Optoelectron. Prog. 2024, 61, 0530002. [Google Scholar] [CrossRef]
  25. Bhardwaj, C.; Garg, H.; Shekhar, S. An approach for securing QR code using cryptography and visual cryptography. In Proceedings of the 2022 International Conference on Computational Intelligence and Sustainable Engineering Solutions (CISES), Greater Noida, India, 20–21 May 2022; pp. 284–288. [Google Scholar]
  26. Kramida, A.; Ralchenko, Y.; Reader, J. NIST Atomic Spectra Database, Version 5.10; National Institute of Standards and Technology: Gaithersburg, MD, USA, 2022. [CrossRef]
  27. Raymond, L.; Turcotte, R.; Gratton, R. The challenges of increasing filler in fine paper. Pap. Technol. 2004, 45, 34–40. [Google Scholar]
  28. Hirsch, G.; Kersten, A.; Putz, H.J.; Bobek, B.; Hamm, U.; Schabel, S. CaCO3 in the paper industry-blessing or curse? In Proceedings of the 2013 PEERS Conference, Co-Located with the 2013 International Bioenergy and Bioproducts Conference, Green Bay, WI, USA, 15–20 September 2013; pp. 1948–1988. [Google Scholar]
  29. Tognoni, E.; Cristoforetti, G.; Legnaioli, S.; Palleschi, V. Calibration-free laser-induced breakdown spectroscopy: State of the art. Spectrochim. Acta Part B At. Spectrosc. 2010, 65, 1–14. [Google Scholar] [CrossRef]
  30. Liu, Z.D.; Li, Z.G.; Zhao, Y.N.; Zhang, S.H.; Ye, Z.Y.; Zhang, D.J.; Liu, H.C.; Xiong, J.; Li, H.G. Fourier single-pixel imaging via arbitrary illumination patterns. Phys. Rev. Appl. 2023, 19, 044025. [Google Scholar] [CrossRef]
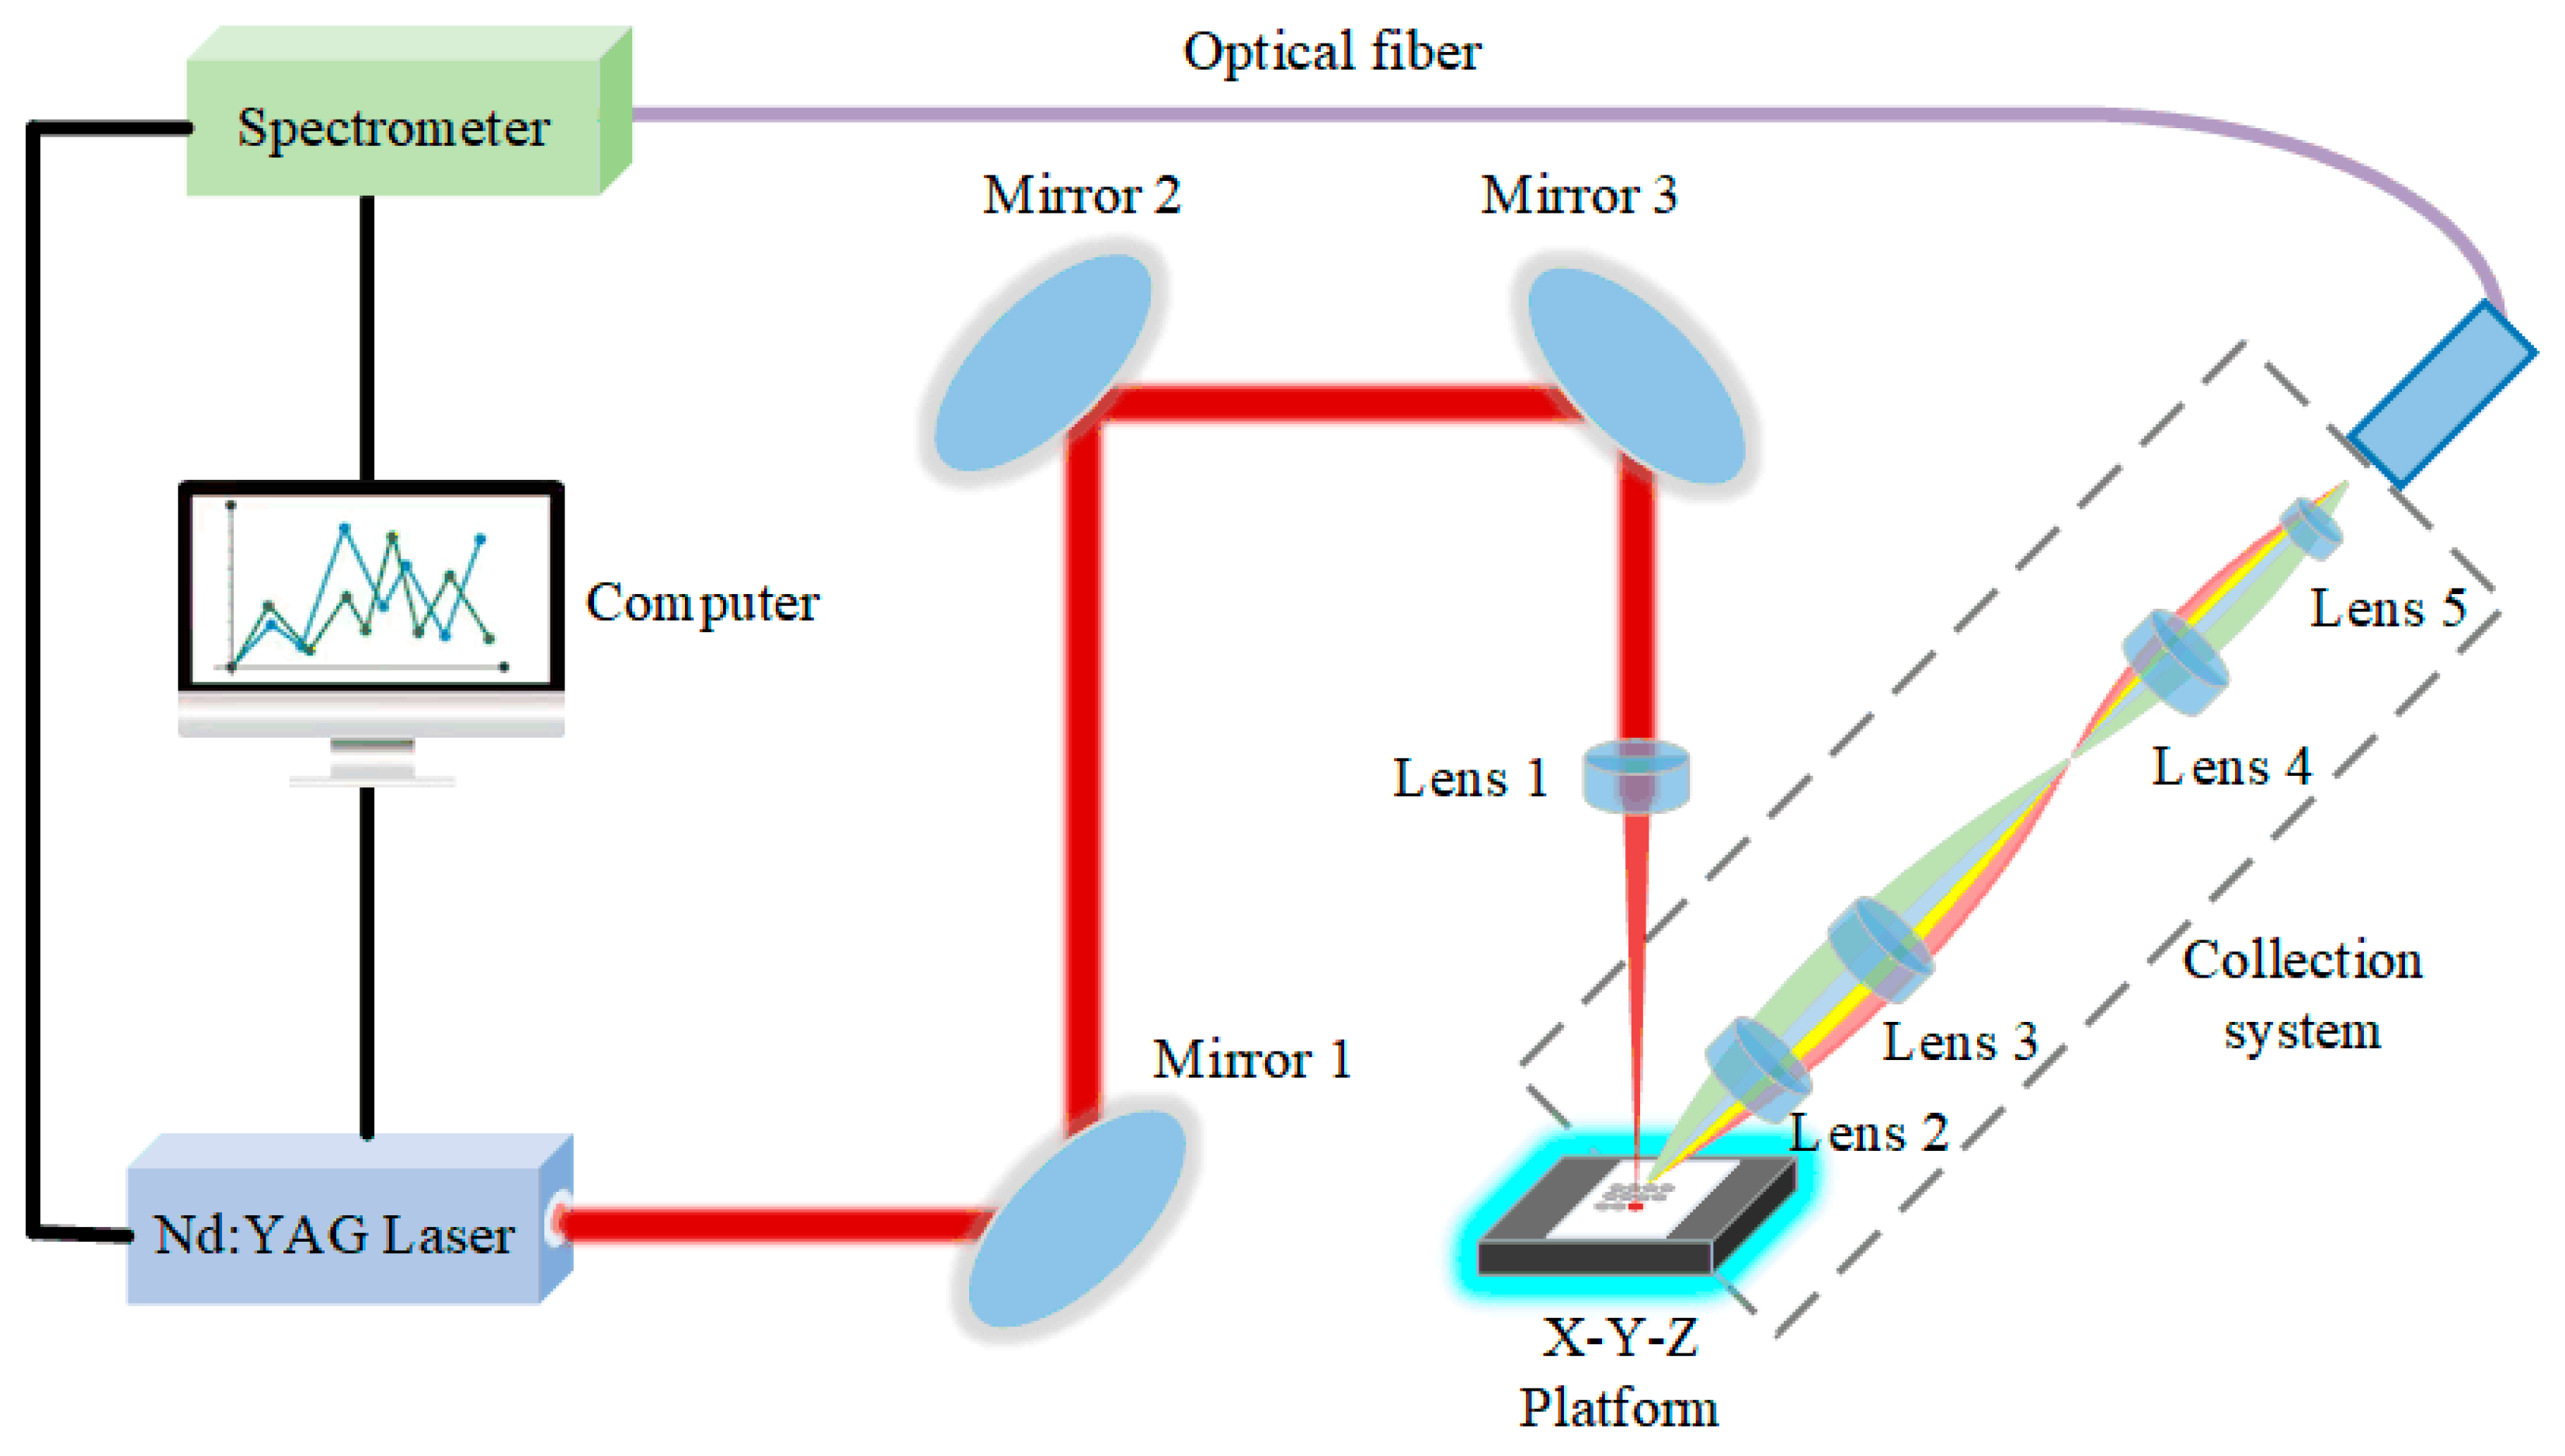
Figure 1. Diagram of LIBS experimental setup.
Spectroscj 02 00019 g001
Figure 2. The structure of sandwich model encryption diagram.
Spectroscj 02 00019 g002
Figure 3. (a) Photograph of sandwich model. (b) QR code of the text “http://www.tjut.edu.cn (accessed on 6 May 2023)”.
Spectroscj 02 00019 g003
Figure 4. LIBS spectra of original paper and four blocks.
Spectroscj 02 00019 g004
Figure 5. Decrypted image using the spectral line 324.75 nm.
Spectroscj 02 00019 g005
Figure 6. Decrypted image using the spectral line 327.40 nm.
Spectroscj 02 00019 g006
Figure 7. Decrypted image using the spectral line 670.79 nm.
Spectroscj 02 00019 g007
Figure 8. Spatial distribution mapping of the total intensity of three peaks after removing background and normalization.
Spectroscj 02 00019 g008
Disclaimer/Publisher’s Note: The statements, opinions and data contained in all publications are solely those of the individual author(s) and contributor(s) and not of MDPI and/or the editor(s). MDPI and/or the editor(s) disclaim responsibility for any injury to people or property resulting from any ideas, methods, instructions or products referred to in the content.