Abstract
The pharmaceutical industry has witnessed exponential growth in production volumes, driven by factors such as an aging global population and the COVID-19 pandemic. To meet the demand for high product quality alongside increased productivity, there is a growing emphasis on developing innovative Fermentation Analytical Technology (FAT) and Process Analytical Technology (PAT) tools for real-time performance monitoring, modeling, measurement, and control. Building on our earlier work involving in-line monitoring of Bordetella pertussis fermentations using fluorescence spectroscopy, this review explores and compares the applications of vibrational and fluorescence spectroscopy for real-time bioprocess monitoring. We examine recent technological advancements and ongoing challenges in the field. Various spectroscopic techniques are evaluated in terms of cost-effectiveness and practical applicability, with a particular focus on in-line spectroscopy as a promising, low-cost solution for effective bioprocess monitoring.
1. Introduction
On-line monitoring of bioprocesses has become increasingly important in recent years as a means of improving process control and product quality. With the establishment of PAT initiatives [1] for innovative pharmaceutical development, manufacturing, and quality assurance, on-line monitoring of bioprocesses is becoming crucial for meeting regulatory requirements [2]. PAT initiatives include real-time monitoring, data collection and analysis, and process control. New technologies have brought about significant changes in the field of bioprocess monitoring, particularly related to spectroscopic monitoring techniques such as vibrational [3], UV/Visible [4], and fluorescence spectroscopy [5]. These techniques allow real-time monitoring of bioprocesses, enabling researchers and industry practitioners to gain a deeper understanding of the processes and optimize them for maximum efficiency and productivity. However, each of these techniques have associated advantages and limitations that must be considered for matching a particular technique to a specific application. For example, while these techniques generally provide a correlation between the spectra and a particular process variable, these correlations are not universal and thus new calibration is required for each particular application [6].
From the analytical viewpoint, real-time monitoring of bioprocess variables other than pH, temperature, and dissolved oxygen is very challenging. For example, real-time measurements of product titer and protein concentration are still challenging, generally requiring off-line analysis. Furthermore, most bioprocesses are operated in a sterile control volume containing complex media involving a complex mixture of different biochemicals occurring in different quantities. While some of these biochemicals may occur in very small quantities, they may have a large effect on the outcome of the process. Hence, this is a strong motivation for on-line monitoring of these biochemicals without compromising the bioprocess operation. Hence, to be considered for on-line monitoring, the measurement technique must be sterile, non-invasive, and sensitive enough to measure one or more variables in a single run [7]. Optical and spectroscopic sensors that meet these criteria, include UV [4], mid- and near-infrared [8], Raman [9], and fluorescence [5] spectroscopy. These sensors can be paired with optical probes for on-line implementations.
Raw spectra obtained using spectroscopic methods typically contain noise and are multi-dimensional. Noise in spectra obtained from these methods must be addressed in order to obtain meaningful results. It is a common practise to capture and average multiple spectra to reduce the noise. Furthermore, collinearity in spectroscopic data is pervasive, thus increasing the sensitivity to noise of regression models based on spectra. To address this, different data pre-processing and filtering algorithms must be applied [10]. Various chemometric algorithms such as principal component analysis (PCA) [11], partial least squares (PLS) [12], multi-variate curve resolution (MCR) [13], and artificial neural networks (ANNs) [14] are used along with data pre-processing methods [15]. These methods can also be coupled with mathematical/statistical models to create hybrid models which can be used in process monitoring [16]. In recent years, artificial intelligence has revolutionized the field of process monitoring, owing to its ability to extract intricate nonlinear patterns from large datasets [17]. Within the particular area of pharmaceutical bioprocessing, development of soft sensors using deep learning has shown promising results in enhancing the accuracy and robustness of process monitoring systems [18,19,20].
Each of the spectra-based techniques available for on-line monitoring of bioprocesses have specific advantages and limitations that will determine the choice of a specific sensor for a particular application. For example, UV/Visible spectroscopy is a widely used technique for the determination of the concentration of substances in a sample, thus making it useful for tracking the progress of a bioprocess in real-time. However, it is less sensitive and less selective compared to vibrational spectroscopy [21]. Vibrational spectroscopy provides more detailed information on the chemical structure of a substance, but it comes with inherent complexities such as extensive sample preparation, expensive instrumentation, lower sensitivity for measuring analytes with low concentrations, and overlapping spectra for complex biological samples [22]. Fluorescence spectroscopy overcomes some of the limitations of vibrational spectroscopy as it is highly sensitive, non-invasive, and can be used to monitor a wide range of bio-molecules, including proteins, nucleic acids, lipids, and small molecules in real time. On the other hand, fluorescence spectroscopy can only detect molecules that exhibit intrinsic fluorescence, limiting its applicability to certain types of bio-molecules. Background fluorescence, photo-bleaching, sample turbidity, and sample pH are other factors that can affect the accuracy and precision of fluorescence measurements [23].
In this work, we examine the various spectroscopic techniques and their applications in bioprocess monitoring, as well as the challenges that must be overcome to fully realize the potential of these techniques. While the methods discussed in this paper are being widely applied, their application for real-time monitoring is still limited and overall reviews and critical comparisons of these methods are lacking. Thus, this review paper fills these knowledge gaps by providing an overview of the current state of the field and will serve as a valuable resource for researchers and industry practitioners working on developing in situ bioprocess monitoring systems using spectra-based sensors.
2. Real-Time Monitoring Methods
Due to the dynamic and variable nature of bioprocesses, their effective monitoring and control are essential to ensure optimal productivity, product quality, and resource efficiency [24]. Real-time monitoring involves the use of various sensing technologies, analytical instruments, and data acquisition systems to collect information directly from the bioprocess as it unfolds, without the need for intermittent sampling or off-line analysis. Currently, temperature, agitation & aeration and dissolved oxygen concentration (DO) and pH are standard real-time measurements in fermentation processes. In contrast, offline monitoring of key bioprocess parameters such as biomass, substrate concentration and product titer are mainly done off-line. In contrast, monitoring of key bioprocess parameters such as biomass, substrate concentration, and product titer is mostly carried out off-line [25].
Real-time monitoring, shown schematically in Figure 1, can be further divided into three main categories:
- In-line monitoring;
- On-line monitoring;
- At-line monitoring.

Figure 1.
Applications of different vibrational and fluorescence spectroscopy methods for real-time monitoring of bioprocesses.
Figure 1.
Applications of different vibrational and fluorescence spectroscopy methods for real-time monitoring of bioprocesses.
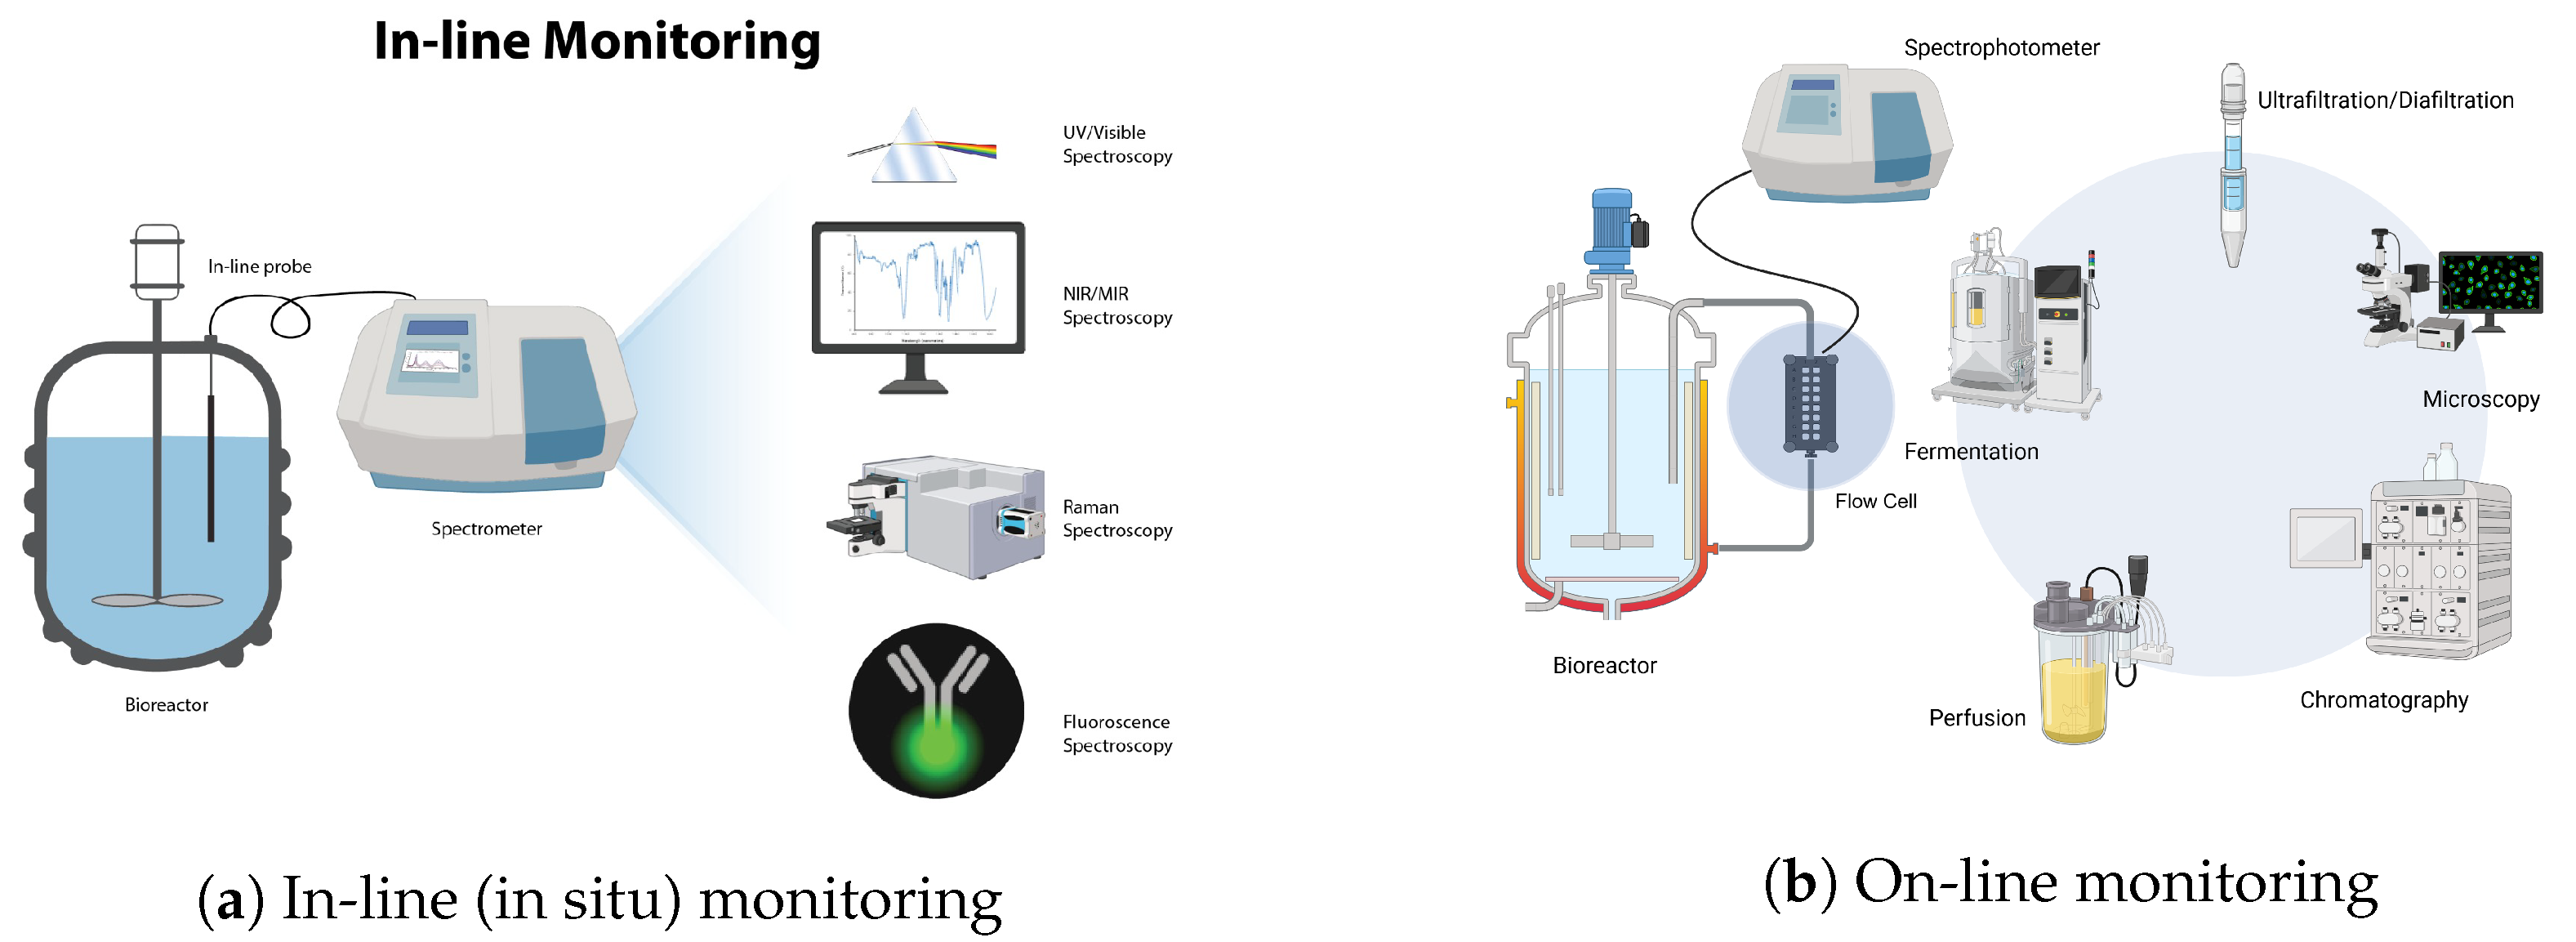
In-line monitoring refers to real-time measurement and analysis of process parameters that is conducted directly within the bioprocess stream, without disrupting or removing samples from the process. Generally, for in-line monitoring, a non-invasive optical probe is inserted in the bioreactor for data acquisition. In-line process analytics typically occur continuously whereby automatic measurements are repeatedly conducted for the duration of the operation. Hence, decisions and possible corrective actions can be automated based on the measurement data collected. On-line monitoring refers to measurements that are acquired through a built-in flow cell or “bypass” where further analysis takes place [26]. After analysis is completed, the sample is eventually recirculated back to the process vessel while ensuring that the flow cell remains sterile and that the sample is not contaminated. The design of the flow cell must also take into account factors such as flow rate, path length, and cell volume [24,26]. This method is employed when the measuring device cannot endure the harsh conditions present in the actual process vessel, such as high pressures or temperatures. In these scenarios, on-line measurement setups allow for continuous measurement, albeit with the caveat that the samples may not precisely replicate the conditions of the main process. On-line measurements also permit the use of measurement techniques that are impractical for in-line variants. For instance, reagents can be automatically added to the sample for analysis. Since these reagents must not be in direct contact with the final product, in-line measurement with reagents is typically unfeasible. At-line monitoring refers to measurement and analysis of process parameters using samples that are temporarily withdrawn from the bioprocess stream but are analyzed nearby or in close proximity to the process location [26].
3. Principles of Vibrational and Fluorescence Spectroscopy
Technological developments in optics and spectroscopy have led to the refinement and widespread adoption of spectroscopic methods for monitoring various aspects of bioprocesses, including cell growth, metabolism, product formation, and quality control. Spectroscopic methods can be obtained in real-time, they are non-invasive, and they exhibit multi-parametric analysis capabilities. In this section, we outline the principles of vibrational and fluorescence spectroscopy. While a comprehensive theoretical exploration of vibrational and fluorescence spectroscopy is beyond the scope of this review, this section briefly outlines relevant theoretical concepts as background for the subsequent discussion of applications.
Vibrational spectroscopy is a method used to analyze the chemical and physical properties of a sample by measuring its absorption or emission of infrared energy [27]. This approach is based on the principle that a molecule’s energy is quantized into levels corresponding to its vibrational modes, allowing molecules to absorb infrared radiation at frequencies specific to the vibrational energies of molecular bonds [3]. When a molecule absorbs infrared radiation, it transitions between vibrational states, causing a change in its dipole moment. The frequency of this absorbed radiation correlates with the molecule’s vibrational frequency, which is determined by the bond’s force constant and the mass of the vibrating atoms [28]. This relationship is given by the following equation:
where is the vibrational frequency, k is the force constant of the bond, and is the reduced mass of the molecule. The reduced mass , which accounts for both atoms involved in the vibration, is defined as follows:
where and are the masses of the two atoms involved in the vibration. In addition to the frequency, the intensity of the absorption is also affected by several experimental conditions, including the temperature and concentration of the sample, the path length of the radiation through the sample, and the orientation of the molecule with respect to the electric field of the radiation [29].
The energy of a molecule can be determined by measuring the absorption of energy at frequencies corresponding to its vibrational modes, primarily using infrared (IR) and Raman spectroscopy. In IR spectroscopy, a substance is exposed to infrared light, and the resulting absorption spectrum is recorded to identify chemical composition, as different bonds absorb at specific wavelengths [28,29]. The absorption spectrum is typically displayed as transmittance (T) or absorbance (A) versus the wavelength of the IR radiation. Using the Beer–Lambert Law, absorbance (A) relates to the concentration of absorbing species and the path length of radiation through the sample:
where A is the absorbance, is the molar absorptivity (a constant that depends on the compound being analyzed), c is the concentration of the compound, and l is the path-length of the radiation through the sample.
Alternatively, instead of absorption, photons reaching the sample may scatter upon collision with atoms, resulting in Stokes (lower-frequency) or anti-Stokes (higher-frequency) Raman scattering [30]. This phenomenon, which produces a unique spectrum, can be used to identify a molecule’s vibrational modes. The Raman shift, indicating frequency changes in scattered light, provides molecular structure information. Raman scattered light intensity is proportional to the number of molecules, aiding in concentration measurement [31]. The Raman scattering cross-section , indicating the likelihood of photon scattering, gives the Raman intensity I as follows:
where N is the number of molecules in the sample and I0 is the intensity of the incident light. The Raman scattering cross-section is generally much smaller than the absorption cross-section, making Raman spectroscopy less sensitive than techniques like UV/Vis and IR spectroscopy. However, the Raman shift is unique for each chemical bond, enabling the identification of specific functional groups within a molecule. The Raman spectrum, represented by scattered light intensity as a function of wavelength, reveals various vibrational modes as each mode scatters light at different wavelengths.
Fluorescence occurs when electrons in their excited singlet states pair with a second electron of opposite spin in the ground state [32]. This phenomenon occurs rapidly (emission rates of 108 per second) with a lifetime on the order of nanoseconds. Fluorescence usually results from aromatic rings present in the compounds and thus it can be used for quantifying species involving such structures, e.g., NADPH and amino acids such as tryptophan, tyrosine, and phenyl-alanine. Since the data obtained from NIR, Raman, or fluorescence are in the form of spectra, various chemometric methods that can extract statistically significant information from spectra can be utilized [27]. Figure 2 illustrates simplified energy diagrams depicting the energy transitions of infrared (IR), Raman, and fluorescence. In IR spectroscopy, molecules absorb infrared radiation, causing transitions between vibrational energy levels due to changes in dipole moments. Conversely, Raman spectroscopy involves the scattering of incident photons, where molecules transition to virtual energy states before returning to vibrationally excited states (Stokes scattering) or lower-energy states (anti-Stokes scattering), characterized by changes in polarizability. Fluorescence spectroscopy shows electronic excitation of molecules to higher energy levels, followed by emission of photons at longer wavelengths as molecules relax to their ground states.
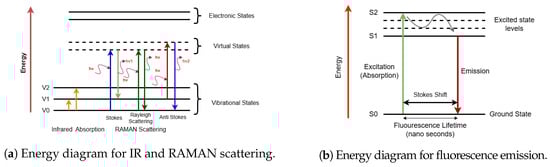
Figure 2.
Simplified illustration of molecular energy transitions in spectroscopy. (a) shows IR absorption as transitions between vibrational states and Raman scattering via virtual states, with Stokes and anti-Stokes shifts. (b) shows energy diagram for fluorescence, where a molecule absorbs light and transitions to an excited electronic state, similar to UV/Vis absorbance, and emits light while returning to the ground state. IR and Raman explore vibrational properties, while fluorescence involves electronic states, offering complementary molecular insights.
4. Applications
This section presents a summary of the utilization of different spectroscopic monitoring techniques in bioprocesses, encompassing real-time (both in-line and at-line) implementations. In exploring the applications of vibrational and fluorescence spectroscopy in bioprocess monitoring, it is essential to acknowledge not only their remarkable usefulness but also their inherent limitations. While these spectroscopic methods offer insights into the intricacies of biological systems, their effectiveness can be constrained by various factors discussed in the following sections.
4.1. UV/Visible Spectroscopy Applications
In-line monitoring of bioprocesses with UV/Vis spectroscopy has been widely applied mainly because it is a non-destructive and non-invasive technique that allows for real-time analysis of samples without the need for sample preparation or extraction. UV/Vis spectroscopy is useful for quantifying proteins and other aromatic rings containing amino acids, i.e., tyrosine, tryptophan, and phenyl-alanine, which typically absorb light at around 280 nm. It is also a well-established method for assessing biomass because cell suspension turbidity correlates well with cell. UV/Vis spectroscopy is well suited for direct monitoring of biomass concentration, coenzymes like NADH/NADPH, aromatic amino acids, derivatization reactions, and certain organic acids in bioreactors [33].
For example, ref. [34] used UV/Vis spectroscopy for in-line monitoring of color and total phenolics in wine fermentations. Multiple LED diodes along with a 100 μm path-length flow cell attached to the spectrometer were used to record UV/Vis absorption spectra from undiluted samples. Optical measurements could be made for undiluted samples only if a short optical path length (less than 1 mm) was used. In [34], it was confirmed that the LED phenolic sensor measurements strongly correlated with measurements performed with a reference UV/Vis spectrophotometer and that in-line measurements could be made in a practical manner after removal of yeast and pulp with a 2.0 μm filter. In [35], the authors used UV/Vis spectroscopy for detection and estimation of the cell density and viability of CHO cells. An industrial optical immersion probe attached to an ultraviolet/visible (UV/Vis) spectrometer was used for in-line monitoring of cell cultures. Chemometric methods such as PLS regression and multivariate curve resolution (MCR) methods were used for analyzing the spectra. With this approach, the authors were able to continuously monitor cell viability solely based on a UV/VIS sensor. In [36], the authors were able to monitor the laccase-catalyzed transformation of indigo carmine (IC). UV/Vis spectroscopy was combined with MCR to recover information from the spectral data. The results suggested that the combined use of UV/Visible spectroscopy and MCR can be used to uncover unexpectedly deep mechanistic evidence otherwise buried in experimental data. Indirect enzymatic assays or derivatization methods are standard approaches to measure these compounds via UV/Vis spectroscopy. Table 1 summarizes the bioprocess systems, monitoring methods, and applications of UV/Vis spectroscopy for in-line monitoring of bioprocesses found in the literature. Overall, most of the applications utilized UV/Vis spectroscopy combined with chemometric models for state variable prediction.

Table 1.
Applications of UV/Vis and NIR spectroscopy for real-time monitoring of bioprocesses.
Cost, Accuracy, and Limitations of UV/Vis
UV/Vis spectroscopy offers a simple, real-time analytical method for in situ monitoring of critical parameters within bioreactors. UV/Vis equipment can be up to half the cost of more complex systems like MIR or Raman spectroscopy. It is relatively affordable because it uses simpler optics and calibration methods, making it suitable for basic monitoring tasks [48]. Its low-cost equipment makes it accessible; however, it lacks the structural detail provided by IR or Raman spectroscopy. Its utility is therefore more limited to less complex monitoring needs. The accuracy of UV/Vis spectroscopy in real-time bioreactor monitoring typically ranges between ±3% and ±20% of full scale, with variability depending on the specific analyte, environmental conditions, and bioreactor setup. For biomass concentration measurements, UV/Vis sensors can achieve an accuracy of approximately ±3% to ±8% of full scale, especially when enhanced with chemometric analysis to reduce background interference [49]. The authors of [37] used photon density wave (PDW) spectroscopy, a special case of UV/Vis for the real-time biomass monitoring of Escherichia coli high-cell-density cultivations. Measurements were compared with a commercial turbidity probe and off-line OD and CDW measurements, achieving accurate (R2 = 0.96) cell dry weight predictions and detecting faulty process trends such as overfeeding and acetate accumulation.
For product titer monitoring, UV/Vis spectroscopy was found useful for detecting aromatic amino acids which absorb strongly at around 280 nm. This makes it suitable for protein purification in chromatography [50]. However, its effectiveness is limited for proteins with fewer aromatic rings and compounds like glycerol or methanol that lack chromophores. UV/Vis spectroscopy can also be sensitive to environmental changes and light-absorbing impurities, affecting measurement accuracy [51]. Additionally, UV/Vis is less selective, as it only measures absorbance at specific wavelengths without providing chemical structure information. In fermentation broths, distinguishing between different absorbing species is challenging due to overlapping spectra, and without additional data such as retention time or complementary spectral information, identifying and quantifying individual compounds is difficult. Components like phenol red in culture media can further interfere with UV/Vis readings, necessitating complex data analysis techniques for correction [52].
4.2. Applications of Infrared Spectroscopy
Infrared (IR) spectroscopy has emerged as a potent analytical tool for the analysis of mixtures of organic compounds such as the ones used in bioprocesses. Unlike UV/Vis, IR spectroscopy is more effective because it has unique characteristic vibrational frequencies for different metabolites in the IR range, enabling direct detection. Furthermore, it is non-invasive, thus allowing for real-time monitoring without any time delays or disruption to the bioprocess. Consequently, IR spectroscopy has found extensive application in in-line bioprocess monitoring. Based on the spectral range and monitoring application, infrared spectroscopy can be further classified into near-infrared (NIR) and mid-infrared range (MIR). MIR spectroscopy is more sensitive compared to NIR spectroscopy due to its ability to target fundamental vibrational transitions, which produce stronger and more distinct absorption bands [53]. It can excite specific vibrational modes in different compounds, and each compound produces a unique spectral signal. Compared to NIR, MIR spectroscopy experiences less scattering in various media resulting in improved signal quality and a higher signal-to-noise ratio. On the other hand, NIR devices are known for their stability against interference and are more cost-effective to implement as compared to MIR [27].
In [38], the authors investigated the feasibility of using near-infrared spectroscopy (NIRS) in situ combined with a metabolic flux model to provide real-time insights into metabolic responses in bioreactors. Pichia pastoris was used as a model system to show that NIRS measurements can be used as inputs for metabolic flux analysis models, where the latter were used for the optimization of cell metabolism in real-time. The results showed that the combination of on-line NIRS and PLS regression provided accurate predictions of biomass and glycerol with a precision equivalent to that obtained by off-line measurements. In [39], operations at different scales ranging from a shake flask (1 L) through 20 L, 100 L, and 1000 L up to 5000 L in bioreactor volume level were monitored with on-line NIR spectroscopy. The magnitude of the prediction error depended on the cultivation phase, with an average error of 4.18 mM on a 29 mM concentration range for all five runs in the prediction set, based on the combined 20 L and 100 L data. In the batch phase, the glucose consumption was highly correlated with biomass growth and prediction accuracy was high but for the fed-batch phase, when the glucose concentration was low and uncorrelated with biomass growth, the prediction accuracy was lower. In [54], the authors demonstrated the use of NIR spectroscopy for in-line monitoring of biomass, penicillin (PEN), and phenoxyacetic acid (POX) in a Penicillium chrysogenum fed-batch fermentation process. Spectra were acquired through the glass wall of the bioreactor, significantly reducing contamination risks and eliminating the need for immersion probes. Biomass predictions were highly accurate, with an RMSE of 9.8% of full scale, while penicillin (PEN) and phenoxyacetic acid (POX) showed errors of 18.0% and 15.9% of full scale, respectively.
In [40], MIR spectroscopy was used for in-line monitoring of 15 L G. xylinus bacterial fermentations. An ATR probe was inserted into the bioreactor through a standard DN 25 port. The geometric settings of the probe were kept constant to minimize spectral changes. Six scans per hour were performed with a resolution of 8 cm−1, in the range of 400–4000 cm−1. For analysis, the acquired spectral MIR data were mean centered and PLS regression was utilized for the monitoring of fructose, acetate, and gluconacetan concentrations in the broth. The model’s prediction errors, as a percentage of the full scale, showed high accuracy for most state variables. Fructose and phosphate had errors of 6.94% and 5.63%, respectively, while ethanol and acetate were particularly accurate, with errors of 1.14% and 0.67%. Ammonium showed a low error of 1.47%. However, gluconacetan exhibited a higher error at 22.3%, likely due to spectral overlap and low absorbance. Overall, the model provided reliable real-time monitoring, with the exception of some limitations for gluconacetan. The authors of [42] used MIR spectroscopy for the prediction of protein concentrations during an ultra-filtration/diafiltration (UFDF) step of monoclonal antibody extraction. Protein peaks were observed in the regions of 1450–1580 cm−1 and 1600–1700 cm−1 for amide II and amide I peaks, respectively. The coefficient of determination (R2), which is a measure of prediction accuracy of protein concentration, was reported to be 0.995 for protein concentration. At higher concentrations, however, authors reported prominent variations between in-line and off-line measurements of different batches. In [47], authors used a mid-infrared (MIR) U-bent fibre-optic sensor for real-time bioprocess monitoring during sophorolipid production via Starmerella bombicola fermentation. This sensor is a low-cost alternative to conventional ATR-FTIR spectroscopy since it uses fiber optics instead of expensive ATR crystals, thus enabling direct in situ monitoring. The MIR fibre-optic sensor showed less than 5% error for sophorolipid concentrations up to 80 g/L, but saturation increased errors to 10–15% at higher levels. Glucose monitoring had less than 5% error below 40 g/L, rising to 7–10% due to overestimation at higher concentrations. The sensor accurately distinguished lactonic vs. acidic sophorolipids with 5–8% error. The authors concluded that further calibration and signal processing could enhance accuracy, especially at higher concentrations. Advances in the use of infrared spectroscopy, along with the strategies utilized for on-line monitoring are summarized in Table 1.
Cost, Accuracy, and Limitations of Infrared Spectroscopy
Infrared (IR) spectroscopy has gained significant attention in recent years for its potential in in-line monitoring and control of bioprocesses. It is a non-invasive method which can be used for rapid in-line spectra acquisition, which is important as the concentration of metabolites and proteins can change very fast in fermentation broth. However, while infrared (IR) spectroscopy offers numerous benefits for in-line monitoring of bioprocesses, several limitations must be considered when implementing this technique. Unlike specific dyes or reactions that yield unique UV/Vis signals, IR absorbance arises from bond vibrations shared across many molecules. Therefore, even though the IR spectrum is unique for glucose, glutamate, amino acids, and other metabolites, it may also overlap with signals from other molecules, necessitating calibration models to infer exact concentrations [55].
NIR systems are generally four times as costly as standard UV spectrophotometers, while more advanced hyperspectral systems with InGaAs or HgCdTe detectors (needed for higher wavelength ranges up to 2500 nm) can escalate further in cost [56]. Compared to traditional wet chemistry or MIR, NIR is cost-effective due to reduced operational needs, though initial equipment investments remain high. NIR exhibits limited sensitivity for compounds present at concentrations below 0.1 percent [41]. Moreover, NIR exhibits heightened absorbance in aqueous solutions, resulting in broader peaks in NIR spectra, which can reduce the accuracy for detecting compounds present at low concentrations [57]. MIR spectroscopy has also been successfully applied in bioprocesses to measure various substances such as glucose, lactate, fructose, ammonia, acetic acid, and antibodies with measured values within the acceptable ranges (10–15%) when compared to off-line measurements.
The NIR region (800–2500 nm) provides greater penetration depth and non-destructive, rapid analysis capabilities, while MIR (2500–25,000 nm) offers more detailed chemical information but with limitations in penetration and a higher sensitivity to water interference. While MIR can detect and differentiate between metabolites by their unique absorbance peaks, the clarity and immediacy of the detection depend on the concentration, the sample composition, and the setup’s sensitivity. A key drawback of MIR is that the background solvent must be transparent within the spectral region of interest [54]. Akin to NIR, MIR experiences increased absorbance in aqueous solutions, leading to challenges in detecting trace compounds. Additionally, MIR equipment necessitates substantial data for model calibration [39]. MIR spectroscopy often suffers from low penetration depths, which limits its ability to analyze dense or opaque samples without additional preparation. In [25], authors highlighted that higher penetration is crucial in flow cell-based measurements, which is a common setup in at-line monitoring methods.
4.3. Raman Spectroscopy
Raman spectroscopy stands out as a powerful spectroscopic technique suitable for on-line monitoring purposes. Like NIR and MIR, Raman provides molecular-level information about compounds by probing vibrational modes of molecules and its spectra are unique for specific metabolites. While infrared spectroscopy relies on overtone and combined band absorption of light, Raman depends on inelastic scattering of monochromatic light. In contrast to near-infrared (NIR) and mid-infrared (MIR) spectroscopy, Raman spectroscopy exhibits lower absorbance for polar molecules like water, making it particularly well suited for analysis in aqueous environments and thus a prime candidate for PAT applications in the pharmaceutical industry [58]. Being a non-destructive and non-invasive method, Raman spectroscopy allows for repeated measurements on the same sample, providing insights into process dynamics over time. Its chemical specificity facilitates the identification and quantification of various compounds present in the bioprocess, including metabolites, nutrients, and by-products. The use of Raman spectroscopy for on-line monitoring of bioprocesses is well established in industry and a broad range of options available for bioprocess applications [59].
For example, ref. [60] combined a mechanistic model with Raman spectroscopy for the real-time monitoring of fed-batch penicillin production. Batch fermentations were performed in a 10 L stirred bioreactor with an actual working volume of 6 L. A Raman spectrometer with a stainless steel immersion probe was fitted into the bioreactors. A laser with an optical excitation of 785 nm and 395 mW of power output was utilized. Signals were transmitted via a fiber optic cable to a cooled charge-coupled device (CCD) camera maintained at −40 °C. A hybrid model based on the combination of the PLS model with a mechanistic model was then used to accurately predict multiple bioprocess parameters including biomass and penicillin productivity. The key advantage of using a hybrid model for process monitoring is that the resulting solution space is limited by material balances, thus providing better extrapolation results for regions of the variable space that were not used for model calibration. Thus, confining the solution space by satisfying a mechanistic model enhances the model’s predictive capabilities, while automated model generation reduces the expertise necessary for industrial deployment [61].
In [62], the authors implemented Raman spectroscopy for the monitoring of downstream chromatographic processing (DSP) of monoclonal antibodies. For spectra acquisition, an in-line flow cell with a reduced dead volume was used along with a reflector to increase the signal intensity. PLS regression was utilized for model development to predict mAb concentration in the harvest. Overall, the authors demonstrated high predictive accuracy, low RMSEP, and strong robustness in estimating IgG1 concentrations in chromatography, although the predictions became uneven at very low IgG1 concentrations and there was under-prediction at high concentrations. Scientists in [63] implemented Raman spectroscopy for monitoring affinity chromatography unit operation on an AKTA Avant 150 system (Cytiva, Sweden). A spectroscopy probe was integrated into the AKTA chromatography system to continuously monitor the concentration of proteins and other critical quality attributes (CQAs) directly in the chromatographic effluent. After that, multiple chemometric methods (KNN, CNN, PCR) were utilized for model development and validation. The integration of automated systems and machine learning models significantly reduced the time required for calibration and validation of Raman spectroscopy models, achieving quality measurements every 38 s. In [64], Raman spectroscopy was used as a process analytical technology tool for the monitoring and control of ethanol fermentation carried out with Saccharomyces cerevisiae yeast. Raman spectra was obtained during the fermentation through the reactor wall by a Raman spectrometer connected with optic fiber and a long focus Raman probe. The focal point of the Raman probe was adjusted manually immediately behind the inner side of the reactor wall, minimizing the influence of scattering due to the solid particles (cells). Further, real-time data analysis was applied using partial least squares regression (PLS) method. The root mean square error of prediction (RMSEP) as a percentage of the full-scale measurement for glucose and ethanol was 2.76% and 4.19%, respectively. Table 2 summarises the applications of raman spectroscopy for the real-time monitoring of bioprocesses.
Table 2.
Raman applications for real-time monitoring of bioprocesses.
Cost, Accuracy, and Limitations of Raman Spectroscopy
As the industry demand increases, different types of Raman spectrometers have been developed, which allow for taking measurements down to the microgram scale. However, accuracy is often challenged due to the noise, thus requiring the use of models that, in combination with the measured spectra, lead to better results. For example, in [63], the authors used multiple models, including KNN, CNN, SVR, PCR, and PLS, for the model calibration. The trained models were applied to a second affinity chromatography run to predict product quality attributes in real-time. An emphasis was also placed on the importance of large calibration datasets to achieve high model accuracy. This requirement can be a limitation, especially in early-stage development where large datasets might not be available. In summary, while the studies discussed in the previous section demonstrate significant advances in using Raman spectroscopy for in-line product quality monitoring, several limitations need to be addressed to fully realize its potential. These include the need for large and representative datasets, optimal preprocessing techniques, handling environmental and noise sensitivities, high initial costs, and ensuring regulatory compliance [67]. Raman spectrometers, particularly those with high-quality lasers and detectors, can be 10 times more expensive upfront than other spectroscopy methods due to the need for precise alignment and high sensitivity to detect weak Raman signals. Unlike in situ ATR-FTIR monitoring, which is limited by fiber optic absorption, Raman and NIR techniques can take measurements through glass or plastic media. Raman spectroscopy is often challenged by the low solubility of pharmaceutical compounds in various solvents and the presence of strongly scattering solvents, which can complicate the Raman signature. Additionally, Raman scattering is inherently weak, leading to lower sensitivity compared to other spectroscopic techniques, which is problematic for low-concentration analytes in dilute bioreactor systems. For large bioreactors, Raman’s limited penetration depth restricts its applicability for in situ monitoring [68].
Fluorescence interference is another challenge because the emitted fluorescence signal from molecules in the sample can overlap with the Raman scattering signal, distorting the spectrum [69]. This is particularly problematic in complex biological samples with multiple fluorophores. To mitigate this, the excitation wavelength should be chosen to minimize overlap with fluorescence emission. The 785 nm laser is often used because it balances reduced fluorescence interference and adequate Raman signal strength. Additionally, the laser’s energy and power must be considered, as higher energy can heat and damage samples, affecting their integrity. It also provides an optimal balance between penetration depth and signal strength.
4.4. Fluorescence Spectroscopy
Fluorescence spectroscopy is an attractive cost-effective option for in situ monitoring due to its inherent benefits. It is non-invasive, offering high sensitivity and the capability to detect multiple components even at low concentrations [5,70]. Moreover, the equipment required for fluorescence spectroscopy is significantly less expensive (as low as one-tenth) when compared to alternatives like Raman or NIR [70,71]. Additionally, it does not consume analytes and additional reagents, nor does it require specialized sample preparation procedures. Considering that some bioprocesses can span weeks, once configured, a fluorometer can perform measurements over an extended period without requiring recalibration.
Few studies have been reported where fluorescence spectroscopy was used for in situ monitoring of bioprocesses in an industrial setup. Fluorescent signals emitted by proteins within cells [72] and vitamins [73] have proven effective in tracking microbial growth. Common fluorescent compounds involved in cellular growth and metabolic activity include cofactors like NADH and NADPH, fluorescent amino acids such as tryptophan, tyrosine, and phenylalanine, as well as various vitamins like riboflavin and pyridoxine. These compounds exhibit maximum fluorescence signals at different excitation/emission wavelength pairs (ex/em). Consequently, employing 2D fluorometry to scan the culture bulk throughout a bioreaction allows for the dynamic monitoring of all fluorophores, which directly or indirectly reflects changes in cellular concentration, metabolome, and cellular environment [73,74]. In [75], the authors utilized 2D fluorometry for the in-line monitoring of mammalian cells in a fed-batch bioreactor system for IgG1 protein production. In-line monitoring was achieved by inserting an in-house developed probe in the bioreactor, which was connected with the spectrometer using optical fibers. Although the dynamics of single fluorophores could not be correlated with the dynamics of the target state variables, chemometric based analysis of the fluorescence spectra helped in the accurate approximation of viable cell density and glycoprotein. In another work, ref. [76] used synchronous fluorescence spectroscopy (SFS) as a new tool for real-time monitoring of animal cell cultures in bioprocesses. The authors compared SFS with traditional two-dimensional (2D) fluorometry and highlighted the advantages of SFS, such as improved peak resolution and recording speed. Experiments were conducted using bioreactor cultures of three monoclonal antibody-producing CHO cell lines. It was shown that both 2D and synchronous fluorometry techniques provided enough information to distinguish the cultures highlighting the potential benefits for improving process control and meeting the requirements of process analytical technology (PAT) in biopharmaceutical manufacturing. In [77,78], the authors used an LED-based 2D fluorescence spectroscopy system for the in-line monitoring of CHO cell cultures (total cell count, viable cell count, and cell viability) in a fed-batch setup. The new sensor was able to trace the cell’s metabolic state in a fast and reliable manner. Cellular distress was quickly detected as a deviation from normal batch operation. In addition to that, spectral data provided information about the lactate metabolism shift and cellular respiration during the cultivation process. Overall, the authors demonstrated that the 2D fluorescence device is a highly sensitive tool for process analytical technology applications in mammalian cell cultures.
In [79], fluorescence spectroscopy was combined with off-gas analysis for the on-line monitoring of Streptomyces coelicolor fed-batch fermentations. Fluorescence spectra were collected using a spectrofluorometer which measured the spectra through a borosilicate glass window located in a recirculation loop connected to the bioreactor. A step-by-step variable elimination method was applied to the three-way fluorescence data, resulting in simpler and more accurate N-PLS models. The analysis revealed four spectral profiles present in the fluorescence data, three of which were identified as pyridoxine, NADPH, and flavin nucleotides, respectively. Similarly, the authors in Ref. [80] used 2D fluorometry for the in-line monitoring of batch cultivation of wild-type Escherichia coli cultures in a 10 L bioreactor scale, using an immersion probe. The fluorometer was constructed to measure the fluorescence of tryptophan, NADH, and FAD/FMN. These fluorophores are part of organisms’ metabolism and their concentration in culture supernatent can be correlated with growth and product titer concentrations, allowing the multi-wavelength fluorometry as an on-line monitoring tool. Table 3 presents the list of applications of fluorescence spectroscopy in real-time monitoring of bioprocesses.
Table 3.
Overview of fluorescence-based in-line monitoring methods in various pharmaceutical bioprocesses.
Cost, Accuracy, and Limitations of Fluorescence Spectroscopy
Fluorescence spectroscopy is generally less expensive than Raman spectroscopy due to simpler instrumentation and lower operating costs. A simple fluorometer with two excitation lights can be ten times cheaper than a standard Raman skid, as it uses cheaper light sources and detectors compared to those required for a Raman system. NIR spectroscopy also tends to be more expensive than fluorescence spectroscopy due to the need for more complex optical components and data processing tools [85]. In situ use of fluorescence spectroscopy offers high accuracy comparable to off-line measurements (as shown in the previous section), with the added benefits of increased data acquisition speed, reduced sample volume, and continuous monitoring capabilities. Its application in bioprocess monitoring provides a reliable and efficient alternative to traditional off-line methods.
Despite many advantages, fluorescence spectroscopy is not well established in industry because of some of its limitations. For example, Ref. [86] observed that fluorescence signals can be highly sensitive to changes in bioreactor conditions such as pH, temperature, and ionic strength. These variations can affect the fluorescence intensity and spectra, complicating the interpretation of results and requiring stringent control of experimental conditions. Another limitation of the fluorescence-based sensor is its sensitivity to environmental conditions such as pH fluctuations, which can potentially affect the accuracy of the measurement. To mitigate this, the use of pH-resistant fluorescent probes and advanced sensing techniques is recommended. These probes maintain stable emission intensities across varying pH conditions, enhancing the reliability of real-time metabolic monitoring [87]. Additionally, implementing dual-wavelength excitation or ratiometric fluorescence measurement methods reduces sensitivity to external disturbances and improves measurement robustness [88]. Sometimes, the components of the bioreactor can exhibit auto-fluorescence, which can interfere with the fluorescence of other fluorescent components. Techniques like synchronous fluorescence spectroscopy and lock-in amplification have been developed to reduce background noise, but these add complexity and cost to the system [76]. Sometimes, prolonged exposure to the excitation light can cause photo-bleaching, where the fluorescent molecules lose their ability to fluoresce. This results in a decrease in signal over time, which can compromise long-term monitoring and require frequent recalibration or replacement of fluorescent probes. Fluorescence spectroscopy uses intrinsic fluorescence of compounds that are present and are part of organisms’ metabolic pathways. Notably, most mammalian bioprocesses now rely on serum-free and protein-free media, although they do contain free amino acids and vitamin blends, which emit fluorescence. Unlike microbial fermentations, where cellular growth can be linked directly to the fluorescence of amino acids or vitamins, mammalian cells cannot produce these vitamins or fluorescent amino acids. Thus, analyzing the entire spectra using multivariate chemometric techniques becomes necessary in these scenarios [75].
5. Data Preprocessing and Sensor Selection for Spectroscopic Methods
5.1. Data Preprocessing
Before any substantive analysis can be conducted on the acquired data from spectroscopic measurements, they require preprocessing to deal with noise, remove baselines, normalize the data, and correct for other instrumental or sampling errors. Chemometrics offers a range of techniques, such as smoothing, normalization, and baseline correction, to prepare the raw spectra data for further analysis. It involves using statistical and mathematical techniques on analytical data to optimize the gathering and extraction of valuable information. Regardless of the selected spectroscopic method, spectral data often exhibit high collinearity, meaning that direct regression techniques such as ordinary least squares (OLS) fail due to matrix singularity issues [11]. This necessitates the use of dimensionality reduction techniques, such as Principal Component Analysis (PCA) or Partial Least Squares (PLS), to extract the most relevant spectral features while minimizing redundancy [12]. PCA reduces the dimensionality of spectral data by capturing major variance components within the spectra. On the other hand, PLS can be used to predict variables of interest by maximizing correlations between the input spectra with the target metabolite concentration, making it the preferred choice for bioprocess applications. However, both PCA and PLS assume linear relationships, which may not hold for complex metabolic systems where non-linear variations in spectral response occur.
To address non-linearity, machine learning models such as Support Vector Regression (SVR) and Artificial Neural Networks (ANNs) have been increasingly applied in metabolite monitoring. SVR effectively handles non-linear relationships by mapping spectral data into higher-dimensional spaces, while neural networks capture complex, dynamic spectral patterns [89]. For example, in [90], the authors demonstrated the effectiveness of machine learning in reducing noise in Raman spectral data for real-time bioprocess monitoring. The authors employed advanced machine learning methods, including orthogonal feature selection combined with algorithms such as Random Forest, Gradient Boosting, and ElasticNet regression. These methods efficiently isolated and retained critical spectral features, while removing redundant and irrelevant spectral signals, significantly mitigating the issues of fluorescence interference, baseline drift, and signal overlap, which are common in Raman spectroscopy. This approach substantially improved the clarity and reliability of Raman spectral profiles, improving the predictive accuracy of key fermentation parameters, and demonstrating a clear advantage over traditional noise reduction methods in complex bioprocess environments.
However, machine learning models alone may be sensitive to process disturbances and measurement noise, which can lead to erroneous predictions. To mitigate this, hybrid modeling approaches, such as Kalman filters, integrate sensor data with mechanistic bioprocess models, filtering out noise while improving real-time inference accuracy [20]. Hybrid modelling based approaches have been successfully applied in bioprocesses where sensor reliability is affected by noise, spectral interferences, or external disturbances. In terms of scale-up, despite the benefits of chemometric and machine learning models combined with spectroscopic sensors, practical implementation challenges persist. Model calibration requires extensive, representative datasets, which are often constrained by industrial limitations related to time and cost [91]. Maintaining model accuracy demands regular recalibration due to equipment aging, media composition shifts, or environmental variations [92]. Transferability of models developed in laboratory conditions to large-scale processes is limited by sensor configuration differences and scale-related disturbances [93]. Additionally, integrating real-time hybrid methods such as Kalman filtering involves complex computational requirements that may exceed the available infrastructure [20]. Addressing these challenges through adaptive modeling and systematic validation remains crucial for successful industrial application.
Another challenge in spectral data analysis is the presence of highly correlated variables, which leads to difficulties in obtaining reliable regression coefficients due to singularity in the R’R matrix [11]. The problem arises because standard least squares methods assume an invertible R’R matrix, but in high-dimensional spectroscopy datasets, this assumption breaks down. The solution involves using chemometric techniques such as PCA, PLS, or non-linear regression methods to transform the dataset into a smaller and numerically better conditioned input for analysis. However, despite these preprocessing approaches, prediction of the variables of interest from spectra may be limited due to a lack of observability, i.e., lack of strong correlation between the variables of interest to spectra. In such cases, combining chemometrics with Kalman filtering or Bayesian estimation improves inference, especially in dynamic metabolic processes where fluctuations in NADH, ROS, and protein synthesis may affect the correlation between spectra and target variables [94].
Ultimately, selecting the right combination of chemometric preprocessing and filtering techniques is essential for improving spectroscopic measurement accuracy. For simple linear relationships, PLS is often sufficient, but for more complex metabolic interactions, SVR, neural networks, or Kalman filtering methods provide more robust predictions. This combination of spectroscopy, chemometric preprocessing, and real-time filtering has proven effective in industrial bioprocess applications, ensuring reliable metabolite monitoring and process optimization.
5.2. Spectroscopic Sensor Selection
From the modeling point of view, the selection of appropriate sensors for spectroscopic methods in bioprocess monitoring requires a comprehensive approach to effectively interpret real-time data. Figure 3 presents a framework for real-time bioprocess monitoring and modeling. The framework integrates mechanistic and data-driven modeling to describe the complex dynamics of bioprocesses. Mechanistic modeling relies on fundamental principles such as mass balance, kinetic laws, and transport laws to represent the underlying biological and physicochemical processes. In parallel, data-based modeling employs machine learning techniques, including Partial Least Squares Regression (PLSR), Artificial Neural Networks (ANNs), polynomial regression, and Gaussian processes, to capture non-linear relationships and enhance predictive accuracy. A hybrid model combines mathematical (mechanistic) and data-driven approaches to improve process monitoring and prediction accuracy. In such models, the mechanistic component uses fundamental principles, such as biochemical kinetics or mass balances, to describe known relationships within the system explicitly. At the same time, the data-driven component, often using machine learning or statistical methods (e.g., Partial Least Squares regression), captures complex relationships from experimental data, addressing uncertainties or dynamics not fully represented by theoretical knowledge. As an example, in [95], the authors employed a hybrid modeling approach to monitor Bordetella pertussis fermentation by combining mechanistic and empirical models. The mechanistic model utilized biochemical principles to describe oxidative stress pathways involving NADPH and reactive oxygen species (ROS), while the empirical model applied Partial Least Squares (PLS) regression to in-line fluorescence spectroscopy data to predict key fermentation parameters. Integration of these two models through an Extended Kalman Filter (EKF) enabled real-time state estimation by continuously updating predictions from spectral measurements. This hybrid strategy addressed the shortcomings of purely empirical or mechanistic approaches, substantially improving prediction accuracy, robustness, and real-time monitoring capabilities.
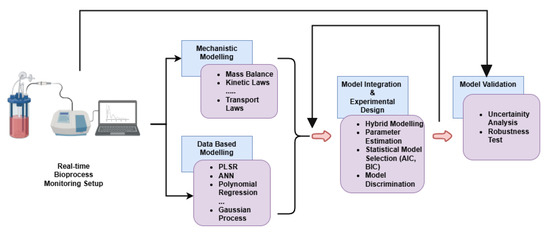
Figure 3.
Framework for real-time bioprocess monitoring and modeling.
The choice of the appropriate spectroscopic method for monitoring metabolites also depends on the optical properties, specificity, sensitivity, cost, industrial feasibility, and robustness of the compound for on-line applications. Many metabolites do not exhibit intrinsic fluorescence, unless they contain aromatic rings or cofactors such as NADH and FAD, making direct fluorescence detection challenging [5]. However, fluorescence spectroscopy can still be used for indirect monitoring by tracking metabolic markers such as NADH, tyrosine, or tryptophan, which may be indirectly correlated with target metabolite levels [73]. UV/Visible spectroscopy is another potential method, but it generally requires chromophores or chemical derivatization to enhance absorption, making it less practical for real-time applications [96]. Near-infrared (NIR) spectroscopy is advantageous due to its ability to detect overtone and combination bands of molecular vibrations, which allows for the analysis of C–H, N–H, and O–H bonds, though its lower specificity necessitates chemometric modeling for reliable metabolite estimation [22]. Raman spectroscopy, in contrast, provides a highly specific molecular fingerprint for metabolites, making it one of the best techniques for direct detection of compounds like glutamate, despite its lower sensitivity compared to fluorescence [9].
Among these methods, Raman spectroscopy offers the highest specificity for metabolite detection but is also the most expensive, typically costing ten to fifteen times more than fluorescence spectroscopy, which limits its feasibility for routine industrial monitoring. Fluorescence spectroscopy, by comparison, is a more affordable alternative ($10 k–30 k) and can be applied to indirect metabolite monitoring, particularly when using metabolic proxies such as NADH fluorescence [23]. NIR spectroscopy, with its moderate cost ($50 k–100 k), balances affordability and information content, making it a preferred choice for in-line Process Analytical Technology (PAT) applications, although its lower specificity requires advanced chemometric calibration [21]. When direct Raman monitoring is prohibitively expensive ($100 k–300 k), a fluorescence-based inference model combined with a Kalman filter can serve as a cost-effective alternative. This hybrid approach enhances measurement accuracy by using fluorescence signals as proxies for metabolite levels, while the Kalman filter corrects real-time fluctuations and compensates for sensor noise. For instance, glutamate levels can be estimated through NADH fluorescence dynamics, with the Kalman filter improving real-time inference by integrating metabolic equations [20,97]. This method has been successfully implemented in biopharmaceutical and industrial bioprocesses, where maintaining accurate real-time monitoring is crucial for process optimization. For industrial applications, fluorescence and NIR spectroscopy are the most commercially available and robust options, while Raman remains specialized due to cost constraints and sensitivity limitations.
Table 4 compares different spectroscopic methods in terms of their cost and robustness for industrial use. Table 5 compares the specificity, sensitivity, and applicability of different spectroscopic techniques for metabolite monitoring, providing a comparative analysis of their suitability for bioprocess applications. Table 4 presents a detailed comparison of the cost, industrial feasibility, and in-line/on-line applicability of these spectroscopic methods, highlighting their robustness and commercial availability for real-time monitoring in industrial settings. These tables offer a structured overview of the advantages and limitations of each technique, facilitating an informed choice for practical implementation in biopharmaceutical and industrial bioprocesses [21,23].
Table 4.
Comparison of spectroscopy methods based on cost, industrial applicability, and commercial availability for process analytical technology (PAT) applications.
Table 5.
Comparison of spectroscopy methods in terms of specificity, sensitivity, and whether they provide direct or indirect measurements.
6. Conclusions
The adoption of spectroscopic techniques for real-time monitoring of pharmaceutical bioprocesses has advanced significantly, driven by the need for improved process control, product quality, and regulatory compliance under Process Analytical Technology (PAT) initiatives. This review highlights the key spectroscopic methods—UV/Vis, infrared (NIR/MIR), Raman, and fluorescence spectroscopy—evaluating their advantages, limitations, and applicability in real-time bioprocess monitoring. UV/Vis spectroscopy remains a cost-effective and widely used method for biomass and metabolite concentration monitoring, but its selectivity is limited. Infrared spectroscopy (NIR/MIR) provides more detailed chemical insights, although challenges such as signal interference in aqueous environments persist. Raman spectroscopy, with its ability to provide specific molecular fingerprints, is highly promising for direct metabolite detection but is often cost-prohibitive for industrial implementation. Fluorescence spectroscopy, being both cost-effective and sensitive, has demonstrated strong potential for in-line monitoring of cellular metabolism, though its application is constrained by autofluorescence and photobleaching effects.
The integration of chemometric and machine learning techniques has further enhanced the capabilities of these spectroscopic methods, enabling real-time data interpretation and predictive modeling. However, challenges such as signal noise, sensor calibration, and environmental interferences must be addressed to fully realize the potential of spectroscopy-based PAT applications. Future research should focus on hybrid modeling approaches, improved sensor designs, and automation strategies to enhance the robustness of real-time spectroscopic monitoring in pharmaceutical bioprocessing. Emerging spectroscopic PAT techniques hold significant promise for applications in mRNA production and cell-free protein synthesis (CFPS) systems. As mRNA therapeutics and vaccines continue to gain global importance, advanced real-time monitoring tools are crucial to optimizing yield, stability, and quality control. Spectroscopic methods such as Raman, NIR, and fluorescence spectroscopy can provide real-time insights into nucleotide stability, polymerase activity, and metabolite consumption in CFPS systems. With the rapid advancements in AI-driven spectroscopy, integrating these techniques into continuous biomanufacturing platforms could revolutionize the scalability and efficiency of next-generation biotherapeutics.
Author Contributions
I.M.T.: review, writing, supervision, project administration, and formal analysis. H.B.: Writing—review and editing, validation, supervision, funding acquisition, and formal analysis. M.A.: Writing—review and editing, conceptualization. A.M.: writing—review and editing, writing—original draft, methodology, conceptualization, formal analysis, and data curation. All authors have read and agreed to the published version of the manuscript.
Funding
This work was financially supported by Sanofi and Mitacs (IT6479).
Institutional Review Board Statement
Not applicable.
Informed Consent Statement
Not applicable.
Data Availability Statement
No new data were created or analyzed in this study.
Acknowledgments
The authors are immensely grateful to Boris Tartakovsky (National Research Council, Montreal) and Ana Lucia Diaz de Leon Derby (University of Waterloo) for their support.
Conflicts of Interest
Hector Budman has received research grants from Sanofi. Ibrahim M. Tamer owns stocks in Sanofi. The funding sponsors had no role in the design of the study; in the collection, analysis or interpretation of data; in the writing of the manuscript and in the decision to publish the results.
References
- Hinz, D.C. Process analytical technologies in the pharmaceutical industry: The FDA’s PAT initiative. Anal. Bioanal. Chem. 2006, 384, 1036–1042. [Google Scholar]
- Darrow, J.J.; Avorn, J.; Kesselheim, A.S. FDA approval and regulation of pharmaceuticals, 1983–2018. JAMA 2020, 323, 164–176. [Google Scholar]
- Sathyanarayana, D.N. Vibrational Spectroscopy: Theory and Applications; New Age International (P) Limited: Delhi, India, 2015. [Google Scholar]
- Chen, Z.; Dinh, H.N.; Miller, E.; Chen, Z.; Deutsch, T.G.; Dinh, H.N.; Domen, K.; Emery, K.; Forman, A.J.; Gaillard, N.; et al. UV-vis spectroscopy. In Photoelectrochemical Water Splitting: Standards, Experimental Methods, and Protocols; Springer: Berlin/Heidelberg, Germany, 2013; pp. 49–62. [Google Scholar]
- Royer, C.A. Fluorescence spectroscopy. In Protein Stability and Folding: Theory and Practice; Springer: Berlin/Heidelberg, Germany, 1995; pp. 65–89. [Google Scholar]
- Vasilakou, E.; Machado, D.; Theorell, A.; Rocha, I.; Nöh, K.; Oldiges, M.; Wahl, S.A. Current state and challenges for dynamic metabolic modeling. Curr. Opin. Microbiol. 2016, 33, 97–104. [Google Scholar]
- Junker, B.; Wang, H. Bioprocess monitoring and computer control: Key roots of the current PAT initiative. Biotechnol. Bioeng. 2006, 95, 226–261. [Google Scholar]
- Ferrari, M.; Mottola, L.; Quaresima, V. Principles, techniques, and limitations of near infrared spectroscopy. Can. J. Appl. Physiol. 2004, 29, 463–487. [Google Scholar]
- McCreery, R.L. Raman Spectroscopy for Chemical Analysis; John Wiley & Sons: Hoboken, NJ, USA, 2005. [Google Scholar]
- Workman, J.J., Jr.; Mobley, P.R.; Kowalski, B.R.; Bro, R. Review of chemometrics applied to spectroscopy: 1985–1995, Part I. Appl. Spectrosc. Rev. 1996, 31, 73–124. [Google Scholar] [CrossRef]
- Maćkiewicz, A.; Ratajczak, W. Principal components analysis (PCA). Comput. Geosci. 1993, 19, 303–342. [Google Scholar]
- Wold, S.; Sjöström, M.; Eriksson, L. PLS-regression: A basic tool of chemometrics. Chemom. Intell. Lab. Syst. 2001, 58, 109–130. [Google Scholar]
- De Juan, A.; Tauler, R. Multivariate curve resolution (MCR) from 2000: Progress in concepts and applications. Crit. Rev. Anal. Chem. 2006, 36, 163–176. [Google Scholar]
- Agatonovic-Kustrin, S.; Beresford, R. Basic concepts of artificial neural network (ANN) modeling and its application in pharmaceutical research. J. Pharm. Biomed. Anal. 2000, 22, 717–727. [Google Scholar]
- Kim, Y.J.; Kim, S.; Kim, J.W.; Yoon, G. Data preprocessing and partial least squares regression analysis for reagentless determination of hemoglobin concentrations using conventional and total transmission spectroscopy. J. Biomed. Opt. 2001, 6, 177–182. [Google Scholar] [CrossRef]
- Narayanan, H.; von Stosch, M.; Feidl, F.; Sokolov, M.; Morbidelli, M.; Butté, A. Hybrid modeling for biopharmaceutical processes: Advantages, opportunities, and implementation. Front. Chem. Eng. 2023, 5, 1157889. [Google Scholar] [CrossRef]
- Swami, A.; Hatolkar, S.; Patil, M.A.; Dhumal, M.K.; Shastri, A. Process Analytical Technology (PAT): Enhancing Quality and Efficiency in Pharmaceutical Development and Production. Korean J. Physiol. Pharmacol. 2023, 27, 394–408. [Google Scholar]
- Aghaee, M.; Krau, S.; Tamer, M.; Budman, H. Unsupervised Fault Detection of Pharmaceutical Processes Using Long Short-Term Memory Autoencoders. Ind. Eng. Chem. Res. 2023, 62, 9773–9786. [Google Scholar] [CrossRef]
- Agarwal, P.; Aghaee, M.; Tamer, M.; Budman, H. A novel unsupervised approach for batch process monitoring using deep learning. Comput. Chem. Eng. 2022, 159, 107694. [Google Scholar] [CrossRef]
- Aghaee, M.; Mishra, A.; Krau, S.; Tamer, I.M.; Budman, H. Artificial intelligence applications for fault detection and diagnosis in pharmaceutical bioprocesses: A review. Curr. Opin. Chem. Eng. 2024, 44, 101025. [Google Scholar] [CrossRef]
- Claßen, J.; Aupert, F.; Reardon, K.F.; Solle, D.; Scheper, T. Spectroscopic sensors for in-line bioprocess monitoring in research and pharmaceutical industrial application. Anal. Bioanal. Chem. 2017, 409, 651–666. [Google Scholar] [CrossRef]
- Scarff, M.; Arnold, S.A.; Harvey, L.M.; McNeil, B. Near infrared spectroscopy for bioprocess monitoring and control: Current status and future trends. Crit. Rev. Biotechnol. 2006, 26, 17–39. [Google Scholar] [CrossRef]
- Faassen, S.M.; Hitzmann, B. Fluorescence spectroscopy and chemometric modeling for bioprocess monitoring. Sensors 2015, 15, 10271–10291. [Google Scholar] [CrossRef]
- Beutel, S.; Henkel, S. In situ sensor techniques in modern bioprocess monitoring. Appl. Microbiol. Biotechnol. 2011, 91, 1493–1505. [Google Scholar] [CrossRef]
- Zhao, L.; Fu, H.Y.; Zhou, W.; Hu, W.S. Advances in process monitoring tools for cell culture bioprocesses. Eng. Life Sci. 2015, 15, 459–468. [Google Scholar]
- Shek, C.F.; Betenbaugh, M. Taking the pulse of bioprocesses: At-line and in-line monitoring of mammalian cell cultures. Curr. Opin. Biotechnol. 2021, 71, 191–197. [Google Scholar]
- Kessler, R.W.; Kessler, W.; Zikulnig-Rusch, E. A critical summary of spectroscopic techniques and their robustness in industrial PAT applications. Chem. Ing. Tech. 2016, 88, 710–721. [Google Scholar] [CrossRef]
- Chalmers, J.M.; Edwards, H.G.; Hargreaves, M.D. Vibrational spectroscopy techniques: Basics and instrumentation. In Infrared and Raman Spectroscopy in Forensic Science; Wiley Online Library: Hoboken, NJ, USA, 2012; pp. 9–44. [Google Scholar]
- Penner, M.H. Basic principles of spectroscopy. In Food Analysis; Springer: Berlin/Heidelberg, Germany, 2017; pp. 79–88. [Google Scholar]
- Cialla-May, D.; Schmitt, M.; Popp, J. Theoretical principles of Raman spectroscopy. Phys. Sci. Rev. 2019, 4, 20170040. [Google Scholar]
- Wang, L.; Liu, W.; Tang, J.W.; Wang, J.J.; Liu, Q.H.; Wen, P.B.; Wang, M.M.; Pan, Y.C.; Gu, B.; Zhang, X. Applications of Raman spectroscopy in bacterial infections: Principles, advantages, and shortcomings. Front. Microbiol. 2021, 12, 683580. [Google Scholar] [CrossRef]
- Lakowicz, J.R.; Lakowicz, J.R. Introduction to fluorescence. In Principles of Fluorescence Spectroscopy; Springer: Berlin/Heidelberg, Germany, 1999; pp. 1–23. [Google Scholar]
- Macheroux, P. UV-visible spectroscopy as a tool to study flavoproteins. In Flavoprotein Protocols; Springer: Berlin/Heidelberg, Germany, 1999; pp. 1–7. [Google Scholar]
- Shrake, N.L.; Amirtharajah, R.; Brenneman, C.; Boulton, R.; Knoesen, A. In-line measurement of color and total phenolics during red wine fermentations using a light-emitting diode sensor. Am. J. Enol. Vitic. 2014, 65, 463–470. [Google Scholar] [CrossRef]
- Drieschner, T.; Ostertag, E.; Boldrini, B.; Lorenz, A.; Brecht, M.; Rebner, K. Direct optical detection of cell density and viability of mammalian cells by means of UV/VIS spectroscopy. Anal. Bioanal. Chem. 2020, 412, 3359–3371. [Google Scholar]
- Kandelbauer, A.; Kessler, W.; Kessler, R. Online UV–visible spectroscopy and multivariate curve resolution as powerful tool for model-free investigation of laccase-catalysed oxidation. Anal. Bioanal. Chem. 2008, 390, 1303–1315. [Google Scholar] [CrossRef]
- Schiewe, T.; Gutschmann, B.; Santolin, L.; Waldburger, S.; Neubauer, P.; Hass, R.; Riedel, S.L. Real-time monitoring of biomass during Escherichia coli high-cell-density cultivations by in-line photon density wave spectroscopy. Biotechnol. Bioeng. 2023, 120, 2880–2889. [Google Scholar]
- Fazenda, M.L.; Dias, J.M.; Harvey, L.M.; Nordon, A.; Edrada-Ebel, R.; LittleJohn, D.; McNeil, B. Towards better understanding of an industrial cell factory: Investigating the feasibility of real-time metabolic flux analysis in Pichia pastoris. Microb. Cell Factories 2013, 12, 51. [Google Scholar]
- Kozma, B.; Salgó, A.; Gergely, S. On-line glucose monitoring by near infrared spectroscopy during the scale up steps of mammalian cell cultivation process development. Bioprocess Biosyst. Eng. 2019, 42, 921–932. [Google Scholar] [CrossRef] [PubMed]
- Kornmann, H.; Valentinotti, S.; Marison, I.; Stockar, U.v. Real-time update of calibration model for better monitoring of batch processes using spectroscopy. Biotechnol. Bioeng. 2004, 87, 593–601. [Google Scholar] [CrossRef]
- Schenk, J.; Marison, I.W.; von Stockar, U. A simple method to monitor and control methanol feeding of Pichia pastoris fermentations using mid-IR spectroscopy. J. Biotechnol. 2007, 128, 344–353. [Google Scholar] [CrossRef] [PubMed]
- Milewska, A.; Baekelandt, G.; Boutaieb, S.; Mozin, V.; Falconbridge, A. In-line monitoring of protein concentration with MIR spectroscopy during UFDF. Eng. Life Sci. 2023, 23, e2200050. [Google Scholar] [CrossRef]
- Clavaud, M.; Roggo, Y.; Von Daeniken, R.; Liebler, A.; Schwabe, J.O. Chemometrics and in-line near infrared spectroscopic monitoring of a biopharmaceutical Chinese hamster ovary cell culture: Prediction of multiple cultivation variables. Talanta 2013, 111, 28–38. [Google Scholar] [CrossRef]
- Cimander, C.; Mandenius, C.F. Online monitoring of a bioprocess based on a multi-analyser system and multivariate statistical process modelling. J. Chem. Technol. Biotechnol. Int. Res. Process. Environ. Clean Technol. 2002, 77, 1157–1168. [Google Scholar]
- Kornmann, H.; Valentinotti, S.; Duboc, P.; Marison, I.; Von Stockar, U. Monitoring and control of Gluconacetobacter xylinus fed-batch cultures using in situ mid-IR spectroscopy. J. Biotechnol. 2004, 113, 231–245. [Google Scholar] [CrossRef]
- Mazarevica, G.; Diewok, J.; Baena, J.R.; Rosenberg, E.; Lendl, B. On-line fermentation monitoring by mid-infrared spectroscopy. Appl. Spectrosc. 2004, 58, 804–810. [Google Scholar] [CrossRef]
- Alimagham, F.; Winterburn, J.; Dolman, B.; Domingues, P.M.; Everest, F.; Platkov, M.; Basov, S.; Izakson, G.; Katzir, A.; Elliott, S.R.; et al. Real-time bioprocess monitoring using a mid-infrared fibre-optic sensor. Biochem. Eng. J. 2021, 167, 107889. [Google Scholar]
- Kara, S.; Mueller, J.J.; Liese, A. Online analysis methods for monitoring of bioprocesses. Chem. Today 2011, 29. [Google Scholar]
- Biechele, P.; Busse, C.; Solle, D.; Scheper, T.; Reardon, K. Sensor systems for bioprocess monitoring. Eng. Life Sci. 2015, 15, 469–488. [Google Scholar]
- Rolinger, L.; Rüdt, M.; Hubbuch, J. A multisensor approach for improved protein A load phase monitoring by conductivity-based background subtraction of UV spectra. Biotechnol. Bioeng. 2021, 118, 905–917. [Google Scholar]
- Takahashi, M.B.; Leme, J.; Caricati, C.; Tonso, A.; Núñez, E.G.F.; Rocha, J.C. Artificial neural network associated to UV/Vis spectroscopy for monitoring bioreactions in biopharmaceutical processes. Bioprocess Biosyst. Eng. 2015, 38, 1045–1054. [Google Scholar] [PubMed]
- Leme, J.; Núñez, E.G.F.; de Almeida Parizotto, L.; Chagas, W.A.; dos Santos, E.S.; Caricati, A.T.P.; Rezende, A.G.; Costa, B.L.V.; Monteiro, D.C.V.; Boldorini, V.L.; et al. A multivariate calibration procedure for UV/VIS spectrometric monitoring of BHK-21 cell metabolism and growth. Biotechnol. Prog. 2014, 30, 241–248. [Google Scholar]
- Dupuy, N.; Galtier, O.; Ollivier, D.; Vanloot, P.; Artaud, J. Comparison between NIR, MIR, concatenated NIR and MIR analysis and hierarchical PLS model. Application to virgin olive oil analysis. Anal. Chim. Acta 2010, 666, 23–31. [Google Scholar] [PubMed]
- Zimmerleiter, R.; Kager, J.; Nikzad-Langerodi, R.; Berezhinskiy, V.; Westad, F.; Herwig, C.; Brandstetter, M. Probeless non-invasive near-infrared spectroscopic bioprocess monitoring using microspectrometer technology. Anal. Bioanal. Chem. 2020, 412, 2103–2109. [Google Scholar]
- Beć, K.B.; Grabska, J.; Huck, C.W. Principles and applications of miniaturized near-infrared (NIR) spectrometers. Chem.—Eur. J. 2021, 27, 1514–1532. [Google Scholar] [PubMed]
- Manley, M. Near-infrared spectroscopy and hyperspectral imaging: Non-destructive analysis of biological materials. Chem. Soc. Rev. 2014, 43, 8200–8214. [Google Scholar]
- Sales, K.; Rosa, F.; Sampaio, P.; Fonseca, L.; Lopes, M.; Calado, C. In Situ Near-Infrared (NIR) versus High-Throughput Mid-Infrared (MIR) Spectroscopy to Monitor Biopharmaceutical Production. Appl. Spectrosc. 2015, 69, 760–772. [Google Scholar]
- Riolo, D.; Piazza, A.; Cottini, C.; Serafini, M.; Lutero, E.; Cuoghi, E.; Gasparini, L.; Botturi, D.; Marino, I.G.; Aliatis, I.; et al. Raman spectroscopy as a PAT for pharmaceutical blending: Advantages and disadvantages. J. Pharm. Biomed. Anal. 2018, 149, 329–334. [Google Scholar]
- Esmonde-White, K.A.; Cuellar, M.; Lewis, I.R. The role of Raman spectroscopy in biopharmaceuticals from development to manufacturing. Anal. Bioanal. Chem. 2022, 414, 969–991. [Google Scholar] [PubMed]
- Golabgir, A.; Herwig, C. Combining mechanistic modeling and Raman spectroscopy for real-time monitoring of fed-batch Penicillin production. Chem. Ing. Tech. 2016, 88, 764–776. [Google Scholar]
- Tsopanoglou, A.; del Val, I.J. Moving towards an era of hybrid modelling: Advantages and challenges of coupling mechanistic and data-driven models for upstream pharmaceutical bioprocesses. Curr. Opin. Chem. Eng. 2021, 32, 100691. [Google Scholar]
- Feidl, F.; Garbellini, S.; Vogg, S.; Sokolov, M.; Souquet, J.; Broly, H.; Butté, A.; Morbidelli, M. A new flow cell and chemometric protocol for implementing in-line Raman spectroscopy in chromatography. Biotechnol. Prog. 2019, 35, e2847. [Google Scholar]
- Wang, J.; Chen, J.; Studts, J.; Wang, G. In-line product quality monitoring during biopharmaceutical manufacturing using computational Raman spectroscopy. mAbs 2023, 15, 2220149. [Google Scholar]
- Hirsch, E.; Pataki, H.; Domján, J.; Farkas, A.; Vass, P.; Fehér, C.; Barta, Z.; Nagy, Z.K.; Marosi, G.J.; Csontos, I. Inline noninvasive Raman monitoring and feedback control of glucose concentration during ethanol fermentation. Biotechnol. Prog. 2019, 35, e2848. [Google Scholar]
- Cannizzaro, C.; Rhiel, M.; Marison, I.; von Stockar, U. On-line monitoring of Phaffia rhodozyma fed-batch process with in situ dispersive Raman spectroscopy. Biotechnol. Bioeng. 2003, 83, 668–680. [Google Scholar]
- Nadadoor, V.R.; De la Hoz Siegler, H.; Shah, S.L.; McCaffrey, W.C.; Ben-Zvi, A. Online sensor for monitoring a microalgal bioreactor system using support vector regression. Chemom. Intell. Lab. Syst. 2012, 110, 38–48. [Google Scholar]
- Esmonde-White, K.A.; Cuellar, M.; Uerpmann, C.; Lenain, B.; Lewis, I.R. Raman spectroscopy as a process analytical technology for pharmaceutical manufacturing and bioprocessing. Anal. Bioanal. Chem. 2017, 409, 637–649. [Google Scholar]
- Lee, H.; Boccazzi, P.; Gorret, N.; Ram, R.J.; Sinskey, A. In situ bioprocess monitoring of Escherichia coli bioreactions using Raman spectroscopy. Vib. Spectrosc. 2004, 35, 131–137. [Google Scholar]
- Wei, D.; Chen, S.; Liu, Q. Review of fluorescence suppression techniques in Raman spectroscopy. Appl. Spectrosc. Rev. 2015, 50, 387–406. [Google Scholar]
- Mandenius, C.F.; Titchener-Hooker, N.J. Measurement, Monitoring, Modelling and Control of Bioprocesses; Springer: Berlin/Heidelberg, Germany, 2013; Volume 132. [Google Scholar]
- Peiris, R.; Budman, H.; Moresoli, C.; Legge, R. Identification of humic acid-like and fulvic acid-like natural organic matter in river water using fluorescence spectroscopy. Water Sci. Technol. 2011, 63, 2427–2433. [Google Scholar] [PubMed]
- Horvath, J.J.; Glazier, S.A.; Spangler, C.J. In situ fluorescence cell mass measurements of Saccharomyces cerevisiae using cellular tryptophan. Biotechnol. Prog. 1993, 9, 666–670. [Google Scholar]
- Hisiger, S.; Jolicoeur, M. A multiwavelength fluorescence probe: Is one probe capable for on-line monitoring of recombinant protein production and biomass activity? J. Biotechnol. 2005, 117, 325–336. [Google Scholar] [PubMed]
- Surribas, A.; Geissler, D.; Gierse, A.; Scheper, T.; Hitzmann, B.; Montesinos, J.L.; Valero, F. State variables monitoring by in situ multi-wavelength fluorescence spectroscopy in heterologous protein production by Pichia pastoris. J. Biotechnol. 2006, 124, 412–419. [Google Scholar] [PubMed]
- Teixeira, A.P.; Portugal, C.A.; Carinhas, N.; Dias, J.M.; Crespo, J.P.; Alves, P.M.; Carrondo, M.; Oliveira, R. In situ 2D fluorometry and chemometric monitoring of mammalian cell cultures. Biotechnol. Bioeng. 2009, 102, 1098–1106. [Google Scholar]
- Teixeira, A.P.; Duarte, T.M.; Carrondo, M.; Alves, P.M. Synchronous fluorescence spectroscopy as a novel tool to enable PAT applications in bioprocesses. Biotechnol. Bioeng. 2011, 108, 1852–1861. [Google Scholar]
- Graf, A.; Claßen, J.; Solle, D.; Hitzmann, B.; Rebner, K.; Hoehse, M. A novel LED-based 2D-fluorescence spectroscopy system for in-line monitoring of Chinese hamster ovary cell cultivations–Part I. Eng. Life Sci. 2019, 19, 352–362. [Google Scholar]
- Claßen, J.; Graf, A.; Aupert, F.; Solle, D.; Höhse, M.; Scheper, T. A novel LED-based 2D-fluorescence spectroscopy system for in-line bioprocess monitoring of Chinese hamster ovary cell cultivations—Part II. Eng. Life Sci. 2019, 19, 341–351. [Google Scholar]
- Ödman, P.; Johansen, C.L.; Olsson, L.; Gernaey, K.V.; Lantz, A.E. Sensor combination and chemometric variable selection for online monitoring of Streptomyces coelicolor fed-batch cultivations. Appl. Microbiol. Biotechnol. 2010, 86, 1745–1759. [Google Scholar]
- König, J.C.; Steinwedel, T.; Solle, D.; Lindner, P.; de Vries, I.; Hentrop, T.; Findeis, M.; John, G.T.; Scheper, T.; Beutel, S. Development and characterisation of a new fluorescence sensor for online monitoring of bioprocesses. J. Sensors Sens. Syst. 2018, 7, 461–467. [Google Scholar]
- Karakach, T.K.; Dachon, A.; Choi, J.; Miguez, C.; Masson, L.; Tartakovsky, B. Fluorescence-based real time monitoring and diagnostics of recombinant Pichia pastoris cultivations in a bioreactor. Biotechnol. Prog. 2019, 35, e2761. [Google Scholar]
- Mishra, A.; Tamer, M.; Budman, H. In-line monitoring of Bordetella pertussis cultivation using fluorescence spectroscopy. Bioprocess Biosyst. Eng. 2023, 46, 789–802. [Google Scholar]
- Karakach, T.K.; McGinn, P.J.; Choi, J.; MacQuarrie, S.P.; Tartakovsky, B. Real-time monitoring, diagnosis, and time-course analysis of microalgae Scenedesmus AMDD cultivation using dual excitation wavelength fluorometry. J. Appl. Phycol. 2015, 27, 1823–1832. [Google Scholar]
- Xu, X.; Farnós, O.; Paes, B.C.; Nesdoly, S.; Kamen, A.A. Multivariate data analysis on multisensor measurement for inline process monitoring of adenovirus production in HEK293 cells. Biotechnol. Bioeng. 2024, 121, 2175–2192. [Google Scholar]
- Rowland-Jones, R.C.; van den Berg, F.V.D.; Racher, A.; Martin, E.B.; Jaques, C. Comparison of spectroscopy technologies for improved monitoring of cell culture processes in miniature bioreactors. Biotechnol. Prog. 2017, 33, 337–346. [Google Scholar]
- Galinha, C.F.; Carvalho, G.; Portugal, C.; Guglielmi, G.; Guglielmi, G.; Oliveira, R.; Crespo, J.; Reis, M. Real-time monitoring of membrane bioreactors with 2D-fluorescence data and statistically based models. Water Sci. Technol. J. Int. Assoc. Water Pollut. Res. 2011, 63, 1381–1388. [Google Scholar]
- Zacharioudaki, D.E.; Fitilis, I.; Kotti, M. Review of fluorescence spectroscopy in environmental quality applications. Molecules 2022, 27, 4801. [Google Scholar] [CrossRef]
- Pauli, J.; Guttler, A.; Schneider, T.; Wurth, C.; Resch-Genger, U. Fluorescence Quantum Yield Standards for the UV/Visible/NIR: Development, Traceable Characterization, and Certification. Anal. Chem. 2023, 95, 5671–5677. [Google Scholar]
- Agharafeie, R.; Oliveira, R.; Ramos, J.R.C.; Mendes, J.M. Application of hybrid neural models to bioprocesses: A systematic literature review. Authorea Prepr. 2023, 9, 922. [Google Scholar]
- Xu, F.; Su, L.; Gao, H.; Wang, Y.; Ben, R.; Hu, K.; Mohsin, A.; Li, C.; Chu, J.; Tian, X. Harnessing near-infrared and Raman spectral sensing and artificial intelligence for real-time monitoring and precision control of bioprocess. Bioresour. Technol. 2025, 421, 132204. [Google Scholar]
- Mondal, P.P.; Galodha, A.; Verma, V.K.; Singh, V.; Show, P.L.; Awasthi, M.K.; Lall, B.; Anees, S.; Pollmann, K.; Jain, R. Review on machine learning-based bioprocess optimization, monitoring, and control systems. Bioresour. Technol. 2023, 370, 128523. [Google Scholar]
- Du, Y.H.; Wang, M.Y.; Yang, L.H.; Tong, L.L.; Guo, D.S.; Ji, X.J. Optimization and scale-up of fermentation processes driven by models. Bioengineering 2022, 9, 473. [Google Scholar] [CrossRef] [PubMed]
- Dayananda, B.; Cozzolino, D. Beyond the Black Box—Practical considerations on the use of chemometrics combined with sensing technologies in food science applications. Chemosensors 2022, 10, 323. [Google Scholar] [CrossRef]
- Narayana, S.; Christensen, L.; Skov, T.; van den Berg, F. Mid-infrared spectroscopy and multivariate analysis to characterize Lactobacillus acidophilus fermentation processes. Appl. Spectrosc. 2019, 73, 1087–1098. [Google Scholar]
- Mishra, A.; Vitelli, M.; Tartakovsky, B.; Tamer, I.M.; Budman, H. A model based approach for monitoring Bordetella pertussis fermentation with an inline spectro-fluorescence probe. Biochem. Eng. J. 2025, 217, 109674. [Google Scholar]
- Kandelbauer, A.; Rahe, M.; Kessler, R.W. Industrial perspectives. Handb. Biophotonics 2012, 3, 3–69. [Google Scholar]
- Mishra, A. Design of Online Estimator for Culture Monitoring and Media Development for Bordetella Pertussis. Ph.D. Thesis, University of Waterloo, Waterloo, ON, Canada, 2024. [Google Scholar]
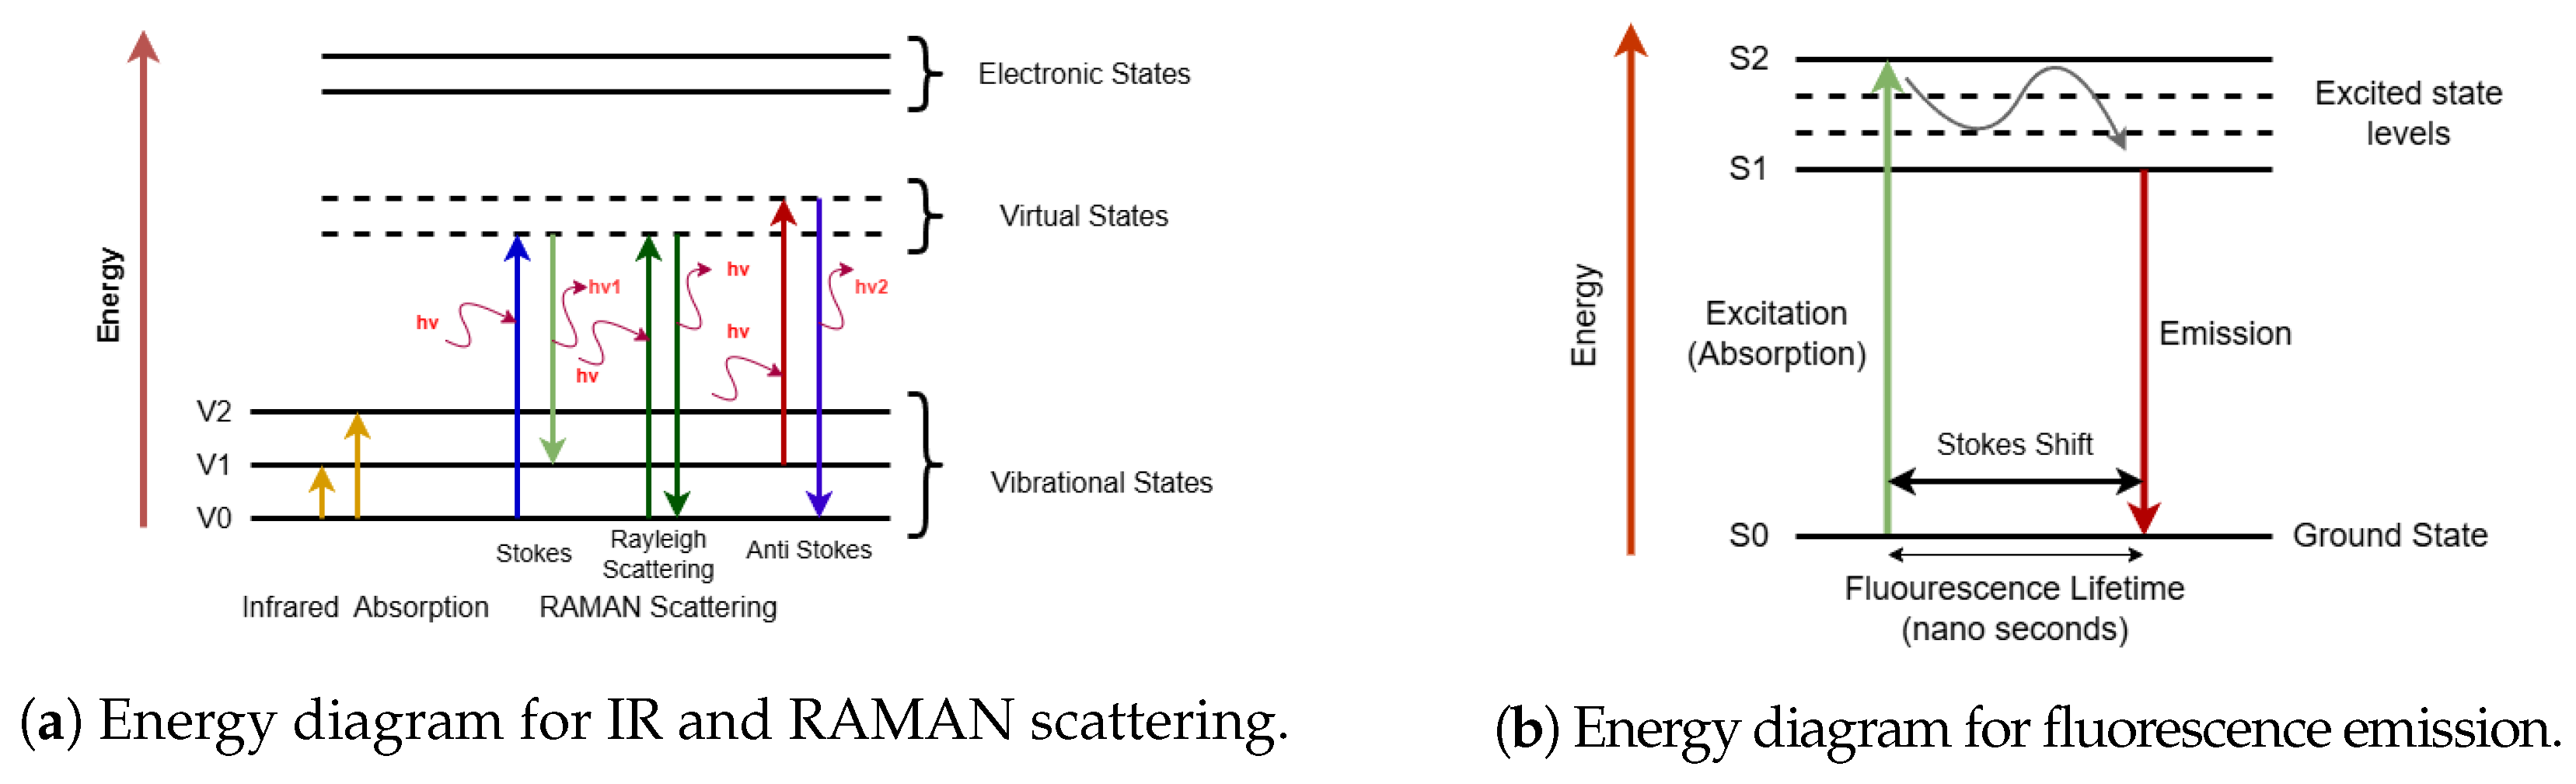

Disclaimer/Publisher’s Note: The statements, opinions and data contained in all publications are solely those of the individual author(s) and contributor(s) and not of MDPI and/or the editor(s). MDPI and/or the editor(s) disclaim responsibility for any injury to people or property resulting from any ideas, methods, instructions or products referred to in the content. |
© 2025 by the authors. Licensee MDPI, Basel, Switzerland. This article is an open access article distributed under the terms and conditions of the Creative Commons Attribution (CC BY) license (https://creativecommons.org/licenses/by/4.0/).