Abstract
This study aims to investigate the seasonal variation and source identification of fluorescent aerosol particles at the monitoring site of the University of Salento in Lecce, southeastern Italy. Utilizing a wideband integrated bioaerosol sensor (WIBS), this research work analyzes data from two specific monitoring days: one in winter (10 January 2024), marked by significant transport of anthropogenic particles from Eastern Europe, and another in early spring (6 March 2024), characterized by marine aerosol sources and occasional desert dust. This study focuses on the seven WIBS particle categories (A, B, C, AB, AC, BC, ABC), which exhibited distinct characteristics between the two days, indicating different aerosol compositions. Winter measurements revealed a predominance of fine-mode particles, particularly soot and bacteria. In contrast, spring measurements showed larger particles, including fungal spores, pollen fragments, and mineral dust. Fluorescence intensity data further emphasized an increase in biological and organic airborne material in early spring. These results highlight the dynamic nature of fluorescent aerosol sources in the Mediterranean region and the necessity of continuous monitoring for air quality assessments. By integrating WIBS measurements with air mass back-trajectories, this study effectively identifies fluorescent aerosol sources and their seasonal impacts, offering valuable insights into the environmental and health implications of aerosol variability in the investigated Mediterranean area.
1. Introduction
Bioaerosols, which are also referred to as primary biological aerosol particles (PBAPs), represent a unique subset of atmospheric aerosol particles spanning a broad size range in both fine and coarse modes, from as small as a few nanometers to hundreds of micrometers [1]. PBAPs are generally regarded as aerosols emitted into the atmosphere from the biosphere, comprising both living and dead microorganisms, i.e., viruses (0.01–0.3 μm), bacteria and bacterial agglomerates (0.1–10 μm), fungal spores (0.5–30 μm), pollen (10–100 μm), as well as debris of biological material [2,3,4,5]. Due to their attachment to dust particles, biological particles may be carried over long distances on a continental [6] or even global scale [7], affecting ecosystem functions through dry and wet deposition [8,9]. Despite their biologic origin, bioaerosols have the ability to act as common atmospheric aerosols, impacting Earth’s climate either through direct contact with solar/terrestrial radiation or serving as cloud condensation nuclei (CCN) in cloud formation processes [2,10,11]. Compared to non-biological particles, exposure to bioaerosols also poses a higher health risk, potentially leading to different diseases, allergies, and even cancer [12,13,14]. Not only can PBAPs carry toxic substances, including carcinogens, but some of these particles are pathogenic themselves, such as viruses and bacteria, which can remain suspended in the air for weeks, provoking infectious diseases via direct and indirect pathways. Moreover, fungal spores and pollen grains are particularly known as causative agents of allergies, mainly in the respiratory tract, such as asthma and bronchitis [15,16].
Unlike inorganic aerosols, bioaerosols have not been properly investigated by far. Their number concentrations, size distributions, morphology, types, and sources need to be further defined, since they are critical for both environmental and public health sciences. The detection, classification, and quantification of PBAPs remain significant multidisciplinary challenges. In the past, culture-based methods were used for the quantification and identification of PBAPs, with the limitation of detecting only culturable microorganisms, which represent less than 1% of biological particles [17]. Non-viable bioaerosols, although not infectious, can still cause allergic and toxic reactions, and thus methods to fully characterize PBAPs in various environments are necessary [18]. Advanced molecular techniques, such as DNA- or RNA-based sequencing, can be employed to obtain more detailed biological information, but they require significant time and resources [14]. Both traditional detection techniques (involving cultivation and optical microscopy) and molecular methods represent off-line analyses, based on lengthy processes of incubating, staining, and sequencing after sample collection.
Over the years, measurements of PBAPs have advanced with developments in technology, enabling the production of real-time, online measurement techniques as an alternative to traditional offline techniques for identification and analysis. Innovative real-time methodologies may contribute to expanding the knowledge on the types and concentration levels of several bio-contaminants [19,20,21,22]. During the last two decades, specifically, real-time ultraviolet light-induced fluorescence (UV-LIF) monitors, such as the ultraviolet aerodynamic particle sizer (UV-APS) and the waveband integrated bioaerosol sensor (WIBS), have permitted superior time-resolution information for a long consecutive time period with few consumables for operation [23]. As a matter of fact, UV-LIF spectrometers enable instantaneous data collection by utilizing the principle that biological particles auto-fluoresce when excited with UV radiation due to the presence of bio-fluorophores, e.g., the amino acid tryptophan and the co-enzyme nicotinamide adenine dinucleotide phosphate (NADH). The detection channels in these instruments are optimized to measure fluorescence at the maximum emission spectrum of each bio-fluorophore [24]: tryptophan is excited at ~280 nm and emits fluorescence between 300 and 400 nm; NADH is excited within the 270–400 nm range and emits between 400 and 600 nm [25]; and different bio-fluorophores, such as riboflavin, are excited at ~450 nm and emit between 520 and 565 nm [5,26,27]. UV-LIF samplers allow for automatic data collection, significantly reducing the workload for operators. Furthermore, with their online connections to computers, such devices may also provide an early warning system for excessive levels of hazardous bioaerosols in outdoor environments [28,29,30] and in selected indoor environments such as hospitals, schools, and various workplaces [22,31,32]. While UV-LIF spectrometers present numerous advantages over traditional methods, the challenge of differentiating between various bioaerosol classes and even potential non-biological fluorescent interferents remains an active area of research [33]. Currently, UV-LIF spectrometers do not have a standardized absolute reference, complicating the comparison of measurements performed with different instruments. The absence of a calibration standard has also hindered the characterization of PBAPs, which would facilitate classification through supervised learning techniques. Consequently, alternative methods must be employed to segregate particle types when interpreting uncalibrated datasets [34].
Among the various UV-LIF spectrometers, the wideband integrated bioaerosol spectrometer (WIBS) represents the most widely used device. It has been developed to operate as a cost-effective and reliable detector for bioaerosol particles. The WIBS optically reveals particles ranging from 0.5 to 30 μm, covering a broad subset of particle types such as bacteria, fungal spores, and smaller-sized pollen or pollen fragments, but excluding smaller particles such as viruses [5,22]. This paper aims to present the results of an investigation of bioaerosol particles from an outdoor environment in a monitoring area in southeastern Italy, utilizing the WIBS-NEO (the latest version of the Wideband Integrated Bioaerosol Spectrometer). The primary objective of this preliminary study is to analyze and compare the contributions of primary biological aerosol particles (PBAPs) from different sources during specific periods, specifically from Eastern Europe on 10 January 2024 and from the Atlantic Ocean/Mediterranean Sea on 6 March 2024, using UV-LIF technology. In the selected monitoring area, previous studies have been conducted to define the structural characteristics of outdoor airborne communities of both prokaryotic [35] and eukaryotic microorganisms [36,37], and their relationships with chemical components of PM10 and meteorological parameters. However, these studies relied solely on off-line methods, such as the gravimetric collection of PM samples followed by metagenomic analysis of bioaerosol particles [38,39]. Therefore, this work represents the first attempt to use real-time UV-LIF technology to assess the contributions of different PBAP sources in the selected region.
2. Materials and Methods
2.1. Site Description
The measurements investigated in this study were conducted on the roof (~10 m above ground level) of the Mathematics and Physics Department, University of Salento, in Lecce (40.33° N; 18.11° E, 30 m a.s.l.), a small city in southeastern Italy. In detail, the selected monitoring site belongs both to the pan-European research infrastructure ACTRIS (https://www.actris.eu, accessed on 18 July 2024) and the corresponding Italian research infrastructure ACTRIS-IT (http://www.actris.it/, accessed on 18 July 2024). It is located on a flat area of the narrow Salento peninsula, ~6 km away from the city center of Lecce (~95,000 inhabitants), ~20 km away from both the Ionian and Adriatic Seas, and ~100 and 800 km away from the Balkan and the northern African coastline, respectively. A coal power plant and a large industrial area are ~35 and 100 km away, respectively, from the analyzed experimental site. As several studies have shown [38,40,41,42,43,44,45], because of its central location in the Mediterranean basin, the study site is affected by long-range transported aerosols, more specifically by desert dust from northern Africa, polluted particles from urban and industrial areas of Northern and Eastern Europe, marine aerosols from the Mediterranean Sea and the Atlantic Ocean, and biomass-burning particles from forest fires occurring mainly in summertime across Central Mediterranean sites [36]. Therefore, it may be considered as representative of coastal sites of the Central Mediterranean away from large sources of local pollution and categorized as rural background according to Larssen et al. [46].
Based on these premises, in the current study, the analysis of 4-day back-trajectories from the HYSPLIT (HYbrid Single-Particle Lagrangian Integrated Trajectory) software version 5.1 (http://ready.arl.noaa.gov/HYSPLIT.php, accessed on 27 June 2024) developed by the NOAA-ARL (National Oceanic and Atmospheric Administration—Air Resources Laboratory) was used to determine the main airflows advected at the monitoring area on 10 January and 6 March 2024.
2.2. Sampling Method and Particle Classification
The sampling of outdoor PBAPs was performed using a wideband integrated bioaerosol sensor (WIBS-NEO, Droplet Measurement Technologies LLC, Longmont, CO, USA). The WIBS-NEO is an evolution of the WIBS-4 which employs new operating software and features a marginally larger sample size range (0.5 to ~30 µm), whereas it is based on the same measurement method as the original WIBS models [5]. As a single particle fluorescence spectrometer, WIBS-NEO measures the optical equivalent diameter (Do), fluorescence characteristics, and asymmetry factor (AF) of particles in real-time [30,47]. The WIBS-NEO actively aspirates air through a pump, with a flow of 0.3 L/min. Then, the air is carried in an optical chamber, where the particle stream is first directed towards a continuous 635 nm laser diode by means of a laminar flow system [48], and thus the elastic scattering intensity is measured for each particle at a 90° offset as it passes the laser diode [49]. This scattered intensity is used to determine Do via Mie scattering theory [50]. Subsequently, a quadrant photomultiplier tube probes the forward scattering intensity at four angular offsets to calculate the AF [49]. The AF is an approximate representation of particle shape, with AF from 0 to 15 indicating spherical or nearly spherical particles; AF from 15 to 30 indicating aspherical particles; and AF from 30 to 100 indicating rod or fiber-shaped particles [29]. After the particle passes the laser diode, it is subjected to UV irradiation via two pulsed xenon ultraviolet (UV) lamps peaking at 280 nm and 370 nm [49,50,51]. The resulting particle fluorescence from each excitation is captured, filtered, and sent to two different fluorescence detectors: FL1 (detecting light from 310 to 400 nm) and FL2 (detecting light from 420 to 650 nm) [51]. The WIBS provides three fluorescence excitation and emission channels:
- Channel A (excitation: 280 nm, emissions: 310–400 nm);
- Channel B (excitation: 280 nm, emissions: 420–650 nm);
- Channel C (excitation: 370 nm, emissions: 420–650 nm).
Every sampled particle is detected by a laser channel, but not all PBAPs can be measured by the fluorescent channels. The xenon flashlamps have a maximum duty cycle of 125 Hz, which can excite and examine, at most, 125 particles/s. When the concentration is above 25 particles/cm3 and the sample airflow rate is equal to 5 cm3/s, the UV lamps are not able to detect all of the particles. Undetected particles have size information from the laser channel, but do not have any signal from fluorescent channels. The examined particles in fluorescent channels are classified as “Excited” particles, while the undetected ones are considered as “Unknown”. The WIBS reports the emissions in each channel in terms of numerical values of arbitrary units. Thus, threshold emission values must be computed for all three channels using the forced trigger method to distinguish between fluorescent and non-fluorescent particles [29,49,50]. In forced trigger mode, the xenon UV lamps operate with no sample flow to ascertain the background fluorescent emissions in each channel [29]. Particles are labeled as fluorescent in a channel if they exceed the mean background fluorescence intensity plus three times its standard deviation measured for that channel [29,47,52,53].
A single particle can fluoresce in more than one channel. Hence, fluorescent particles identified by the WIBS can be grouped into seven categories:
- (I)
- Type ‘A’ (exhibiting fluorescence only in Channel A);
- (II)
- Type ‘B’ (exhibiting fluorescence only in Channel B);
- (III)
- Type ‘C’ (exhibiting fluorescence only in Channel C);
- (IV)
- Type ‘AB’ (exhibiting fluorescence in both Channel A and Channel B);
- (V)
- Type ‘BC’ (exhibiting fluorescence in both Channel B and Channel C);
- (VI)
- Type ‘AC’ (exhibiting fluorescence in both Channel A and Channel C);
- (VII)
- Type ‘ABC’ (exhibiting fluorescence in all the three channels).
The WIBS output file contains size-resolved single particle data at >1 Hz time-resolution [14,30]. In this study, only particles with Do in the size range 0.5–10 μm were selected for analysis. All the data analyses and plots reported in this study were carried out using the software Igor PRO version 6.20 (WaveMetrics, Portland, OR, USA) by the WIBS-NEO toolkit program.
3. Results
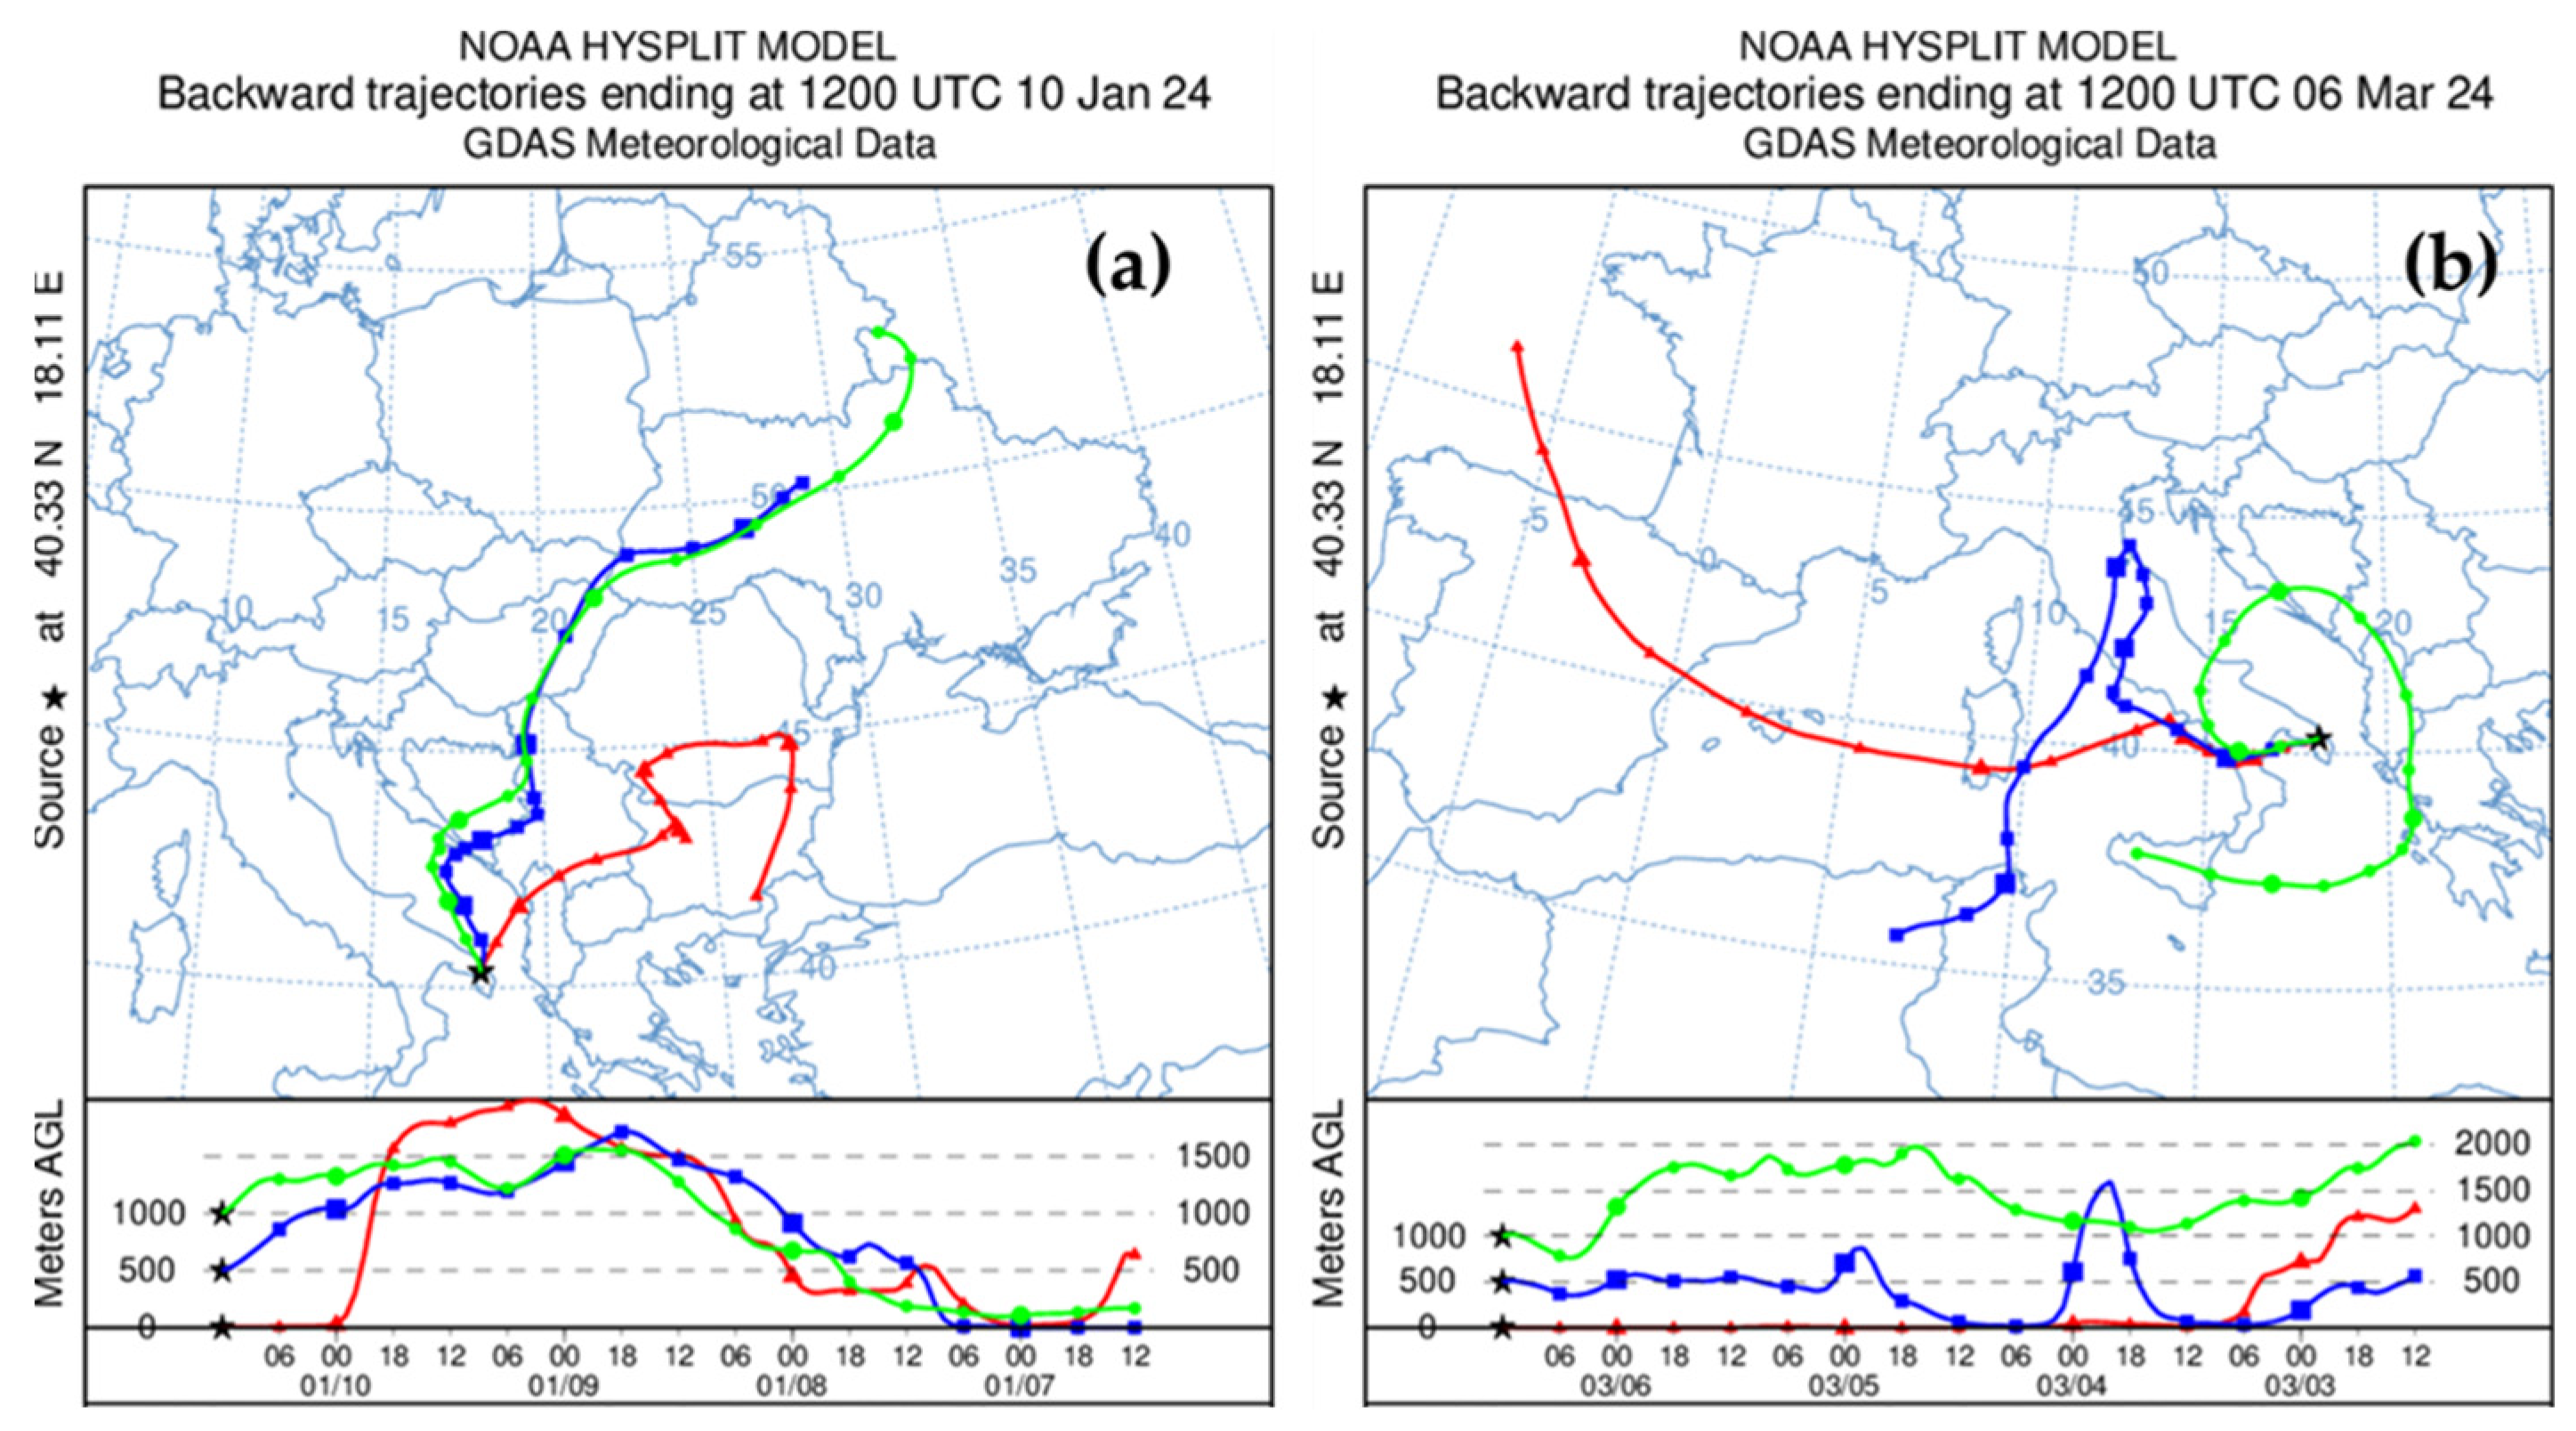
As reported in Figure 1, we based our analyses on two monitoring days characterized by different aerosol sources. In detail, the WIBS measurements were first performed on a winter day (10 January 2024) that was affected by significant particle transport from Eastern Europe at low altitudes (Figure 1a). As reported in previous works at the same study site (e.g., [42,54]), the air masses from Eastern Europe are generally responsible for the transport of a significant amount of anthropogenic airborne particles to southeastern Italy. Therefore, the clear presence of these back-trajectories at the study site should be associated with a large increase in fine-mode aerosol particles. On the contrary, the WIBS measurements performed on 6 March 2024 were associated with different aerosol sources, since the air mass back-trajectories reported in Figure 1b clearly showed a significant advection of marine aerosol at low altitudes at the study site. The location of the selected monitoring site at the center of the Mediterranean basin leads to several days highly affected by sea spray and marine-related aerosol particles, as shown by different previous publications (e.g., [54]). Therefore, the second day selected for the WIBS monitoring activities was mainly characterized by a greater presence of coarse-mode airborne particles due to the mean size distribution of marine aerosols.
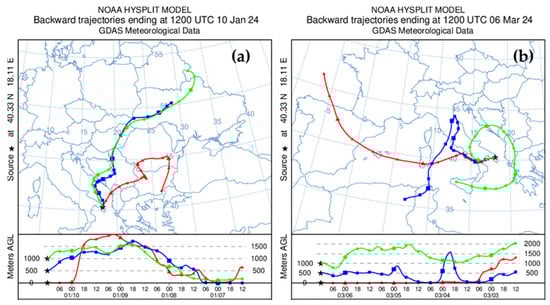
Figure 1.
Four-day analytical back-trajectories reaching the monitoring site of Lecce at ground level (red line), at 500 m (blue line), and at 1000 m above ground level (green line) at 12:00 UTC on (a) 10 January and (b) 6 March 2024. The altitude of each back-trajectory as a function of time is also reported in each plot.
In Section 2.2, we describe the different characteristics of the seven particle categories identified by the WIBS measurements. As previously reported, several studies have widely examined the relationships between these WIBS particle categories and different bioaerosol types, mainly bacteria, fungi and pollen or other non-biogenic airborne particles (e.g., [5,8,55]). However, in this study, we selected the classification based on the works by Yang et al. [52] and Tang et al. [56]. In more detail, in Table 1 we define the potential associations between the seven WIBS categories and the main biogenic and non-biogenic aerosol types.

Table 1.
Potential associations of the 7 WIBS particle categories with the main biogenic and non-biogenic aerosol particles (with the corresponding size range) based on the results reported by Yang et al. [52] and Tang et al. [56]. The acronym HULIS represents the humic-like substances.
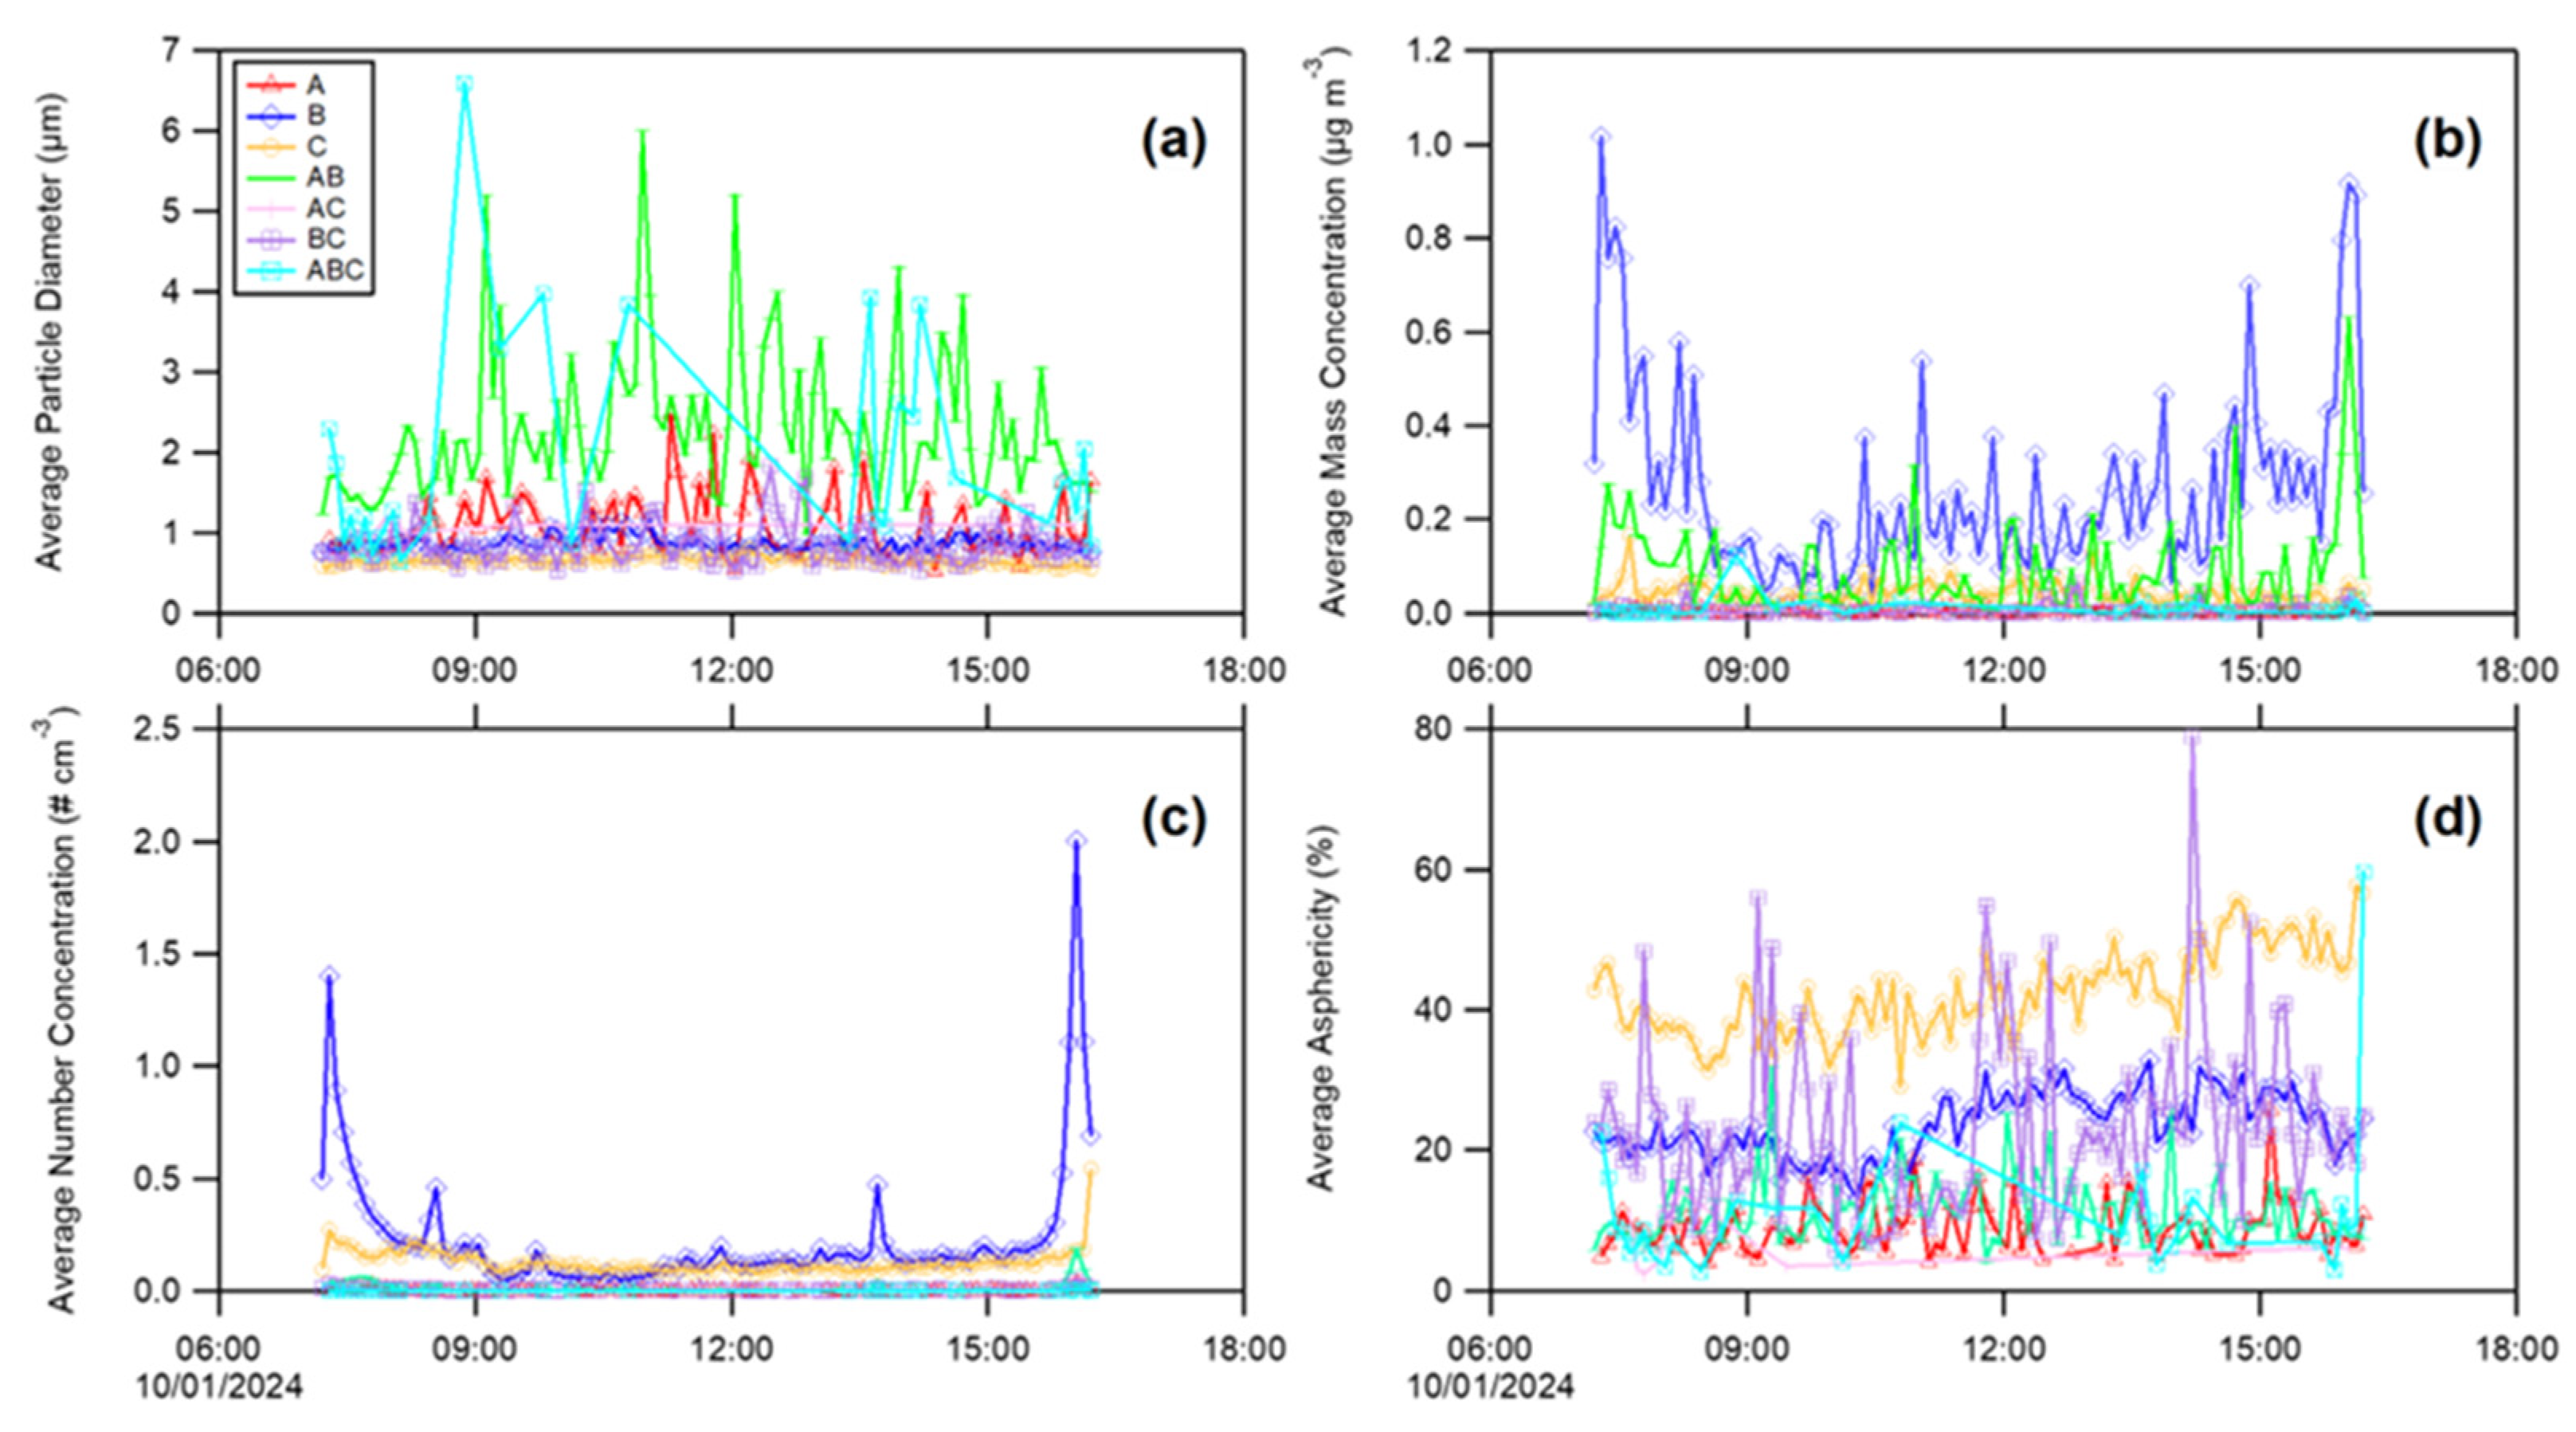
Figure 2 presents temporal evolution plots showing various aerosol properties measured by the WIBS (wideband integrated bioaerosol sensor) on 10 January 2024 at the monitoring site of the University of Salento in Lecce (southeastern Italy). This figure consists of four panels, each depicting different aerosol parameters for seven particle categories (A, B, C, AB, AC, BC, ABC) over a 12 h period from 06:00 to 18:00. In Figure 2a, we report the average particle diameter for each of the seven particle categories. Therefore, by combining the results illustrated in Figure 2a with the information reported in Table 1, we can identify the main aerosol particles detected by the WIBS on the selected winter day (10 January 2024).

Figure 2.
Average (a) particle diameter, (b) mass concentration, (c) number concentration, and (d) asphericity parameter for each of the 7 particle categories identified by the WIBS measurements performed on 10 January 2024 at the monitoring site of Lecce.
Firstly, we can observe from Figure 2a that A-type particles presented a size range between 1 and 2 μm. Therefore, considering the information reported in Table 1, the aerosol particles identified as A type were probably composed of bacteria and/or soot particles. Note also from the other three panels of Figure 2 that these A-type particles were also characterized by low mass and number concentrations, in addition to a low value of asphericity, probably associated with their small size. Considering the predominance of fine-mode particles on the first selected day, also in relation to the air mass back-trajectories from Eastern Europe, we can infer that this A type category could mainly be associated with soot particles on 10 January 2024. This conclusion is also supported by the results for B-type particles shown in Figure 2. In fact, we can note from Figure 2a that the B-type particles on average presented a size range of about 1 μm, which is typically the mean size range for soot particles. In addition, we can observe from Figure 2b,c a significant increase in both the mass and number concentrations, respectively, in early morning and late afternoon, typically associated with the diurnal cycle of atmospheric aerosols (e.g., [42]). The asphericity of the identified B-type particles is in the range of 10–30%, which is a low value, strictly related to the small size range of soot particles. Considering the results reported in Figure 2, a possible component of B-type particles detected by the WIBS measurements could be represented by the HULIS particles, since they are major components of light-absorbing brown carbon [57] and biomass burning emissions [58]. Additionally, the identified C-type particles show low values of both mass and number concentration during the selected monitoring day. In any case, their size of about 1 μm and the higher value of their asphericity parameter (~40%) confirm that this type of particle could mainly be associated with some pollen fragments, as reported in Table 1. Figure 2a also shows that AB-type (green line) and ABC-type (light blue line) particles exhibited the highest variability during the selected winter monitoring day. More specifically, the size range of both AB- and ABC-type particles was of about 1–7 μm. Considering the information reported in Table 1, the previous result could be associated with a predominance of fungal spores and pollen fragments in these two WIBS categories. In addition, due to the detected size range, AB-type particles could also be associated with bacteria, while mineral dust particles could be excluded because of the reported air mass back-trajectories on 10 January 2024 (Figure 1a). A significant contribution of clothing fibers could also be attributed to ABC-type particles (Table 1). Figure 2b also indicates a diurnal cycle for both fungal spores and pollen fragments with lower values of mass concentration in the middle hours of the day, generally associated with an increase in atmospheric turbulence and an increase in the planetary boundary layer height (e.g., [42]). Furthermore, the number concentration of both AB- and ABC-type particles is very low (Figure 2c), and their asphericity parameter values, in the range of 10–20%, are typical of fungal spores. Finally, AC- and BC-type particles appeared to have similar characteristics in the plots of Figure 2 for the selected winter day. Specifically, they were associated with a small size range (~1–2 μm) and particularly low mass and number concentrations. Considering the highly variable asphericity parameter, with values up to 80% (Figure 2d), this result could indicate a possible association of BC particles with pollen fragments on the selected day.
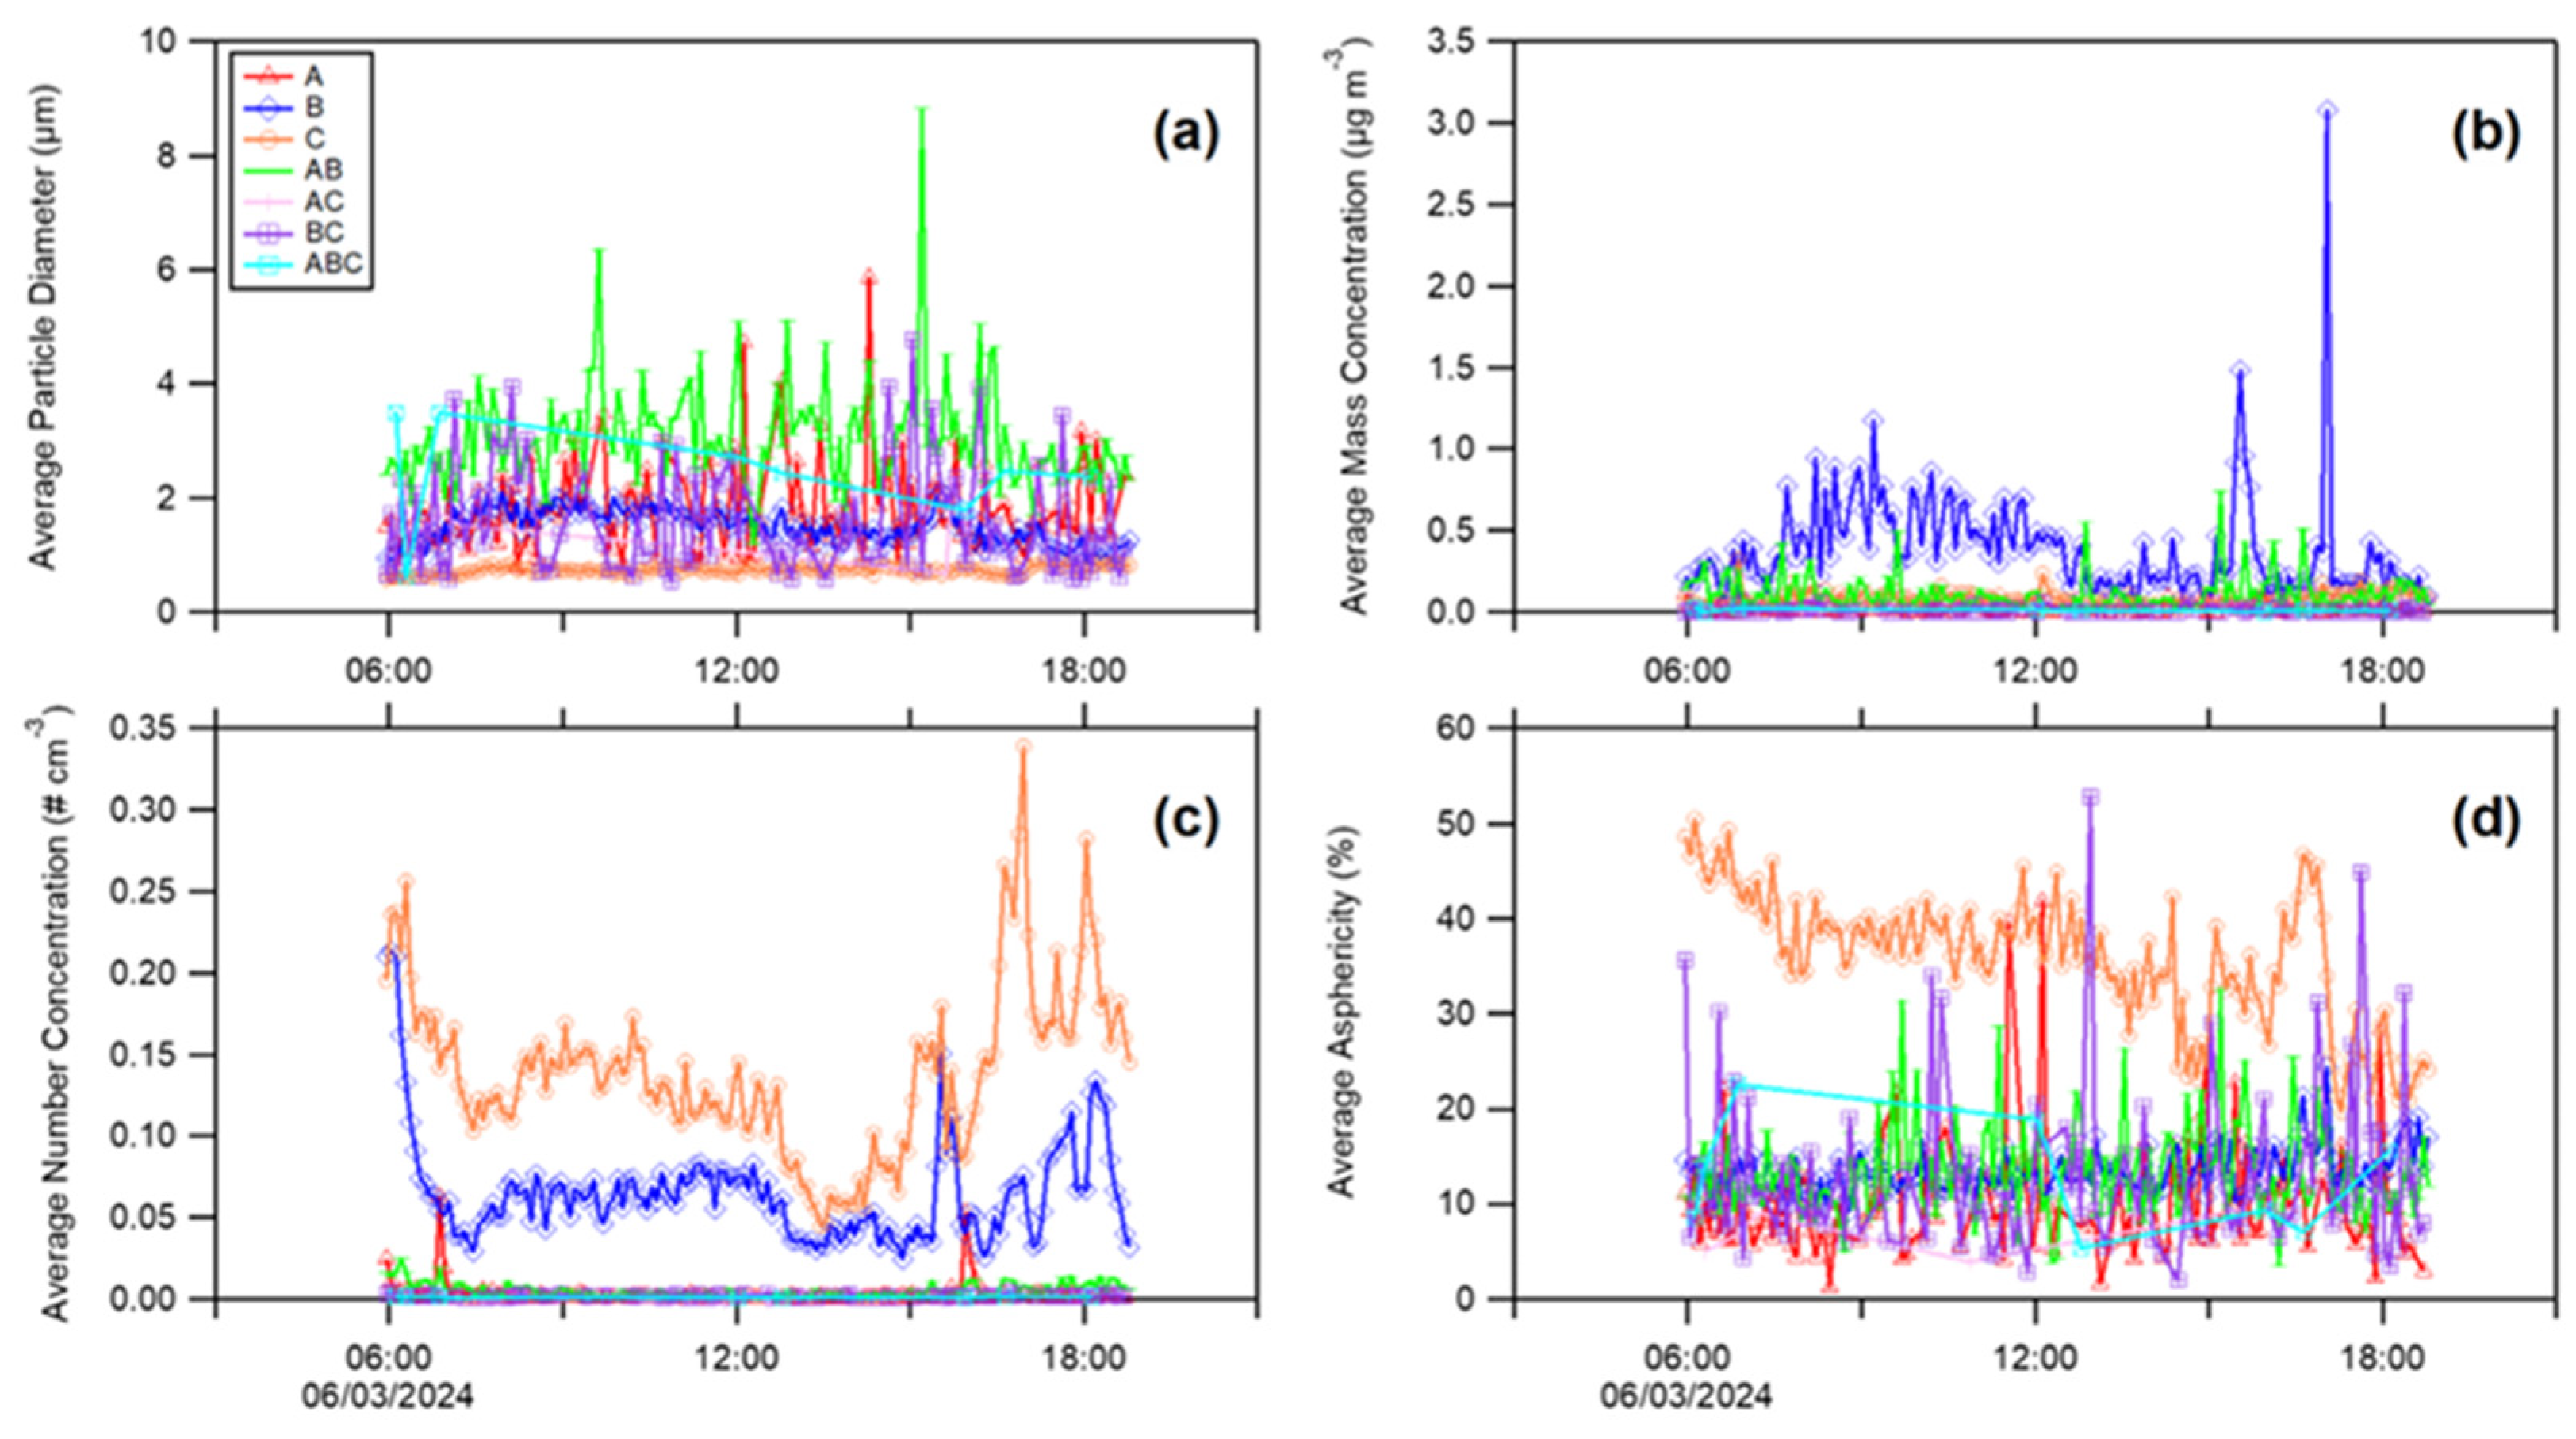
As previously reported in this section, the second day selected to perform the WIBS measurements was characterized by a different aerosol source, because it was highly affected by the advection of marine aerosols, as proven by the air mass back-trajectories illustrated in Figure 1b. Therefore, the same analysis conducted for the first day (10 January 2024) characterized by a continental aerosol source (Figure 2) was repeated for the second selected day (6 March 2024). In more detail, the time evolutions of average particle diameter, mass and number concentration, and asphericity parameter determined by the WIBS measurements performed at the study site during this second selected day are reported in Figure 3.

Figure 3.
Average (a) particle diameter, (b) mass concentration, (c) number concentration, and (d) asphericity parameter for each of the 7 particle categories identified by the WIBS measurements performed on 6 March 2024 at the monitoring site of Lecce.
Analogously to what is illustrated in Figure 2, the different aerosol parameters are reported for each of the seven particle categories determined by WIBS measurements over a 12 h period from 06:00 to 18:00. If we compare the results illustrated in Figure 3a (average particle diameter) with the associations described in Table 1, we can recognize the major aerosol types identified by WIBS on the selected day (6 March 2024) mostly affected by marine air mass advection. Firstly, we can note from Figure 3a that A-type particles (red line) exhibited a size range between 1 and 6 μm. Consequently, considering what is reported in Table 1, the aerosol particles detected by WIBS on 6 March 2024 and identified as A type were probably composed of bacteria and/or fungal spores. As reported in Figure 1b, 6 March was probably also affected by mineral dust advection, as proved by the 500 m air mass back-trajectory (blue line). Therefore, these last results represent the first difference between the two investigated days, because the A-type cluster included the soot particles on 10 January characterized by continental air mass advection, while this type of particle was replaced by fungal spores and probably by mineral dust on 6 March, as this day was affected instead by marine air mass and desert dust advection, respectively. We can note from Figure 3b,c that these A-type particles were also characterized by low mass and number concentrations, respectively. Then, by observing Figure 3d, the A-type particles detected on 6 March were characterized by asphericity parameter values in the range of 5–40%, probably associated with the presence of fungal spores and mineral dust particles in this A-type cluster. It is noteworthy that the A-type particles detected on 10 January were affected by low values of the asphericity parameter, probably due to the presence of soot particles that were probably present to a lower extent on 6 March. The presence of mineral dust on 6 March is also confirmed by the analysis of the B-type particles detected by WIBS on that day. In fact, the B-type particles were characterized by a size range between 1 and 5 μm (Figure 3a) that can be associated only with mineral dust among the particles reported in Table 1 for this WIBS particle category. In addition, we can observe from Figure 3b,c (blue line) a significant increase in mass and number concentration, which is also typical in the case of desert dust advection (e.g., [59]). We can also note from these figures that the significant increase in both B-type particle mass and number concentrations mainly occurred in the early morning and late afternoon, which is generally related to the aerosol daily cycle (e.g., [42]). The asphericity parameter of the B-type particles detected on 6 March was in the range of 10–55% (Figure 3d), which also confirms the presence of desert dust particles associated with the B-type cluster on that day. Then, the C-type particles detected on 6 March were affected by a size of about 1 μm and higher values of asphericity parameter (in the range of ~20–50%), and thus these last results confirm that this type of particle could mainly be related to some pollen fragments, as reported in Table 1. We also observe from Figure 3b that the C-type particles were affected by low mass concentrations, while on the contrary, Figure 3c indicates that these particles presented a significant increase in their number concentrations with respect to the same particles identified on 10 January. Therefore, a higher number concentration of pollen fragments in the C-type cluster was detected on a day affected by marine air mass and desert dust advection with respect to a day mainly affected by continental air masses. Then, among the remaining WIBS particle categories, AB, BC, and ABC particles presented a highly variable size range, except for AC particles with a limited size variability (~1–2 μm). In more detail, the AB-type particles (green line) presented the highest values of mean particle diameter up to 9 μm, while BC- (purple line) and ABC-type particles (light blue line) were mainly identified in the size ranges of 1–5 μm and 1–4 μm, respectively. In addition, all of these particle categories assumed low values of both the number and mass concentration (Figure 3b,c). We can thus observe then from Figure 3d that the reported asphericity parameter was in the range of 10–30% for AB- and ABC-type particles, while it was in a wider range (~10–50%) for the BC particle WIBS category. Therefore, the AB-, BC-, and ABC-type particles detected by WIBS measurements on 6 March could be associated with all of the potential particles reported in Table 1 for these categories: bacteria, fungal spores, pollen fragments, and mineral dust particles for the AB category; fungal spores, pollen fragments, and clothing fibers for the ABC category; and finally pollen fragments for the BC category. Indeed, the wider range of the asphericity parameter for the BC category with respect to the AB and ABC categories could be strictly related to a larger presence of pollen fragments in the BC category, while in the other two categories, the presence of other types of particles could significantly decrease the mean value of the asphericity parameter.
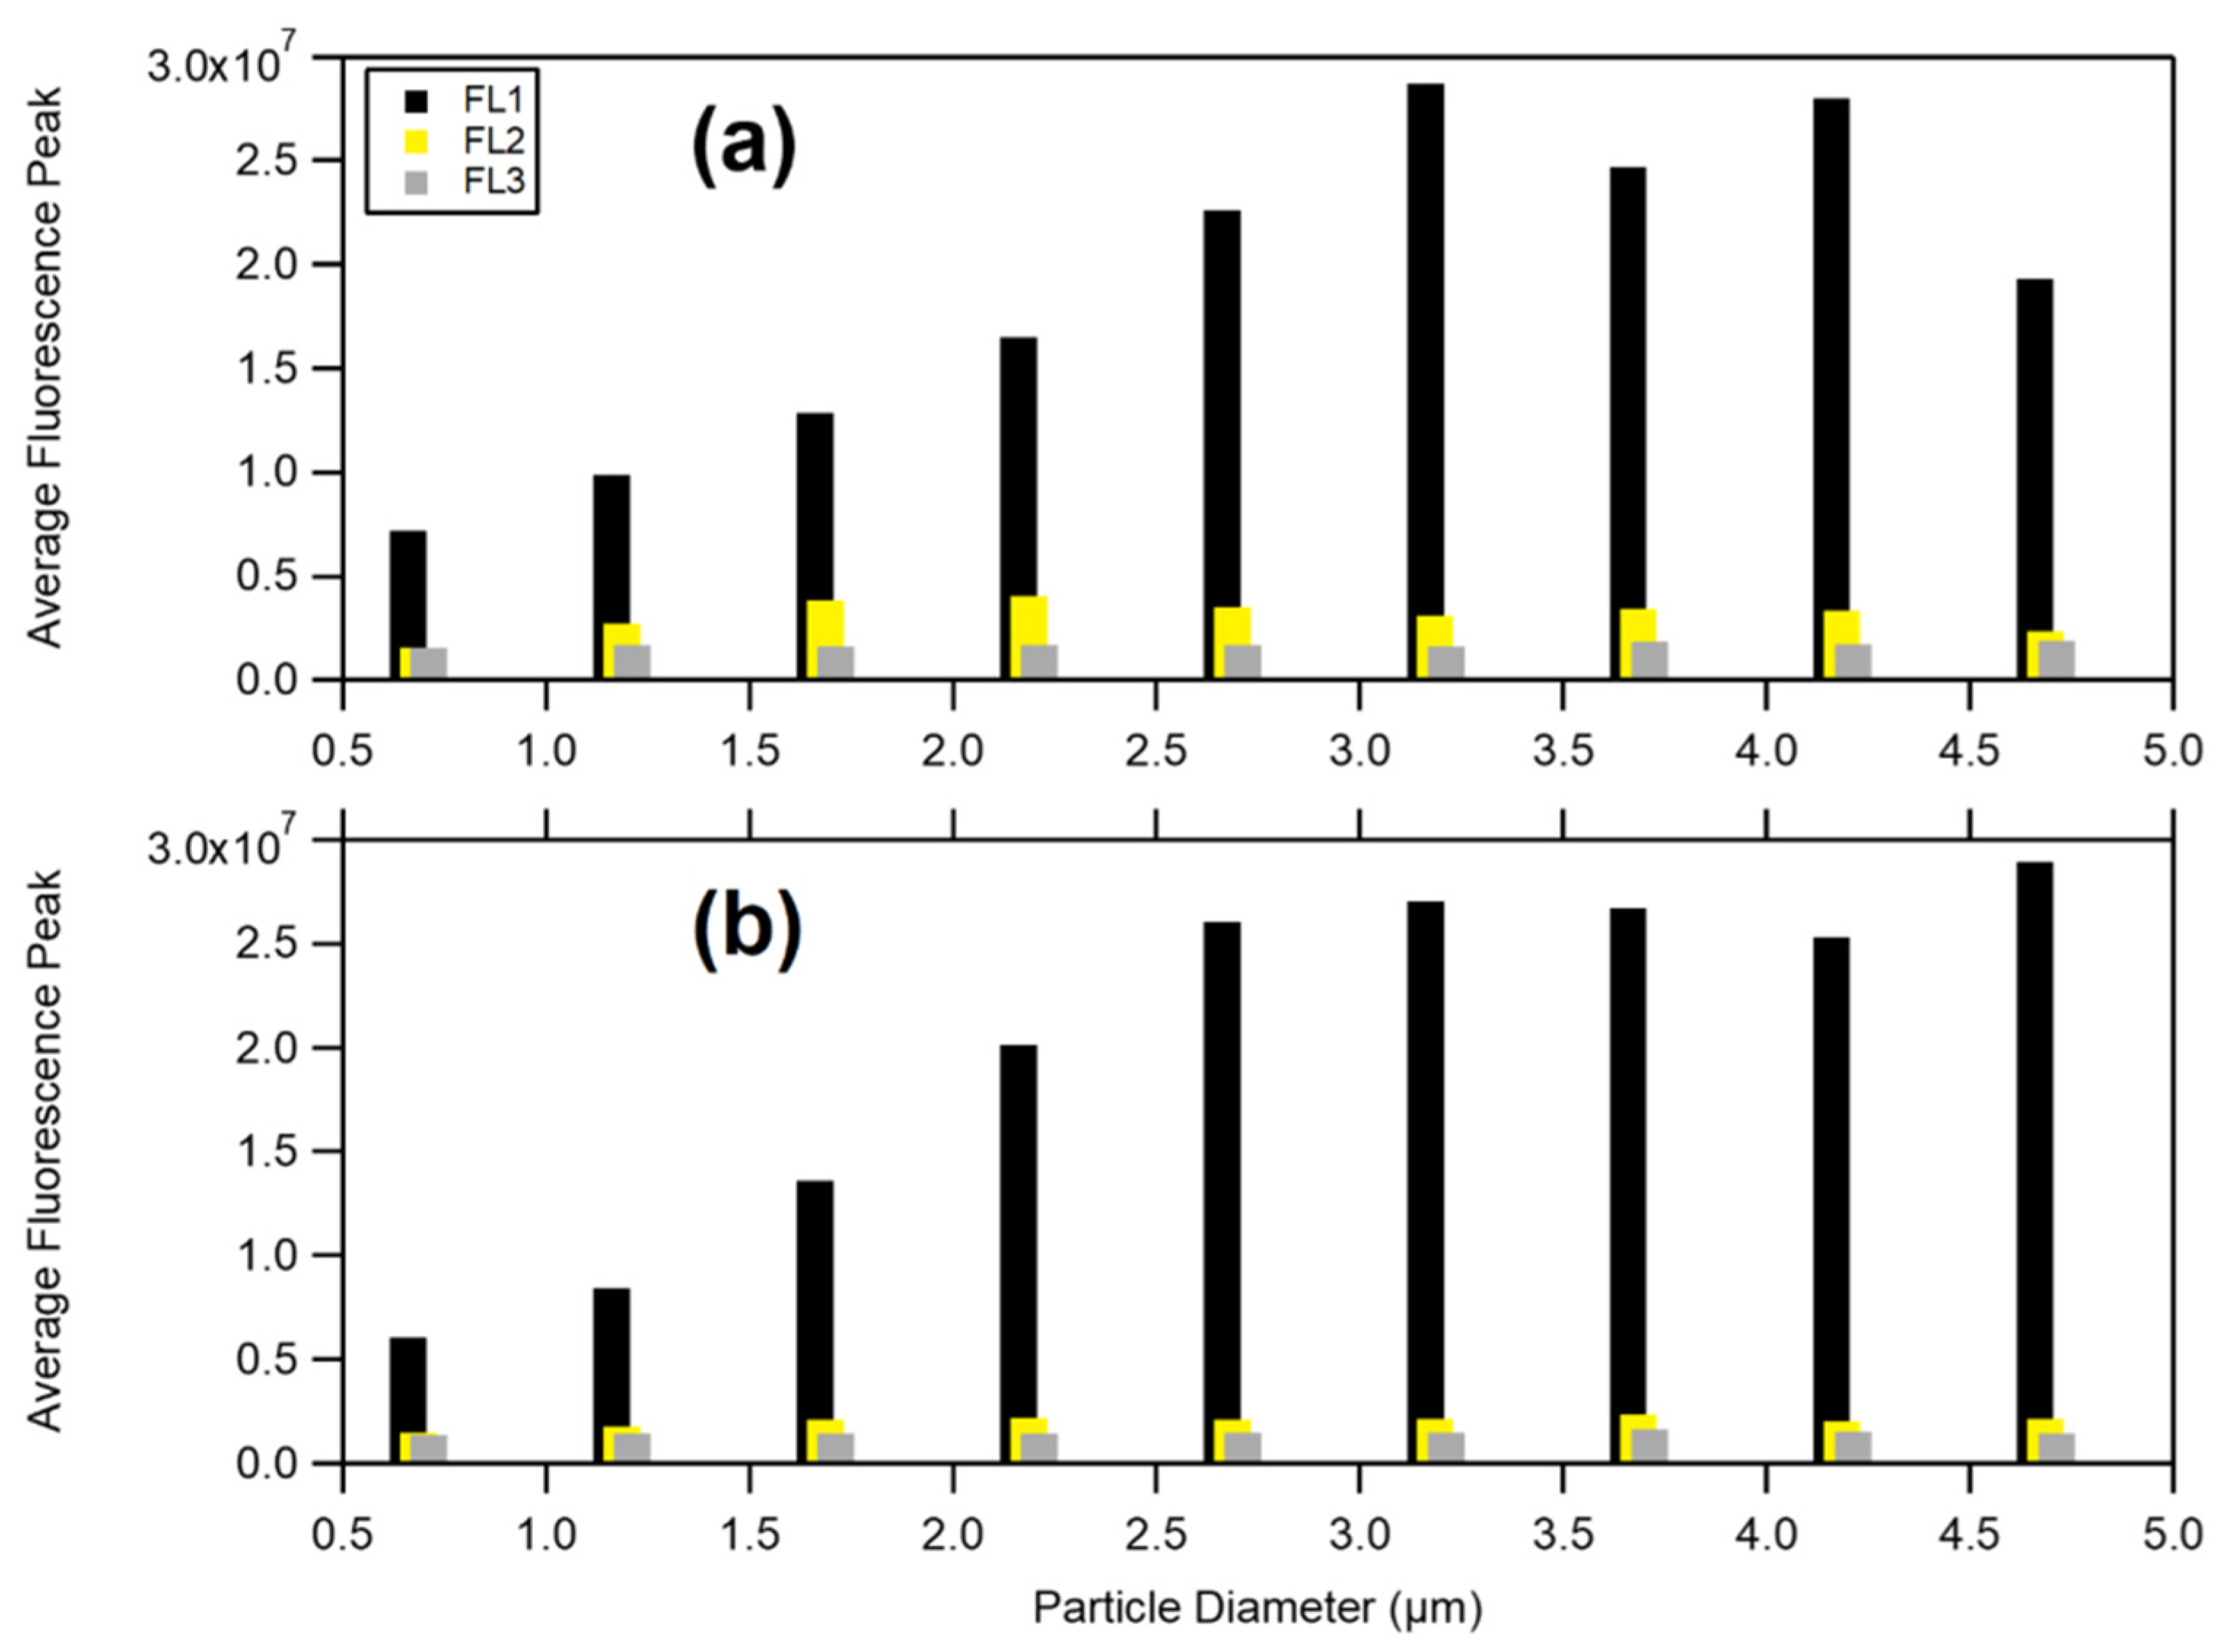
Finally, Figure 4 shows the average fluorescence peak as a function of particle diameter for the three fluorescence channels, FL1, FL2, and FL3, identified on the two different dates (10 January and 6 March 2024) at the monitoring site in Lecce.
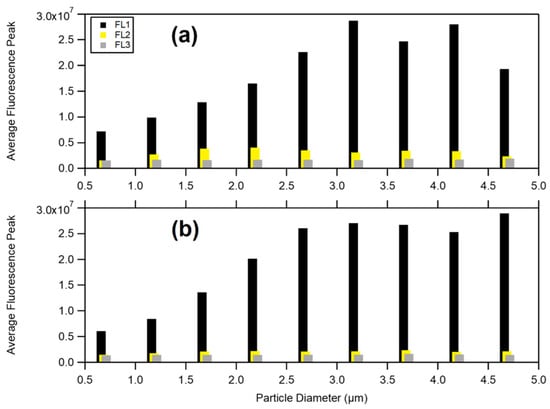
Figure 4.
Average fluorescence peak as a function of the particle diameter for FL1 (with excitation at 280 nm and detection in the 310–400 nm band), indicated by black bars, FL2 (with excitation at 280 nm and detection in the 420–650 nm band), indicated by yellow bars, and FL3 (with excitation at 370 nm and detection in the 420–650 nm band), indicated by gray bars, determined by the WIBS measurements performed on (a) 10 January and (b) 6 March 2024 at the monitoring site of Lecce.
By observing Figure 4a, the black bars (FL1) consistently show the highest fluorescence peaks on 10 January, followed by yellow bars (FL2), with gray bars (FL3) showing the lowest peaks across all particle diameters. Then, the trends observed in Figure 4b on 6 March are similar to those on 10 January, with black bars (FL1) having the highest fluorescence peaks, followed by yellow bars (FL2), and gray bars (FL3) having the lowest peaks. In addition, by comparing Figure 4a,b, one can note that there is a noticeable increase in the fluorescence peaks across all particle diameters on 6 March compared to the data from 10 January 2024. This last result could be associated with the presence of different types of particles on 6 March, while the particles detected on 10 January could be more related to the soot sources. Regarding the fluorescence intensity detected by the WIBS measurements, the FL1 channel (A + AB + AC + ABC particle types) consistently shows the highest fluorescence peaks on both investigated days. This indicates that particles excited at 280 nm and detected in the 310–400 nm band fluoresce more intensely compared to the other channels. This is because FL1 includes a combination of categories with significant fluorescence contributions such as bacteria, fungi, mineral dust, and pollen fragments. The FL2 channel (B + AB + BC + ABC particle types) shows moderate fluorescence peaks, indicating a significant, but lower, fluorescence intensity compared to FL1. In fact, the moderate fluorescence peaks were influenced by the presence of soot, HULIS, mineral dust, and biogenic particles such as bacteria and fungal spores. The FL3 channel (C + AC + BC + ABC particle types) shows the lowest fluorescence peaks, suggesting that the particles exhibit minimal fluorescence when excited at 370 nm and detected in the 420–650 nm band. This last result is mainly due to the association of the FL3 channel only with the detection of pollen fragments, HULIS, and a smaller contribution from bacteria and fungi. In addition, one can note from Figure 4 that the fluorescence intensity generally increases with particle size for all the channels, indicating that larger particles tend to exhibit higher fluorescence peaks. In more detail, particles with a size range of around 2.5–5 µm show the highest fluorescence peaks, likely due to the increased presence of pollen fragments and fungi within these size ranges. There is a noticeable increase in fluorescence peaks in March (Figure 4b) compared to January (Figure 4a) across all channels and particle sizes. This could be due to seasonal variations in composition or concentration of airborne particles at the selected monitoring site. The higher fluorescence peaks in March suggest a potential increase in biological and/or organic airborne material during this period, which could be linked to seasonal events, such as plant blooming and/or increased human activities (e.g., agricultural activities). In summary, Figure 4 illustrates the dependence of fluorescence intensity on particle size and season, with notable differences between the two selected days, suggesting seasonal variations in airborne particle composition at the monitoring site and confirming the results about the comparison of Figure 2 (10 January) and Figure 3 (6 March). In conclusion, the main outcomes obtained regarding the seven WIBS categories can be summarized as follows:
- Category A particles: 10 January: composed mainly of soot and bacteria, with a size range of 1–2 μm and low mass and number concentrations; 6 March: composed of fungal spores and mineral dust, with a size range of 1–6 μm and low concentrations.
- Category B particles: 10 January: predominantly soot particles, around 1 μm in size, with significant diurnal variations in mass and number concentrations; 6 March: mineral dust particles, with a size range of 1–5 μm, showing increased concentrations in the morning and late afternoon.
- Category C particles: 10 January: likely pollen fragments, around 1 μm in size, with low mass and number concentrations; 6 March: increased number concentrations compared to January, still likely pollen fragments.
- Category AB particles: 10 January: size range of 1–7 μm, possibly including fungal spores, pollen fragments, and bacteria, with low concentrations; 6 March: high size variability (up to 9 μm), including bacteria, fungal spores, pollen fragments, and mineral dust, with low concentrations.
- Category AC particles: 10 January and 6 March: small size range (~1–2 μm), likely including fungal spores and pollen fragments, with low concentrations and variable asphericity.
- Category BC particles: 10 January and 6 March: size range of 1–5 μm, likely including pollen fragments, with low concentrations and variable asphericity.
- Category ABC particles: 10 January: high variability, size range of 1–7 μm, possibly including fungal spores, pollen fragments, and clothing fibers, with low concentrations; 6 March: size range of 1–4 μm, likely including fungal spores, pollen fragments, and clothing fibers, with low concentrations.
4. Discussion
The analysis presented in this work provides significant insights into the variation in aerosol particle characteristics and sources over two distinct monitoring days (10 January and 6 March 2024) at the monitoring site of the University of Salento in Lecce, southeastern Italy. By employing the WIBS (wideband integrated bioaerosol sensor) measurements, it was feasible to differentiate between the particle types and their origins, revealing the complex dynamics of the aerosol compositions in this Mediterranean region. Our findings were related to the distinct characteristics in the aerosol sources between the two selected days, as shown in Figure 1. The winter day (10 January) was characterized by significant transport of anthropogenic particles from Eastern Europe, resulting in an abundance of fine-mode particles. This is consistent with previous studies [42,54], which reported high concentrations of anthropogenic aerosols in southeastern Italy due to the air mass trajectories from Eastern Europe. Conversely, the measurements on 6 March were mostly influenced by marine aerosol sources, leading to a predominance of the coarse-mode particles. The advection of marine aerosols, combined with occasional mineral dust transport, aligns with the exposure of the location to Mediterranean Sea spray and desert dust outbreaks [54].
The seven WIBS particle categories (A, B, C, AB, AC, BC, and ABC) showed varying characteristics based on the different sources and seasons. On 10 January, particles were predominantly fine-mode, with types A and B likely mainly consisting of soot and bacteria. The low asphericity values and size range (~1 μm) for these particles, along with diurnal patterns in mass and number concentrations, suggest their association with anthropogenic activities and combustion sources. In contrast, on 6 March, the presence of marine aerosols and mineral dust fostered the presence of larger particle sizes and different bioaerosol compositions. The A-type particles on this day included fungal spores and mineral dust, reflecting the influence of marine and desert dust advection. The B-type particles, with increased mass and number concentrations, were also indicative of the mineral dust, further supported by their size range and asphericity values. The comparison between the two days highlighted a significant seasonal variation in particle composition. The shift from soot-dominated aerosols in winter to marine and dust aerosols in early spring underscores the dynamic nature of aerosol sources in the investigated region.
Figure 4 reveals notable differences in fluorescence peaks between the two days. The FL1 channel, associated with particles such as bacteria, fungal spores, mineral dust, and pollen, consistently showed the highest fluorescence peaks, reflecting the high bioaerosol content. The increased fluorescence peaks on 6 March compared to 10 January suggest a higher concentration of biological or organic material during early spring, potentially due to plant blooming and/or agricultural activities. Then, the moderate fluorescence peaks in the FL2 channel and the lowest peaks in the FL3 channel further corroborated the varying bioaerosol types. The FL2 channel’s peaks were influenced by the presence of soot, HULIS, and biogenic particles, while the FL3 channel’s minimal fluorescence was mainly due to pollen fragments, HULIS, and a smaller contribution from both bacteria and fungal spores.
This work highlights the importance of understanding seasonal and source variations in the aerosol particle characteristics for environmental monitoring and health assessments. The clear distinction between winter and spring aerosol compositions underscores the need for continuous monitoring to capture the dynamic changes in air quality. The integration of WIBS measurements with air mass back-trajectories proved effective in identifying aerosol sources and their potential impacts on local air quality. However, it should be remarked that examining aerosol characteristics and sources based on only two days of data is a limitation of this research. While the two selected days provide a snapshot of different seasonal conditions, a more extended sampling interval would be necessary to fully understand the complex processes and variations in aerosol compositions and features. Moreover, integrating other analytical techniques could provide a more comprehensive understanding of the complex interactions between different aerosol sources and their environmental and health effects.
5. Conclusions
In this work, we investigated the main characteristics and sources of aerosol and bioaerosol particles in a Mediterranean region, using advanced WIBS-NEO measurements and HYSPLIT air mass back-trajectories, over two distinct seasonal days. By achieving this, we aimed to enhance the understanding of the dynamic nature of aerosol and bioaerosol compositions and their potential impact on air quality.
Our analysis successfully differentiated particle types and traced their origins, revealing significant seasonal variations in aerosol sources and compositions. On 10 January 2024, a winter day, the aerosol measurements were dominated by fine-mode particles, primarily transported from Eastern Europe and largely composed of anthropogenic aerosols such as soot and bacteria. Conversely, on 6 March 2024, an early spring day, the aerosol composition was characterized by coarse-mode particles, heavily influenced by marine aerosols and occasional mineral dust advection. This seasonal shift to marine and dust influences highlights the diverse and dynamic sources impacting the region, fulfilling our objective of capturing seasonal variability in aerosol characteristics.
The analysis of the seven WIBS particle categories further elucidated these seasonal differences. On the winter day, particles were mainly fine-mode, with types A and B likely representing soot and bacteria, reflecting the anthropogenic impact. In contrast, the early spring day measurements revealed larger particles, including fungal spores and mineral dust, indicative of marine and desert dust aerosols. Fluorescence intensity data provided additional insights into the increased biological and organic airborne material during early spring, suggesting environmental shifts related to plant blooming and agricultural activities.
Our study underscores the effectiveness of integrating WIBS measurements with air mass back-trajectories in identifying aerosol sources and assessing their potential impact on air quality. Future research should aim for a longer temporal span and the integration of additional analytical techniques to provide a more comprehensive understanding of aerosol dynamics and their environmental and health effects. In conclusion, this study advances the understanding of seasonal and source variations in aerosol and bioaerosol particle characteristics in a Mediterranean region, emphasizing the need for continuous and comprehensive monitoring using the WIBS-NEO device to inform environmental and public health policies effectively.
Author Contributions
Conceptualization, S.R., G.Q. and L.C.; Methodology, M.F., D.P. and S.R.; Software, M.F. and D.P.; Formal Analysis, M.F. and D.P.; Investigation, M.F., D.P. and S.R.; Resources, M.F. and D.P.; Data Curation, M.F., D.P. and S.R.; Writing—original draft preparation, M.F. and S.R.; Supervision, S.R., G.Q. and L.C.; Project Administration, S.R., G.Q. and L.C.; Funding Acquisition, S.R., G.Q. and L.C. All authors have read and agreed to the published version of the manuscript.
Funding
M. Fragola carried out this work with the support of a research fellowship financed by the Project PON PER-ACTRIS-IT CIR01_00015–CUP F88I20000190001. D. Peccarrisi carried out this work with the support of a Ph.D. fellowship financed by the Project PNRR ITINERIS-IR0000032, CUP B53C22002150006. The work was also supported by the Italian PRIN Project BIO-MASTER (BIOaerosol Monitoring And classification: development of a Standardized procedure by integrating different data analysis Techniques and Experimental Research methodologies, 202249BMWR) and by the Italian Project PER-ACTRIS-IT (Enhancement of the Italian Component of the Aerosol, Clouds, and Trace Gases Research InfraStructure, PIR01_00015), both funded by the Italian Ministry of Education, University and Research.
Institutional Review Board Statement
Not applicable.
Informed Consent Statement
Not applicable.
Data Availability Statement
The raw data supporting the conclusions of this article will be made available by the authors upon request.
Acknowledgments
The NOAA Air Resources Laboratory is kindly acknowledged for the provision of the HYSPLIT back-trajectories.
Conflicts of Interest
The authors declare no conflicts of interest.
References
- Perrino, C.; Marcovecchio, F. A New Method for Assessing the Contribution of Primary Biological Atmospheric Particles to the Mass Concentration of the Atmospheric Aerosol. Environ. Int. 2016, 87, 108–115. [Google Scholar] [CrossRef] [PubMed]
- Després, V.R.; Huffman, J.A.; Burrows, S.M.; Hoose, C.; Safatov, A.S.; Buryak, G.; Fröhlich-Nowoisky, J.; Elbert, W.; Andreae, M.O.; Pöschl, U.; et al. Primary Biological Aerosol Particles in the Atmosphere: A Review. Tellus B Chem. Phys. Meteorol. 2012, 64, 15598. [Google Scholar] [CrossRef]
- Fröhlich-Nowoisky, J.; Kampf, C.J.; Weber, B.; Huffman, J.A.; Pöhlker, C.; Andreae, M.O.; Lang-Yona, N.; Burrows, S.M.; Gunthe, S.S.; Elbert, W.; et al. Bioaerosols in the Earth System: Climate, Health, and Ecosystem Interactions. Atmos. Res. 2016, 182, 346–376. [Google Scholar] [CrossRef]
- Pöschl, U.; Shiraiwa, M. Multiphase Chemistry at the Atmosphere–Biosphere Interface Influencing Climate and Public Health in the Anthropocene. Chem. Rev. 2015, 115, 4440–4475. [Google Scholar] [CrossRef] [PubMed]
- Forde, E.; Gallagher, M.; Walker, M.; Foot, V.; Attwood, A.; Granger, G.; Sarda-Estève, R.; Stanley, W.; Kaye, P.; Topping, D. Intercomparison of Multiple UV-LIF Spectrometers Using the Aerosol Challenge Simulator. Atmosphere 2019, 10, 797. [Google Scholar] [CrossRef]
- Whitehead, J.D.; Darbyshire, E.; Brito, J.; Barbosa, H.M.J.; Crawford, I.; Stern, R.; Gallagher, M.W.; Kaye, P.H.; Allan, J.D.; Coe, H.; et al. Biogenic Cloud Nuclei in the Central Amazon during the Transition from Wet to Dry Season. Atmos. Chem. Phys. 2016, 16, 9727–9743. [Google Scholar] [CrossRef]
- Smith, D.J.; Griffin, D.W.; Jaffe, D.A. The High Life: Transport of Microbes in the Atmosphere. Eos 2011, 92, 249–250. [Google Scholar] [CrossRef]
- Cheng, B.; Yue, S.; Hu, W.; Ren, L.; Deng, J.; Wu, L.; Fu, P. Summertime Fluorescent Bioaerosol Particles in the Coastal Megacity Tianjin, North China. Sci. Total Environ. 2020, 723, 137966. [Google Scholar] [CrossRef] [PubMed]
- Morris, C.E.; Sands, D.C.; Bardin, M.; Jaenicke, R.; Vogel, B.; Leyronas, C.; Ariya, P.A.; Psenner, R. Microbiology and Atmospheric Processes: Research Challenges Concerning the Impact of Airborne Micro-Organisms on the Atmosphere and Climate. Biogeosciences 2011, 8, 17–25. [Google Scholar] [CrossRef]
- Pöschl, U. Atmospheric Aerosols: Composition, Transformation, Climate and Health Effects. Angew. Chem. Int. Ed. Engl. 2005, 44, 7520–7540. [Google Scholar] [CrossRef]
- Pöschl, U.; Martin, S.T.; Sinha, B.; Chen, Q.; Gunthe, S.S.; Huffman, J.A.; Borrmann, S.; Farmer, D.K.; Garland, R.M.; Helas, G.; et al. Rainforest Aerosols as Biogenic Nuclei of Clouds and Precipitation in the Amazon. Science 2010, 329, 1513–1516. [Google Scholar] [CrossRef] [PubMed]
- Douwes, J.; Thorne, P.; Pearce, N.; Heederik, D. Bioaerosol Health Effects and Exposure Assessment: Progress and Prospects. Ann. Occup. Hyg. 2003, 47, 187–200. [Google Scholar] [CrossRef] [PubMed]
- Walser, S.M.; Gerstner, D.G.; Brenner, B.; Bünger, J.; Eikmann, T.; Janssen, B.; Kolb, S.; Kolk, A.; Nowak, D.; Raulf, M.; et al. Evaluation of Exposure–Response Relationships for Health Effects of Microbial Bioaerosols—A Systematic Review. Int. J. Hyg. Environ. Health 2015, 218, 577–589. [Google Scholar] [CrossRef] [PubMed]
- Li, J.; Wan, M.P.; Schiavon, S.; Tham, K.W.; Zuraimi, S.; Xiong, J.; Fang, M.; Gall, E. Size-resolved Dynamics of Indoor and Outdoor Fluorescent Biological Aerosol Particles in a Bedroom: A One-month Case Study in Singapore. Indoor Air 2020, 30, 942–954. [Google Scholar] [CrossRef] [PubMed]
- Reid, C.E.; Gamble, J.L. Aeroallergens, Allergic Disease, and Climate Change: Impacts and Adaptation. Ecohealth 2009, 6, 458–470. [Google Scholar] [CrossRef] [PubMed]
- Ma, Y.; Wang, Z.; Yang, D.; Diao, Y.; Wang, W.; Zhang, H.; Zhu, W.; Zheng, J. On-Line Measurement of Fluorescent Aerosols near an Industrial Zone in the Yangtze River Delta Region Using a Wideband Integrated Bioaerosol Spectrometer. Sci. Total Environ. 2019, 656, 447–457. [Google Scholar] [CrossRef] [PubMed]
- Griffiths, W.D.; DeCosemo, G.A.L. The Assessment of Bioaerosols: A Critical Review. J. Aerosol Sci. 1994, 25, 1425–1458. [Google Scholar] [CrossRef]
- Blais-Lecours, P.; Perrott, P.; Duchaine, C. Non-Culturable Bioaerosols in Indoor Settings: Impact on Health and Molecular Approaches for Detection. Atmos. Environ. 2015, 110, 45–53. [Google Scholar] [CrossRef]
- Klimczak, L.J.; Ebner von Eschenbach, C.; Thompson, P.M.; Buters, J.T.M.; Mueller, G.A. Mixture Analyses of Air-Sampled Pollen Extracts Can Accurately Differentiate Pollen Taxa. Atmos. Environ. 2020, 243, 117746. [Google Scholar] [CrossRef]
- Daunys, G.; Šukienė, L.; Vaitkevičius, L.; Valiulis, G.; Sofiev, M.; Šaulienė, I. Clustering Approach for the Analysis of the Fluorescent Bioaerosol Collected by an Automatic Detector. PLoS ONE 2021, 16, e0247284. [Google Scholar] [CrossRef]
- Plaza, M.P.; Kolek, F.; Leier-Wirtz, V.; Brunner, J.O.; Traidl-Hoffmann, C.; Damialis, A. Detecting Airborne Pollen Using an Automatic, Real-Time Monitoring System: Evidence from Two Sites. Int. J. Environ. Res. Public Health 2022, 19, 2471. [Google Scholar] [CrossRef]
- Lancia, A.; Gioffrè, A.; Di Rita, F.; Magri, D.; D’Ovidio, M.C. Aerobiological Monitoring in an Indoor Occupational Setting Using a Real-Time Bioaerosol Sampler. Atmosphere 2023, 14, 118. [Google Scholar] [CrossRef]
- Fennelly, M.; Sewell, G.; Prentice, M.; O’Connor, D.; Sodeau, J. Review: The Use of Real-Time Fluorescence Instrumentation to Monitor Ambient Primary Biological Aerosol Particles (PBAP). Atmosphere 2018, 9, 1. [Google Scholar] [CrossRef]
- Kaye, P.H.; Stanley, W.R.; Hirst, E.; Foot, E.V.; Baxter, K.L.; Barrington, S.J. Single Particle Multichannel Bio-Aerosol Fluorescence Sensor. Opt. Express 2005, 13, 3583. [Google Scholar] [CrossRef] [PubMed]
- Pöhlker, C.; Huffman, J.A.; Pöschl, U. Autofluorescence of Atmospheric Bioaerosols—Fluorescent Biomolecules and Potential Interferences. Atmos. Meas. Tech. 2012, 5, 37–71. [Google Scholar] [CrossRef]
- Lakowicz, J.R. Principles of Fluorescence Spectroscopy, 3rd ed.; Lakowicz, J.R., Ed.; Springer: Berlin/Heidelberg, Germany, 2006. [Google Scholar]
- Hill, S.C.; Mayo, M.W.; Chang, R.K. Fluorescence of Bacteria, Pollens, and Naturally Occurring Airborne Particles: Excitation/Emission Spectra; Army Research Laboratory: Adelphi, MD, USA, 2009. [Google Scholar]
- Schumacher, C.J.; Pöhlker, C.; Aalto, P.; Hiltunen, V.; Petäjä, T.; Kulmala, M.; Pöschl, U.; Huffman, J.A. Seasonal Cycles of Fluorescent Biological Aerosol Particles in Boreal and Semi-Arid Forests of Finland and Colorado. Atmos. Chem. Phys. 2013, 13, 11987–12001. [Google Scholar] [CrossRef]
- Santander, M.V.; Mitts, B.A.; Pendergraft, M.A.; Dinasquet, J.; Lee, C.; Moore, A.N.; Cancelada, L.B.; Kimble, K.A.; Malfatti, F.; Prather, K.A. Tandem Fluorescence Measurements of Organic Matter and Bacteria Released in Sea Spray Aerosols. Environ. Sci. Technol. 2021, 55, 5171–5179. [Google Scholar] [CrossRef] [PubMed]
- Patra, S.S.; Wu, T.; Wagner, D.N.; Jiang, J.; Boor, B.E. Real-Time Measurements of Fluorescent Aerosol Particles in a Living Laboratory Office under Variable Human Occupancy and Ventilation Conditions. Build. Environ. 2021, 205, 108249. [Google Scholar] [CrossRef]
- Bhangar, S.; Huffman, J.A.; Nazaroff, W.W. Size-resolved Fluorescent Biological Aerosol Particle Concentrations and Occupant Emissions in a University Classroom. Indoor Air 2014, 24, 604–617. [Google Scholar] [CrossRef]
- Huffman, J.A.; Perring, A.E.; Savage, N.J.; Clot, B.; Crouzy, B.; Tummon, F.; Shoshanim, O.; Damit, B.; Schneider, J.; Sivaprakasam, V.; et al. Real-Time Sensing of Bioaerosols: Review and Current Perspectives. Aerosol Sci. Technol. 2020, 54, 465–495. [Google Scholar] [CrossRef]
- Toprak, E.; Schnaiter, M. Fluorescent Biological Aerosol Particles Measured with the Waveband Integrated Bioaerosol Sensor WIBS-4: Laboratory Tests Combined with a One Year Field Study. Atmos. Chem. Phys. 2013, 13, 225–243. [Google Scholar] [CrossRef]
- Crawford, I.; Ruske, S.; Topping, D.O.; Gallagher, M.W. Evaluation of Hierarchical Agglomerative Cluster Analysis Methods for Discrimination of Primary Biological Aerosol. Atmos. Meas. Tech. 2015, 8, 4979–4991. [Google Scholar] [CrossRef]
- Romano, S.; Fragola, M.; Alifano, P.; Perrone, M.R.; Talà, A. Potential Human and Plant Pathogenic Species in Airborne PM10 Samples and Relationships with Chemical Components and Meteorological Parameters. Atmosphere 2021, 12, 654. [Google Scholar] [CrossRef]
- Fragola, M.; Perrone, M.R.; Alifano, P.; Talà, A.; Romano, S. Seasonal Variability of the Airborne Eukaryotic Community Structure at a Coastal Site of the Central Mediterranean. Toxins 2021, 13, 518. [Google Scholar] [CrossRef] [PubMed]
- Fragola, M.; Arsieni, A.; Carelli, N.; Dattoli, S.; Maiellaro, S.; Perrone, M.R.; Romano, S. Pollen Monitoring by Optical Microscopy and DNA Metabarcoding: Comparative Study and New Insights. Int. J. Environ. Res. Public Health 2022, 19, 2624. [Google Scholar] [CrossRef] [PubMed]
- Romano, S.; Di Salvo, M.; Rispoli, G.; Alifano, P.; Perrone, M.R.; Talà, A. Airborne Bacteria in the Central Mediterranean: Structure and Role of Meteorology and Air Mass Transport. Sci. Total Environ. 2019, 697, 134020. [Google Scholar] [CrossRef]
- Romano, S.; Becagli, S.; Lucarelli, F.; Rispoli, G.; Perrone, M.R. Airborne Bacteria Structure and Chemical Composition Relationships in Winter and Spring PM10 Samples over Southeastern Italy. Sci. Total Environ. 2020, 730, 138899. [Google Scholar] [CrossRef] [PubMed]
- Basart, S.; Pérez, C.; Cuevas, E.; Baldasano, J.M.; Gobbi, G.P. Aerosol Characterization in Northern Africa, Northeastern Atlantic, Mediterranean Basin and Middle East from Direct-Sun AERONET Observations. Atmos. Chem. Phys. 2009, 9, 8265–8282. [Google Scholar] [CrossRef]
- Contini, D.; Cesari, D.; Genga, A.; Siciliano, M.; Ielpo, P.; Guascito, M.R.; Conte, M. Source apportionment of size-segregated atmospheric particles based on the major water-soluble components in Lecce (Italy). Sci. Total Environ. 2014, 472, 248–261. [Google Scholar] [CrossRef]
- Perrone, M.R.; Romano, S.; Orza, J.A.G. Columnar and Ground-Level Aerosol Optical Properties: Sensitivity to the Transboundary Pollution, Daily and Weekly Patterns, and Relationships. Environ. Sci. Pollut. Res. Int. 2015, 22, 16570–16589. [Google Scholar] [CrossRef]
- Mallet, M.; Dulac, F.; Formenti, P.; Nabat, P.; Sciare, J.; Roberts, G.; Pelon, J.; Ancellet, G.; Tanré, D.; Parol, F.; et al. Overview of the Chemistry-Aerosol Mediterranean Experiment/Aerosol Direct Radiative Forcing on the Mediterranean Climate (ChArMEx/ADRIMED) Summer 2013 Campaign. Atmos. Chem. Phys. 2016, 16, 455–504. [Google Scholar] [CrossRef]
- Contini, D.; Genga, A.; Cesari, D.; Siciliano, M.; Donateo, A.; Bove, M.C.; Guascito, M.R. Characterisation and source apportionment of PM10 in an urban background site in Lecce. Atmos. Res. 2010, 95, 40–54. [Google Scholar] [CrossRef]
- Santese, M.; De Tomasi, F.; Perrone, M.R. Advection patterns and aerosol optical and microphysical properties by AERONET over south-east Italy in the central Mediterranean. Atmos. Chem. Phys. 2008, 8, 1881–1896. [Google Scholar] [CrossRef]
- Larssen, S.; Sluyter, R.; Helmis, C. Criteria for EUROAIRNET, the EEA Air Quality Monitoring and Information Network. 1999. Available online: http://reports.eea.eu.int/TEC12/en (accessed on 18 July 2024).
- O’Connor, D.J.; Healy, D.A.; Hellebust, S.; Buters, J.T.M.; Sodeau, J.R. Using the WIBS-4 (Waveband Integrated Bioaerosol Sensor) Technique for the on-Line Detection of Pollen Grains. Aerosol Sci. Technol. 2014, 48, 341–349. [Google Scholar] [CrossRef]
- Healy, D.A.; O’Connor, D.J.; Sodeau, J.R. Measurement of the Particle Counting Efficiency of the “Waveband Integrated Bioaerosol Sensor” Model Number 4 (WIBS-4). J. Aerosol Sci. 2012, 47, 94–99. [Google Scholar] [CrossRef]
- Gabey, A.M.; Gallagher, M.W.; Whitehead, J.; Dorsey, J.R.; Kaye, P.H.; Stanley, W.R. Measurements and Comparison of Primary Biological Aerosol above and below a Tropical Forest Canopy Using a Dual Channel Fluorescence Spectrometer. Atmos. Chem. Phys. 2010, 10, 4453–4466. [Google Scholar] [CrossRef]
- Perring, A.E.; Schwarz, J.P.; Baumgardner, D.; Hernandez, M.T.; Spracklen, D.V.; Heald, C.L.; Gao, R.S.; Kok, G.; McMeeking, G.R.; McQuaid, J.B.; et al. Airborne Observations of Regional Variation in Fluorescent Aerosol across the United States. J. Geophys. Res. 2015, 120, 1153–1170. [Google Scholar] [CrossRef]
- Calvo, A.I.; Baumgardner, D.; Castro, A.; Fernández-González, D.; Vega-Maray, A.M.; Valencia-Barrera, R.M.; Oduber, F.; Blanco-Alegre, C.; Fraile, R. Daily Behavior of Urban Fluorescing Aerosol Particles in Northwest Spain. Atmos. Environ. 2018, 184, 262–277. [Google Scholar] [CrossRef]
- Yang, S.; Bekö, G.; Wargocki, P.; Williams, J.; Licina, D. Human Emissions of Size-Resolved Fluorescent Aerosol Particles: Influence of Personal and Environmental Factors. Environ. Sci. Technol. 2021, 55, 509–518. [Google Scholar] [CrossRef]
- Savage, N.J.; Krentz, C.E.; Könemann, T.; Han, T.T.; Mainelis, G.; Pöhlker, C.; Huffman, J.A. Systematic Characterization and Fluorescence Threshold Strategies for the Wideband Integrated Bioaerosol Sensor (WIBS) Using Size-Resolved Biological and Interfering Particles. Atmos. Meas. Tech. 2017, 10, 4279–4302. [Google Scholar] [CrossRef]
- Romano, S.; Perrone, M.R.; Pavese, G.; Esposito, F.; Calvello, M. Optical Properties of PM2.5 Particles: Results from a Monitoring Campaign in Southeastern Italy. Atmos. Environ. 2019, 203, 35–47. [Google Scholar] [CrossRef]
- Stone, E.A.; Mampage, C.B.A.; Hughes, D.D.; Jones, L.M. Airborne Sub-Pollen Particles from Rupturing Giant Ragweed Pollen. Aerobiologia 2021, 37, 625–632. [Google Scholar] [CrossRef]
- Tang, D.; Wei, T.; Yuan, J.; Xia, H.; Dou, X. Observation of Bioaerosol Transport Using Wideband Integrated Bioaerosol Sensor and Coherent Doppler Lidar. Atmos. Meas. Tech. 2022, 15, 2819–2838. [Google Scholar] [CrossRef]
- Wu, G.; Wan, X.; Gao, S.; Fu, P.; Yin, Y.; Li, G.; Zhang, G.; Kang, S.; Ram, K.; Cong, Z. Humic-like Substances (HULIS) in Aerosols of Central Tibetan Plateau (Nam Co, 4730 m Asl): Abundance, Light Absorption Properties, and Sources. Environ. Sci. Technol. 2018, 52, 7203–7211. [Google Scholar] [CrossRef] [PubMed]
- Pani, S.K.; Lee, C.-T.; Griffith, S.M.; Lin, N.-H. Humic-like Substances (HULIS) in Springtime Aerosols at a High-Altitude Background Station in the Western North Pacific: Source Attribution, Abundance, and Light-Absorption. Sci. Total Environ. 2022, 809, 151180. [Google Scholar] [CrossRef]
- Stafoggia, M.; Zauli-Sajani, S.; Pey, J.; Samoli, E.; Alessandrini, E.; Basagaña, X.; Cernigliaro, A.; Chiusolo, M.; Demaria, M.; Díaz, J.; et al. Desert dust outbreaks in Southern Europe: Contribution to daily PM10 concentrations and short-term associations with mortality and hospital admissions. Environ. Health Perspect. 2016, 124, 413–419. [Google Scholar] [CrossRef]
Disclaimer/Publisher’s Note: The statements, opinions and data contained in all publications are solely those of the individual author(s) and contributor(s) and not of MDPI and/or the editor(s). MDPI and/or the editor(s) disclaim responsibility for any injury to people or property resulting from any ideas, methods, instructions or products referred to in the content. |
© 2024 by the authors. Licensee MDPI, Basel, Switzerland. This article is an open access article distributed under the terms and conditions of the Creative Commons Attribution (CC BY) license (https://creativecommons.org/licenses/by/4.0/).