Article

Impact of Endogenous Lipids on Mechanical Properties of Wheat Gluten Fractions, Gliadin and Glutenin, under Small, Medium, and Large Deformations †

1
Department of Food Science, Purdue University, 745 Agriculture Mall Dr., West Lafayette, IN 47907, USA
2
Department of Animal, Veterinary and Food Sciences, University of Idaho, 875 Perimeter Dr. MS 2312, Moscow, ID 83844, USA
3
United States Department of Agriculture (USDA)-The Agricultural Research Service (ARS)-The Southern Regional Research Center (SRRC) Food Processing and Sensory Quality, 1100 Robert E Lee Blvd, New Orleans, LA 70124, USA
*
Author to whom correspondence should be addressed.
Mention of trade names or commercial products in this publication is solely for the purpose of providing specific information and does not imply recommendation or endorsement by the U.S. Department of Agriculture. The USDA is an equal opportunity provider and employer.
Lipidology 2024, 1(1), 30-51; https://doi.org/10.3390/lipidology1010004
Submission received: 21 March 2024 / Revised: 7 April 2024 / Accepted: 11 April 2024 / Published: 16 April 2024
(This article belongs to the Special Issue Technologies and Quality Control of Lipid-Based Foods)

Abstract

:
The individual viscoelastic responses of gluten proteins and their lipid-removed counterparts were studied under mixing deformations and small, medium, and large deformations selected in the Large Amplitude Oscillatory Shear (LAOS) sweeps. During Farinograph mixing, gliadin reached the 500 BU consistency line after 3.6 ± 0.4 min, while the highest consistency recorded for lipid-removed gliadin was 268 ± 8.4 BU, suggesting a reduction in the water absorption of gliadin in the absence of lipids. The affinity of glutenin to water increased in the absence of lipids, as development time was reached 11 min earlier for lipid-removed glutenin. Under small LAOS strains, tanδ of gliadin remained constant with the removal of lipids, while glutenin’s elasticity decreased (tanδ increased) in the absence of lipids at high frequencies. Intracycle strain-stiffening behavior (e3/e1 > 0) of gliadin increased under medium deformations with high frequency and decreased under low-frequency large deformations as lipids were removed, while this response decreased for glutenin with the removal of lipids only under high-frequency medium and large deformations. Under large LAOS strains, the clockwise rotation of the Lissajous–Bowditch curves for gliadin in the absence of lipids suggested higher intercycle strain-softening and shear-thinning, while the counter-clockwise rotation of the curves for glutenin in the absence of lipids suggested lower intercycle strain-softening and shear-thinning. These results revealed the influence of endogenous lipids on the viscous-dominated response of gliadin and to the elastic-dominated response of glutenin, while balancing the intracycle strain-stiffening behaviors of these gluten proteins especially under large deformations.

1. Introduction

Wheat flour usually contains 2.0% to 3.0% lipids, consisting of 60% to 70% non-starch lipids and 30% to 40% starch lipids [1]. These wheat flour lipids are often referred to as endogenous lipids [2]. Interactions between proteins and lipids in wheat flour dough play a crucial role. Endogenous lipids and gluten proteins, namely gliadin and glutenin, significantly influence the quality of bread made from the flour [3]. Lipid functionality becomes apparent during mixing, the first stage of the breadmaking process [4]. Wheat gluten proteins contribute to the viscoelastic characteristics of dough, a quality that emerges during the mixing process [5]. During dough development, non-starch free lipids become bound to gluten proteins leading to a decrease in the amount of non-starch free lipids in the dough system. The redistribution of non-starch lipids occurring during mixing is known as lipid binding [2,4,6]. The hydrophobic amino acids within gluten proteins act as binding sites for endogenous lipids. Consequently, the interactions between gluten proteins and lipids play a vital role in fortifying the gluten network [6,7]. A study utilizing acetic acid-based extraction indicated that galactolipids interacted with glutenins via hydrophobic and hydrogen interactions, whereas phospholipids were likely to interact with gliadins or lipid-binding proteins present in gluten [2,3]. The binding of lipids to glutenin was so strong that earlier studies defined the complex isolated from gluten as “lipoglutenin” [8].
In the further stages of the breadmaking process, the endogenous lipids bound to gluten proteins during mixing position themselves at the gas cell interface and prevent the coalescence of bubbles entrapped in the gluten–starch matrix, leading to improved loaf volume in baked products [2,4]. Gluten network formation is the primary stabilization mechanism for gas retention within gluten–starch matrices during dough leavening. Thus, the strength and physical traits of these networks dictate the amount of air that can be trapped in the dough [6,7]. This underscores the significance of the interplay between gluten proteins and endogenous lipids in the breadmaking process.
During the breadmaking processing steps (i.e., mixing, fermentation, sheeting, baking), dough is exposed to deformations ranging from small to large with different frequencies. Therefore, the way dough responds to these deformations on a rheological level is particularly important [9]. To investigate the influence of endogenous lipids on breadmaking properties of wheat flour dough, researchers have undertaken studies involving lipid separation and reconstitution into dough systems [10]. Experiments utilizing lipases to modify lipid composition of wheat flour during breadmaking have been carried out [11]. Additionally, hydrophobic interactions among gluten proteins have been studied by extracting proteins from wheat flour dough at different stages of mixing using 1-propanol [12].
This study primarily investigated how endogenous lipids interacted with gluten proteins to affect the viscoelastic properties during dough processing. In a previous study, the viscoelastic characteristics of hydrated gluten with and without endogenous lipids were evaluated through Large Amplitude Oscillatory Shear (LAOS) tests in the linear (under small deformations) and non-linear (under large deformations) viscoelastic regions [4]. This study brought the previous study one step further by characterizing the individual viscoelastic responses of gluten proteins, gliadin and glutenin, and their lipid-removed counterparts under small, medium, and large deformations using the LAOS tests. The direct evaluation of the impact of endogenous lipids on the viscoelastic properties of extracted gluten fractions rather than studying the interaction mechanisms of lipids and gluten proteins in a more complex wheat flour dough system makes this study novel. In addition, the hydration dynamics and mixing characteristics of gliadin and glutenin, with and without endogenous lipids, were examined for the first time using Farinograph tests. Thus, the aim of this study was to bring a fundamental understanding of the contribution of endogenous lipids to the functionalities of gluten proteins under deformations resembling those applied during dough processing.

2. Materials and Methods

2.1. Materials

For the extraction of glutenin, vital wheat gluten (GluvitalTM 21020) from Cargill (Dusseldorf, Germany) was the same as that used in Yazar et al. [13]. As described in Yazar et al. [13], vital wheat gluten was 75.8% protein, 0.9% ash, 7.4% lipids, 6.4% moisture, and residual starch (around 10%).
Ethanol was purchased from PHARMCO-AAPER (Brookfield, CT, USA).

2.2. Methods

2.2.1. Lipid Extraction

Endogenous lipids were extracted from vital wheat gluten as described by Yazar et al. [4]. Here, vital wheat gluten was extracted twice in a 1:5 (w/v) with 95% ethanol (v/v) over a 24 h period and centrifuged at 10,000 rpm for 10 min at room temperature. The supernatant containing lipids was removed, while the residue, referred to as lipid-removed vital wheat gluten by Yazar et al. [4], underwent freeze-drying and grinding into powder for subsequent analysis. Lipid extraction was conducted in several batches and the average amount of lipid extracted from vital wheat gluten was 5.55 ± 0.59% (on dry weight basis).

2.2.2. Extraction of Gluten Fractions and Sample Preparation

Gliadin and glutenin were isolated from vital wheat gluten by leveraging their distinct solubilities as outlined in the Osborne fractionation method [14]. Vital wheat gluten underwent washing with 70% ethanol, following the method outlined by Yazar et al. [13], using a ratio of 1:5 gluten to ethanol (w/v), for approximately 24 h, in accordance with a two-step extraction procedure. Next, the mixture underwent 10 min of centrifugation at 4000 rpm. The resulting supernatant, containing gliadin dissolved in 70% ethanol, was separated from the precipitate comprising glutenin proteins. The ethanol in the supernatant was evaporated using a rotary evaporator at temperatures below 40 °C. Then, both the concentrated ethanol–gliadin mixture and the precipitate were freeze-dried and ground into powder to obtain gliadin and glutenin for further analysis.
The gliadin and glutenin fractionation protocol was applied in an identical manner on lipid-removed vital wheat gluten to obtain lipid-removed gliadin and lipid-removed glutenin fractions.
Wheat gluten fractions were extracted in multiple batches, and the analyses were performed using the total extracts obtained from these batches.

2.2.3. Microfluidic Sodium Dodecyl-Sulfate Polyacrylamide Gel Electrophoresis (SDS-PAGE)

Microfluidic electrophoresis on an Agilent 2100 Bioanalyzer (Lab-on-a-Chip) (Agilent, Santa Clara, CA, USA) was used to determine the molecular weight distributions of gliadin, glutenin, and their lipid-removed counterparts using the Agilent Protein 230 kit as described by Smith et al. [15]. Samples were processed for analysis following the methodology outlined by Yazar et al. [4]. They were then duplicated and loaded onto Protein 230 chips, specific for proteins ranging from 14–230 kDa [16].

2.2.4. Farinograph Mixing

Farinograph tests were performed following the AACC method no. 54-21.02, utilizing the Brabender Farinograph from Duisburg, Germany, with a 50 g mixing bowl. The objective was to assess the influence of endogenous lipids on the mixing behaviors of gliadin and glutenin as per AACC International [17]. Before Farinograph mixing, moisture contents of gliadins and glutenins were assessed following the AACC method 44-15.02 [17]. The Farinograms were plotted using OriginPro 8.6, averaging results from two replicates. Samples were weighed based on a 14% moisture basis, adjusting to 50 g as needed. Gliadin and glutenin required different levels of added water for the Farinograph mixing. However, the same level of water was added for the mixing of gliadin and lipid-removed gliadin (34 mL) and for the mixing of glutenin and lipid-removed glutenin (50.3 mL) to unravel the impact of endogenous lipids on the mixing behaviors of these gluten fractions. Farinograph tests were conducted for 35 min at 63 rpm.
Samples for LAOS tests were collected at the end of mixing in the Farinograph as described above.

2.2.5. SAOS, MAOS, and LAOS Properties of Gluten Fractions with and without Endogenous Lipids

A DHR-3 Rheometer (TA Instruments, Schaumburg, IL, USA) was used to perform all LAOS measurements. The non-linear characteristics of gliadin, glutenin, and their lipid-removed derivatives were assessed at 25 °C across three distinct frequencies (20, 10, and 1 rad/s) within the strain range of 0.01% to 200%. A parallel plate geometry of 20 mm x-hatch and a 2 mm gap were employed [5]. To ensure accurate data acquisition, samples were rested until the axial force reaches a value below 1 N prior to LAOS testing. The measurements were performed in triplicate, and the average oscillatory data were computed using Fourier transforms as described by Ewoldt et al. [18]. The LAOS data were assessed utilizing the TRIOS software (TA Instruments, Schaumburg, IL, USA) and visualized with OriginPro 8.6. The evaluation of SAOS, MAOS, and LAOS behaviors of the samples were conducted at selected strain amplitudes within the strain range used in LAOS sweeps. Strain amplitudes were chosen according to individual material responses.

2.2.6. Statistical Analysis

A 95% confidence level was used for statistical analyses conducted in OriginPro 8.6. To compare the data of gluten fractions with their lipid-removed counterparts, Tukey’s comparison tests (p < 0.05) were used. For each frequency applied (1 rad/sec, 10 rad/sec, 20 rad/sec) and LAOS strain, rheological data were compared separately. Letters were used to denote significant differences in mean values across samples.

3. Results and Discussion

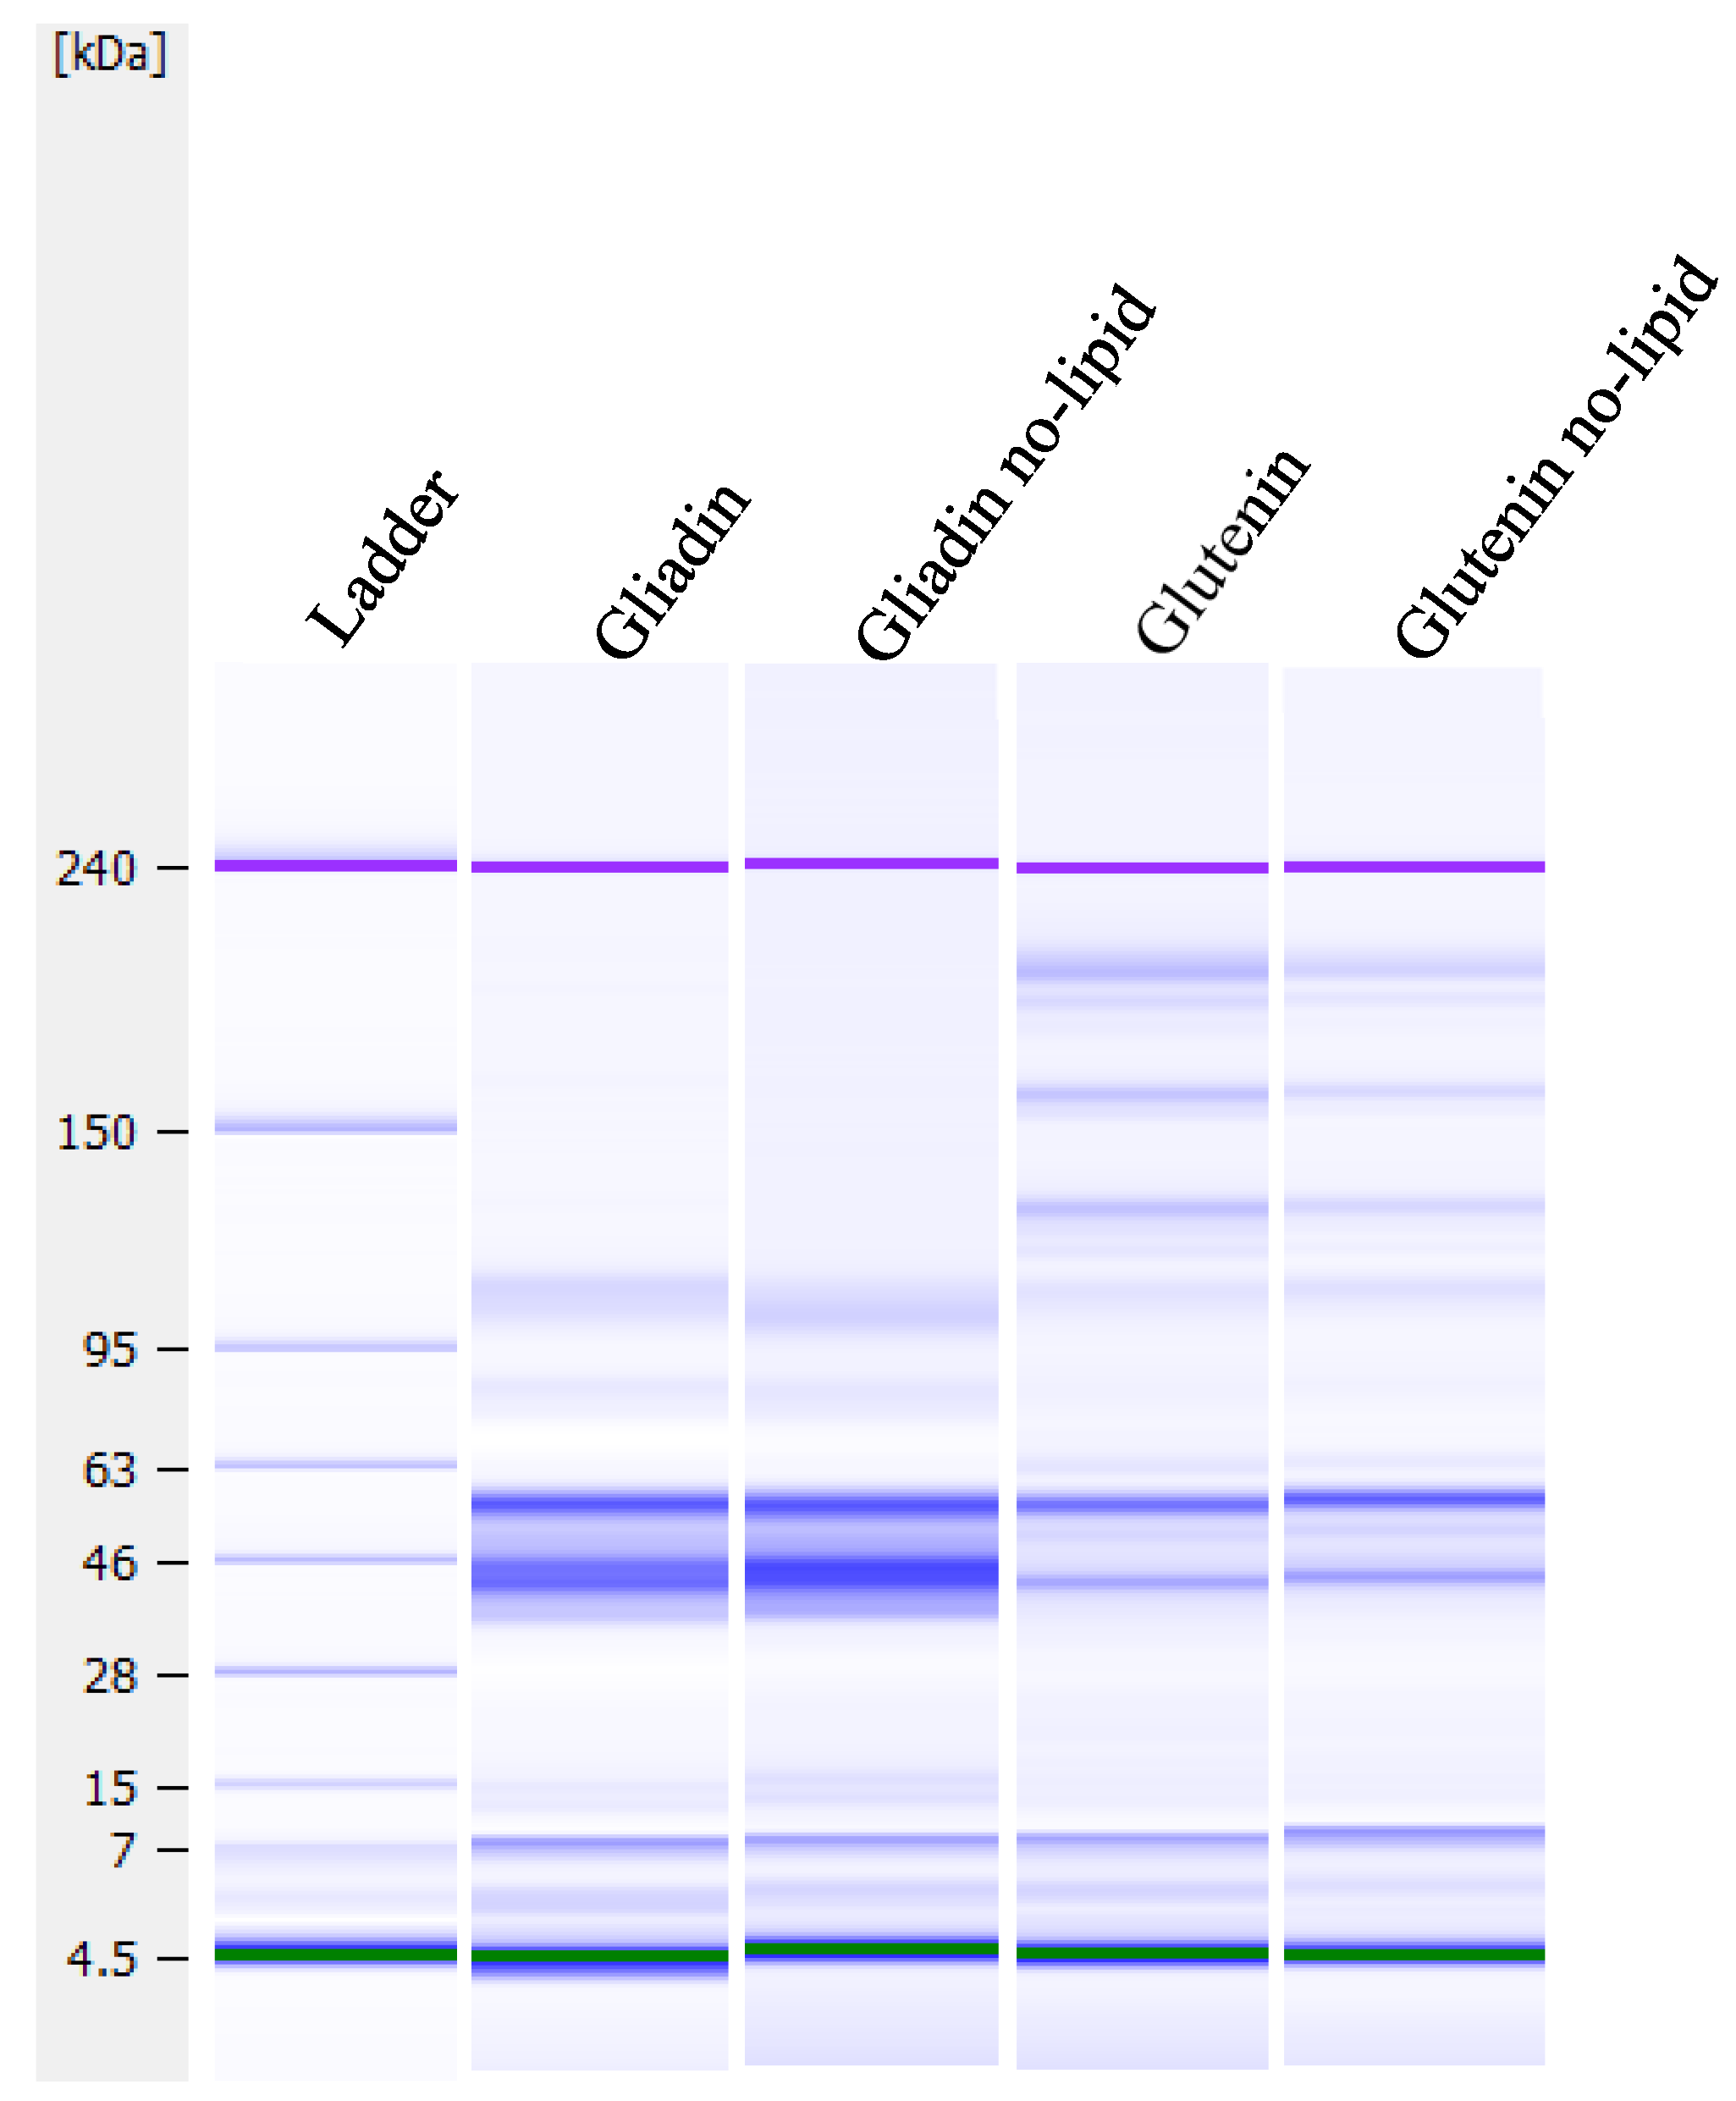
3.1. Microfluidic SDS-PAGE

SDS-PAGE gel images of gliadin, glutenin, and their lipid-removed counterparts are shown in Figure 1. The molecular weight distributions of gluten proteins and their lipid-removed counterparts were almost identical, indicating the lipid extraction process did not alter the molecular weights and concentrations of the subunits. The bands for gliadin and lipid-removed gliadin appeared at molecular weights ranging up to around 110 kDa, while the bands were distributed up to around 230 kDa for glutenin and lipid-removed glutenin. The majority of gliadin proteins had molecular weights of around 35–55 kDa, as proven by the darker bands observed on the SDS-PAGE gels within this range for gliadin and lipid-removed gliadin (Figure 1).
Gliadins are mainly monomeric proteins with molecular weights ranging between 28–55 kDa [19,20], supporting the data found in this study for gliadins. These monomeric proteins are classified into α/β-, γ-, and ω-type based on their different primary structures [19,21]. Besides the darker appearing bands, gliadin and lipid-removed gliadin also showed bands on the SDS-PAGE gels appearing at molecular weights 75 to 110 kDa (Figure 1). The low-molecular-weight and sulfur-rich gliadins, α/β- and γ-gliadins, were reported to have molecular weights of 28–35 kDa [20]. The sulfur-poor ω-gliadins with no ability to form disulfide bonds had higher molecular weight compared to other monomeric gliadins and showed lower mobility on the SDS-PAGE gel, causing the corresponding bands to appear at 44–74 kDa [19,22]. Thus, the gliadin bands appearing around 28–55 kDa on the gels in Figure 1 could be attributed to the monomeric α/β-, γ-, and ω-gliadins. Similar results for gliadins were also reported by others [5,21]. Gliadins also include a fraction consisting of oligomeric proteins that are known as high molecular weight gliadins. These disulfide-linked gliadins were reported to have the molecular weight ranging from 70,000 to 700,000 [20], suggesting that the bands seen on the SDS-PAGE gels for gliadin and lipid-removed gliadin at molecular weights above 70 kDa were indicative of oligomeric gliadins (Figure 1).
The polymeric glutenin proteins showed two distinct bands on the SDS-PAGE gels around 45–60 kDa and at 110 to 230 kDa (Figure 1), corresponding to low-molecular-weight glutenins and high molecular weights, respectively. The molecular weight of disulfide-linked polymeric glutenins was reported to range from 700,000 to more than 10 million [20]. Glutenin proteins dissociated by the reduction of disulfide bonds entered the SDS-PAGE gel, producing bands at molecular weights ≤68 kDa for LMW-glutenins and at molecular weights ≥68 kDa for HMW-glutenins [23], concurring with the SDS-PAGE results found for glutenin and lipid-removed glutenin (Figure 1).
All types of gliadins, except for ω-gliadins, contain intramolecular disulfide bonds, while glutenin subunits are connected by intermolecular disulfide bonds, and thus, the three-dimensional gluten structure is stabilized [20]. This three-dimensional viscoelastic network is only formed by the gluten proteins in the presence of water during mixing [5]. Hence, the specific impact of gluten fractions, both with and without endogenous lipids, on the formation of the three-dimensional network was assessed in the following section.

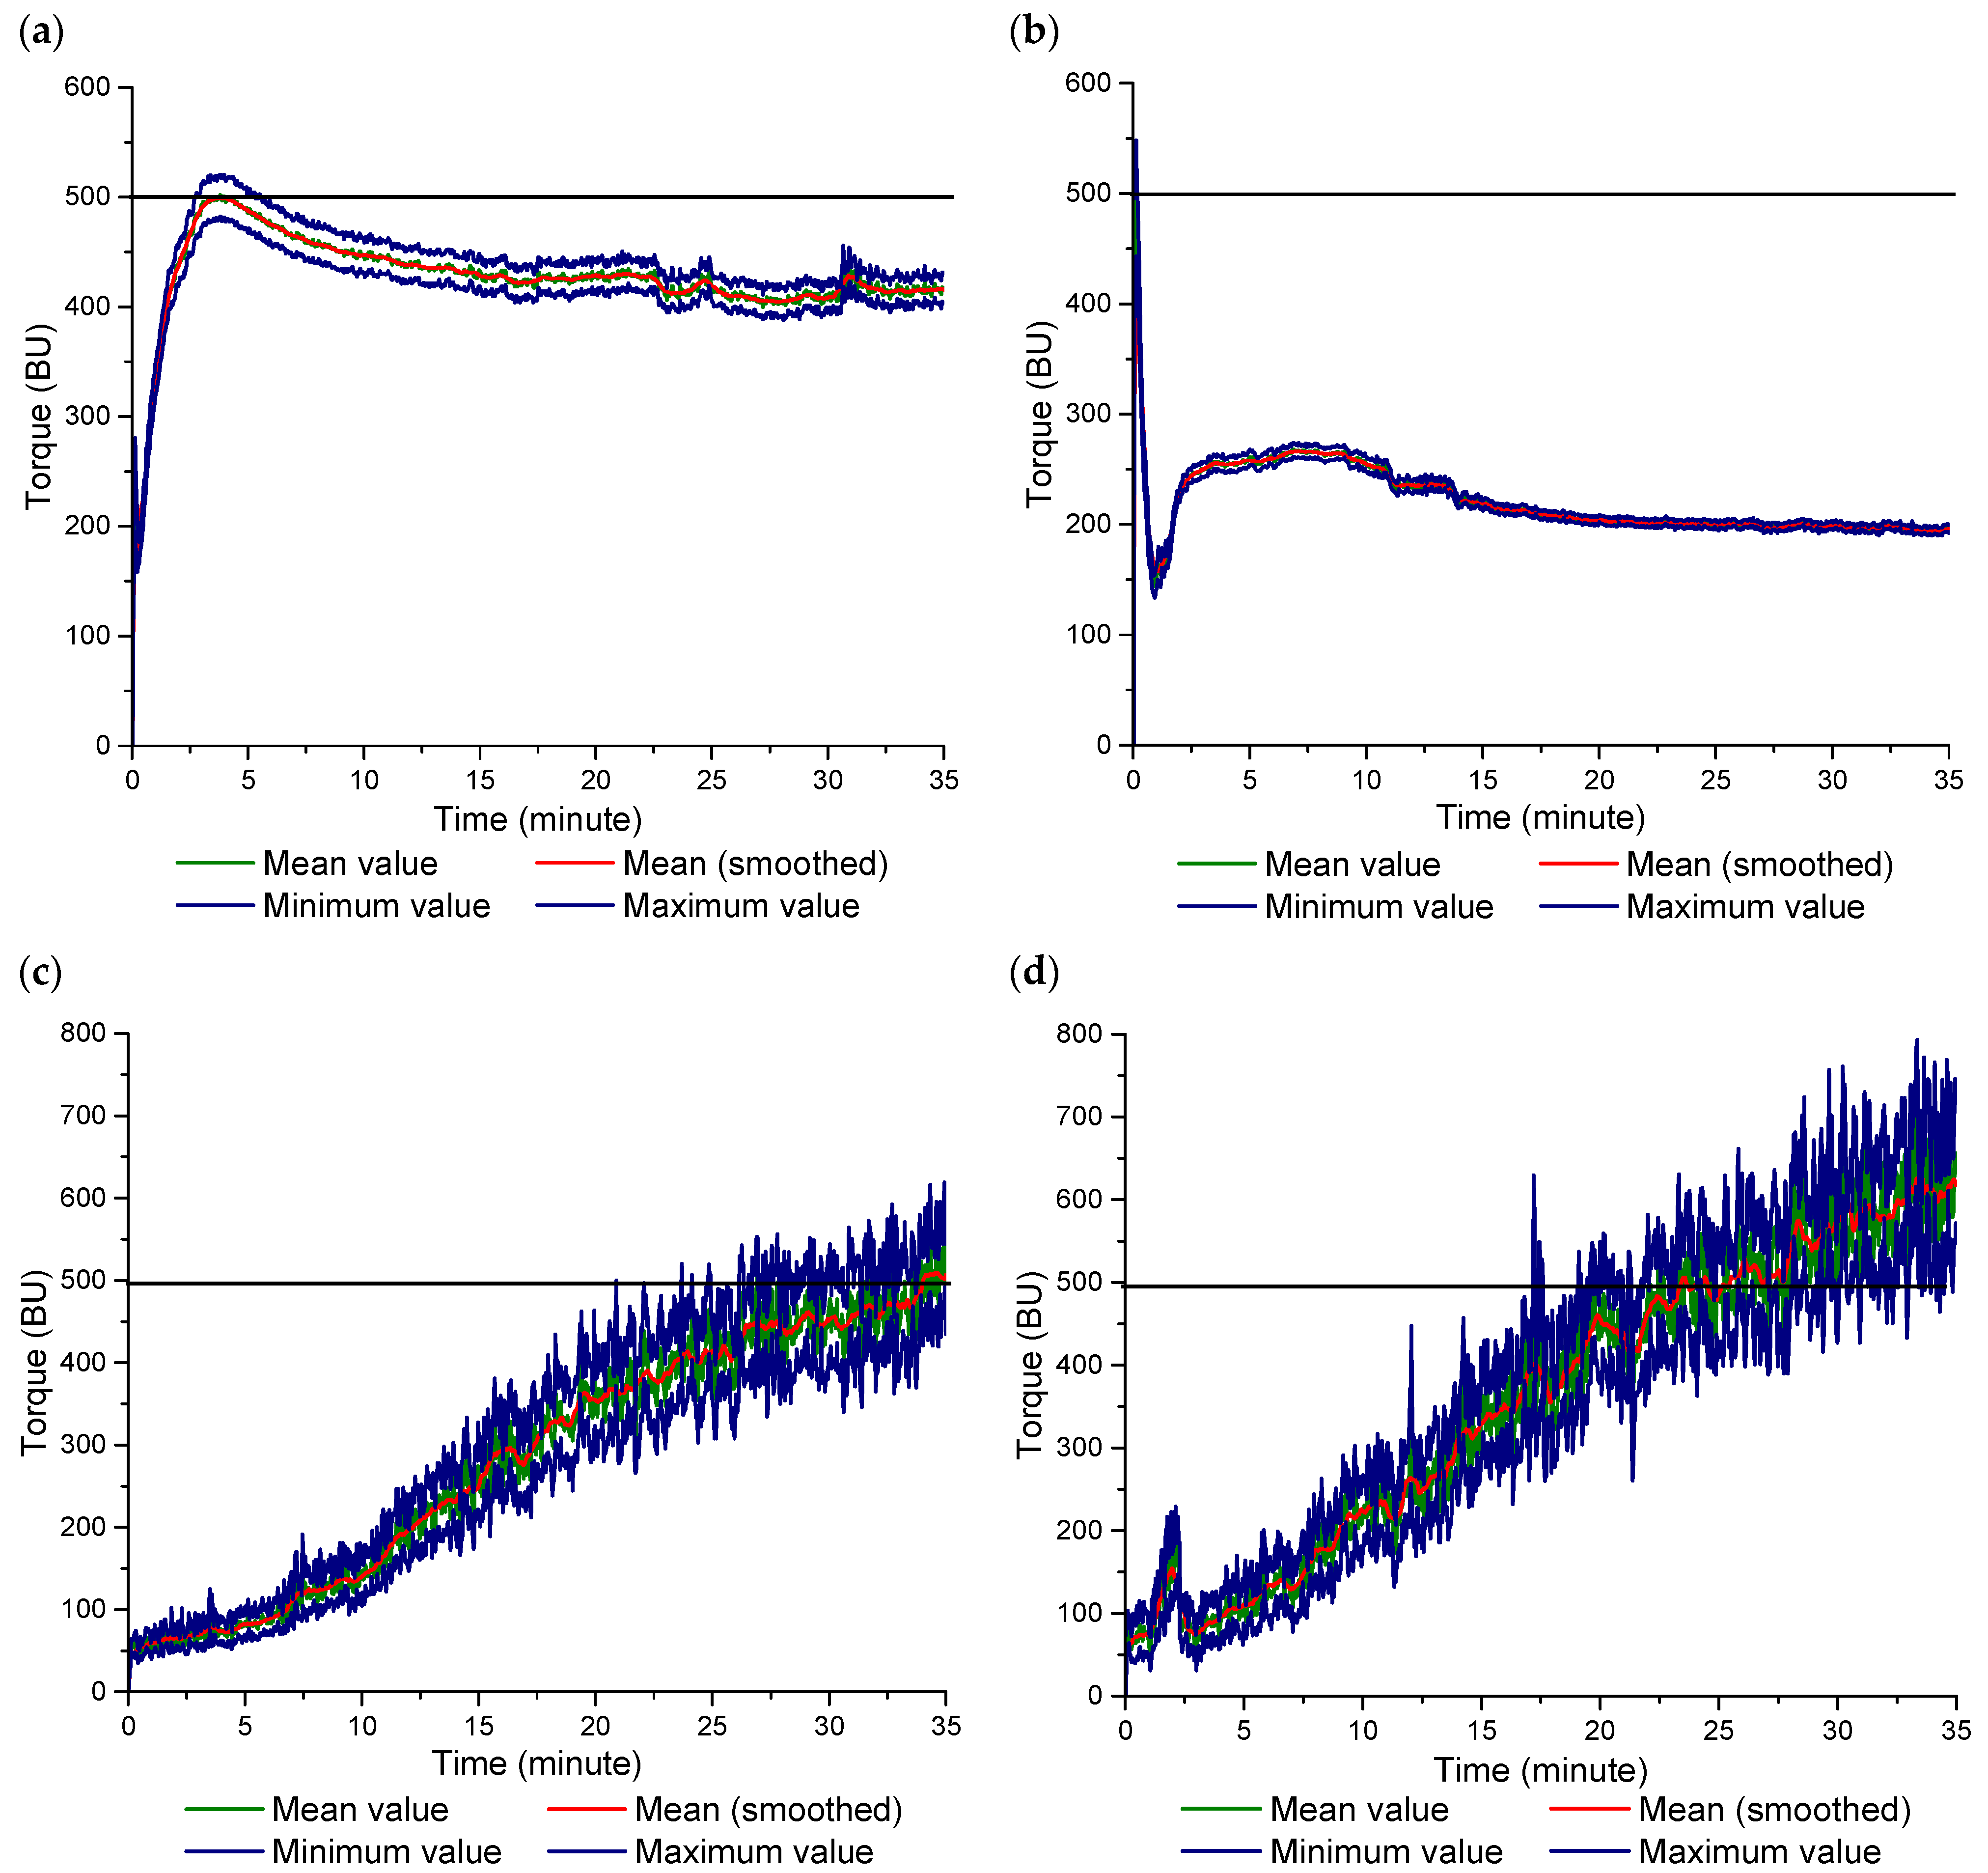
3.2. Farinograph Mixing

The Farinograms revealing the impact of endogenous lipids on mixing behaviors of gliadin and glutenin are shown in Figure 2. Gliadin showed a typical development peak observed for wheat flour doughs (Figure 2a). The development time at which the mixing curve reached the 500 BU consistency line was 3.6 ± 0.4 min for gliadin. Optimum water absorption value of a flour is determined as the midline of the torque curve reaches a maximum at 500 BU consistency for a given amount of water [24], as seen for gliadin in Figure 2a. The optimum water absorption capacity of gliadin required to reach the development peak was 68% (on gliadin weight basis with the corrected moisture content of 14%). To unravel the impact of endogenous lipids on the mixing behavior of gliadin, lipid-removed gliadin was exposed to Farinograph mixing with the same amount of added water (34 mL water for 50 g of lipid-removed gliadin adjusted on 14% moisture basis). However, under the same mixing conditions performed for gliadin, the highest consistency the lipid-removed gliadin was able to reach was 268 ± 8.4 BU (Figure 2b), suggesting a reduction in the water absorption capacity of gliadin in the absence of endogenous lipids. Bandwidth of the Farinograph curve at maximum consistency was reported to be indicative of elasticity [25]. A significant decrease was found in the bandwidth of the Farinograph mixing curve for the lipid-removed gliadin (Figure 2b) when compared to that of gliadin (Figure 2a), indicating a decrease in the elastic response of gliadin when endogenous lipids were absent. This was because the amount of water for the mixing of lipid-removed gliadin was above its water absorption capacity.
Glutenin (Figure 2c) showed a completely different mixing behavior in comparison with gliadin (Figure 2a). Instead of showing a peak maximum like gliadin, glutenin showed a gradual development throughout the Farinograph mixing and reached the 500 BU consistency after 34 ± 0.3 min of mixing, as previously reported by Yazar et al. [13].
The amount of water given to obtain this mixing profile for glutenin (Figure 2c) was 100.6% (50.3 mL water for 50 g of glutenin adjusted on 14% moisture basis). This added water content was determined based on the stabilization of the mixing curve at 500 BU consistency as mixing continued beyond 35 min. With the same quantity of total water for the mixing of lipid-removed glutenin, the 500 BU consistency line was reached after 23.2 ± 1.4 min. The consistency increased gradually throughout the Farinograph mixing and reached an average value of 617 ± 24.04 BU at the end of mixing (Figure 2d). These findings showed that the water absorption capacity of glutenin increased, and hydration occurred more rapidly in the absence of endogenous lipids.
The findings of Yazar et al. [4] and Papantoniou et al. [26] demonstrated that gluten had a greater affinity for water when lacking endogenous lipids, suggesting that the endogenous lipids played a role in stabilizing the consistency of gluten under large mixing deformations. The results of this study found that removal of endogenous lipids decreased the affinity of gliadins to water (Figure 2a,b), while increasing the affinity of glutenins to water (Figure 2c,d) during mixing. Non-polar gluten lipids have been suggested to exist in lipid pockets encased within the gluten network, while polar lipids are considered to interact directly with the gluten proteins [3]. Glutenin proteins were determined to interact with galactolipids via hydrophobic and hydrogen bonding, whereas gliadin was observed to interact with phospholipids [2,3]. Phospholipids consist of a phosphate polar head-group and a hydrophobic fatty acid tail, making them amphiphilic in nature [27]. Gluten proteins are known to have hydrophilic and hydrophobic sequence segments [20]. Gliadin proteins, primarily interacting with phospholipids, contribute significantly to an essential external hydrophobic trait [28]. Thus, the Farinograms in this study show that the interplay between gliadin proteins and lipids during mixing improved the water absorption of gliadins (Figure 2a,b). When the endogenous lipids were removed, without the amphiphilic character of phospholipids, the ability of gliadin proteins to interact with water greatly diminished. Similar to phospholipids, galactolipids are also known as naturally occurring surfactants [2]. However, the impact of interactions with lipids on hydration properties of glutenins was the opposite of what had been observed for gliadins. The reason behind this difference can be attributed to the secondary structures of gliadin and glutenin upon hydration. Previous studies have determined through the Fourier transform infrared spectroscopy (FTIR) that hydrated glutenin subunits primarily interact through stacked β-sheets [29]. In contrast, fully hydrated ω-gliadin exhibits a mix of β-turns and extended chains, with a minor presence of intermolecular β-sheets [30,31]. On the other hand, hydrated γ-gliadin displays a richness in α-helices [30]. Georget and Belton [29] observed that gluten, which contains a greater quantity of glutenin relative to gliadin and is in a hydrated state, shows a notable elevation in intermolecular β-sheet structures over α-helices. The modifications in gluten’s secondary structure have been largely associated with high-molecular-weight (HMW) glutenin components [32,33]. It was discovered via FTIR spectroscopic analysis that the hydration of HMW glutenin leads to an increase in β-sheet formations [34,35,36]. This implies that the elevated levels of β-sheet structures observed within wheat glutenin upon hydration are mainly due to the interactions between HMW glutenin subunits [13]. Furthermore, FTIR spectral analysis revealed an augmentation in β-sheet and extended structures with increased hydration of HMW glutenin [34], supporting the gradual improvement in the structural integrity of glutenin with the continuation of mixing up to 34 min, as illustrated in Figure 2c. Continued hydration of high molecular weight glutenin revealed that hydrogen bonding facilitated by glutamine side chains contributed to stability [34]. However, the removal of endogenous lipids disrupted the balance between the formation of β-sheet and hydrogen bonds during the mixing of glutenin, which was evident from the uncontrolled increase in consistency (Figure 2d). Ultimately, the Farinograms in this study showed that endogenous lipids improved the water absorption capacity of gliadin, while stabilizing the affinity of glutenin to water during mixing.

3.3. SAOS, MAOS, and LAOS Properties of Gluten Fractions with and without Endogenous Lipids

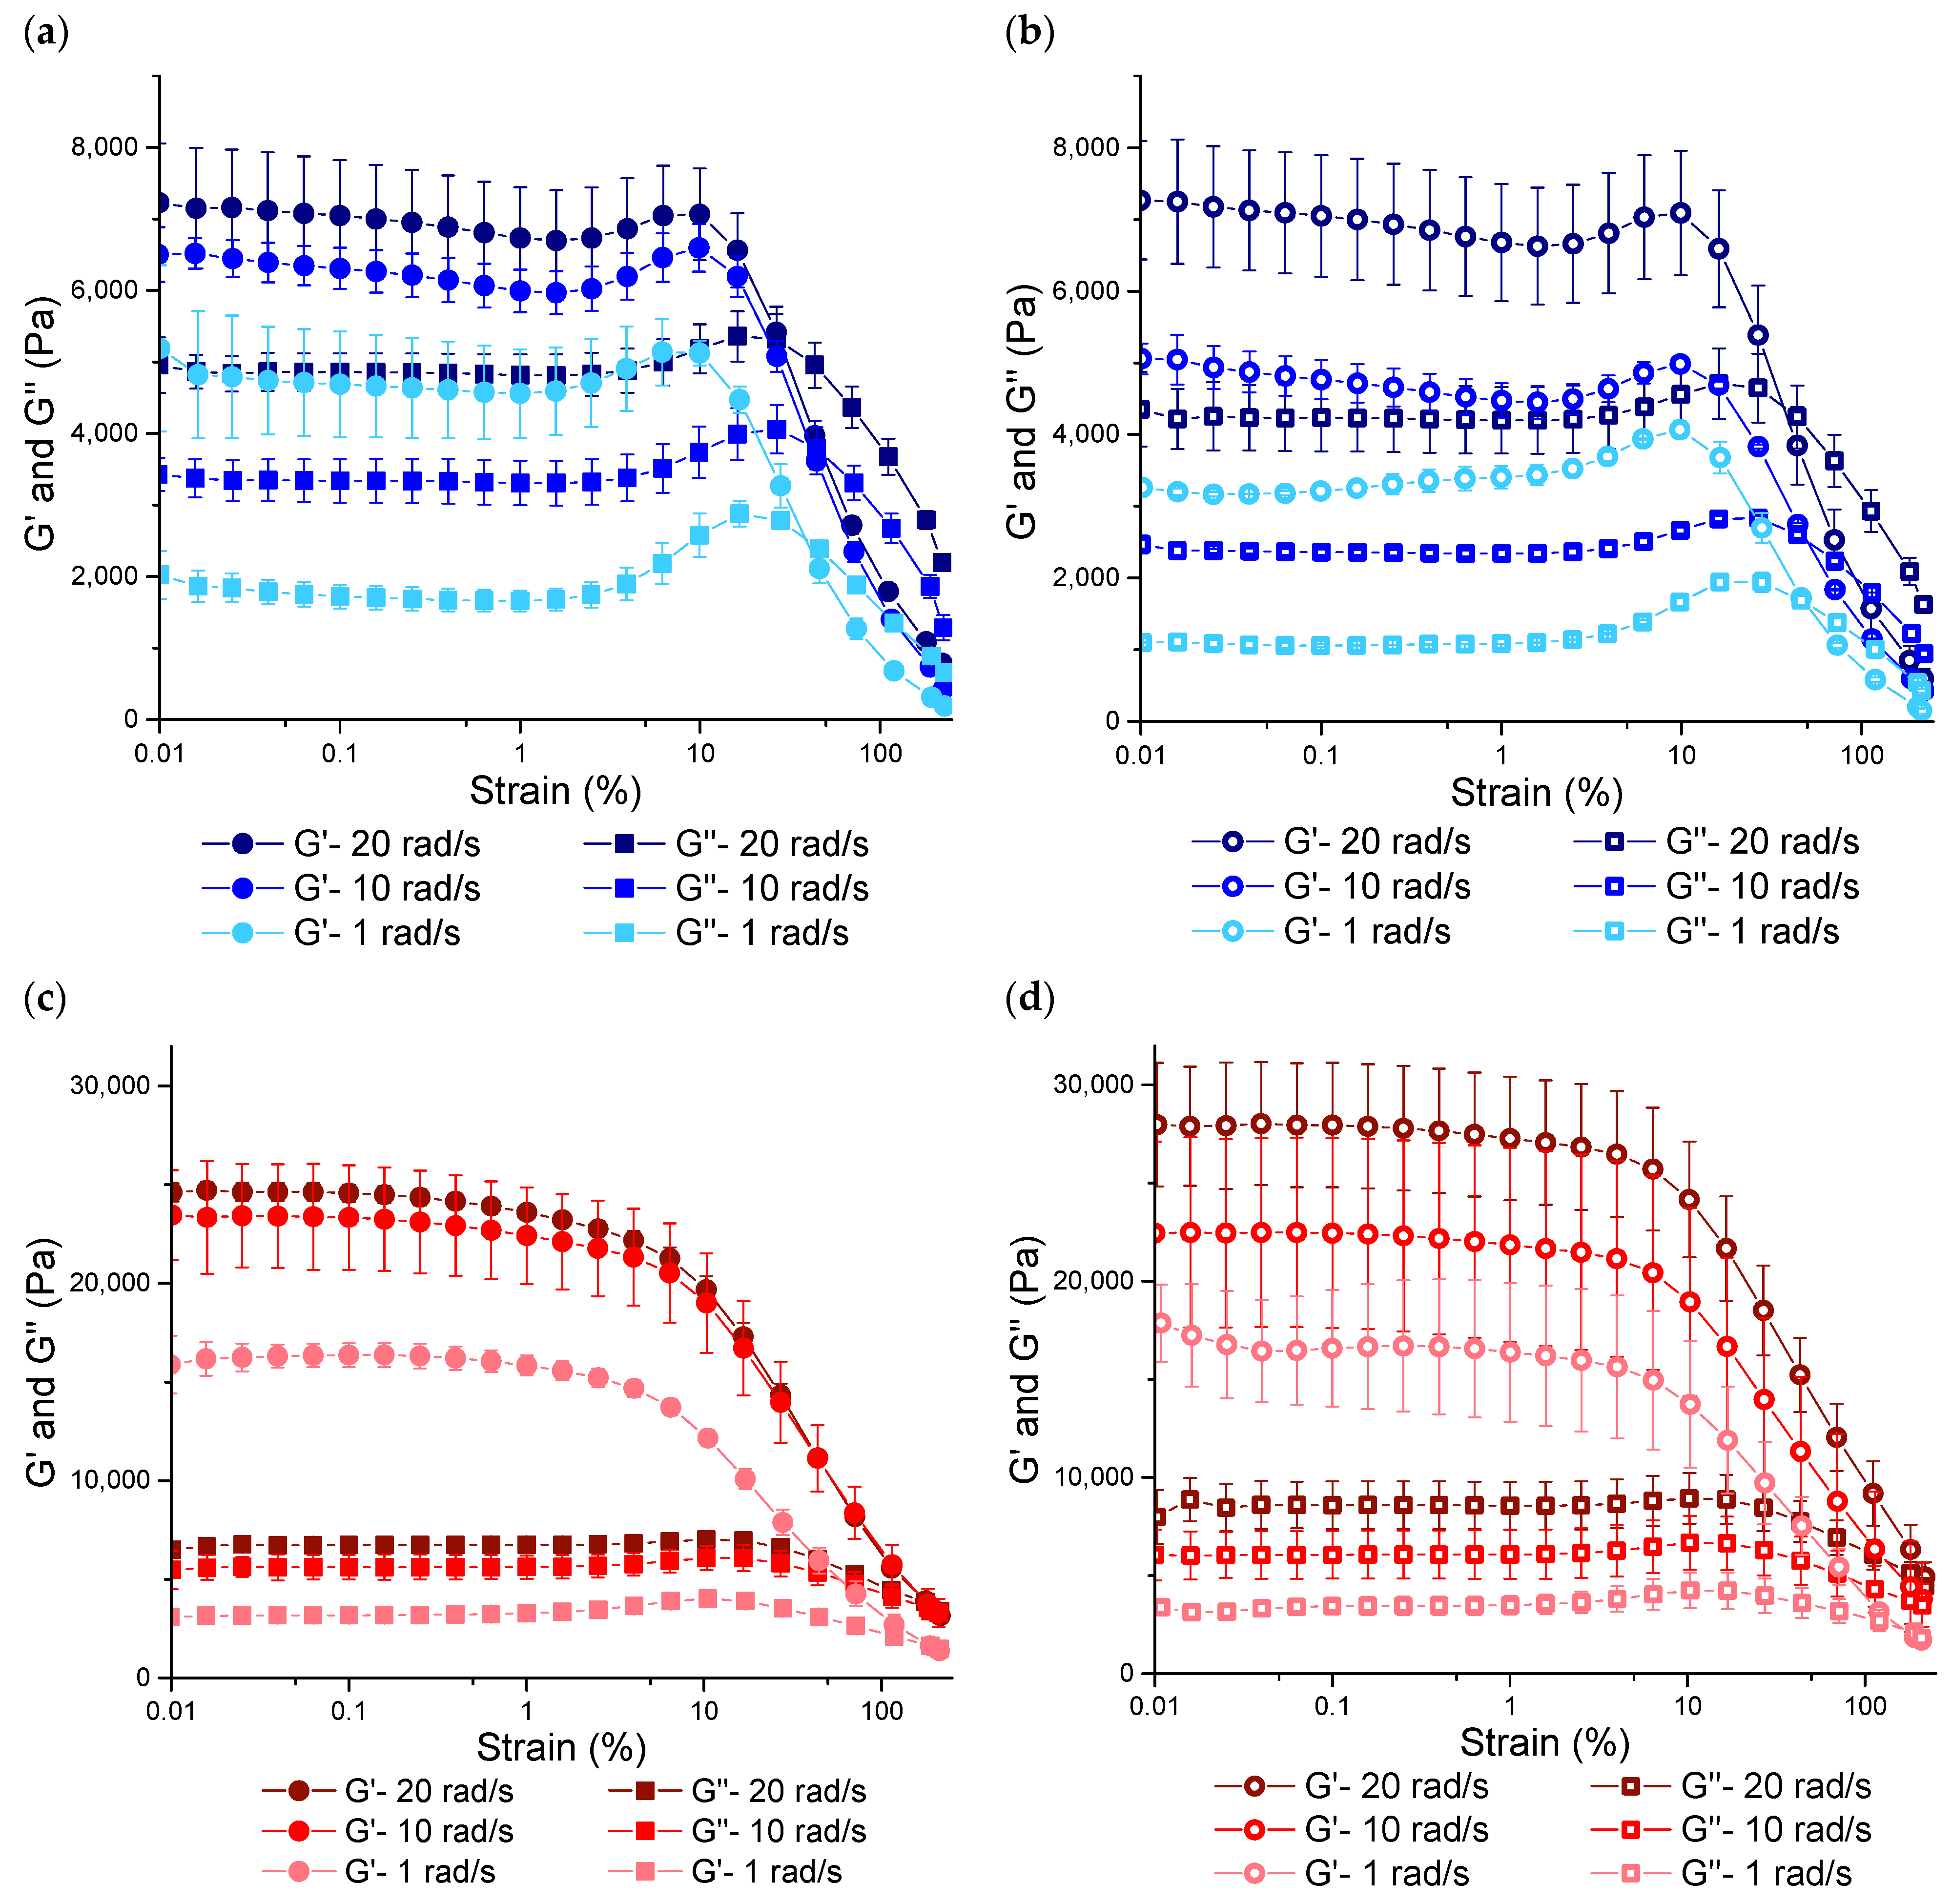
3.3.1. Rheological Properties under SAOS Deformations

Strain sweep data suggested a shift from linear viscoelasticity to nonlinear viscoelasticity in glutenin at 4%, 4%, and 6% strain amplitudes for the corresponding frequencies of 1 rad/s, 10 rad/s, and 20 rad/s, as demonstrated in Figure 3c. Similarly, this behavior was observed at 2.5%, 4%, and 4% strain amplitudes for glutenin devoid of lipids at the same frequencies, which is illustrated in Figure 3d.
The shift in the critical strain for glutenin from 4–6% to 2.5–4% when endogenous lipids were removed suggested a slight decrease in the resistance of glutenin to increasing deformations in the absence of lipids. Other studies reported 2.5% [5] and 4% [13] as critical strains for glutenin. These critical strains were determined based on the deviation of G′ being higher than 3% of its previous value [37]. Such characterization was not possible for gliadin and lipid-removed gliadin as they both showed overshoots at the onset of non-linearity. Thus, G′ at the onset of overshoot was regarded as the critical strain for gliadins. According to this evaluation, the onset of non-linearity was 1.5% for both gliadin (Figure 3a) and lipid-removed gliadin (Figure 3b) at all frequencies. This revealed that the strain range, where gliadin showed linear viscoelastic properties, was not affected by the removal of endogenous lipids. An overshoot was also found to occur for gliadin at γ0 ≥ 2.5%, concurring with the upper limit determined for the linear viscoelastic region of gliadin in this study.
Considering these critical strains, SAOS properties were evaluated at strain amplitudes of 0.1% and 0.25%, which were within the linear viscoelastic region for both gluten fractions and their lipid-removed counterparts. In the linear region (γ0 = 0.1%), G′ values for gliadin were 4.6 × 10³ ± 741 Pa, 6.3 × 10³ ± 288 Pa, and 7.0 × 10³ ± 776 Pa at 1 rad/s, 10 rad/s, and 20 rad/s frequencies, respectively (Figure 3a). Again, at 0.1% strain, lipid-removed gliadin had G′ values of 3.2 × 10³ ± 71 Pa, 4.7 × 10³ ± 272 Pa, and 7.0 × 10³ ± 847 Pa at frequencies of 1 rad/s, 10 rad/s, and 20 rad/s frequencies, respectively (Figure 3b). The findings from the G′ data revealed that lipid removal resulted in a significant reduction (p < 0.05) in gliadin’s elastic behavior at lower frequencies (specifically at 10 rad/s and 1 rad/s). However, this effect was not observed (p > 0.05) at a higher frequency of 20 rad/s. On the other hand, G″ values of gliadin showed a decrease at all frequencies as endogenous lipids were removed. However, analyzing the loss tangent (tanδ = G″/G′) in the linear region indicates that the concurrent alteration of G′ and G″ values in gliadin upon lipid removal did not lead to a notable difference (p > 0.05) in tanδ (Table 1).
The elastic response of glutenin in the linear region was much higher compared to that of gliadin as evidenced by the higher G′ values glutenin had, which has been well established in the literature [1,5,38]. At 0.1% strain, glutenin had G′ values of 1.6 × 10⁴ ± 602 Pa, 2.3 × 10⁴ ± 2645 Pa, and 2.4 × 10⁴ ± 439 Pa at 1 rad/s, 10 rad/s, and 20 rad/s frequencies, respectively (Figure 3c). At the same strain amplitude, G′ values of lipid-removed glutenin were 1.6 × 10⁴ ± 2971 Pa, 2.2 × 10⁴ ± 4834 Pa, and 2.8 × 10⁴ ± 3172 Pa at 1 rad/s, 10 rad/s, and 20 rad/s frequencies, respectively (Figure 3d). Unlike gliadin, removal of endogenous lipids caused an increase in G′ values of glutenin at the highest deformation frequency. However, this increase was not significant (p > 0.05). G″ values of glutenin also increased at high frequencies with respect to lipid removal, but this difference disappeared at 1 rad/s. Therefore, the tanδ of glutenin was not significantly affected (p > 0.05) by the absence of lipids under small deformations with low frequency (i.e., resting). However, when the frequency was high, tanδ values of glutenin increased significantly (p < 0.05) in the absence of lipids (Table 1), suggesting an increase in the viscous to elastic ratio of the glutenin viscoelastic network when endogenous lipids were removed.

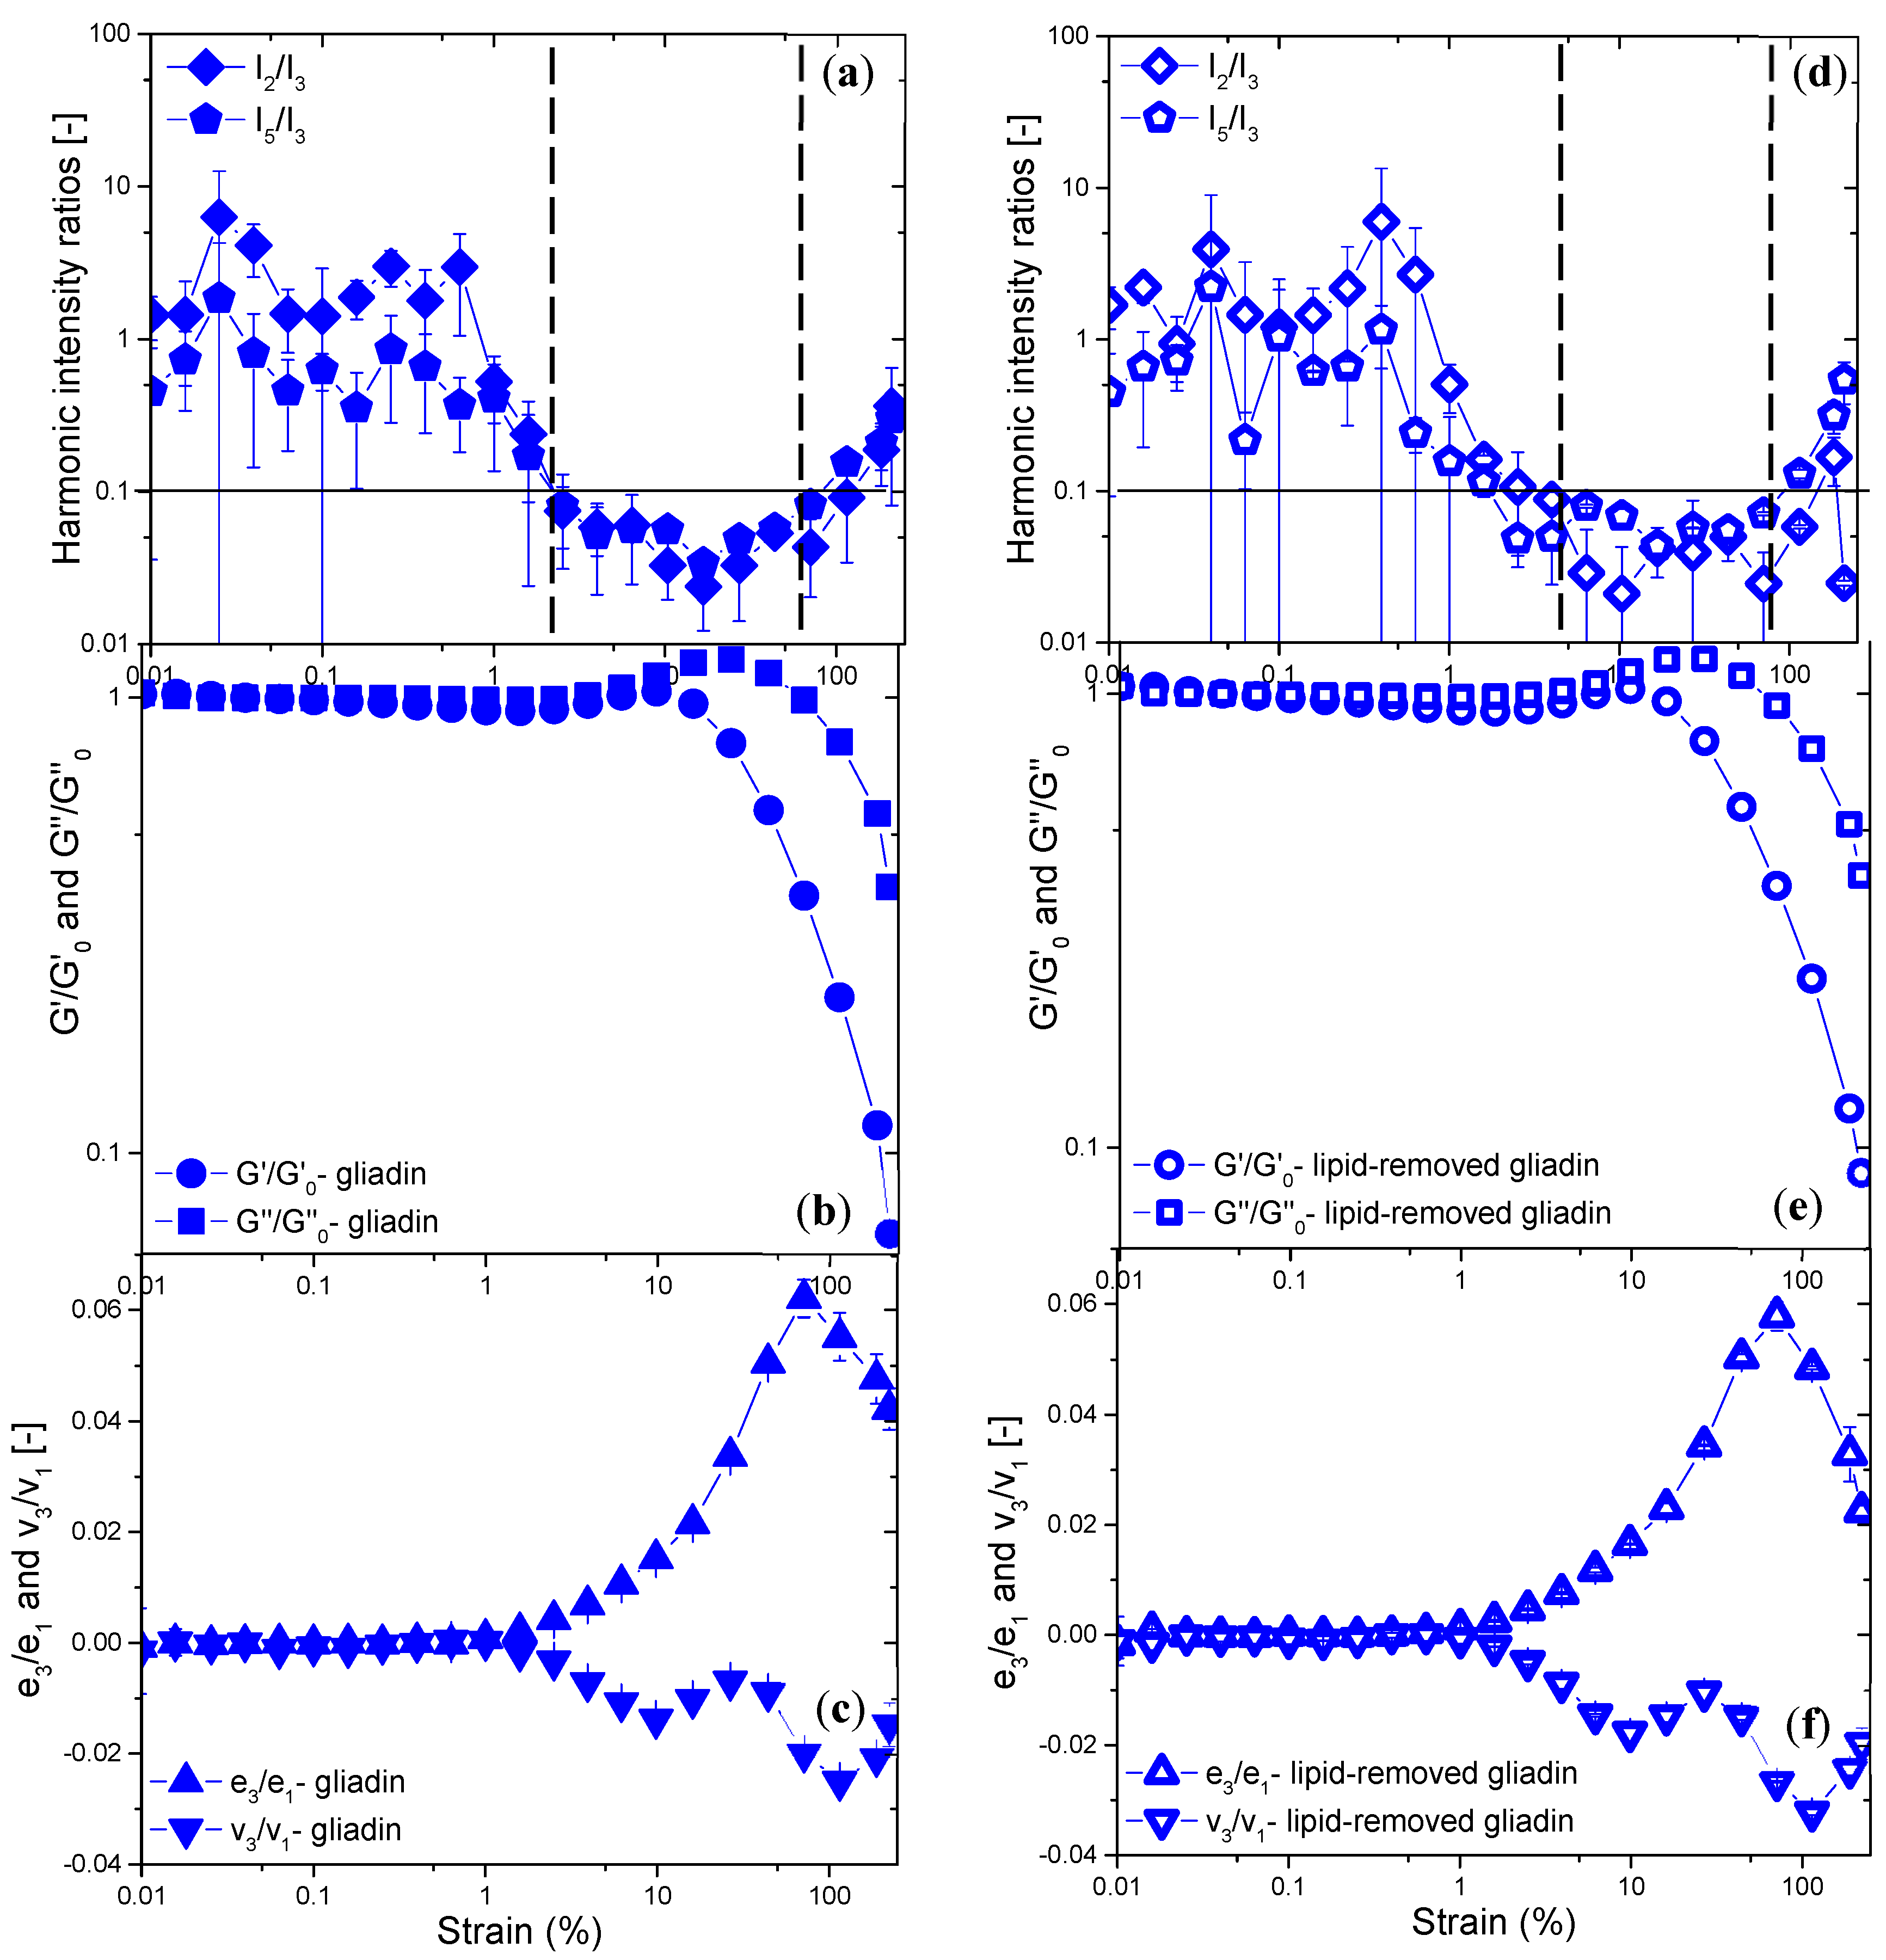
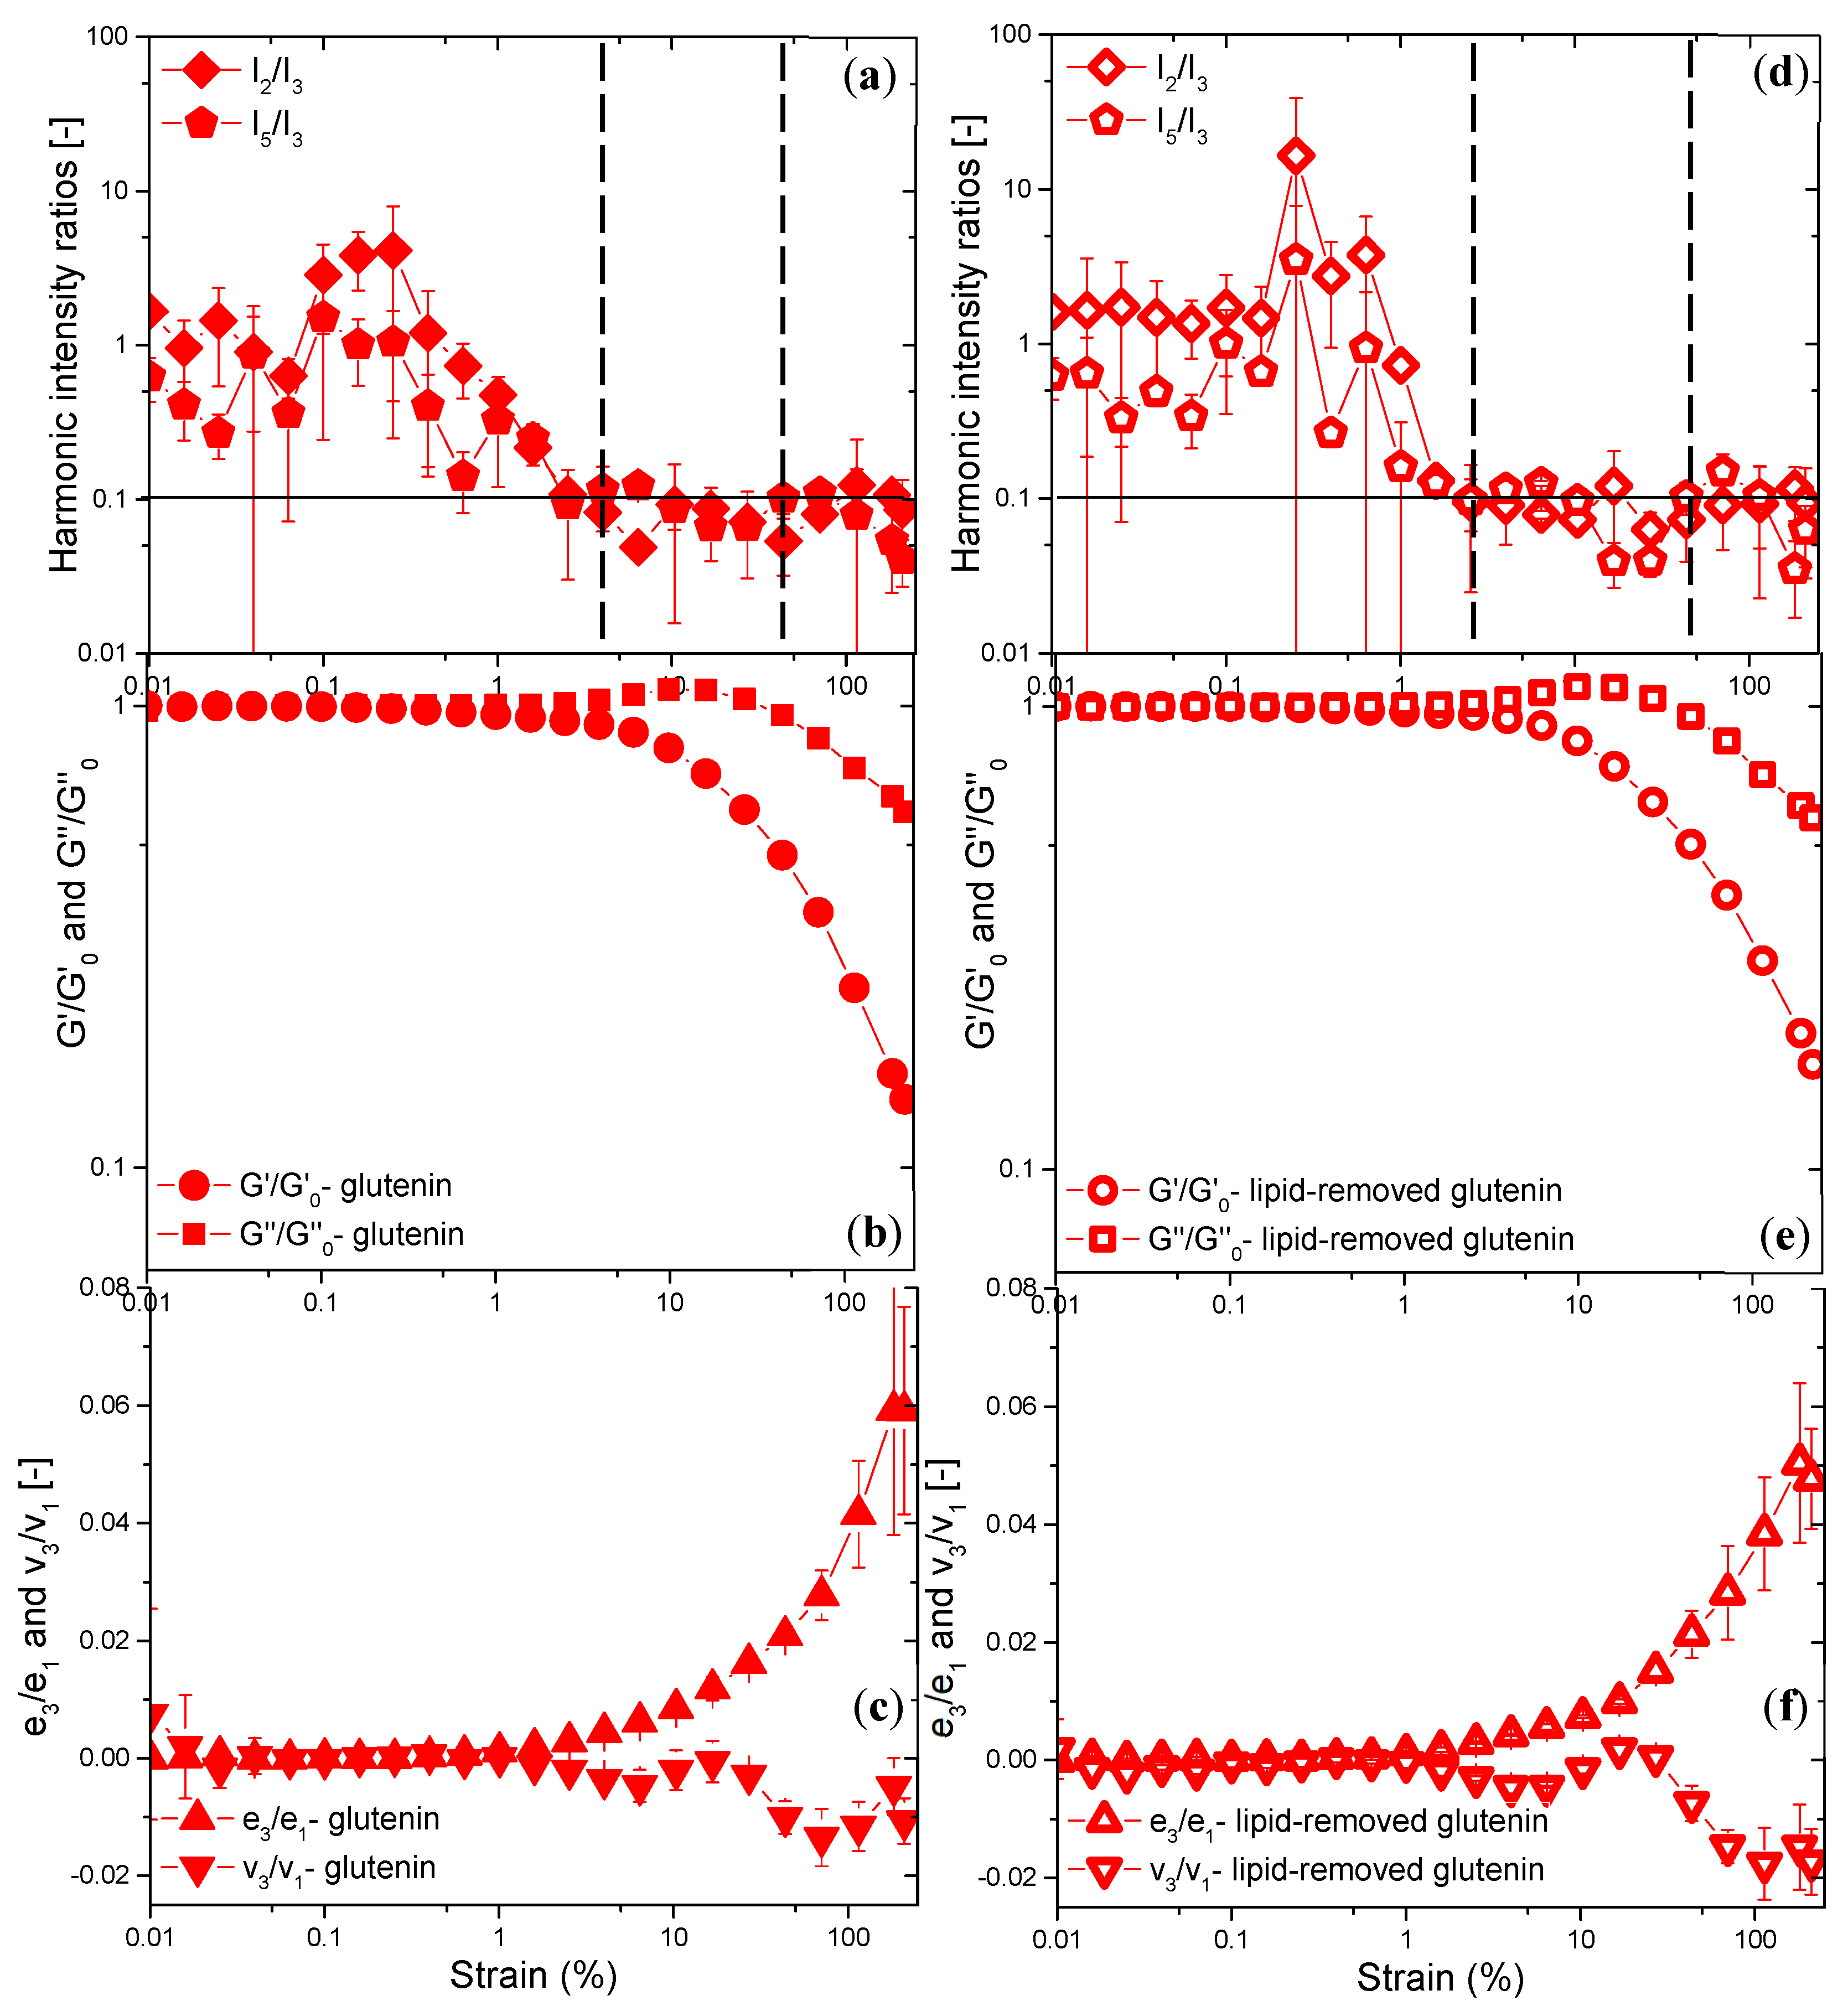
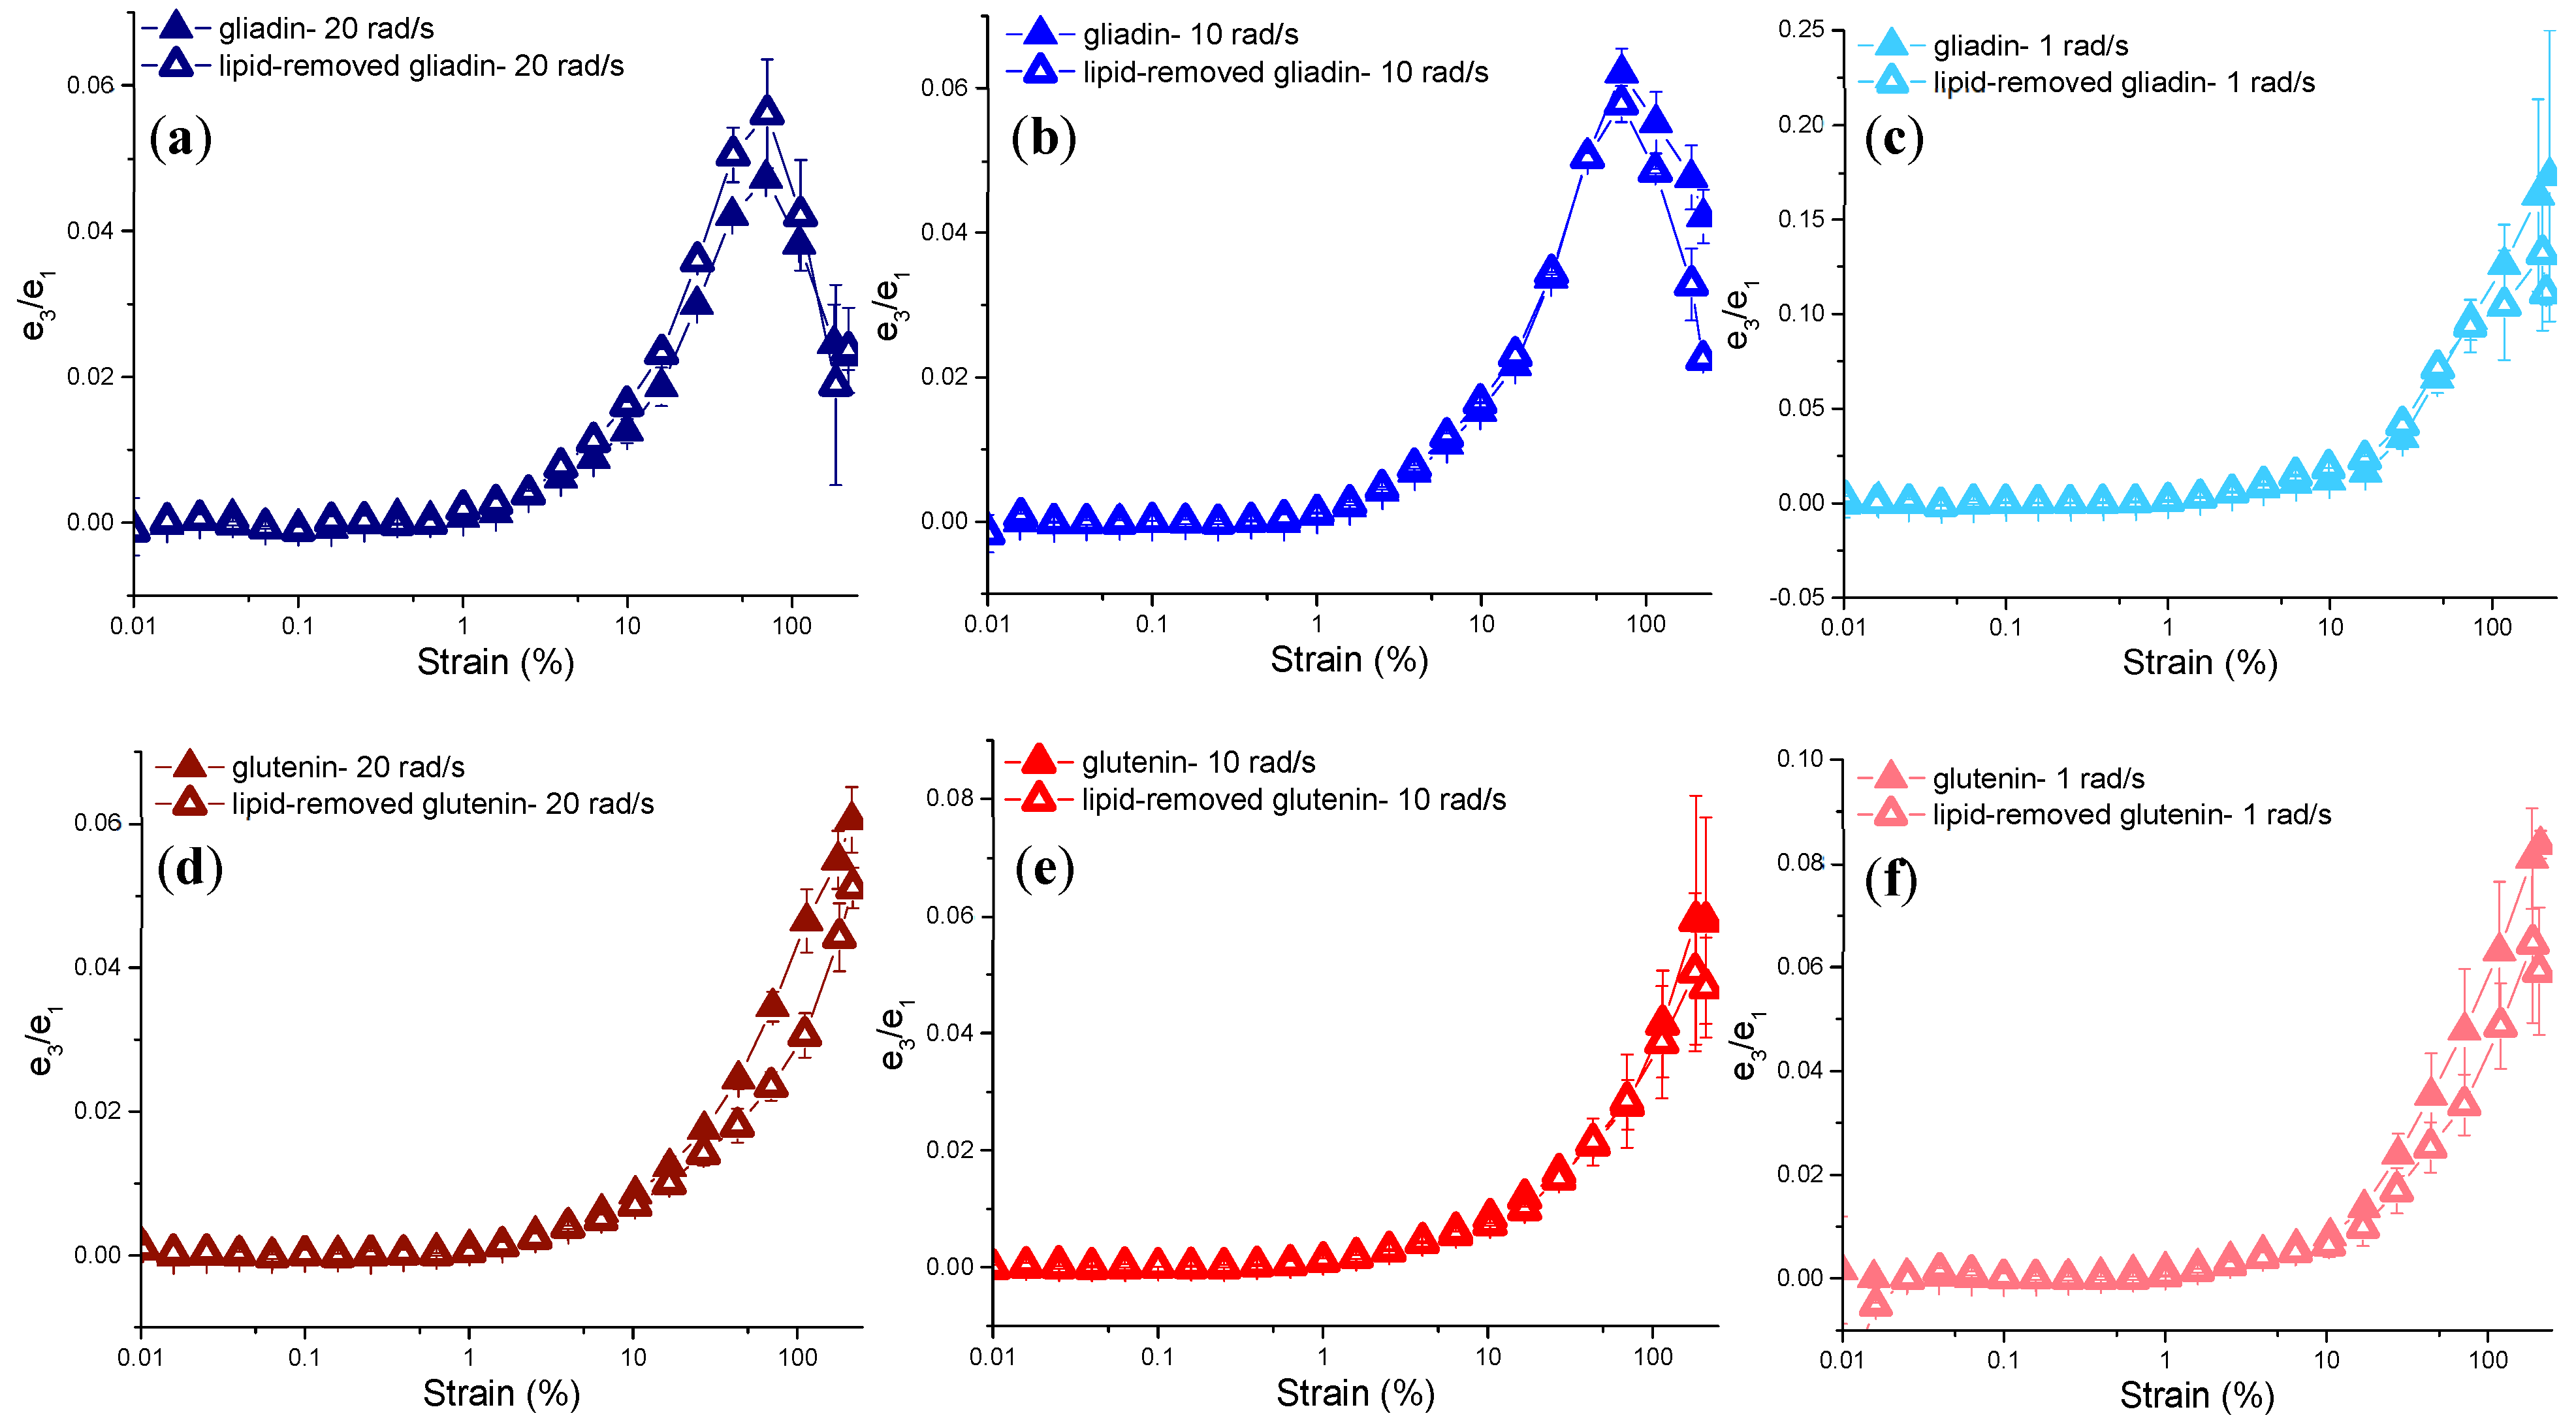
3.3.2. Rheological Properties under MAOS Deformations

The initial non-linearities of gluten fractions with and without lipids were evaluated in the MAOS region, which had been defined as a subdivision of the LAOS region and transition region between the SAOS and the LAOS regions [39]. To assess the properties within the (MAOS) region, the borders of this MAOS region were established by examining the ratio of harmonic intensities. Within the linear viscoelastic region, a material’s stress response is predominantly depicted by the first harmonic identified via Fourier analysis. However, as the strain’s magnitude increases and the material transitions into the non-linear viscoelastic region, there is a noticeable deviation from the ideal sinusoidal pattern, resulting in the emergence of higher odd-numbered harmonics in the Fourier transform spectrum, coexisting with the first harmonic [40]. Within the confines of the MAOS region, the third harmonic’s intensity stands as the only higher harmonic contributor, and thus, it serves as a critical indicator for recognizing the initial stages of non-linear behavior and demarcating the MAOS boundaries [39].
When the strain amplitude is increased, there is a noticeable rise in the third harmonic intensity relative to the first (I3/I1). Once I3/I1 surpasses the threshold of 0.001 at the boundary of the SAOS domain, it signifies a departure of more than 0.1% from the expected linear viscoelastic behavior [41]. Consequently, the pivotal strain that marks the shift from the SAOS to the MAOS realm can be pinpointed when the I3/I1 ratio exceeds 0.001 [40,42]. Considering this evaluation, at 10 rad/s frequency, the critical strain for gliadin and lipid-removed gliadin was determined as 1.5% and 1%, respectively. However, the critical strain determined for gliadin and lipid-removed gliadin through G′ and G″ was 1.5% (Figure 3a,b). Erturk et al. [40] proposed that assessing harmonic intensities could yield a precise identification of the critical strain amplitude, which demarcates the shift from the Small to the Medium Amplitude Oscillatory Shear (SAOS to MAOS) regions. The shorter SAOS region found for lipid-removed gliadin in comparison to gliadin could be attributed to the loss of extensibility in gliadin in the absence of lipids. On the other hand, I3/I1 for glutenin and lipid-removed glutenin started to increase above 0.001 at the strain amplitude of 1%, indicating a lower critical strain value compared to that (γcri: 4%) determined through G′ and G″ at 10 rad/s (Figure 3c,d). The consistent SAOS region determined for glutenin both in the presence and absence of lipids underlined the resilience of glutenin.
Harmonic intensity ratios (i.e., I2/I3 and I5/I3 < 0.1) have been hypothesized to indicate if the MAOS data is too noisy or too non-linear (Sing et al., 2018). The “0.1” value was suggested by Ewoldt and Bharadwaj [41] as an indication of 10% deviation from linear viscoelasticity. Harmonic intensities of gluten fractions and their lipid-removed counterparts at 10 rad/s are shown in Figure 4 and Figure 5. The low-strain boundary of the MAOS region, where I2/I3 < 0.1, was 2.5% for gliadin, while the upper-strain boundary, where I5/I3 < 0.1, was 70% (Figure 4a). When the MAOS region boundaries for lipid-removed gliadin were determined in an identical manner, the low-strain boundary was found as 4% and the upper-strain boundary was again 70% (Figure 4c). The MAOS boundaries determined for gliadin in the presence and absence of endogenous lipids indicated a slight delay in entering the MAOS region for the lipid-removed gliadin. This revealed a decrease in the viscous-like nature of gliadin, concurring with the tanδ (Table 1). However, the same upper-strain limit of the MAOS region found for both gliadin and lipid-removed gliadin showed that the removal of lipids did not affect the onset of the LAOS region for gliadin.
Ewoldt and Bharadwaj [41] describe how the first harmonic material functions, designated as e1 (ω, γ0) = G′1 (ω, γ0) for average elasticity and v1 (ω, γ0) = G″1 (ω, γ0)/ω = η′1 (ω, γ0) for average dissipation, serve as indicators for the mean elastic and dissipative properties, respectively. These first harmonic material functions were defined as the first harmonic MAOS moduli (G′31, G″31) by Song and Hyun [39]. The changes of these parameters under increasing strain amplitudes result in different types of LAOS behavior [43] and these changes detected through the first harmonic MAOS moduli have been termed intercycle (global) non-linearities [39,41]. Figure 4b,e show that the reduced moduli of gliadin and lipid-removed gliadin normalized by the moduli in the linear viscoelastic region points to an overshoot for both G′ and G″ in the MAOS region, suggesting type IV behavior. Type IV LAOS behavior, known as strong strain overshoot, has been characterized by the increase in G′ and G″ followed by a decrease [39,43]. Gliadin was found to show G′ and G″ overshoots at the onset of non-linear region previously [5], and this study showed that the removal of endogenous lipids did not change the LAOS behavior type of gliadin. In other words, gliadin with and without lipids showed the MAOS behaviors of intercycle strain-stiffening followed by softening and intercycle shear-thickening followed by thinning.
Third harmonic measures, such as the elastic [e3 (ω, γ0)] and viscous [v3 (ω, γ0)] Chebyshev coefficients, have been reported to indicate relative local changes occurring in the elastic and viscous stress within a single oscillation cycle (intracycle or local non-linearities) [41]. Third harmonic elastic Chebyshev coefficients normalized by the first harmonic coefficients (e3/e1) revealed strain-stiffening for gliadin (Figure 4c) and lipid-removed gliadin (Figure 4f) in the MAOS region at 10 rad/s, as evidenced by the positive values (e3/e1 > 0). When subjected to a 10% strain, it was observed that e3/e1 for gliadin devoid of lipids was considerably greater in comparison to that of regular gliadin, indicating enhanced strain-stiffening properties when lipids are removed (p < 0.05). At γ0 > 10% in the MAOS region, e3/e1 values of gliadin and lipid-removed gliadin were not significantly different (p > 0.05). On the other hand, third harmonic viscous Chebyshev coefficients normalized by the first harmonic coefficients (v3/v1) pointed to shear-thinning behavior (v3/v1 < 0) for both gliadin (Figure 4c) and lipid-removed gliadin (Figure 4f) in the MAOS region at 10 rad/s.
At γ0 ≤ 70% in the MAOS region, v3/v1 values for lipid-removed gliadin were significantly lower than those of gliadin (p < 0.05), indicating a higher degree of shear-thinning behavior for gliadin in the absence of lipids.
The MAOS region for glutenin was determined to range between the strain amplitudes of 4% and 45% (Figure 5a). Removal of endogenous lipids from glutenin resulted in a shift of the low-strain limit of the MAOS region to 2.5% (Figure 5d), suggesting a reduction in the resistance of the glutenin network structure in the absence of lipids. Once the critical strain was reached, the deviation from non-linearity occurred more rapidly for glutenin in the absence of lipids. The upper-strain limit of the MAOS region was also 45% for the lipid-removed glutenin.
Figure 5b,e show the reduced moduli (G′/G′0 and G″/G″0) of glutenin and lipid-removed glutenin versus strain. These first harmonic moduli point to an overshoot for G″ in the MAOS region, while G′ decreased. Such behavior was defined as type III non-linear behavior [39,43], in which intercycle strain-softening occurs along with intercycle shear-thickening followed by thinning. Glutenin was reported to show type III non-linear behavior previously [13], and this study showed that the removal of endogenous lipids did not change the LAOS behavior type of glutenin.
Even though glutenin and lipid-removed glutenin had intercycle strain-softening behavior, the third harmonic elastic Chebyshev coefficients normalized by the first harmonic coefficients (e3/e1) indicated intracycle strain-stiffening behavior for both glutenin (Figure 5c) and lipid-removed glutenin (Figure 5f) in the MAOS region at 10 rad/s, as evidenced by the positive values (e3/e1 > 0).
Removal of endogenous lipids did not cause a significant change in the intracycle strain-stiffening behavior of glutenin in the MAOS region (γ0 < 45%), as evidenced by the similar e3/e1 values (p > 0.05) obtained for glutenin and lipid-removed glutenin. On the other hand, third harmonic viscous Chebyshev coefficients normalized by the first harmonic coefficients (v3/v1) pointed to shear-thinning behavior (v3/v1 < 0) for both glutenin (Figure 5c) and lipid-removed glutenin (Figure 5f) in the MAOS region at 10 rad/s. Only at γ0 = 25% were v3/v1 values for lipid-removed glutenin positive and significantly higher than those of glutenin (p < 0.05), indicating shear-thickening behavior for glutenin in the absence of lipids.

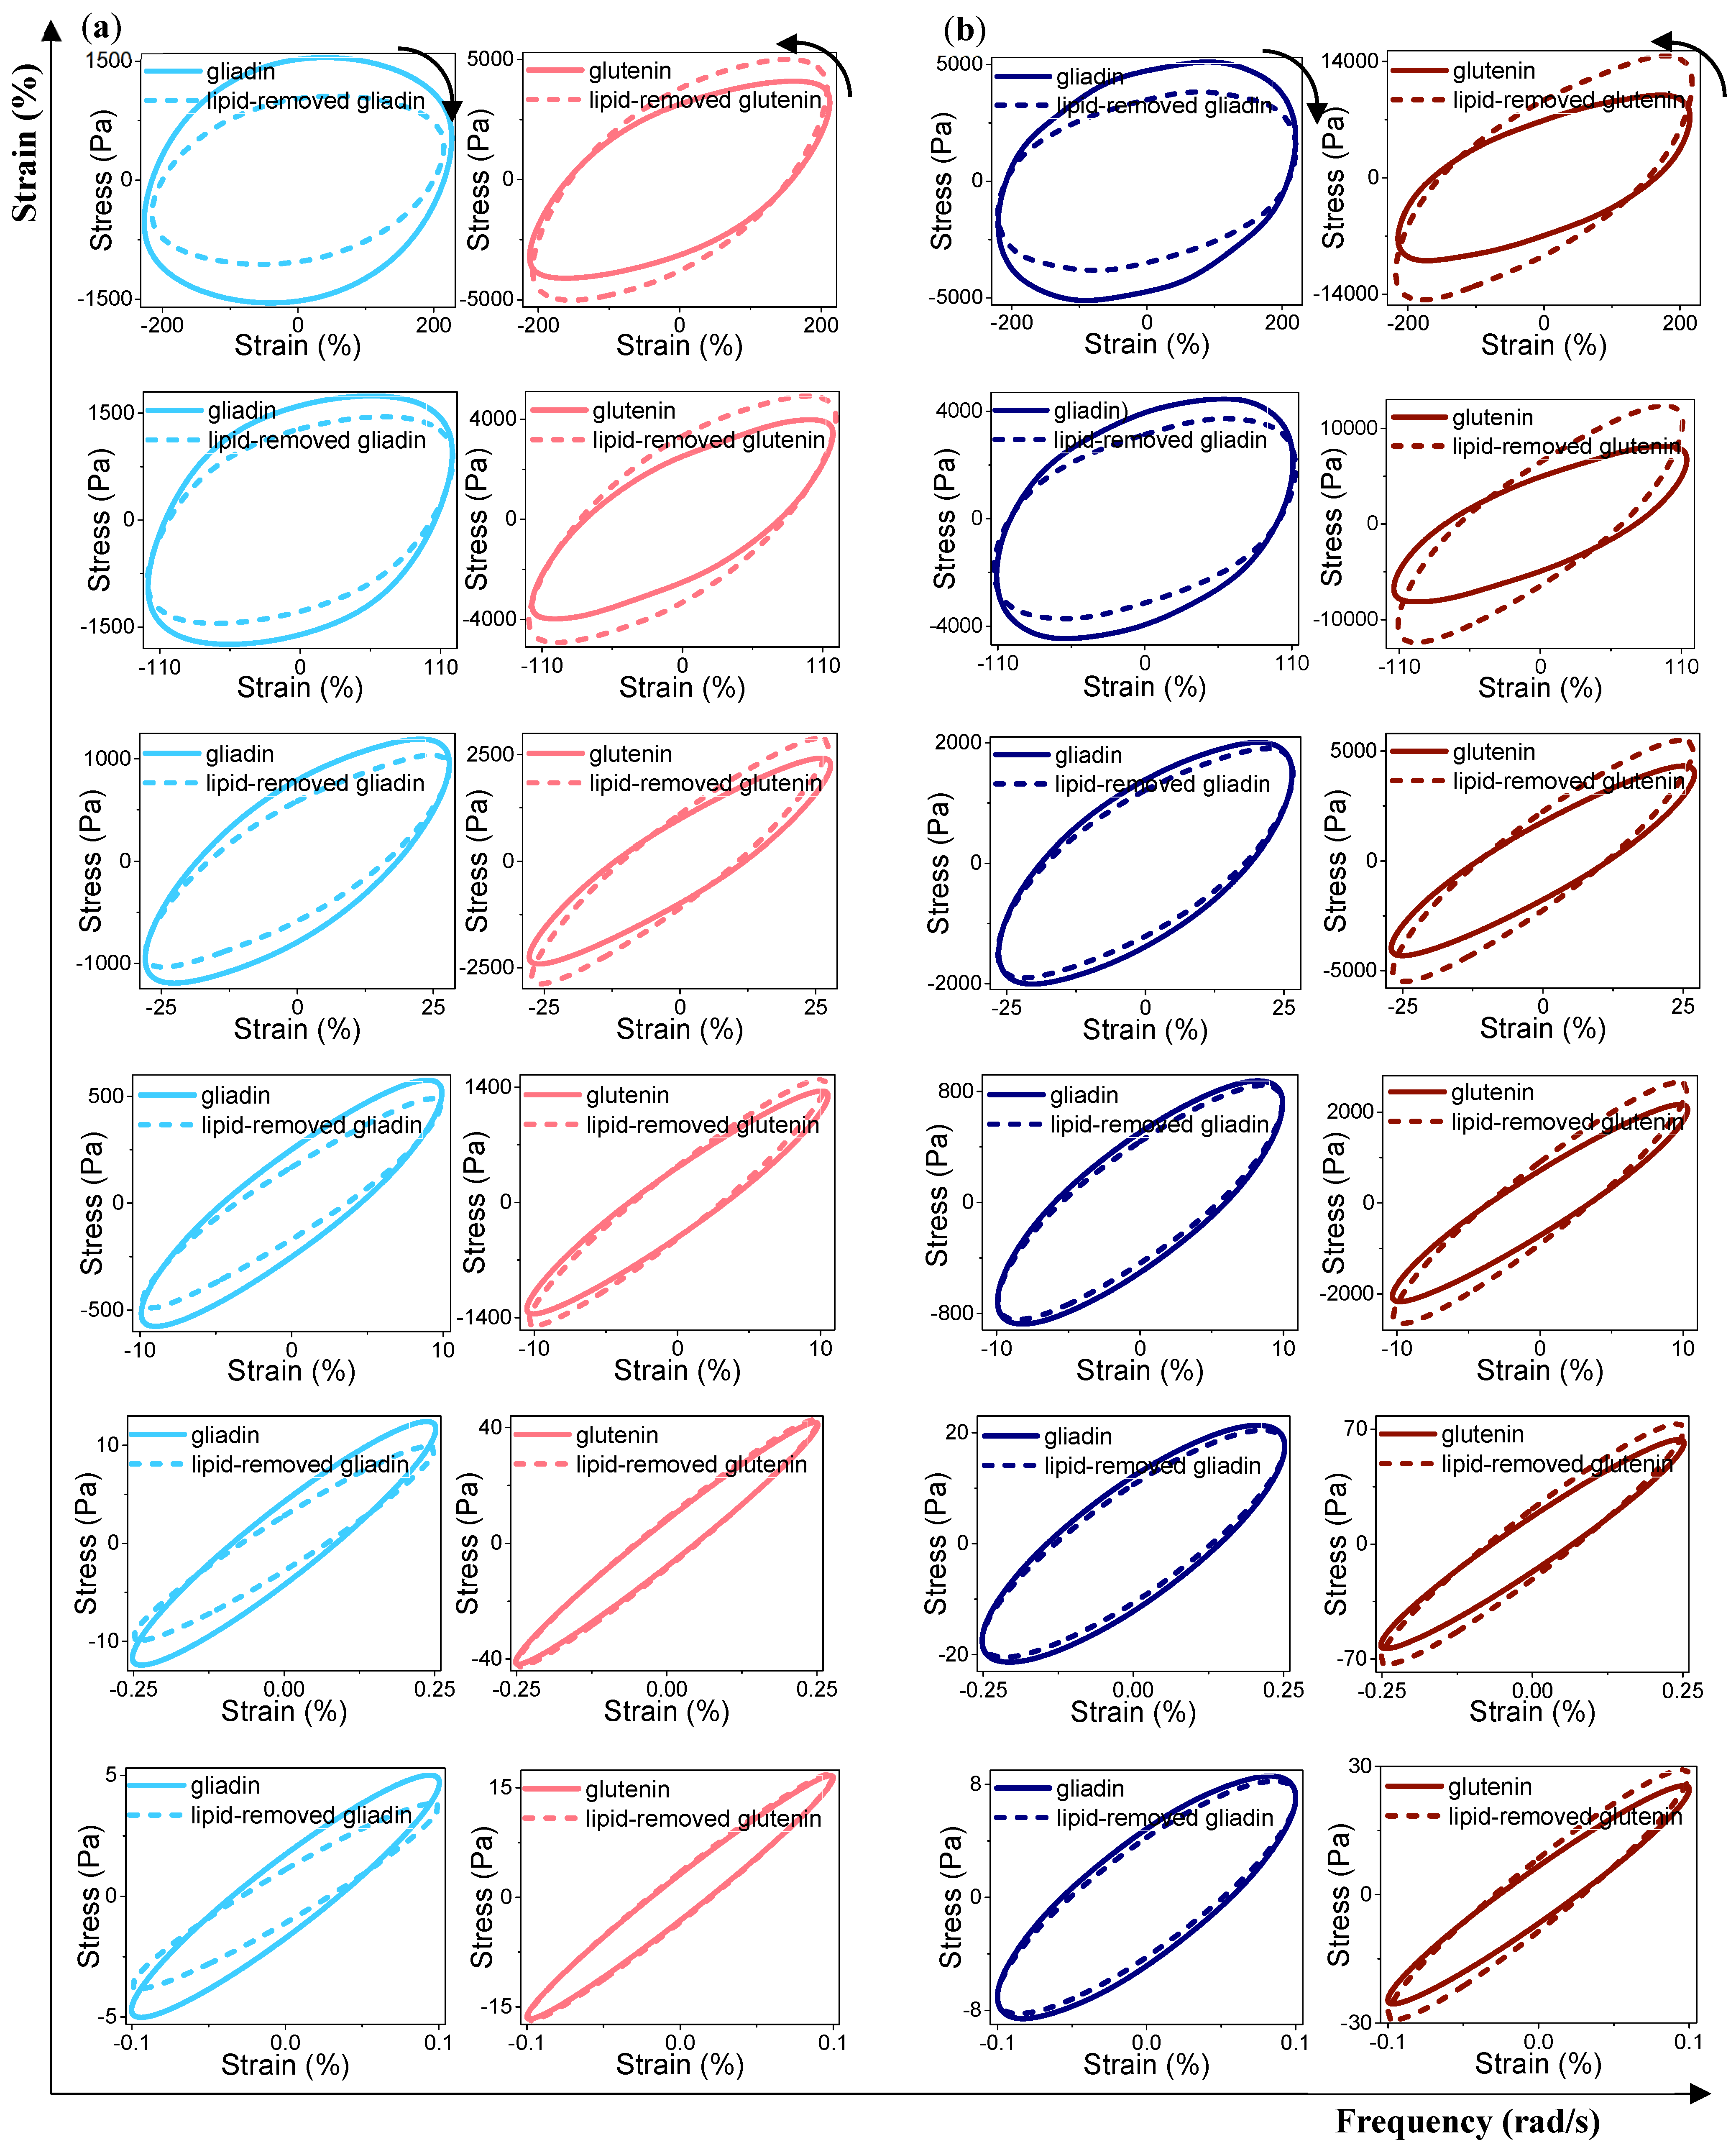
3.3.3. Rheological Properties under LAOS Deformations

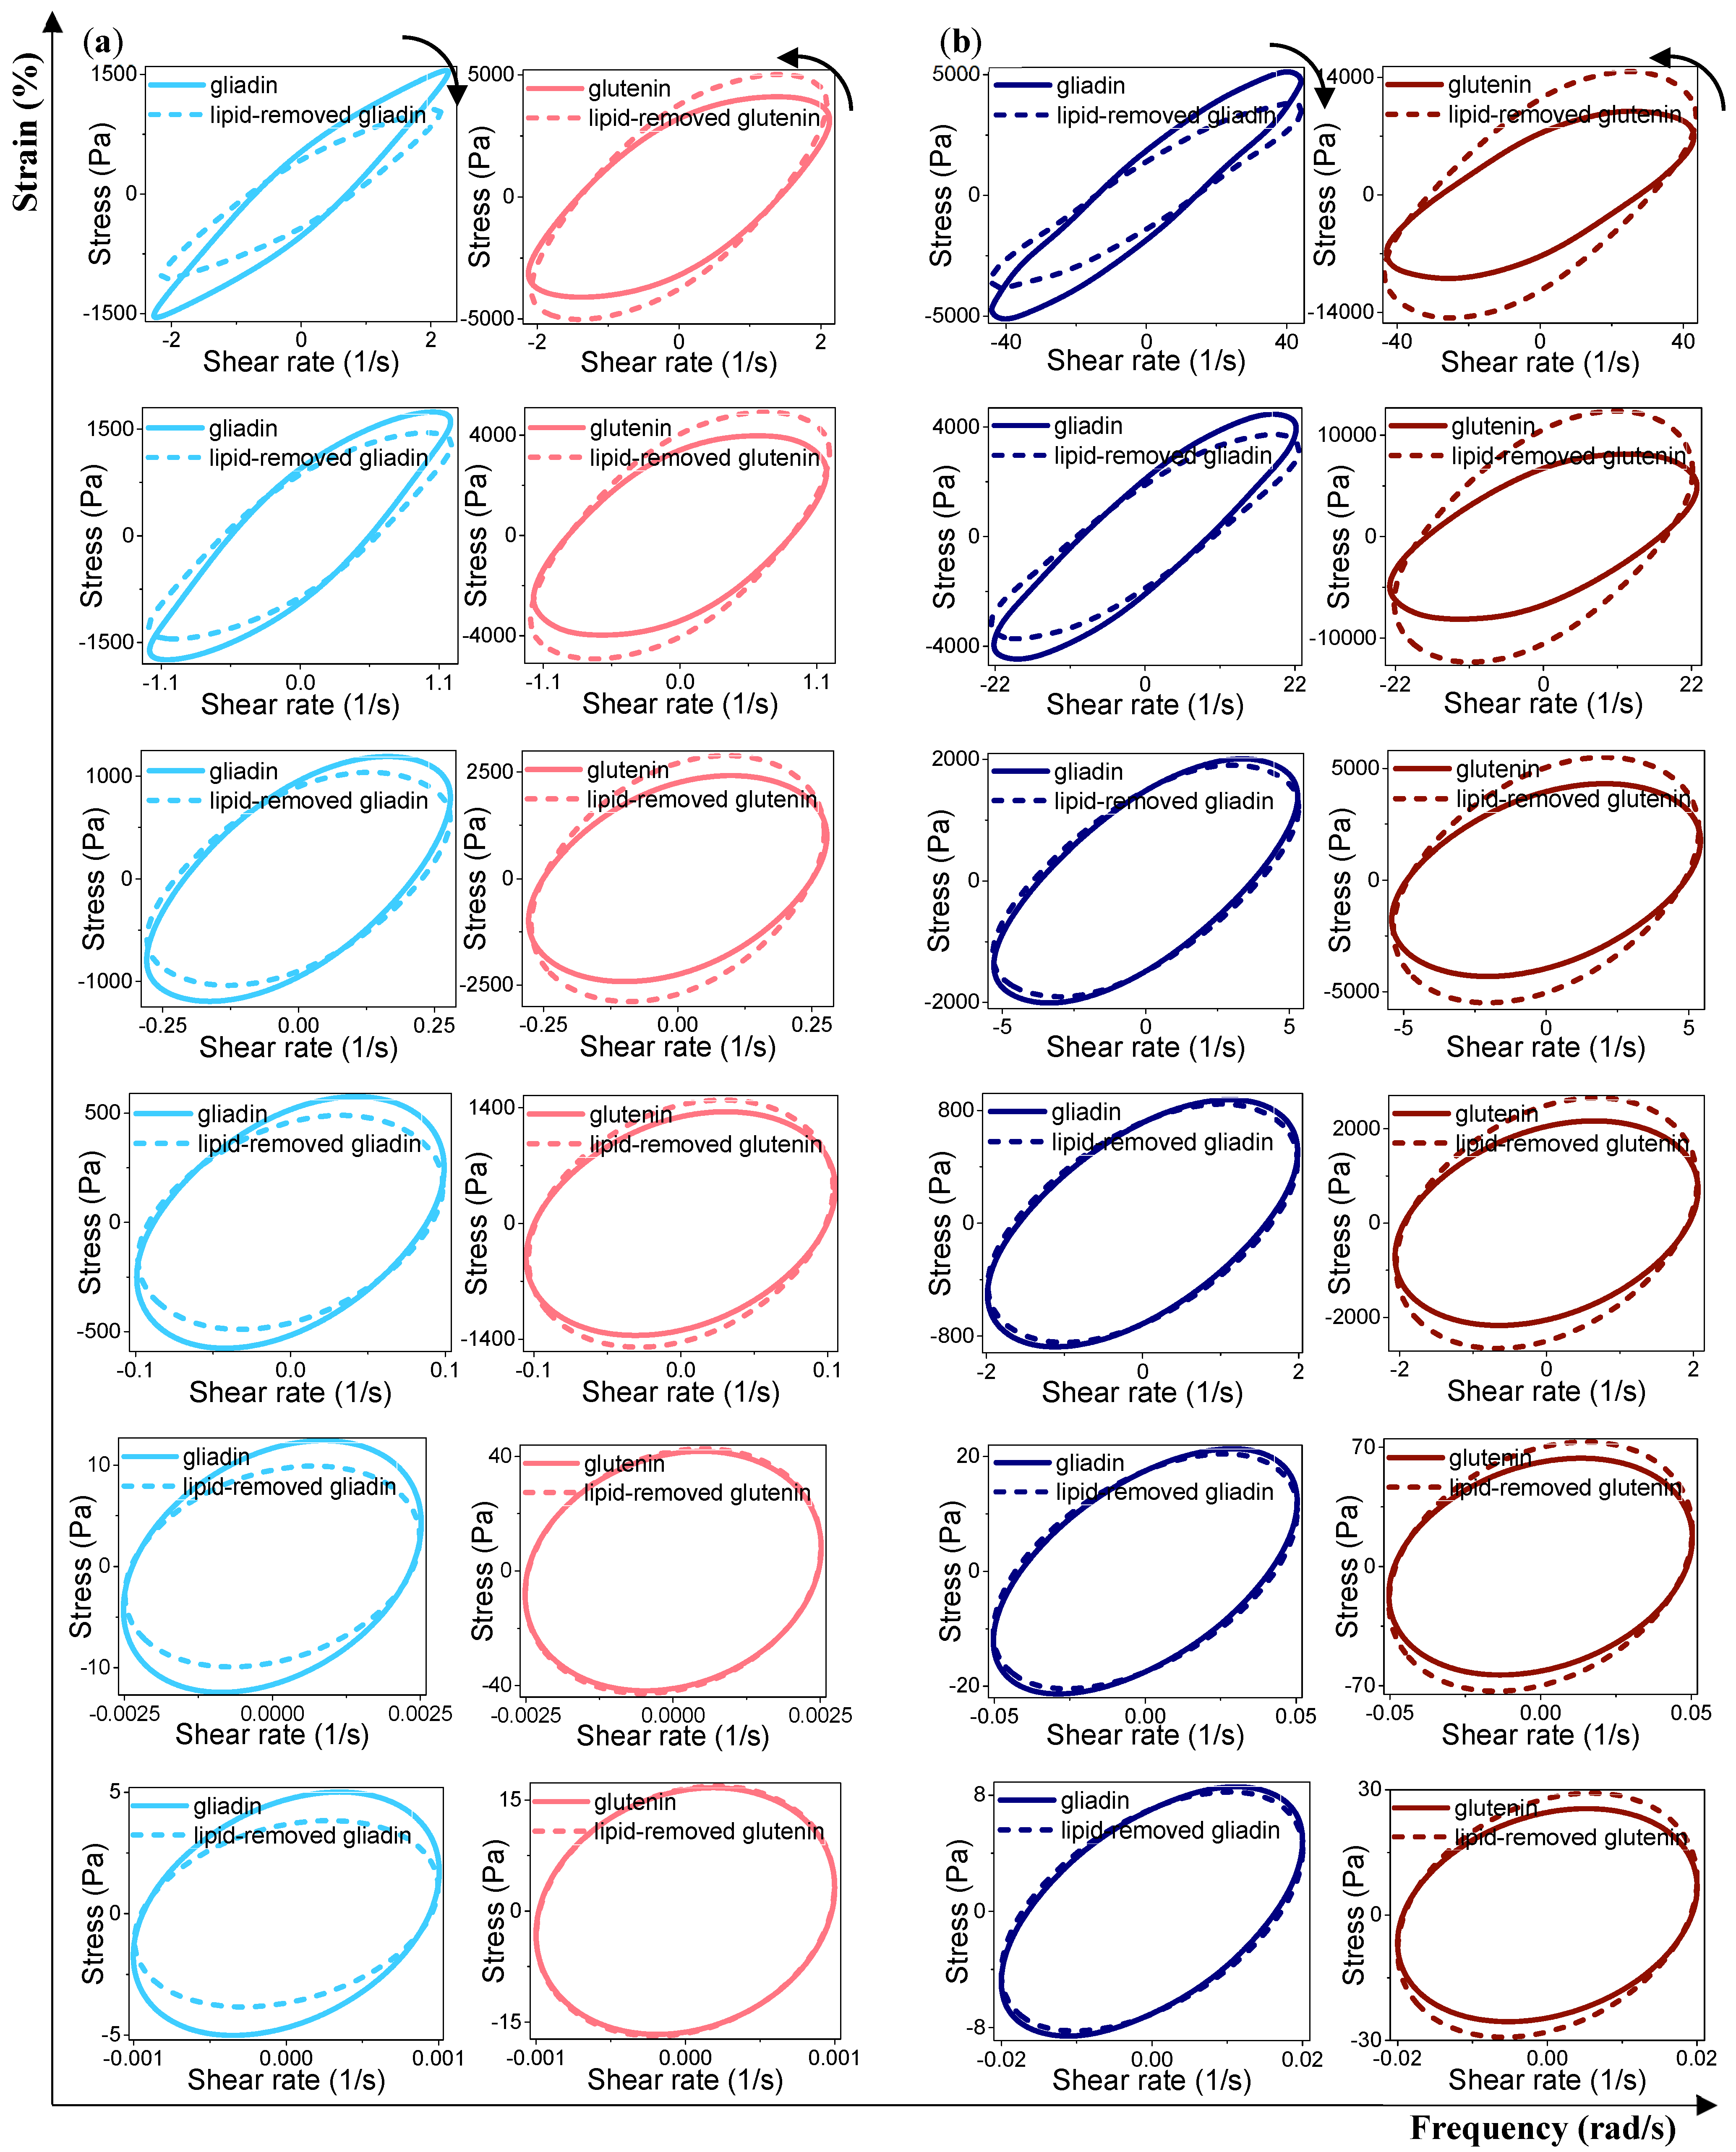
Analysis of the Elastic and Viscous Lissajous–Bowditch Curves

Elastic and viscous Lissajous–Bowditch curves for gliadin, glutenin, and their lipid-removed counterparts were given at strain amplitudes representing SAOS (γ0 = 0.1%, 0.25%), MAOS (γ0 = 10%, 25%), and LAOS (γ0 = 110%, 200%) regions at low (Figure 6a and Figure 7a) and high frequencies (Figure 6b and Figure 7b).
The first harmonic non-linearities cause the Lissajous–Bowditch curves to rotate for each cyclic loading at increasing strain amplitudes [41]. Elastic Lissajous–Bowditch curves for glutenin showed a counter-clockwise rotation in the absence of endogenous lipids as the amplitude of strain increased from 0.1% to 200%. On the other hand, removal of endogenous lipids from gliadin caused a clockwise rotation of the elastic Lissajous–Bowditch curves with respect to increasing strain amplitudes (Figure 6a,b). The clockwise rotation of the elastic Lissajous–Bowditch curves was reported to indicate intercycle elastic softening of viscoelastic materials under gradually increasing deformations [44]. Thus, the elastic Lissajous–Bowditch curves given in Figure 6 revealed a gradual intercycle elastic softening for gliadin and intercycle elastic stiffening for glutenin in the absence of lipids as the transition from SAOS to LAOS region occurred.
The first harmonic elastic moduli [G′1 (ω, γ0)] obtained through the strain sweeps under LAOS deformations correlated with the rotation of the elastic Lissajous–Bowditch curves caused by the removal endogenous lipids from gliadin and glutenin. For instance, at 20 rad/s frequency and 200% strain, G′ values were 788 ± 51 Pa for gliadin (Figure 3a) and 593 ± 139 Pa for lipid-removed gliadin (Figure 3b), while G′ for glutenin was 3159 ± 185 Pa (Figure 3c) and it was 4925 ± 751 Pa for lipid-removed glutenin (Figure 3d).
The rotation of the elastic Lissajous–Bowditch curves for both gluten fractions compared to their lipid-removed counterparts was more pronounced at 20 rad/s (Figure 6b) compared to the rotation at 1 rad/s (Figure 6a), indicating that the effect of endogenous lipids was more evident on the intercycle behaviors of gluten fractions under large deformations with high frequency. The intercycle non-linearities revealed through the elastic Lissajous–Bowditch curves were consistent with the Farinograph data indicating lower consistency for lipid-removed gliadin (Figure 2b) compared to gliadin (Figure 2a) and higher consistency for lipid-removed glutenin (Figure 2d) compared to glutenin (Figure 2c) under large and high-frequency mixing deformations. The effect of endogenous lipids on the intercycle behavior of gluten was also found to be more pronounced under large deformations with high frequency rather than those with low frequency [4], revealing the contribution of endogenous lipids to the individual or collective functionalities of gluten proteins under large deformations with high frequency, such as mixing. However, removal of endogenous lipids from gluten caused a counter-clockwise rotation of the elastic Lissajous–Bowditch curves [4], which was also observed in the case of lipid removal from glutenin (Figure 6a,b). These findings suggest that the intercycle non-linear response of the gluten network was mainly controlled by the glutenin proteins and endogenous lipids. The high molecular weight of glutenins, depicted in Figure 1, has been associated with dough strength and elasticity, as well as the volume and quality of bread [19].
At strain amplitudes of 0.1% and 0.25% in the SAOS region, elastic Lissajous–Bowditch curves of gliadin, glutenin, and lipid-removed fractions displayed elliptical trajectories (Figure 6), which were indicative of linear viscoelastic response [44]. For an applied strain level of 10%, there was a progressive broadening of the elliptical trajectories, which became even more pronounced with strain amplitudes enhancing to 200%. This indicates a shift from characteristics resembling elasticity towards those demonstrating increased viscous behavior, a transition described by Ewoldt et al. [44]. This finding was in accordance with the trends observed for e3/e1 and v3/v1 (Figure 4c,f and Figure 5c,f) and concurred with the harmonic intensities (I3/I1 > 0.001) indicating the onset of non-linearity. Non-linearities became more pronounced at γ0 > 25%, as evidenced by the appearance of bends in the elastic Lissajous–Bowditch curves. The third-harmonic intrinsic nonlinearities bend and twist the Lissajous–Bowditch curves. The interpretation of the curvature in the decomposed elastic curve is indicative of intracycle strain-stiffening behavior [41].
Similar to the trend observed for the elastic Lissajous–Bowditch curves, gliadin showed clockwise rotation and glutenin showed counter-clockwise rotation of the viscous Lissajous–Bowditch curves in the absence of lipids as the strain amplitudes gradually increased into the LAOS region (Figure 7a,b). The clockwise rotation of the viscous Lissajous–Bowditch curves was reported to indicate intercycle viscous thinning of viscoelastic materials under gradually increasing deformations [41]. Thus, the intercycle non-linear behaviors accessed through viscous Lissajous–Bowditch curves indicated that gliadin underwent viscous thinning and glutenin showed viscous thickening behaviors as endogenous lipids were removed. The rotation of the viscous Lissajous–Bowditch curves caused by the removal endogenous lipids from gliadin and glutenin concurred with the G″ data obtained in strain sweeps. At 200% strain with the frequency of 20 rad/s, G″ for gliadin decreased from 2197 ± 69 Pa to 1629 ± 98 Pa, suggesting intercycle viscous decay for gliadin in the absence of lipids. And under the same deformation conditions, G″ for glutenin increased from 3392 ± 106 Pa to 4448 ± 398 Pa, which was indicative of viscous thickening for glutenin when lipids were removed.
Viscous Lissajous–Bowditch curves started to deviate from circular trajectories and showed narrower elliptical trajectories for both gluten fractions and their lipid-removed counterparts as the amplitude of strain increased (Figure 7a,b), which suggested viscous dissipation. The degree of viscous dissipation was more pronounced when the deformation frequency was 1 rad/s (Figure 7a), as evidenced by the narrower elliptical trajectories in the LAOS region compared to those obtained at 20 rad/s (Figure 7b). This was concurrent with the higher tanδ values found for gliadin, glutenin, and their lipid-removed counterparts under LAOS deformations (γ0 = 110%, 200%) at 1 rad/s (Table 1). It is also noteworthy to mention here that the viscous Lissajous–Bowditch curves for the samples were narrower (Figure 7) and tanδ values (Table 1) were higher at γ0 = 200%, ω = 1 rad/s compared to those at γ0 = 10%, ω = 20 rad/s.
Even though the instantaneous intracycle shear rates [γ0 × ω] were similar at these strain amplitude-frequency combinations, the changes observed in the viscous Lissajous–Bowditch curves and tanδ were more pronounced at γ0 = 200%, ω = 1 rad/s, where the applied deformation was an order of magnitude higher than at γ0 = 10%, ω = 20 rad/s. These results denoted a greater influence of strain on the non-linear viscoelastic responses of the samples rather than strain rate, which was more magnified for gliadins.
The distortion of the elliptical trajectories became evident at γ0 > 25% for the viscous Lissajous–Bowditch curves. The most pronounced distortions were found for all samples at 20 rad/s, indicating greater non-linearities for the samples under LAOS deformations with high frequency. Macias-Rodriguez et al. [45] proposed that the presence of distortions in the viscous Lissajous–Bowditch within a cycle at the maximum shear rate might act as a sign of shear-thinning occurring within the cycle itself. This distortion was more evident in the viscous Lissajous–Bowditch curves for gliadin in both the presence and absence of lipids, notably so at a strain of 110% as depicted in (Figure 7a,b). These observations suggest that gliadin and gliadin from which lipids have been removed both exhibit a greater tendency to undergo intracycle shear-thinning when subjected to LAOS deformation of this magnitude. This intracycle shear-thinning behavior disappeared at γ0 > 110%. On the other hand, the bending was more evident for glutenins with and without lipids at γ0 ≥ 110%, especially when the deformation frequency was high (Figure 7b), which suggested a continued intracycle shear-thinning behavior both for glutenin and lipid-removed glutenin under high frequency-high deformation combinations.
Within the applied strain range, both gluten fractions showed qualitatively similar features in the elastic and viscous Lissajous–Bowditch curves compared to their lipid-removed counterparts, suggesting similar intracycle responses in the presence and absence of lipids. Therefore, intracycle strain-stiffening and shear-thinning behaviors revealed by the elastic and viscous Lissajous–Bowditch curves were quantitatively evaluated in the next section through the LAOS parameters.

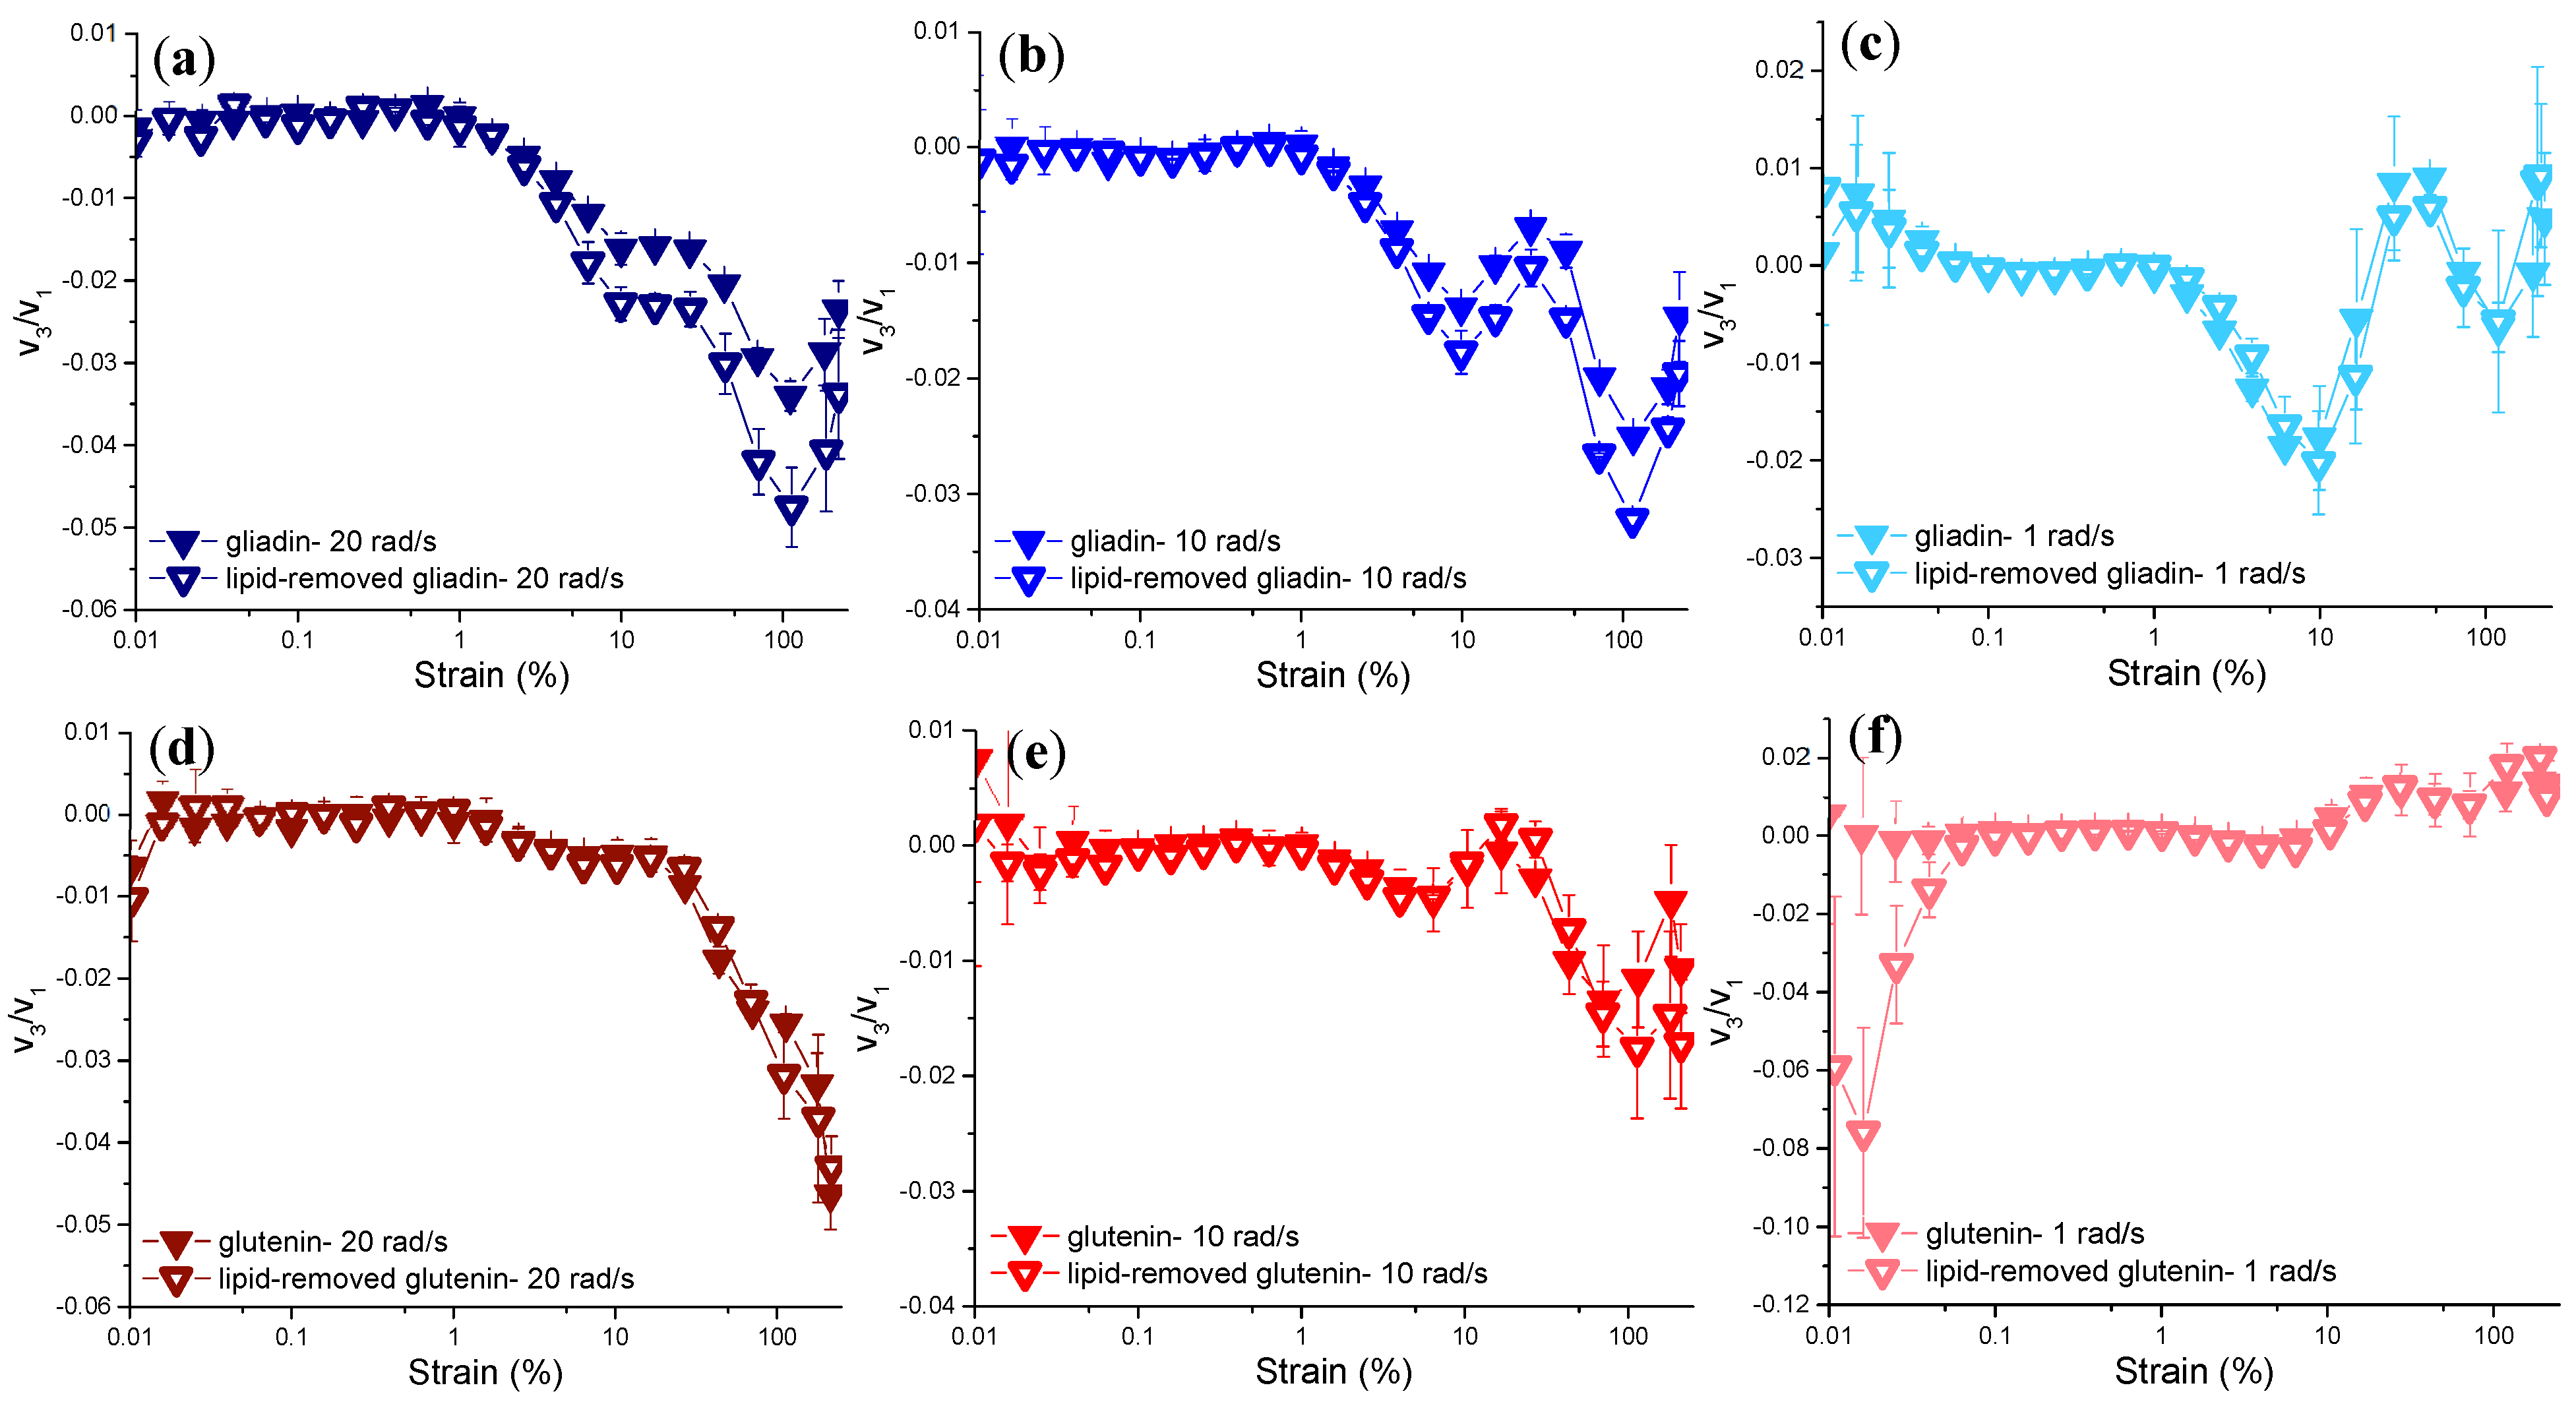
Evaluation of Non-Linear Behavior through the Chebyshev Coefficients

Leading order Chebyshev coefficients, e3/e1 and v3/v1, depict changes in the local (intracycle) elastic and viscous stresses of the decomposed signal which appear as abnormal bending in the Lissajous–Bowditch curves [45].
Figure 8 shows e3/e1 values of gliadin and glutenin along with their lipid-removed counterparts. All samples demonstrated intracycle strain-stiffening behavior characterized by increased stiffness under a certain strain amplitude in the non-linear region within one oscillation cycle. This phenomenon is indicated by the e3/e1 ratios being greater than zero, as proposed as suggested by Ewoldt et al. [18]. At high frequencies (20 rad/s and 10 rad/s), gliadin showed a peak maximum at γ0 = 70%, both in the presence and absence of lipids. Beyond this strain amplitude, a gradual decrease was observed in the degree of intracycle strain-stiffening behavior (Figure 8a,b). Even though higher e3/e1 values were obtained for lipid-removed gliadin compared to gliadin (p < 0.05) in the MAOS region at high frequencies (Figure 8a), as the amplitude of strain increased and the LAOS deformations were experienced, e3/e1 for gliadin and lipid-removed gliadin became similar (p > 0.05). As the deformation frequency decreased to 1 rad/s, the degree of intracycle strain-stiffening behavior for both gliadin and lipid-removed gliadin increased (Figure 8c). This was reflected as a higher degree of bending of the elastic Lissajous–Bowditch curves for gliadin and lipid-removed gliadin at γ0 = 110% and 200% and ω = 1 rad/s (Figure 6a) compared to those at ω = 20 rad/s (Figure 6b). As the amplitude of strain increased, e3/e1 for gliadin constantly increased, while e3/e1 for lipid-removed gliadin showed a maximum at γ0 = 180% and decreased at γ0 = 200%. Thus, the e3/e1 of gliadin was significantly higher than that of lipid-removed gliadin (p < 0.05) at γ0 = 200% when the frequency was 1 rad/s (Figure 8c), pointing to a greater impact of lipids on the intracycle strain-stiffening behavior of gliadin under large deformations with low frequency. Ultimately, gliadin without lipids showed higher intracycle strain-stiffening under MAOS deformations with high frequency, while showing lower intracycle strain-stiffening behavior under low-frequency LAOS deformations in comparison to gliadin (Figure 8a–c).
The intracycle strain-stiffening behaviors of glutenin and lipid-removed glutenin showed a gradual increase with respect to increasing strain amplitudes at 20 rad/s frequency (Figure 8d). Under LAOS deformations (γ0 = 110%, 200%) at 20 rad/s, the e3/e1 values of glutenin were higher than those of lipid-removed glutenin (p < 0.05), indicating a higher degree of intracycle strain-stiffening behavior for glutenin with endogenous lipids. At frequencies below 20 rad/s (Figure 8e,f), the e3/e1 values of glutenin under large deformations (γ0 = 110%, 200%) were not different from those of lipid-removed glutenin (p > 0.05). Thus, unlike the impact of lipids on gliadin, endogenous lipids had no significant effect on the intracycle strain-stiffening behavior of glutenin when the deformation frequency was low.
Achieving an optimum strain-stiffening behavior in a dough system has been shown as a critical parameter to obtain improved loaf volume in leavened baked products [4,46]. Glutenin proteins were shown to form the skeleton of the gluten–starch matrix [5], which was regarded as the primary gas cell stabilization mechanism in wheat flour dough systems [7]. Furthermore, the surface-active compounds of wheat flour, such as polar lipids and gliadin proteins, were suggested to stabilize the gas cells during dough expansion by aligning themselves at the gluten–starch matrix–gas cell interface [10]. During dough expansion in proofing and baking (oven-rise) steps of breadmaking, dough is exposed to large deformations. The magnitudes of these deformations gradually increase with respect to increasing CO2 pressure within the gas cells resulting from yeast activity [47]. The frequency of proofing deformations can be regarded as lower than those experienced during oven-rise, as dough expansion occurs over a longer time range during proofing in comparison to oven-rise. Thus, the deformations dough experiences during fermentation can be defined as medium to large deformations with low frequency, while the rapid expansion occurring during oven-rise involves similar deformations with higher frequency. Considering the intracycle strain-stiffening data obtained for gliadin, glutenin, and their lipid-removed counterparts through e3/e1 values (Figure 8), it could be hypothesized that endogenous lipids contributed to dough expansion by manipulating the strain-stiffening responses of gluten proteins during fermentation and oven-rise.
At high frequencies, both gluten fractions and their lipid-removed counterparts showed intracycle shear-thinning behavior under LAOS deformations, as evidenced by the negative signs of v3/v1 values (<0). At γ0 ≤ 110%, with the frequencies of 20 rad/s and 10 rad/s, removal of endogenous lipids from gliadin caused a decrease in v3/v1 values (p < 0.05), suggesting a higher degree of intracycle shear-thinning behavior for gliadin in the absence of lipids. As the amplitude of strain increased above 110% at high frequencies, the impact of lipids on the intracycle shear-thinning behavior of gliadin was diminished, and both gliadin and lipid-removed gliadin showed similar intracycle shear-thinning behaviors (Figure 9a,b). When the frequency was 1 rad/s (Figure 9c), v3/v1 values for gliadins with and without lipids increased and changed signs, indicating similar (p > 0.05) intracycle shear-thickening behaviors (v3/v1 > 0) for both gliadin and lipid-removed gliadin at 200% strain. As strain amplitude increased, the material response was reported to become more complex and the stress could show both strain-stiffening or shear-thickening at moderate strains, and strain-softening or shear-thinning characteristics at very high strains. [44]. For gliadin, with and without the presence of lipids, the change from shear-thinning to -thickening properties during low-frequency LAOS deformations was manifested in the decreased curvature of the viscous Lissajous–Bowditch curves at a strain amplitude (γ0) of 200%, as opposed to the more pronounced curvature observed at γ0 = 110% (Figure 7a).
Removal of endogenous lipids did not influence the intracycle shear-thinning/thickening behavior of glutenin under LAOS deformations, as evidenced by the similar v3/v1 values of glutenin and lipid-removed glutenin (p > 0.05) at all frequencies studied. At high frequencies (Figure 9d,e), glutenin showed intracycle shear-thinning behavior (v3/v1 < 0) both in the presence and absence of endogenous lipids. And when the deformation frequency was low (Figure 9f), both glutenin and lipid-removed glutenin showed intracycle shear-thickening behavior (v3/v1 > 0) throughout the whole strain range.
Previous studies also found intracycle shear-thickening behavior for glutenin at low frequency under LAOS deformations [5,13]. This study revealed for the first time that glutenin showed intracycle shear-thickening behavior under low frequency deformations, even in the absence of endogenous lipids. Increasing strain amplitudes caused relatively lower viscous dissipation for glutenin in comparison with gliadin (Figure 7), as also reported by Yazar et al. [5], increasing mixing time did not affect the intracycle shear-thinning/thickening behavior of glutenin [13], and as found in this study, removal of lipids did not affect the intracycle shear-thinning/thickening behavior of glutenin (Figure 9d–f), which collectively point out to the elastic nature of glutenin.

4. Conclusions

The Farinograph tests conducted on gliadin, glutenin, and their lipid-removed counterparts revealed a decrease in consistency for gliadin in the absence of endogenous lipids, while pointing to an increase in the consistency of glutenin in the absence of lipids. When endogenous lipids were absent, the ability of gliadin proteins to interact with water was considered to diminish due to the lack of their interactions with phospholipids that have an amphiphilic character. On the other hand, the uncontrolled increase in the consistency of lipid-removed glutenin was attributed to the disrupted balance between the formation of β-sheet and hydrogen bonds in the absence of lipids during mixing. Thus, the Farinograms suggested that endogenous lipids play a role in regulating the affinity of gluten proteins to water, which prevents gliadins from behaving more viscous and glutenins from behaving more elastic under mixing deformations.
In the SAOS region (γ0 = 0.1%, 0.25%), tanδ values of gliadin and lipid-removed gliadin remained similar, while tanδ values of glutenin increased at high frequencies when endogenous lipids were removed, indicating a decrease in the elasticity of glutenin in the absence of lipids. When the frequency was low, as in the case of resting, tanδ values for both gluten fractions were similar to those of their lipid-removed counterparts. In the MAOS region (γ0 = 10%, 25%), the first harmonic material functions indicated type IV non-linear behaviors for gliadin and lipid-removed gliadin, while suggesting type III non-linear behaviors for glutenin and lipid-removed glutenin. As the deformation magnitude increased and the samples entered the LAOS region (γ0 = 110%, 200%), the counter-clockwise rotations of the elastic and viscous Lissajous–Bowditch curves of lipid-removed glutenin in comparison to those of glutenin suggested lower degrees of intercycle strain-softening and shear-thinning for glutenin without lipids. The clockwise rotations of the Lissajous–Bowditch curves of lipid-removed gliadin in comparison to those of gliadin indicated the opposite effect on the intercycle non-linearity of gliadin in the absence of lipids. The effect of endogenous lipids on the intercycle non-linear behaviors of gliadin and glutenin was similar to the effect revealed through the Farinograph mixing tests. Investigations into the third-order elastic Chebyshev coefficients demonstrated that gliadin exhibits reduced intracycle strain-stiffening when subjected to MAOS at higher frequencies and greater strain-stiffening during LAOS at lower frequencies compared to cases where endogenous lipids have been removed from gliadin. Conversely, glutenin with lipids is characterized by a more pronounced intracycle strain-stiffening during both high-frequency MAOS and LAOS deformations. This is indicated by elevated e3/e1 ratios for glutenin relative to glutenin with extracted lipids. The findings suggest that lipids, in conjunction with gluten proteins, play an integral part in influencing the extent of dough expansion. Intracycle shear-thinning (v3/v1 < 0 at ω = 20 rad/s, 10 rad/s) and shear-thickening (v3/v1 > 0 at ω = 1 rad/s) behaviors of glutenin were not affected by the removal of lipids, indicating that the non-linear behavior of glutenin was dominated by its elastic response. As for gliadin, removal of endogenous lipids from gliadin caused a decrease in v3/v1 values when the deformation frequency was high, suggesting a higher intracycle shear-thinning behavior for gliadin in the absence of lipids.
These viscoelastic responses obtained for gliadin, glutenin, and their lipid-removed counterparts showed that endogenous lipids play a significant in role in complementing the opposing functions of gliadin and glutenin. Thus, endogenous lipids contribute to these proteins to endure processing deformations ranging from small to large with varying frequencies by stabilizing their viscous and elastic responses as these proteins interact to form a three-dimensional network.

Author Contributions

Conceptualization, G.Y.; methodology, G.Y., J.L.K. and B.S.; software, G.Y.; validation, G.Y., J.L.K. and B.S.; formal analysis, G.Y.; investigation, G.Y.; resources, J.L.K. and B.S.; data curation, G.Y.; writing—original draft preparation, G.Y.; writing—review and editing, G.Y., J.L.K. and B.S.; visualization, G.Y.; supervision, J.L.K. and B.S.; project administration, J.L.K. and B.S.; funding acquisition, J.L.K. and B.S. All authors have read and agreed to the published version of the manuscript.

Funding

This research received no external funding.

Institutional Review Board Statement

Not applicable.

Informed Consent Statement

Not applicable.

Data Availability Statement

The raw data supporting the conclusions of this article will be made available by the authors on request.

Conflicts of Interest

The authors declare no conflicts of interest.

References

  1. Melis, S.; Delcour, J.A. Impact of wheat endogenous lipids on the quality of fresh bread: Key terms, concepts, and underlying mechanisms. Compr. Rev. Food Sci. Food Saf. 2020, 19, 3715–3754. [Google Scholar] [CrossRef]
  2. Pareyt, B.; Finnie, S.M.; Putseys, J.A.; Delcour, J.A. Lipids in bread making: Sources, interactions, and impact on bread quality. J. Cereal Sci. 2011, 54, 266–279. [Google Scholar] [CrossRef]
  3. McCann, T.H.; Small, D.M.; Batey, I.L.; Wrigley, C.W.; Day, L. Protein-lipid interactions in gluten elucidated using acetic-acid fractionation. Food Chem. 2009, 115, 105–112. [Google Scholar] [CrossRef]
  4. Yazar, G.; Kokini, J.L.; Smith, B. Effect of endogenous wheat gluten lipids on the non-linear rheological properties of the gluten network. Food Chem. 2022, 367, 130729. [Google Scholar] [CrossRef] [PubMed]
  5. Yazar, G.; Duvarci, O.; Tavman, S.; Kokini, J.L. LAOS behavior of the two major gluten fractions: Gliadin and glutenin. J. Cereal Sci. 2017, 77, 201–210. [Google Scholar] [CrossRef]
  6. Gerits, L.R.; Pareyt, B.; Delcour, J.A. Single run HPLC separation coupled to evaporative light scattering detection unravels wheat flour endogenous lipid redistribution during bread dough making. LWT-Food Sci. Technol. 2013, 53, 426–433. [Google Scholar] [CrossRef]
  7. Sroan, B.S.; Bean, S.R.; MacRitchie, F. Mechanism of gas cell stabilization in bread making. I. The primary gluten–starch matrix. J. Cereal Sci. 2009, 49, 32–40. [Google Scholar] [CrossRef]
  8. Békés, F.; Zawistowska, U.; Bushuk, W. Protein-lipids complexes in the gliadin fraction. Cereal Chem. 1983, 60, 371–378. [Google Scholar]
  9. Yazar, G.; Duvarci, O.; Tavman, S.; Kokini, J.L. Effect of mixing on LAOS properties of hard wheat flour dough. J. Food Eng. 2016, 190, 195–204. [Google Scholar] [CrossRef]
  10. Sroan, B.S.; MacRitchie, F. Mechanism of gas cell stabilization in breadmaking. II. The secondary liquid lamellae. J. Cereal Sci. 2009, 49, 41–46. [Google Scholar] [CrossRef]
  11. Gerits, L.R.; Pareyt, B.; Delcour, J.A. A lipase based approach for studying the role of wheat lipids in breadmaking. Food Chem. 2014, 156, 190–196. [Google Scholar] [CrossRef] [PubMed]
  12. Iwaki, S.; Hayakawa, K.; Fu, B.-X.; Otobe, C. Changes in hydrophobic interactions among gluten proteins during dough formation. Processes 2021, 9, 1244. [Google Scholar] [CrossRef]
  13. Yazar, G.; Kokini, J.L.; Smith, B. Comparison of mixing and non-linear viscoelastic properties of carob germ glutelins and wheat glutenin. Food Hydrocoll. 2023, 143, 108922. [Google Scholar] [CrossRef]
  14. Osborne, T.B. The Proteins of the Wheat Kernel (Monograph); Carnegie Institute, Washington: Washington, DC, USA, 1907. [Google Scholar]
  15. Smith, B.M.; Bean, S.R.; Schober, T.J.; Tilley, M.; Herald, T.J.; Aramouni, F.M. Composition and molecular weight distribution of carob germ protein fractions. J. Agric. Food Chem. 2010, 58, 7794–7800. [Google Scholar] [CrossRef] [PubMed]
  16. Agilent Technologies. Agilent Protein 230 Kit Quick Start Guide. Agilent Technologies, Inc. 2016. Available online: https://www.agilent.com/cs/library/usermanuals/public/Protein-230_Assay_QSG_RevC.pdf. (accessed on 20 March 2024).
  17. AACC International. Approved Methods of Analysis, 11th ed.; AACC International: St. Paul, MN, USA, 2010. [Google Scholar]
  18. Ewoldt, R.H.; Hosoi, A.E.; McKinley, G.H. New measures for characterizing nonlinear viscoelasticity in large amplitude oscillatory shear. J. Rheol. 2008, 52, 1427–1458. [Google Scholar] [CrossRef]
  19. Wieser, H. Chemistry of gluten proteins. Food Microbiol. 2007, 24, 115–119. [Google Scholar] [CrossRef] [PubMed]
  20. Wieser, H.; Koehler, P.; Scherf, K.A. Chemistry of wheat gluten proteins: Qualitative composition. Cereal Chem. 2023, 100, 23–35. [Google Scholar] [CrossRef]
  21. Chaudhary, N.; Virdi, A.S.; Dangi, P.; Khatkar, B.S.; Mohanty, A.K.; Singh, N. Protein, thermal and functional properties of α-, γ- and ω-gliadins of wheat and their effect on bread making characteristics. Food Hydrocoll. 2022, 124, 107212. [Google Scholar] [CrossRef]
  22. Shewry, P.R.; Tatham, A.S.; Forde, J.; Kreis, M.; Miflin, B.J. The classification and nomenclature of wheat gluten proteins: A reassessment. J. Cereal Sci. 1986, 4, 97–106. [Google Scholar] [CrossRef]
  23. Wieser, H.; Bushuk, W.; MacRitchie, F. The polymeric glutenins. In Gliadin and Glutenin: The Unique Balance of Wheat Quality; Wrigley, C., Bekes, F., Bushuk, W., Eds.; AACC International: St. Paul, MN, USA, 2006; pp. 213–240. [Google Scholar]
  24. Bock, J.E. The Farinograph: Understanding Farinograph curves. In The Farinograph Handbook—Advances in Technology, Science, and Applications, 4th ed.; Bock, J.E., Don, C., Eds.; Woodhead Publishing: Sawston, UK, 2022; pp. 33–41. [Google Scholar]
  25. Van Bockstaele, F.; De Leyn, I.; Eeckhout, M.; Dewettinck, K. Rheological properties of wheat flour dough and the relationship with bread volume. I. Creep-recovery measurements. Cereal Chem. 2008, 85, 753–761. [Google Scholar] [CrossRef]
  26. Papantoniou, E.; Hammond, E.W.; Scriven, F.; Gordon, M.H.; Schofield, J.D. Effects of endogenous flour lipids on the quality of short-dough biscuit. J. Sci. Food Agric. 2004, 84, 1371–1380. [Google Scholar] [CrossRef]
  27. Pichot, R.; Watson, R.L.; Norton, I.T. Phospholipids at the interface: Current trends and challenges. Int. J. Mol. Sci. 2013, 14, 11767–11794. [Google Scholar] [CrossRef]
  28. Monteiro, A.M.F.; Arêas, E.P.G.; Schröder, A.; Fa, N. Gliadin effect on fluctuation properties of phospholipid giant vesicles. Colloids Surf. B Biointerfaces 2004, 34, 53–57. [Google Scholar] [CrossRef] [PubMed]
  29. Georget, D.M.; Belton, P.S. Effects of temperature and water content on the secondary structure of wheat gluten studied by FTIR spectroscopy. Biomacromolecules 2006, 7, 469–475. [Google Scholar] [CrossRef]
  30. Pézolet, M.; Bonenfant, S.; Dousseau, F.; Popineau, Y. Conformation of wheat gluten proteins: Comparison between functional and solution states as determined by infrared spectroscopy. FEBS Lett. 1992, 299, 247–250. [Google Scholar] [CrossRef]
  31. Wellner, N.; Belton, P.S.; Tatham, A.S. Fourier transform IR spectroscopic study of hydration-induced structure changes in the solid state of ω-gliadins. Biochem. J. 1996, 319, 741–747. [Google Scholar] [CrossRef]
  32. Mejia, C.D.; Mauer, L.J.; Hamaker, B.R. Similarities and differences in secondary structure of viscoelastic polymers of maize α-zein and wheat gluten proteins. J. Cereal Sci. 2007, 45, 353–359. [Google Scholar] [CrossRef]
  33. Wang, Y.; Belton, P.S.; Bridon, H.; Garanger, E.; Wellner, N.; Parker, M.L.; Grant, A.; Feillet, P.; Noel, T.R. Physicochemical studies of caroubin: A gluten-like protein. J. Agric. Food Chem. 2001, 49, 3414–3419. [Google Scholar] [CrossRef] [PubMed]
  34. Belton, P.S.; Colquhoun, I.J.; Grant, A.; Wellner, N.; Field, J.M.; Shewry, P.R.; Tatham, A.S. FTIR and NMR studies on the hydration of a high-Mr subunit of glutenin. Int. J. Biol. Macromol. 1995, 17, 74–80. [Google Scholar] [CrossRef]
  35. Fevzioglu, M.; Ozturk, O.K.; Hamaker, B.R.; Campanella, O.H. Quantitative approach to study secondary structure of proteins by FT-IR spectroscopy, using a model wheat gluten system. Int. J. Biol. Macromol. 2020, 164, 2753–2760. [Google Scholar] [CrossRef]
  36. Dewan, A.; Khatkar, B.S.; Bangar, S.P.; Chaudhary, V.; Lorenzo, J.M. Infrared spectroscopy and microstructural assessment of dough with varying wheat gluten fractions. Food Anal. Methods 2022, 15, 2821–2829. [Google Scholar] [CrossRef]
  37. Yazar, G.; Caglar Duvarci, O.; Yildirim Erturk, M.; Kokini, J.L. LAOS (large amplitude oscillatory shear) applications for semisolid foods. In Rheology of Semisolid Foods; Food Engineering Series; Joyner, H., Ed.; Springer: Berlin/Heidelberg, Germany, 2019; pp. 97–131. [Google Scholar]
  38. Barak, S.; Mudgil, D.; Khatkar, B.S. Influence of gliadin and glutenin fractions on rheological, pasting, and textural properties of dough. Int. J. Food Prop. 2014, 17, 1428–1438. [Google Scholar] [CrossRef]
  39. Song, H.Y.; Hyun, K. First-harmonic intrinsic nonlinearity of model polymer solutions in medium amplitude oscillatory shear (MAOS). Korea-Aust. Rheol. J. 2019, 31, 1–13. [Google Scholar] [CrossRef]
  40. Erturk, M.Y.; Minh, A.N.; Kokini, J.L. Advances in large amplitude oscillatory shear rheology of food materials. Front. Food Sci. Technol. 2023, 3, 1130165. [Google Scholar] [CrossRef]
  41. Ewoldt, R.; Bharadwaj, N.A. Low-dimensional intrinsic material functions for nonlinear viscoelasticity. Rheologica Acta 2013, 52, 201–219. [Google Scholar] [CrossRef]
  42. Singh, P.K.; Soulages, J.M.; Ewoldt, R. Frequency-sweep medium amplitude oscillatory shear (MAOS). J. Rheol. 2018, 62, 277–293. [Google Scholar] [CrossRef]
  43. Hyun, K.; Kim, S.H.; Ahn, K.H.; Lee, S.J. Large amplitude oscillatory shear as a way to classify the complex fluids. J. Non-Newton. Fluid Mech. 2002, 107, 51–65. [Google Scholar] [CrossRef]
  44. Ewoldt, R.H.; Clasen, C.; Hosoi, A.E.; McKinley, G.H. Rheological fingerprinting of gastropod pedal mucus and synthetic complex fluids for biomimicking adhesive locomotion. Soft Matter 2007, 3, 634–643. [Google Scholar] [CrossRef] [PubMed]
  45. Macias-Rodriguez, B.A.; Ewoldt, R.H.; Marangoni, A.G. Nonlinear viscoelasticity of fat crystal networks. Rheol. Acta 2018, 57, 251–266. [Google Scholar] [CrossRef]
  46. Kokelaar, J.J.; van Vliet, T.; Prins, A. Strain hardening properties and extensibility of flour and gluten doughs in relation to breadmaking performance. J. Cereal Sci. 1996, 24, 199–214. [Google Scholar] [CrossRef]
  47. Menjivar, J.A. Fundamental aspects of dough rheology. In Dough Rheology and Baked Product Texture; Faridi, H., Faubion, J.M., Eds.; AVI Publishing: New York, NY, USA, 1990; pp. 1–29. [Google Scholar]
Figure 1. SDS-PAGE gels for ladder (Mw standards) and wheat gluten fractions with and without endogenous lipids. Samples were reduced prior to analysis.
Lipidology 01 00004 g001
Figure 2. Farinograms for gluten fractions with and without endogenous lipids: (a) gliadin, (b) lipid-removed gliadin, (c) glutenin, (d) lipid-removed glutenin.
Lipidology 01 00004 g002
Figure 3. Strain sweep data (γ: 0.01–200%; ω: 1, 10, 20 rad/s) for hydrated gliadin and glutenin with (full symbol) and without (empty symbol) endogenous lipids: (a) gliadin, (b) lipid-removed gliadin, (c) glutenin, (d) lipid-removed glutenin.
Lipidology 01 00004 g003
Figure 4. MAOS behaviors of gliadin with (full symbol) and without (empty symbol) endogenous lipids: harmonic intensity maps of gliadin (a) and lipid-removed gliadin (d), reduced moduli of gliadin (b) and lipid-removed gliadin (e), scaled third-order elastic and viscous Chebyshev coefficients for gliadin (c) and lipid-removed gliadin (f). MAOS region limits are shown with the dash dots.
Lipidology 01 00004 g004
Figure 5. MAOS behaviors of glutenin with (full symbol) and without (empty symbol) endogenous lipids: harmonic intensity maps of glutenin (a) and lipid-removed glutenin (d), reduced moduli of glutenin (b) and lipid-removed glutenin (e), scaled third-order elastic and viscous Chebyshev coefficients for glutenin (c) and lipid-removed glutenin (f). MAOS region limits are shown with the dash dots.
Lipidology 01 00004 g005
Figure 6. Elastic Lissajous–Bowditch curves for gluten fractions with (straight line) and without (dotted line) endogenous lipids. Absolute stress values were plotted versus strain (elastic trajectories) at selected strain values including 0.1%, 0.25%, 10%, 25%, 110%, and 200%. Light color indicates low frequency [(a): 1 rad/s] and dark color indicates high frequency [(b): 20 rad/s]. The arrows indicate the direction of the rotation in the Lissajous-Bowditch curves of gluten fractions in the absence of endogenous lipids.
Lipidology 01 00004 g006
Figure 7. Viscous Lissajous–Bowditch curves for gluten fractions with (straight line) and without (dotted line) endogenous lipids. Absolute stress values were plotted versus strain rate (viscous trajectories) at selected strain values including 0.1%, 0.25%, 10%, 25%, 110%, and 200%. Light color indicates low frequency [(a): 1 rad/s] and dark color indicates high frequency [(b): 20 rad/s]. The arrows indicate the direction of the rotation in the Lissajous-Bowditch curves of gluten fractions in the absence of endogenous lipids.
Lipidology 01 00004 g007
Figure 8. e3/e1 values of gliadin, glutenin, and their lipid-removed counterparts throughout the LAOS sweeps at different frequencies [ω: 20 rad/s (a,d), 10 rad/s (b,e), 1 rad/s (c,f)]. Frequencies from high to low are indicated by the colors changing from dark to light. The data for gliadin (full symbol) and lipid-removed gliadin (empty symbol) are given in blue shades, while those for glutenin (full symbol) and lipid-removed glutenin (empty symbol) are given in red shades.
Lipidology 01 00004 g008
Figure 9. v3/v1 values of gliadin, glutenin, and their lipid-removed counterparts throughout the LAOS sweeps at different frequencies [ω: 20 rad/s (a,d), 10 rad/s (b,e), 1 rad/s (c,f)]. Frequencies from high to low are indicated by the colors changing from dark to light. The data for gliadin (full symbol) and lipid-removed gliadin (empty symbol) are given in blue shades, while those for glutenin (full symbol) and lipid-removed glutenin (empty symbol) are given in red shades.
Lipidology 01 00004 g009
Table 1. tanδ values of gluten fractions with and without lipids under SAOS (γ0: 0.1%, 0.25%), MAOS (γ0: 10%, 25%), and LAOS deformations (γ0: 110%, 200%) at different frequencies.
SAOS, MAOS, and LAOS Strains (%)tanδ
20 rad/s10 rad/s1 rad/s
GliadinLipid-Removed GliadinGluteninLipid-Removed GluteninGliadinLipid-Removed GliadinGluteninLipid-Removed GluteninGliadinLipid-Removed GliadinGluteninLipid-Removed Glutenin
0.10.69 ± 0.07 a0.60 ± 0.00 a0.27 ± 0.00 c0.30 ± 0.00 d0.52 ± 0.03 a0.49 ± 0.02 a0.24 ± 0.00 c0.27 ± 0.01 d0.36 ± 0.02 a0.33 ± 0.01 a0.19 ± 0.00 c0.20 ± 0.01 c
0.250.70 ± 0.07 a0.60 ± 0.00 a0.27 ± 0.00 c0.30 ± 0.00 d0.53 ± 0.03 a0.50 ± 0.02 a0.24 ± 0.00 c0.27 ± 0.01 d0.36 ± 0.02 a0.32 ± 0.01 a0.19 ± 0.00 c0.20 ± 0.01 c
100.73 ± 0.05 a0.64 ± 0.01 a0.35 ± 0.01 c0.36 ± 0.00 c0.56 ± 0.03 a0.53 ± 0.00 a0.32 ± 0.01 c0.35 ± 0.02 c0.50 ± 0.04 a0.40 ± 0.00 a0.33 ± 0.01 c0.30 ± 0.00 c
250.98 ± 0.05 a0.86 ± 0.02 b0.46 ± 0.01 c0.45 ± 0.01 c0.79 ± 0.03 a0.73 ± 0.00 a0.41 ± 0.01 c0.45 ± 0.04 c0.85 ± 0.08 a0.71 ± 0.00 a0.44 ± 0.04 c0.40 ± 0.01 c
1102.05 ± 0.09 a1.89 ± 0.21 a0.79 ± 0.01 c0.66 ± 0.05 d1.90 ± 0.02 a1.56 ± 0.02 b0.72 ± 0.05 c0.71 ± 0.11 c1.99 ± 0.21 a1.72 ± 0.07 a0.79 ± 0.13 c0.84 ± 0.09 c
2002.79 ± 0.14 a2.83 ± 0.60 a1.07 ± 0.04 c0.90 ± 0.07 d3.05 ± 0.31 a2.20 ± 0.13 b1.01 ± 0.11 c0.96 ± 0.14 c3.50 ± 0.45 a2.91 ± 0.56 a1.07 ± 0.18 c1.05 ± 0.07 c
tan δ values of gluten fractions were compared to those of their lipid-removed counterparts at each strain amplitude for each frequency applied. Means that do not share a letter are significantly different (p < 0.05). Significance level is 0.05.
Disclaimer/Publisher’s Note: The statements, opinions and data contained in all publications are solely those of the individual author(s) and contributor(s) and not of MDPI and/or the editor(s). MDPI and/or the editor(s) disclaim responsibility for any injury to people or property resulting from any ideas, methods, instructions or products referred to in the content.

