Abstract
Human–animal relationships have long been idealized as universally positive, but recent studies highlight the complexities and contradictions inherent in this bond. This study re-analyzes previously published data to examine the nuanced effects of pet ownership on human well-being, particularly under stressful circumstances such as the COVID-19 pandemic. Using a mixed-methods approach, data from three independent surveys (n = 840) were re-analyzed to explore the bio-psychosocial implications of pet companionship. Key instruments included the Quality of Life Questionnaire (WHOQOL-BREF), Beck Depression Inventory (BDI-II), and Lexington Attachment to Pets Scale (LAPS). Results revealed that pet ownership was significantly associated with higher levels of psychosocial stress, challenging the assumption that pets universally improve quality of life. Notably, individuals with current pet ownership reported lower quality of life compared to non-owners. However, qualitative analyses illustrated perceived emotional and social support among pet owners, reflecting the “pet-effect paradox.” Mental health variables such as depression and loneliness emerged as stronger predictors of well-being than pet attachment. This study introduces the “Aunty Phenomenon” as a conceptual framework to describe the idealization of pet relationships, while acknowledging the responsibilities they entail. These findings underscore the importance of a holistic approach to human–animal bond research.
1. Introduction
Human–animal relationships have long captured the attention of researchers and the public, and are often portrayed as universally positive and beneficial for human well-being. Positive effects of the human–animal bond were described as the “pet-effect” [1], and caring for an animal was portrayed as a source for improved mental and physical health [2,3]. However, this simplistic view overlooks the complexities and contradictions inherent in these bonds, particularly under stressful conditions such as the COVID-19 pandemic [4,5]. The “pet-effect paradox” [4] highlights these contradictions, revealing a discrepancy between the perceived emotional benefits of pets and documented associations with increased stress and reduced well-being [4,5]. One possible explanation for this paradox is the “Aunty Phenomenon”, a conceptual framework proposed by the authors and introduced in this study, which posits that pet owners may selectively focus on the companionship and emotional support their pets provide while underestimating the responsibilities and potential stressors associated with caregiving. This selective perception may lead to an overestimation of the benefits of pet ownership [6], particularly in times of crisis such as the COVID-19 pandemic [7,8,9,10,11].
While previous studies have explored the human–animal bond in various contexts, there is limited research examining how sociodemographic factors, pre-existing mental health conditions, and external stressors (e.g., a global crisis) interact to shape pet owners’ experiences. Furthermore, many studies rely on cross-sectional designs, limiting conclusions about the directionality of these relationships [12]. To address these gaps, this study investigates how pet ownership relates to well-being under stressful conditions using a mixed-methods approach.
By re-analyzing data from three independent surveys (2019–2022, n = 840), this study examines the bio-psychosocial effects of pet companionship. The analysis considers key mental health indicators such as depression, loneliness, and quality of life. The findings contribute to a more nuanced understanding of the human–animal bond and challenge overly positive assumptions. By integrating data collected before and during the pandemic, the study additionally aims to capture the impact of external stressors on human–animal relationships, as well as their interaction with stress and resilience in diverse contexts [13,14,15].
Building on prior research, the authors hypothesize that the benefits of pet ownership might be moderated by sociodemographic variables and mental health status. For instance, loneliness and depression may play significant roles in shaping the perceived benefits of pet companionship [16,17]. Additionally, this study recognizes the potential bidirectional nature of the human–animal bond: individuals with higher levels of stress or depression may acquire pets as a coping strategy, which in turn influences their experiences of stress and well-being [1,6,8,10].
To address these complexities, this study employs a mixed-methods approach, incorporating both quantitative and qualitative analyses to provide a holistic perspective. The thematic analysis of qualitative data offers insights into the subjective experiences of pet owners during crises, complementing the quantitative findings and enriching our understanding of the “pet-effect paradox” [4]. This approach allows for a nuanced exploration of how sociodemographic factors, mental health, and external stressors intersect to shape human–animal relationships.
In summary, this research seeks to refine our understanding of the human–animal bond by addressing gaps in the literature, such as the limited consideration of sociodemographic moderators and the overemphasis on positive narratives. By introducing the “Aunty Phenomenon” and leveraging a multidimensional framework, we aim to contribute to the growing discourse on the bio-psychosocial implications of pet ownership during crises.
2. Materials and Methods
This study integrates quantitative and qualitative data from three previous online-surveys, all of which investigated different facets of human–animal relationships. The authors of these studies have consented to data reuse, and participants agreed to the multiple use of their survey responses. In total, 840 datasets were included in the following analysis. To ensure that the total sample size (n = 840) represents unique individuals, the authors designed a survey distribution to minimize the risk of repeated participation. The three surveys were conducted at different time points (2018/2019, 2020/2021, and 2021/2022) and distributed via distinct online platforms, reducing the likelihood that the same individuals participated in multiple surveys. Given these precautions, we assume that the risk of duplicate participation is minimal.
The following subsections provide detailed information about the datasets, recruitment processes, and measures to address potential overlaps in participant responses across the surveys.
2.1. Study Design
The data were drawn from three independent studies:
Study 1 (March 2018–January 2019): Focused on hypothetical stress scenarios involving pet companionship. Participants (n = 313) were assessed using the Social Readjustment Rating Scale (SRRS), the Quality of Life Questionnaire (WHOQOL-BREF), the Sense of Coherence Scale (SoC-29), and the Lexington Attachment to Pets Scale (LAPS) [6].
Study 2 (November 2020–April 2021): Conducted during the COVID-19 pandemic, this survey compared psychosocial outcomes among pet owners and non-owners (n = 285), including quality of life (WHOQOL-BREF) and instruments on psychosocial facets (e.g., UCLA Loneliness Scale, ENRICHD Social Support Inventory, Beck Depression Inventory, etc.), as well as the human–animal bond (LAPS) [7].
Study 3 (September 2021–February 2022): Explored the role of pets in managing chronic stress and health challenges among individuals with Long-COVID (n = 242), using similar bio-psychosocial health measures (e.g., UCLA Loneliness Scale, ENRICHD Social Support Inventory, Beck Depression Inventory, etc.).
The integration of datasets was justified by the consistency in constructs measured across the studies, including stress perception, quality of life, and the human–animal bond. Although not all studies included identical scales, similar psychological constructs and overlapping methodologies validate this approach.
Table 1 provides an overview of the instruments used in each of the three surveys. While the instruments were utilized in the analysis, not all of them were included in every survey. The sample sizes also differ across studies, meaning that comparisons were not always conducted with identical participant groups. This variability has been considered in the interpretation of the results.

Table 1.
Overview of the measurement instruments used in each of the three surveys.
Participants of all three surveys were recruited through a combination of online platforms and community postings, and all three survey test batteries included open and closed questions regarding demographic data, standardized instruments, and open questions on the importance of pet companionship. This consistency in measurement facilitated the integration of datasets, ensuring the validity of comparative analyses. Furthermore, the inclusion of both pre-pandemic and pandemic-era data provided a unique opportunity to explore the effects of external stressors on human–animal relationships.
This research utilized AI tools for writing and editing purposes. Specifically, AI-assisted platforms were employed to enhance language clarity and coherence during the drafting process. These tools supported tasks such as grammar correction, refining sentence structure, and organizing key arguments. This process aligns with MDPI’s ethical guidelines on AI use in academic writing, ensuring that all such contributions are fully transparent and appropriately disclosed.
2.2. Demographic Data
The data collected included demographic information such as gender, age, highest educational attainment, occupation, current residence, nationality, marital status, living arrangement, and details about pet ownership like the species of the animals or the duration of caring for an animal.
The demographic breakdown of the sample showed 79% females (n = 672), 20% males (n = 158), and 1.1% identifying as other (n = 10). The average age of respondents was 37 years (mean = 37.02, SD = 14.13). In terms of marital status, the largest groups were single individuals (31.2%), individuals living in a relationship (30.4%), and married individuals (30.2%), with smaller percentages of participants who were divorced (6.6%) or widowed (1.5%). Educationally, more than one-third of the respondents (38.8%) had completed an undergraduate or graduate degree, while 16% had finished high school and 10.4% had completed an apprenticeship. Concerning living arrangements, 34.8% of the participants reported living with a partner, 20.8% lived alone, and approximately one-quarter (17.1%) lived with both a partner and children. The remaining respondents either lived in a multi-generational household (5.5%), alone with children (3.4%), or in another form of living arrangement. Regarding children, 54% indicated they had no children, 20% had two children, 16.1% had one child, and 9.9% had more than two children. In terms of pet ownership, 66% of respondents during the survey reported having pets, 24.8% did not have any pets, and 9.2% had previously owned pets. The most commonly owned pet was a dog, accounting for 46.2% of pet owners, while 14.4% owned cats, and 36.4% did not specify the type of pet they owned.
To address the ongoing COVID-19 pandemic at the time of the last two surveys, additional queries were made about lockdown measures, quarantine status, COVID-19 infections, and Long-COVID conditions. Specifically, 55% of the participants reported being under strict lockdown restrictions, and 2.4% were in quarantine at the time of the survey. Regarding COVID-19 infection, 42.6% of the respondents indicated they had contracted the virus at some point before the survey, and 50.3% of those infected reported suffering from Long-COVID symptoms during the survey period.
2.3. Standardized Questionnaires
2.3.1. Social Readjustment Rating Scale (SRRS)
The Social Readjustment Rating Scale (SRRS) was used to measure stress levels by assigning scores to major life events based on their potential impact. It was developed in 1967 by Thomas Holmes and Richard Rahe to quantify the stress experienced in response to significant life events and includes a list of 43 life events that necessitate a significant readjustment [18]. Each event on the list is scored on a scale from 0, representing no stress, to 100, indicating enormous stress. Example items on the SRRS include “marriage,” categorized as a normative stressor or challenge, and “death of a spouse,” which is considered a non-normative stressor or loss.
2.3.2. Beck Depression Inventory (BDI-II)
The Beck Depression Inventory (BDI-II) was used to assess the severity of depressive symptoms and attitudes. Each of the 21 items is rated on a 4-point scale from 0 to 3, allowing them to gauge the intensity of depressive symptoms in the participants. This tool is highly reliable (Cronbach alpha of α = 0.92), with strong validity supported by extensive research [19].
Example item “Sadness”: “I do not feel sad” to “I am so sad and unhappy that I can’t stand it”.
2.3.3. Lexington Attachment to Pets Scale (LAPS)
For assessing the emotional bonds between individuals and their pets, the Lexington Attachment to Pets Scale (LAPS) was used. This scale is designed to measure levels of attachment, interaction, and emotional support derived from pets. It has demonstrated good reliability (Cronbach’s alpha = 0.928) and validity across different populations. In this study, a 1–4 scale was chosen instead of a 0–3 scale to avoid the interpretation of “0” as the complete absence of the measured construct. This ensures that even the lowest response category represents a minimal rather than an absolute absence of attachment. Importantly, this adaptation does not affect the statistical analyses, as the intervals between response categories remain identical. To ensure that comparisons with prior studies using a 0–3 scale are interpreted correctly, we have explicitly highlighted this difference in the manuscript [20].
Example statement: “I feel that my dog is part of my family”.
2.3.4. UCLA Loneliness Scale
The UCLA Loneliness Scale was used to measure feelings of loneliness and social isolation. Although various versions exist, they typically feature a set of statements rated on a Likert scale to assess the subjective sense of social connection. These scales are known for their reliability (the internal consistency amounts to α = 0.94) and ability to distinguish between different levels of social satisfaction [21].
Example statement: “I find myself waiting for people to call or write”.
2.3.5. Quality of Life Questionnaire (WHOQOL-BREF)
The WHOQOL-BREF is an abbreviated version of the WHO Quality of Life questionnaire and was used to evaluate the four domains: physical health, psychological health, social relationships, and environmental conditions. With 26 items, this tool is validated globally and renowned for its reliability (internal consistency amounts to α = 0.88) and cross-cultural applicability in assessing life quality [22].
Example question: “How satisfied are you with your ability to perform your activities of daily living”?
2.3.6. Sense of Coherence Scale (SoC-29)
The Sense of Coherence Scale (SOC-29) is central to the Salutogenesis model and was used to assess participants’ resilience and their ability to perceive life as meaningful and manageable, which are critical constructs in understanding how pet ownership interacts with stress during crises. Consisting of 29 items, this scale is effective in predicting how well individuals can cope with stress and maintain health. It is validated for its robustness in assessing stress management and health outcomes, and the internal consistency amounts to α = 0.92 [23].
Example question: “Do you have the feeling that you don’t really care about what goes on around you”?
2.3.7. ENRICHD Social Support Inventory (ESSI)
The Social Support Inventory (ESSI) was used to evaluate the perceived social support from family, friends, and significant others during the COVID-19 pandemic. It features a series of items that evaluate the support level individuals believe they receive, showing strong reliability (Cronbach alpha of α = 0.89) and validity in measuring social support [24].
Example statement: “Is there someone available to you whom you can count on to listen when you need to talk”?
Personal Opinion Regarding the Animals’ Role during a Crisis (e.g., COVID-19 Pandemic).
In the second and third surveys, animal caregivers were invited to openly share their personal perspectives on the human–animal bond during COVID-19. They responded to the prompt: “Please briefly describe what your pet(s) mean(s) to you during the COVID-19 pandemic”.
2.4. Analysis of Quantitative Data
Statistical analyses were conducted using SPSS 29.0 to examine how pet companionship might affect well-being across different groups. Statistical analyses were designed to provide a multi-layered understanding of pet ownership and well-being. First, comparisons between current, former, and non-pet owners in terms of well-being indicators (WHOQOL-BREF and SoC-29) were conducted using ANOVA and t-tests. Second, regression models were applied to examine key predictors influencing well-being outcomes. Finally, a cluster analysis was employed to categorize pet owners based on demographic and psychosocial attributes, revealing distinct participant profiles. The rationale for each method and its relevance to the research questions is detailed in Table 2 below.
Table 2.
Overview of statistical analyses.
For each analysis, the significance level was set at p ≤ 0.05 and Cohen’s d was used as the effect size measure. Not all participants took part in every analysis due to variations in survey design and response completeness. While the total sample size across the three surveys was n = 840, the number of valid cases per analysis varied depending on missing data and the specific variables examined.
2.5. Analysis of Qualitative Data
To provide a more detailed explanation of the qualitative analysis, the subjective importance of pets during a crisis was examined using thematic analysis, following the approach of Braun and Clarke [25,26]. Participants responded to the open-ended prompt: “Please briefly describe what your pet(s) mean(s) to you during the COVID-19 pandemic.”
The analysis aimed to identify recurring patterns and themes in participants’ responses through a systematic coding process. Conducted in a reflexive manner, the approach acknowledged the researcher’s interpretative role in theme development [26]. Given its focus on meaning and personal experiences, thematic analysis was deemed the most suitable method for this study.
To ensure transparency and rigor, Braun and Clarke’s six-phase framework was followed, which is outlined in detail below [18].
Familiarization with the Data: The authors immersed themselves in the dataset, reading and re-reading the open-ended responses to develop a deep understanding of their content. Notes were taken on initial observations and emerging patterns.
Generation of Initial Codes: The data were systematically coded using a data-driven approach. Each meaningful segment of text was labeled with a descriptive code. This step aimed to organize the data into relevant features without losing its richness.
Identification of Themes: Codes were then grouped into potential themes by identifying broader patterns in the data. These themes reflected recurring ideas and constructs related to the role of pets during the pandemic.
Reviewing Themes: The identified themes were critically reviewed and refined to ensure they accurately represented the dataset. Themes were checked for internal coherence, consistency, and distinctiveness from one another.
Defining and Naming Themes: Each theme was clearly defined and named in a way that captured its essence. Subthemes were identified where applicable to provide additional nuance and granularity.
Report Writing: The final step involved synthesizing the analysis into a coherent narrative, which included illustrative quotes from the dataset. This write-up was structured to convey the themes and their relevance to the research question, demonstrating how pets were subjectively important during the crisis.
By using this rigorous and systematic approach, the thematic analysis ensured a thorough exploration of participants’ perceptions of their pets during the COVID-19 pandemic, offering valuable insights into the psychological and emotional significance of pet ownership in times of crisis.
3. Results
3.1. Statistical Analysis
The results are presented in the following sequence:
First, ANOVA and t-tests compare pet ownership groups (current, former, and non-owners) regarding physical, psychological, and social well-being, using measures such as the sense of coherence (SoC-29) and quality of life (WHOQOL-BREF).
Second, regression analyses identify significant sociodemographic and psychosocial predictors of quality of life, considering variables such as loneliness, depression, age, and education.
Third, correlation analyses examine the relationships between the human–animal relationship (LAPS) and quality of life indicators (e.g., depression (BDI-II), loneliness (UCLA Loneliness Scale), and quality of life (WHOQOL-BREF)), providing insights into the strength and direction of associations.
Fourth, two-way ANOVA explores the interaction effects between gender and the number of child human–animal relationship scores (LAPS).
Fifth, pairwise comparisons with Bonferroni correction ensure the precise interpretation of multiple comparisons, particularly in relation to differences in well-being and human–animal bonds across sociodemographic groups.
Finally, k-means cluster analysis categorizes pet owners into distinct subgroups based on their sociodemographic and psychosocial characteristics, offering a deeper understanding of variations in pet ownership experiences and their impact on well-being.
General Analysis of Pet owners’ Wellbeing: Pet Ownership vs. Former Pet Ownership vs. Non-Pet Ownership
To determine the significance of animal companionship in relation to physical, psychological, and social well-being, a comparison was conducted among three groups: “current animal caregivers,” “former animal caregivers,” and “non-animal caregivers,” using the sense of coherence (SoC-29 Scale) and quality of life (WHOQOL-BREF) as metrics. The analysis revealed no significant differences in the sense of coherence across the three groups (F(2, 285) = 0.042, p = 0.959). However, significant differences were identified among the groups concerning quality of life, suggesting that the presence or absence of animal caregiving may influence overall life satisfaction. Table 3 shows the results of these significant calculations.
Table 3.
Results of a one-way ANOVA comparing quality of life (WHOQOL-BREF) across pet ownership groups (current pet owners, former pet owners, non-pet owners; n = 644).
The results of the ANOVA analysis revealed that there was no significant difference in quality of life between individuals with current and former pet ownership (p = 1.0). Similarly, no significant differences were observed when comparing former pet owners to those without any current or former pet ownership (p = 0.216). However, a significant difference in quality of life was found when comparing individuals with current pet ownership to those without any pet ownership, with the latter group reporting a significantly higher quality of life (p = 0.006). Figure 1 demonstrates this difference.

Figure 1.
Mean values of quality of life in pet owners (n = 442) and non-pet owners (n = 118).
To explore these findings further and to identify potential factors influencing pet owners’ well-being, a multivariate regression analysis was conducted, considering relevant variables. These included sociodemographic data such as age, gender, level of education, relationship status, and living situation, as well as psychosocial data such as levels of depressive symptoms, loneliness, and the strength of the human–animal bond. Table 4 represents the results of the multivariate regression analysis.
Table 4.
Multivariate regression model predicting quality of life (WHOQOL-BREF) based on sociodemographic factors, human–animal relationship (LAPS), loneliness (UCLA Loneliness Scale), and depression (BDI-II); n = 405.
Results show that the overall model is statistically significant (F(9, 130) = 24.95, p < 0.001), indicating that the predictors collectively explain a significant portion of the variance in quality of life. The model accounted for approximately 63.3% of the variance in quality of life (R2 = 0.633), with an adjusted R2 of 0.608, suggesting that the model provides a good fit to the data.
Among the predictors, educational level (β = 1.22, p = 0.003), levels of depression (BDI-II) (β = −1.314, p < 0.001), and loneliness scale scores (β = 0.241, p < 0.001) were significant predictors of quality of life (WHOQOL-BREF). Specifically, higher educational levels were associated with better quality of life, while higher depression scores, as well as higher loneliness scores and lower social support scores, were associated with lower quality of life. Other variables, including gender, marital status, living situation, age categories, the strength of the relationship with pets (LAPS), and whether participants had children, were not significant predictors in this model (all p > 0.05). This indicates that these factors may not have a direct impact on the quality of life when controlling for the other variables in the model.
Following the regression analysis, additional analyses were employed using independent-samples t-tests to examine the relationship between pet ownership and mental health outcomes, specifically depression, loneliness, and social support. This approach was used to determine whether pet ownership might be directly associated with differences in these variables.
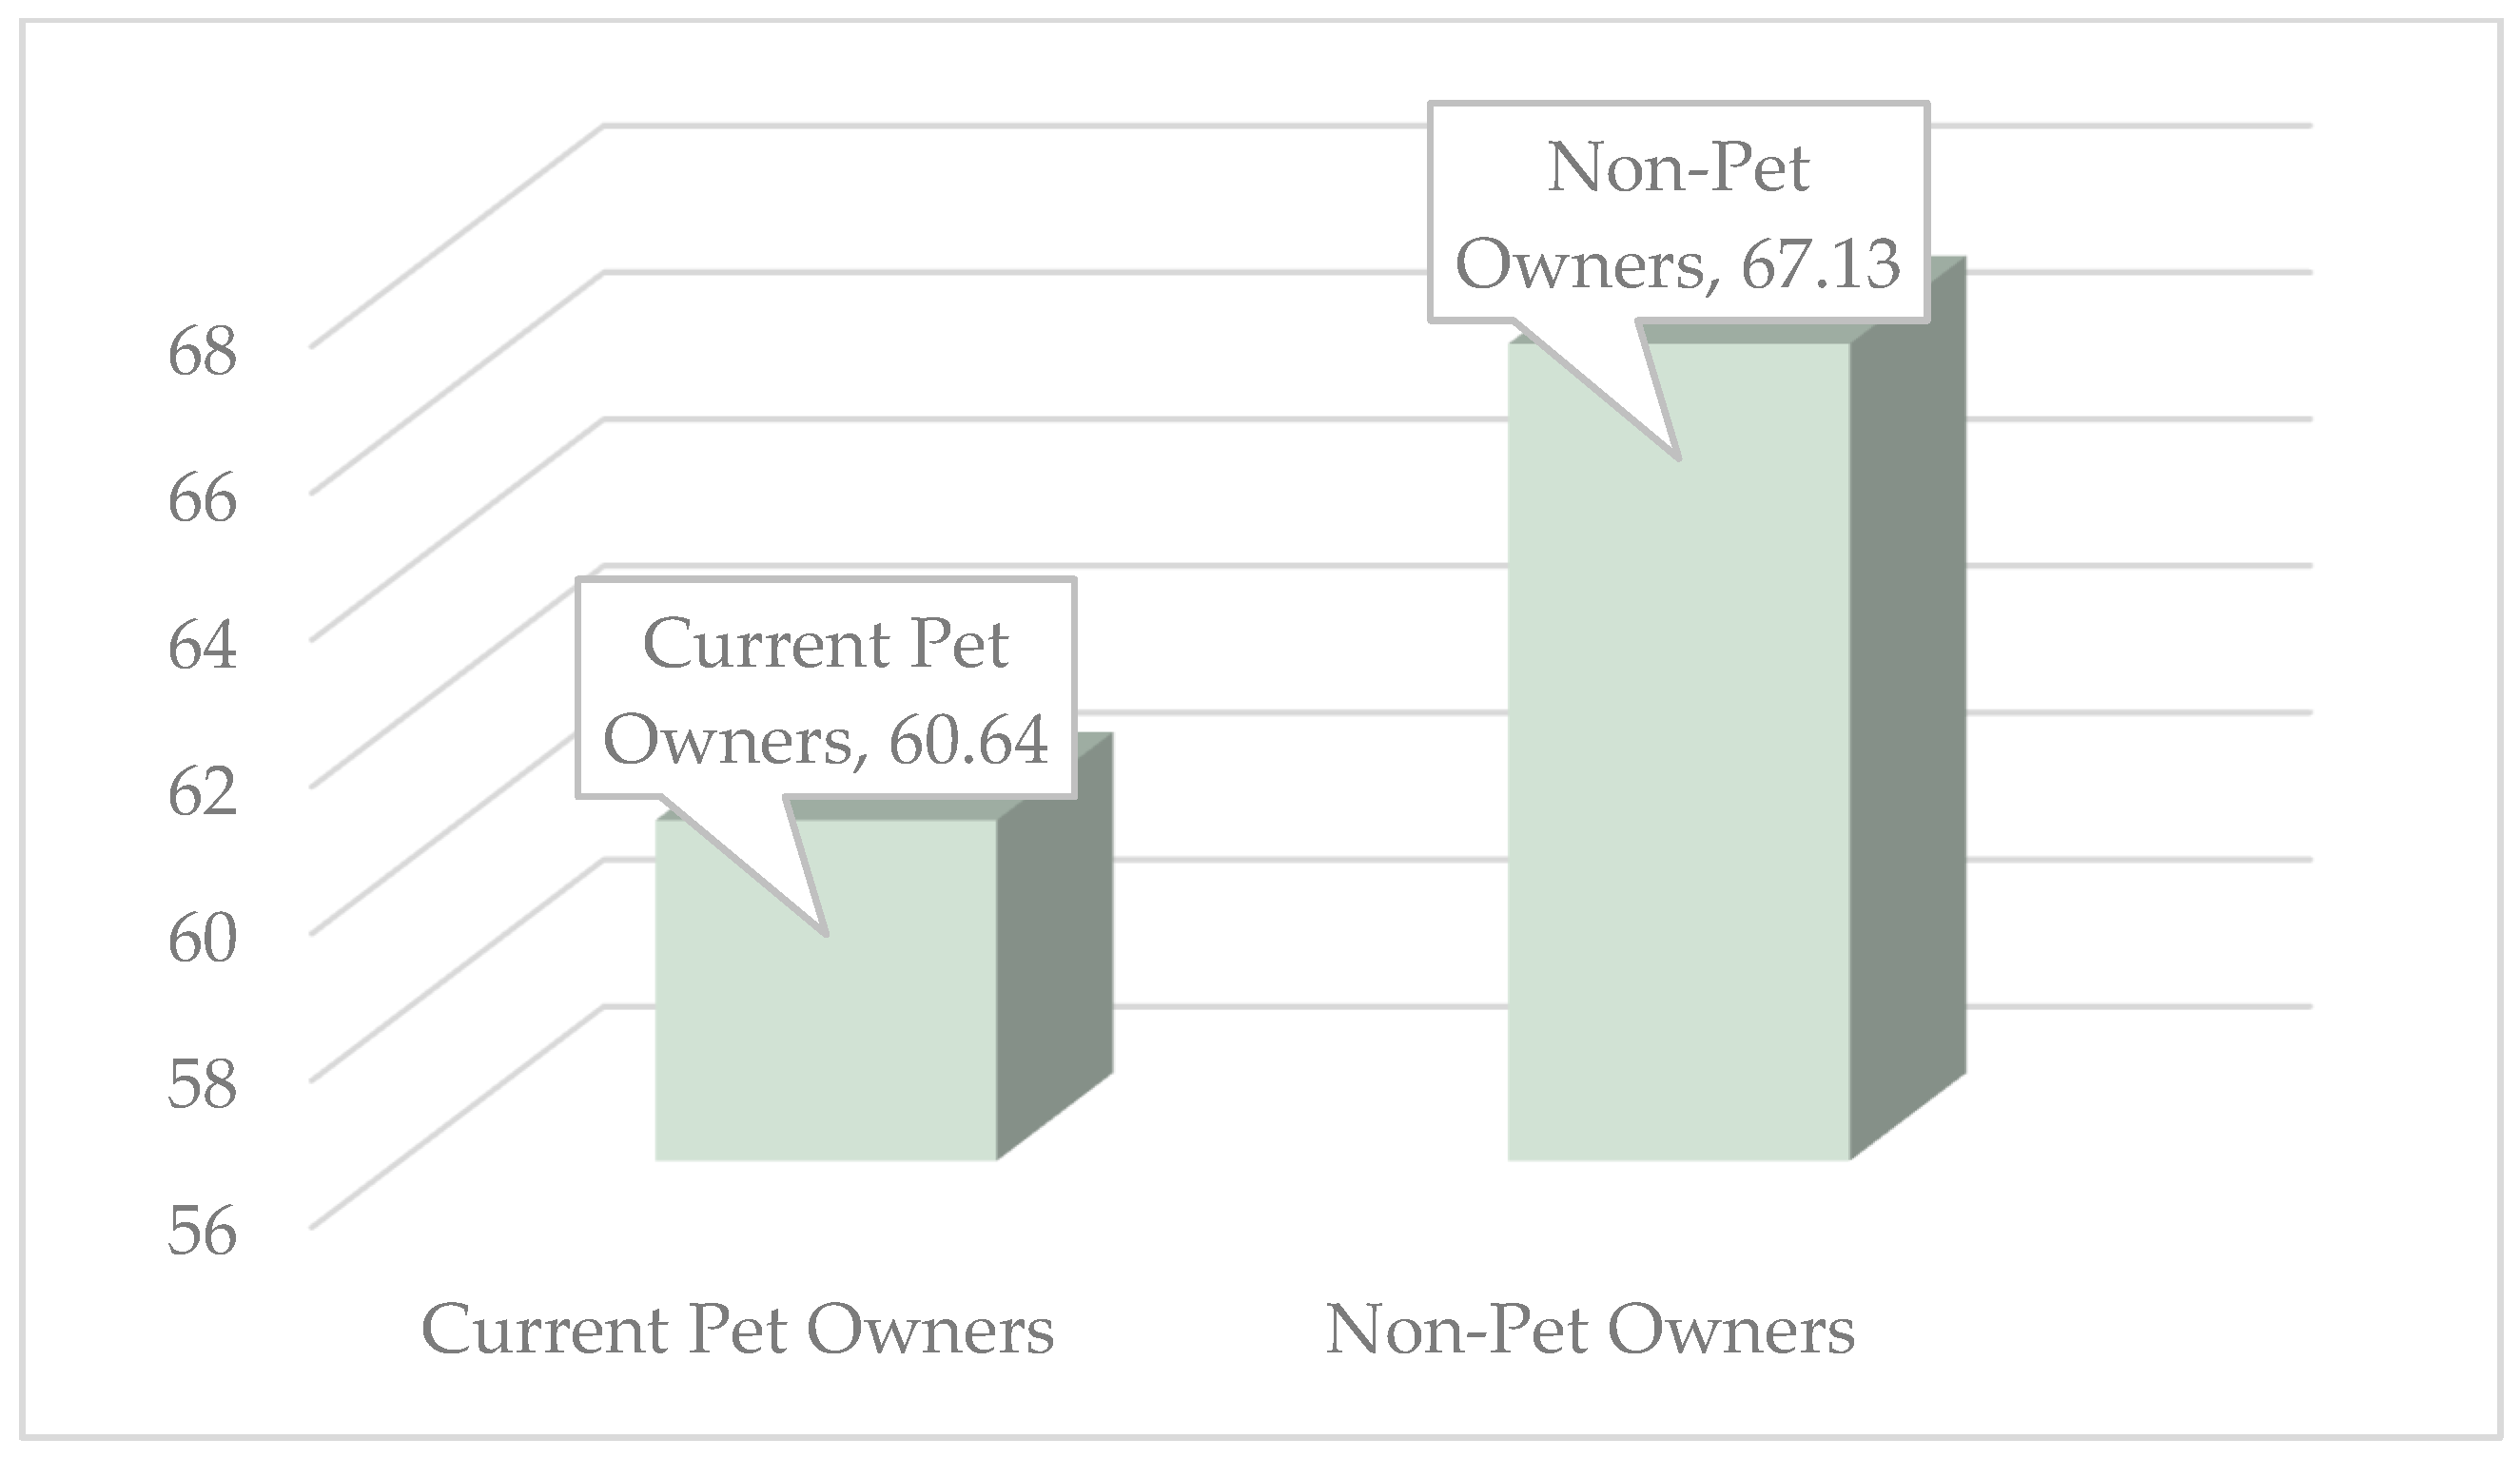
No significant differences were found for loneliness (t(389) = −1.794, p = 0.074) and social support (t(395) = 0.200, p = 0.842). Significant differences were found for level of depression (see Table 5 and Figure 2).
Table 5.
Results of an independent-samples t-test comparing levels of depression (BDI-II) between pet owners (n = 300) and non-pet owners (n = 137).
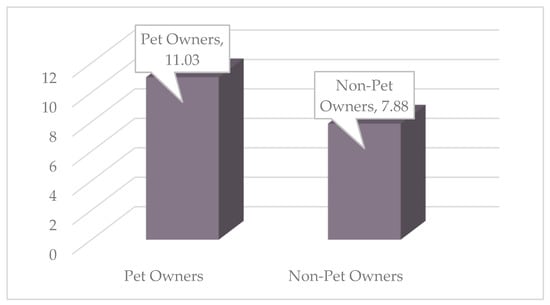
Figure 2.
Mean values of levels of depression (BDI-II) in pet owners (n = 300) and non-pet owners (n = 137).
The t-tests reveal a statistically significant difference between pet owners and non-pet owners regarding levels of depression, suggesting that individuals who own pets tend to report higher levels of depression compared to those who do not own pets.
Specific Analysis of Influencing Factors within the Human–Animal Relationship
As previous findings indicate that pet owners experience lower quality of life and higher psychological distress compared to non-pet owners, it seemed necessary to investigate these findings in more detail. In order to determine the extent to which these results might actually be attributable to the relationship with a pet, and how the pet–owner relationship is associated with the sociodemographic characteristics (age, gender, number of children, living situation, and level of education) of pet owners, a univariate analysis of variance (ANOVA) and a t-test were conducted on these variables. Significant results are presented in Table 6. Since only the categories of male and female pet owners included enough individuals for a statistical comparison, a t-test was conducted to examine the relationship with the animal between these two groups. Table 7 presents the result of the t-test.
Table 6.
Pairwise comparisons (Bonferroni-corrected) examining differences in the human–animal relationship (LAPS); n = 487.
Table 7.
Mean differences between female and male pet owners regarding the relationship to the animal (LAPS).
Several pairwise comparisons showed no significant differences. Regarding the number of children, there were no significant differences between having one child and two children (p = 1.000), between having one child and more than two children (p = 1.000), or between having two children and more than two children (p = 1.000). In terms of the living situation, no significant differences were found between pet owners living alone compared to pet owners living with parents (p = 1.000), living in a shared apartment (p = 1.000), living with a partner (p = 1.000), living alone with children (p = 1.000), living in a multi-generational house (p = 1.000), or other living arrangements (p = 1.000). Similarly, living with parents did not significantly differ from living in a shared apartment (p = 1.000), living with a partner (p = 1.000), living with a partner and children (p = 0.147), living alone with children (p = 1.000), living in a multi-generational house (p = 1.000), or other living arrangements (p = 1.000). No significant differences were observed between living in a shared apartment and living with a partner (p = 1.000), living with a partner and children (p = 1.000), living alone with children (p = 1.000), living in a multi-generational house (p = 1.000), or other living arrangements (p = 1.000). Additionally, living with a partner did not significantly differ from living with a partner and children (p = 0.001), living alone with children (p = 1.000), living in a multi-generational house (p = 1.000), or other living arrangements (p = 1.000). Regarding marital status, no significant differences were found between married and single individuals (p = 0.930), married and widowed individuals (p = 1.000), single and in a relationship (p = 1.000), single and divorced individuals (p = 0.352), single and widowed individuals (p = 1.000), in a relationship and divorced individuals (p = 1.000), in a relationship and widowed individuals (p = 1.000), or between divorced and widowed individuals (p = 1.000). Finally, no significant differences were found between any of the age categories (15–24 years, 25–34 years, 35–50 years, 51–69 years, and 70–100 years) in the subjective experienced relationship with the animal.
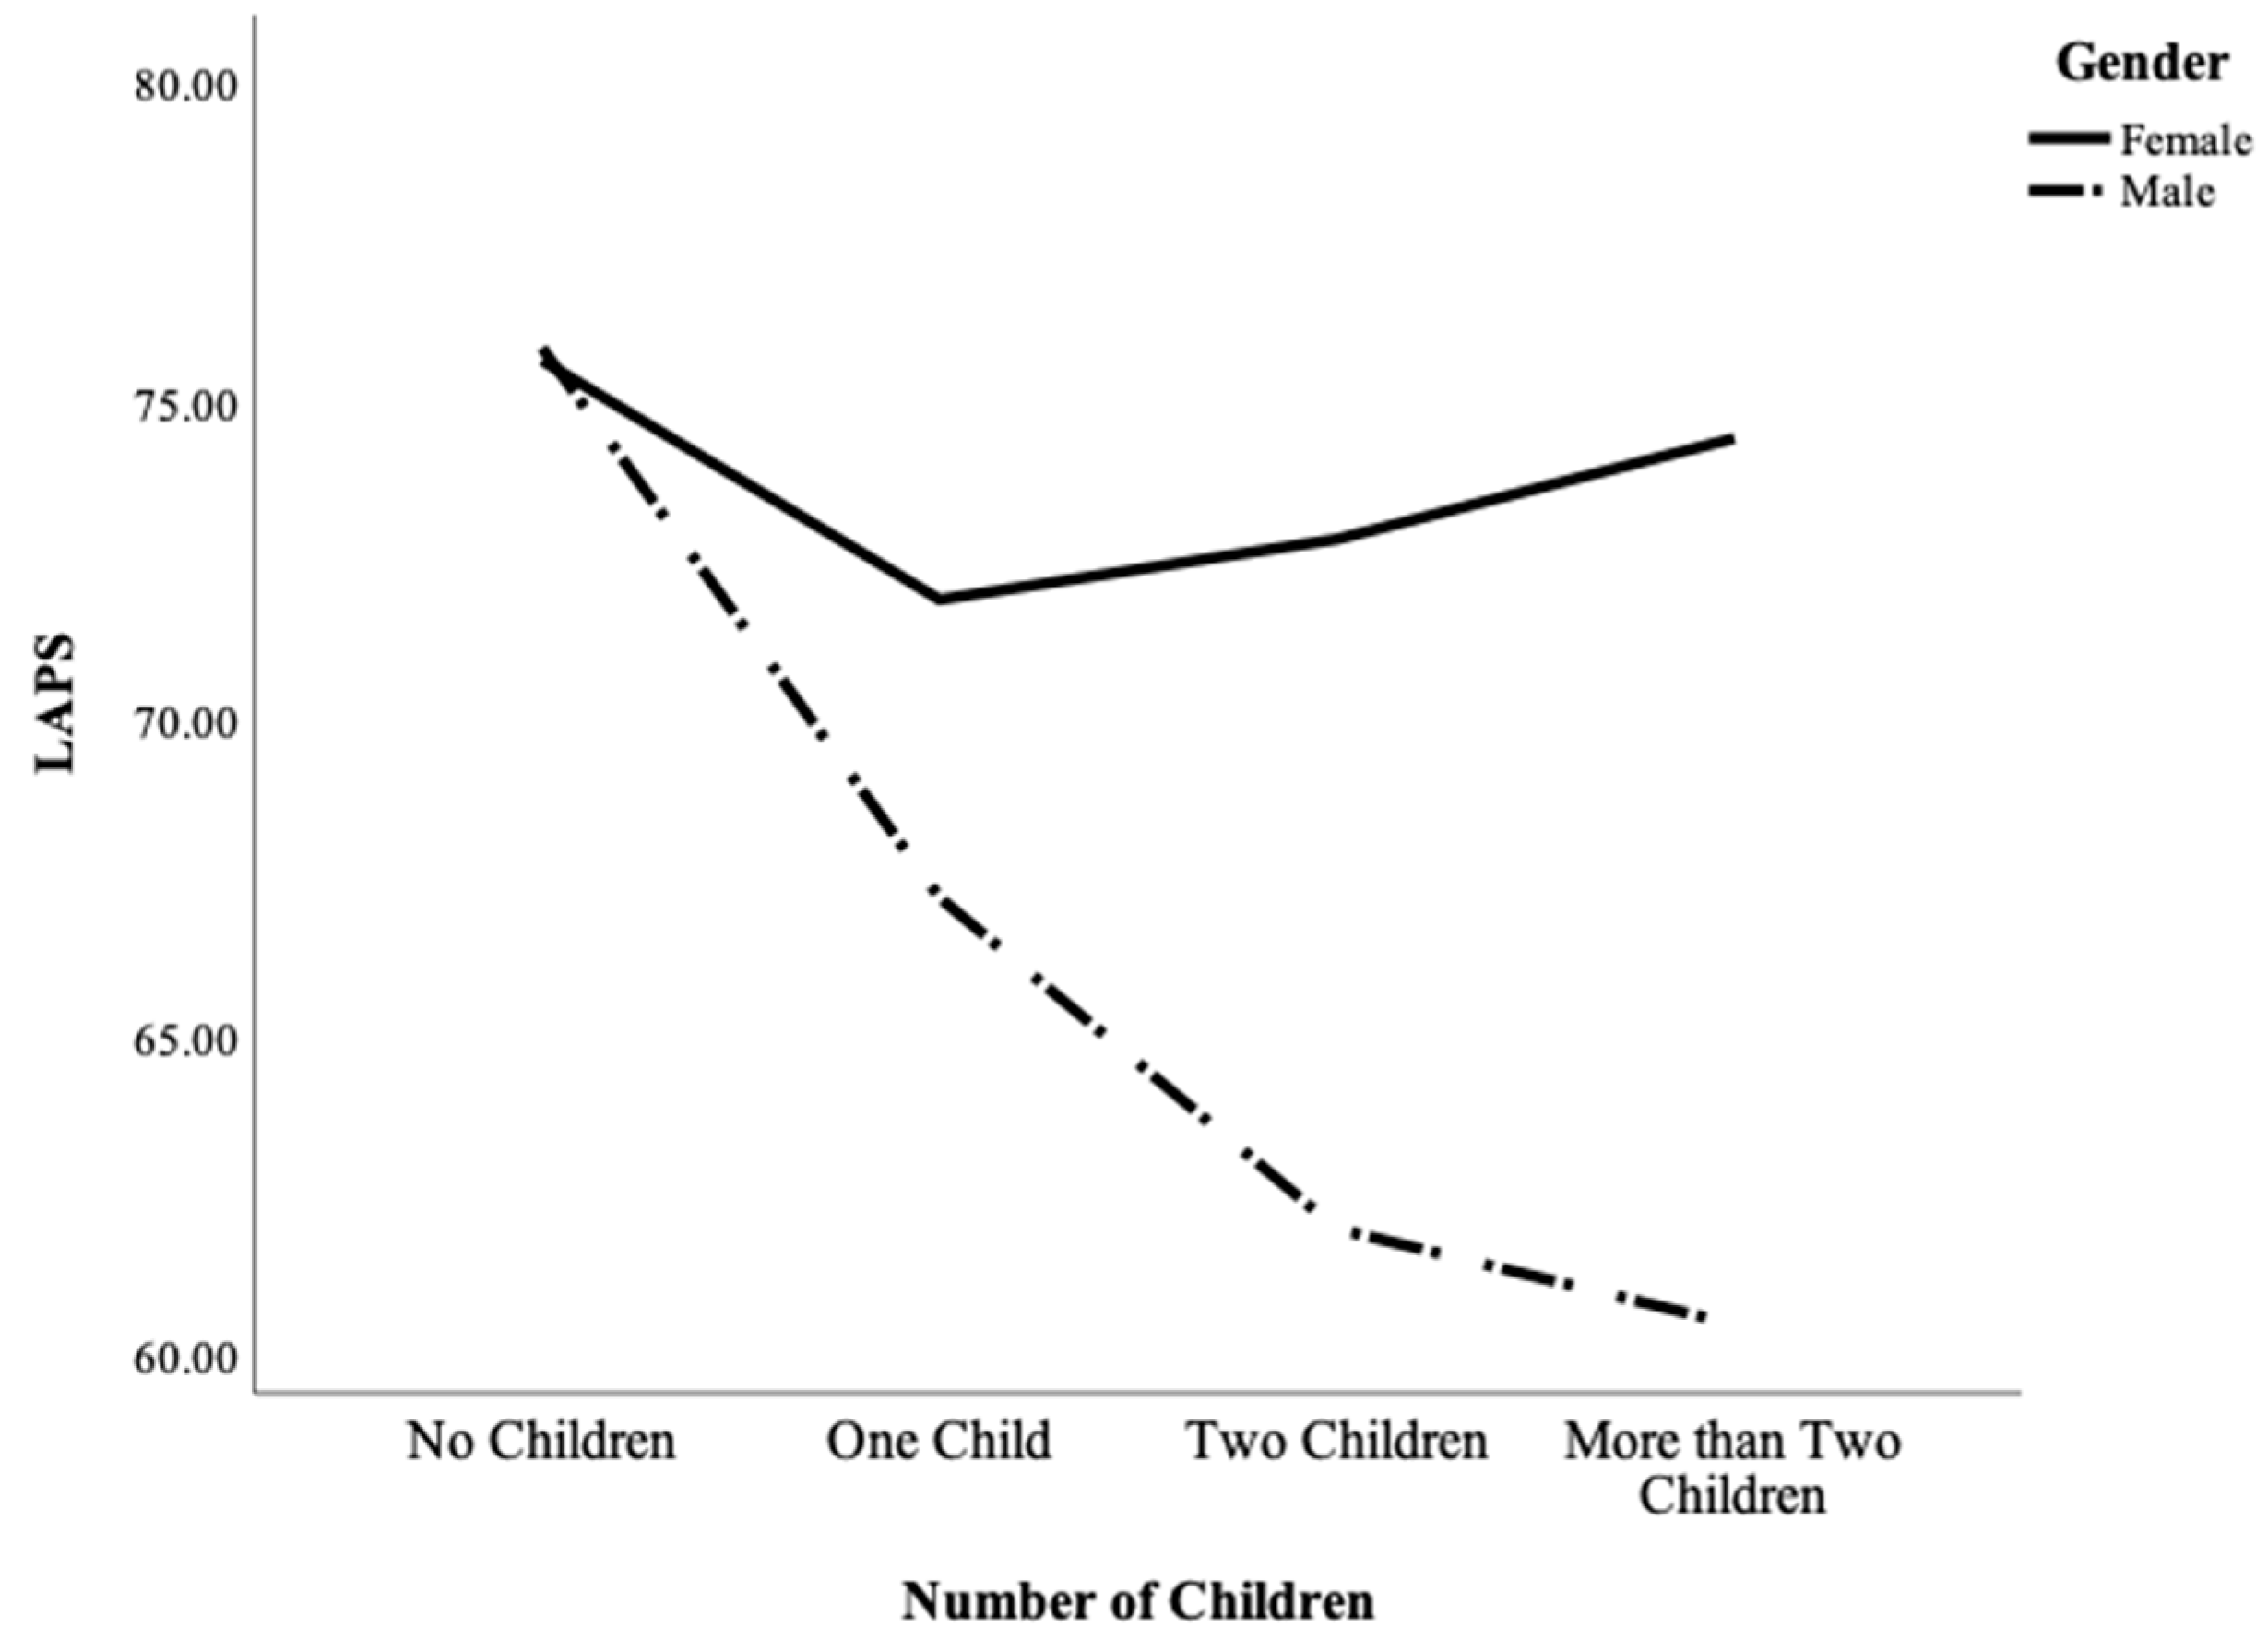
Additionally, a two-way ANOVA was conducted to examine possible effects between the variables. The analysis revealed a highly significant interaction effect between gender and the number of children (F(1, 208) = 13.71, p = 0.001, η2 = 0.90). This interaction indicates that the effect of the number of children on the LAPS scores differs depending on the gender of the participants. Results are presented in Figure 3.
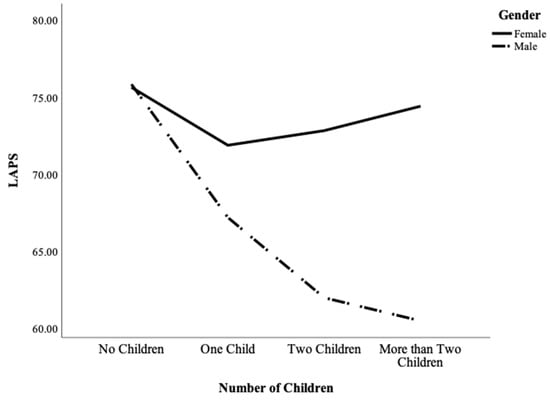
Figure 3.
Results of a two-way ANOVA investigating the interaction between gender (female: n = 330; male: n = 63) and number of children (no children: n = 201; one child: n = 68; two children: n = 76; more than two children: n = 48) on the relationship to an animal (Lexington Attachment to Pets Scale, LAPS).
Following the previous analyses, which identified differences in quality of life and depression levels between pet owners and non-pet owners, correlations were conducted between these mental health parameters and the relationship with the pet (LAPS) to explore any potential associations. Results are presented in Table 8.
Table 8.
Spearman correlation between the relationship with an animal (LAPS), quality of life (WHOQOL-BREF), loneliness (UCLA Loneliness Scale), depression (BDI-II), and social support (ESSI).
To obtain a differentiated picture of animal companionship and relevant sociodemographic and psychosocial data, a k-means cluster analysis was conducted to group pet owners based on these variables. The elbow method was used to determine the optimal number of clusters, suggesting a two-cluster solution as the best fit. This selection balanced model complexity and explained variance. The analysis converged after four iterations. Results are demonstrated in Table 9.
Table 9.
Final cluster centers.
Convergence was achieved as the maximum change in the cluster centers during the last iteration was 0.000. The minimum distance between the initial centers was 83.738.
3.2. Qualitative Analysis
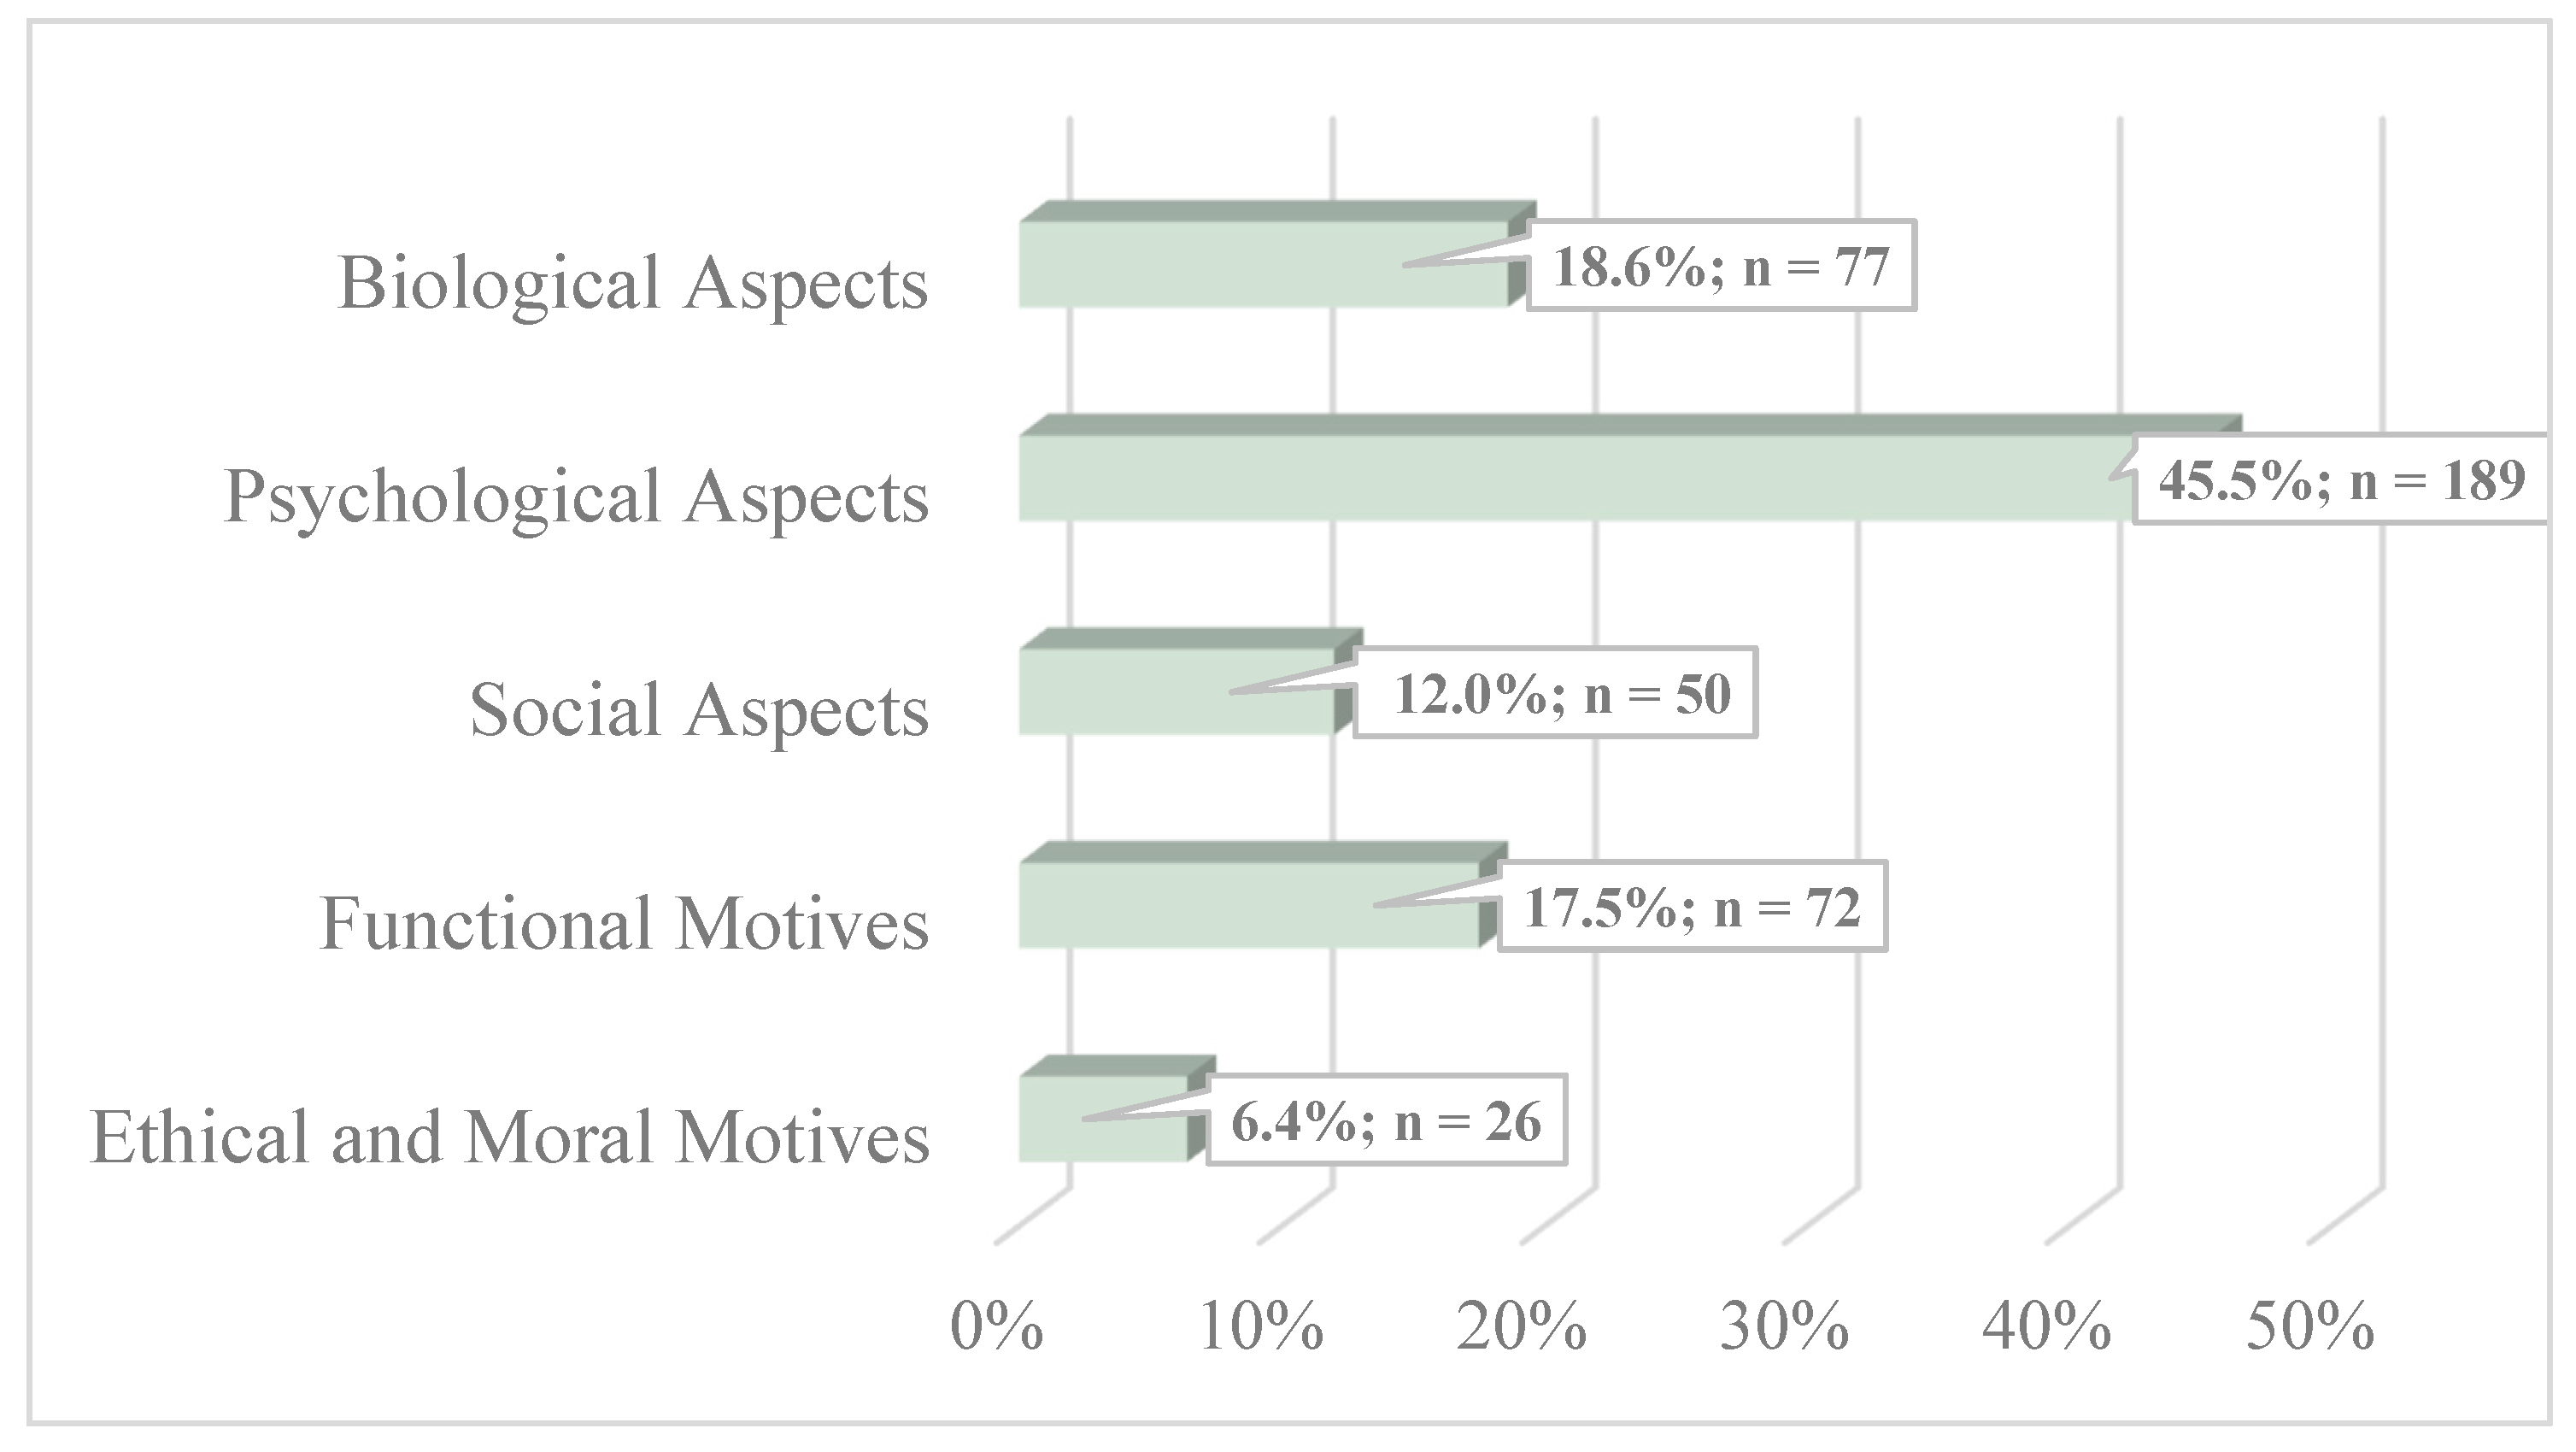
Open-ended statements were analyzed using thematic analysis according to Braun and Clark (2006). The analysis resulted in a five-part classification that addressed the individually experienced meaning of the human–animal bond in terms of the biological, psychological, and social aspects, as well as functional and ethical motives within pet companionship. The frequency of the related content was then analyzed. Table 10 shows the main themes and sub-themes after analysis of the identified data, and Figure 4 shows the frequency analysis in percentages.
Table 10.
Classification of thematic analysis.
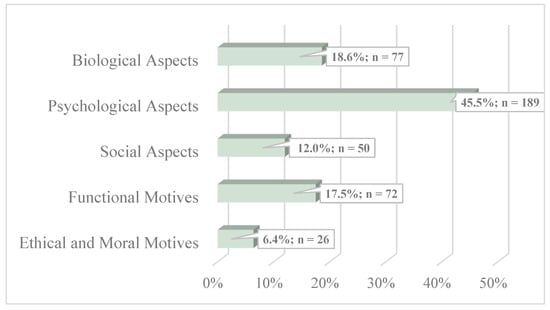
Figure 4.
Frequency analysis of theme-specific statements in percentages (n = 414).
4. Discussion
This study provides valuable insights into the nuanced and sometimes paradoxical effects of pet ownership on human well-being, especially during times of heightened stress, such as the COVID-19 pandemic. Central to the findings is the concept of the “pet-effect paradox” [4], which highlights a discrepancy between quantitative measures and qualitative perceptions regarding the human–animal bond. In line with recent studies (e.g., [9,27]), the present quantitative data indicate that pet companionship may correlate with increased stress, a lower quality of life, and higher depression scores. Non-pet owners reported consistently higher quality of life and lower depression levels compared to pet owners. This aligns with the findings of Martins et al. [28], who concluded that while pet ownership positively influences physical activity levels, it does not significantly impact mental health when compared to non-pet owners. Similar conclusions were drawn by Scoresby et al. [17], whose systematic review of 41 studies found that only 17 reported positive effects of pet ownership on mental health, whereas others showed no significant differences or even negative effects.
In contrast, qualitative data from open-ended responses show that pet owners often view their animals as essential sources of comfort and emotional support, especially during challenging times. Many participants described their pets as companions that bring structure, responsibility, and stress relief into their lives. This subjective appreciation of pets, despite quantitative indicators of increased stress, illustrates the “pet-effect paradox” [4] and raises questions about the limitations of traditional metrics in fully capturing perceived benefits from pet companionship.
These findings resonate with the aforementioned concept of the “Aunty Phenomenon” and suggest that interactions with pets are often idealized, focusing on enjoyment rather than the broader responsibilities that pet ownership entails. This dynamic also aligns with findings from animal-assisted interventions (AAIs), where participants often gain positive experiences without the responsibility of long-term caregiving [4]. Research by Rodriguez et al. [12] supports this notion, showing that while temporary pet interactions provide measurable well-being benefits, long-term ownership introduces additional stress factors, which are often underestimated. However, our findings suggest that this simplified view may overlook important dimensions of the human–animal bond, emphasizing the need to explore the complex interplay of factors that influence pet ownership.
A closer look at the data reveals that mental health factors, such as depressive symptoms and loneliness, are stronger predictors for well-being than the strength of the relationship to the concurrent pet. Although correlation analysis shows a positive association between the strength of the relationship and loneliness or depression, regression analysis indicates that pet attachment itself as measured with the described scale is not a direct predictor of well-being. This discrepancy stems from methodological differences: correlation analysis measures the direct association between two variables, while regression analysis controls additional variables like depression and loneliness. This suggests that subjective attachment to our companion animals may influence well-being indirectly, primarily through its relationship with mental health factors, hinting at a mediating role of mental health in the impact of the human–animal bond on quality of life. Previous studies (e.g., [29]) have highlighted similar findings, suggesting that instruments like the UCLA Loneliness Scale may not be sensitive enough to detect nuanced effects of pet ownership.
The complexity of this relationship is further illustrated through sociodemographic interactions. Interaction analysis reveals that sociodemographic factors, such as gender and the number of children, influence pet attachment. Both men and women report weaker bonds with their pets as family responsibilities increase, particularly in households with multiple children. Cluster analysis supports these findings, showing that mental health variables, rather than demographic characteristics, primarily shape relationship strength. Stronger relationships are often associated with lower life quality and social support, along with elevated depression and loneliness scores. Similar findings were reported by Powell et al. [30], who suggested that while pet attachment can serve as a coping mechanism, it may also indicate underlying vulnerabilities in psychological resilience.
Overall, the findings highlight the “Aunty Phenomenon” as a powerful framework that challenges assumptions about the universal benefits of the human–animal bond. While the general premise that responsibilities, including pet care, can increase stress holds true, the data reveal additional layers beneath this primary effect. Factors such as mental health, family dynamics, and subjective reality construction significantly shape how individuals perceive their pets. This layered complexity suggests that people may, perhaps unconsciously, construct a reality where pets are seen as sources of support, even when quantitative measures suggest potential drawbacks. This phenomenon aligns with concepts in social psychology, such as self-perception theory [31], where individuals may attribute positive qualities to pets as part of a coping mechanism or to create a sense of companionship under stress [12].
Furthermore, this study underscores the limitations of cross-sectional designs and self-reported measures. While the results provide important insights, longitudinal research is needed to better understand the causal dynamics of the human–animal bond over time. At this point it is essential to highlight that these findings are correlational rather than causal. It remains unclear whether pet ownership contributes to a lower quality of life or whether individuals with pre-existing lower well-being are more likely to acquire pets as a coping mechanism. This bidirectional possibility should be considered when interpreting the results, as it may further explain the discrepancies observed in quantitative versus qualitative measures.
Additionally, the role of cultural and contextual factors in shaping pet–owner interactions remains underexplored, and future studies should seek to include diverse populations to capture a broader spectrum of experiences. In this context, previous meta-analyses (e.g., [17]) have emphasized that variations in cultural attitudes toward pet ownership may contribute to the mixed findings in this field, highlighting the importance of cross-cultural comparisons in future studies.
The qualitative component of this study enriches the findings by offering a nuanced perspective on how pets are perceived during crises. Thematic analysis identified key patterns, such as emotional support, companionship, and the establishment of routines, highlighting both the positive and challenging aspects of pet ownership. While many participants emphasized the stress-relieving roles of their pets, others noted increased caregiving demands and financial burdens, underscoring the dual nature of these relationships. By integrating these qualitative insights, the study provides a more holistic understanding of the human–animal bond.
In conclusion, this research illustrates that the “Aunty Phenomenon” serves as a valuable conceptual tool for understanding the complexities of human–animal relationships, but it does not capture the full spectrum of these interactions. Future studies should prioritize experimental approaches and diverse methodologies to uncover the underlying mechanisms driving the “pet-effect paradox” and inform strategies for optimizing the benefits of pet ownership for both humans and animals.
5. Conclusions
This study contributes significantly to the understanding of the complexities of the human–animal bond, particularly under challenging circumstances such as the COVID-19 pandemic. A key strength of the research is its mixed-methods approach, which integrates both quantitative and qualitative data to provide a holistic perspective. The use of validated psychometric tools like the WHOQOL-BREF and Lexington Attachment to Pets Scale (LAPS) ensures the reliability of the findings. Moreover, the large and diverse sample size enhances the generalizability of the results.
Key findings of this study highlight that pet ownership is not universally associated with improved well-being. Quantitative results indicate that pet owners tend to report higher levels of stress, depression, and loneliness compared to non-pet owners. However, qualitative data suggest that many pet owners perceive their pets as a significant source of emotional support and structure in their lives, illustrating the “pet-effect paradox”. Additionally, regression analyses reveal that mental health variables, such as depressive symptoms and loneliness, play a stronger role in predicting well-being than pet attachment itself. These results suggest that pets may serve as coping mechanisms rather than direct determinants of well-being. Furthermore, sociodemographic interactions show that responsibilities, including pet care, may exacerbate stress, particularly in households with multiple caregiving obligations.
However, there are limitations that must be acknowledged. First, the cross-sectional design restricts the ability to infer causal relationships between pet ownership and well-being. While our findings indicate a correlation between pet ownership and lower quality of life, increased depression, and loneliness, this relationship does not imply causation. It is possible that individuals with stronger emotional bonds to their pets perceive a positive influence from them, even if their overall well-being scores are lower. Pets may serve as emotional support systems, helping their owners cope with existing mental health challenges rather than causing them. This aligns with research suggesting that perceived benefits of pet companionship may be subjective and influenced by individual circumstances [32]. Additionally, age-related factors such as increased loneliness and life transitions (e.g., children leaving home) may contribute to the observed patterns. Older adults and individuals living alone may form deeper attachments to their pets, using them as a primary source of emotional support [33,34]. Future research should explore whether pet ownership moderates or mitigates these life stage-related psychological effects, rather than assuming a direct causal link between pet companionship and reduced well-being. In this context, longitudinal studies would provide more robust evidence for temporal dynamics in these relationships. Third, the self-reported nature of the data may introduce biases such as social desirability or recall errors. Additionally, cultural and contextual factors influencing the human–animal bond were not deeply explored, limiting the applicability of findings across diverse populations.
Future studies incorporating a more diverse range of participants, including those from varying cultural and socioeconomic backgrounds, would provide greater insight into the universality or specificity of the findings. Furthermore, experimental designs examining specific interventions, such as animal-assisted therapy, could elucidate pathways for optimizing the human–animal bond.
Author Contributions
Conceptualization, C.S. and B.U.S.; methodology, C.S. software, C.S. and B.U.S.; validation, C.S. and B.U.S.; formal analysis, C.S.; investigation, C.S.; resources, B.U.S.; data curation, C.S. and B.U.S.; writing—original draft preparation, C.S.; writing—review and editing, B.U.S.; visualization, C.S.; supervision, B.U.S.; project administration, B.U.S. All authors have read and agreed to the published version of the manuscript.
Funding
This research received no external funding.
Institutional Review Board Statement
The study was conducted in accordance with the Declaration of Austria, and approved by the Ethics Commission of the Faculty Psychotherapy Science and Faculty of Psychology of the Sigmund Freud University Vienna (protocol code SBHVGD9RAGUFC887564, July 2019).
Informed Consent Statement
Informed consent was obtained from all subjects involved in the study.
Data Availability Statement
Data are contained within the article.
Acknowledgments
The authors used Open AI’s ChatGPT- 4o for assistance in proofreading and refining the manuscript. The authors take full responsibility for the final content of the article.
Conflicts of Interest
The authors declare no conflicts of interest.
References
- Allen, K. Are pets a healthy pleasure? The influence of pets on blood pressure. Curr. Dir. Psychol. Sci. 2003, 12, 236–239. [Google Scholar] [CrossRef]
- McNicholas, J.; Collis, G. Animals as social supports: Insights for understanding animal-assisted therapy. In Handbook on Animal-Assisted Therapy: Theoretical Foundations and Guidelines for Practice, 2nd ed.; Fine, A.H., Ed.; Academic Press: Cambridge, MA, USA, 2006; pp. 49–71. [Google Scholar]
- Wells, D.L. The effects of animals on human health and well-being. J. Soc. Issues 2009, 65, 523–543. [Google Scholar] [CrossRef]
- Herzog, H. The “Pet-Effect” Paradox: Are Pets Really Good for People? Psychology Today. 9 September 2021. Available online: https://www.psychologytoday.com (accessed on 18 February 2025).
- Applebaum, J.W.; MacLean, E.L.; McDonald, S.E. Love, fear, and the human-animal bond: On adversity and multispecies relationships. Compr. Psychoneuroendocrinol. 2021, 7, 100071. [Google Scholar] [CrossRef] [PubMed]
- Applebaum, J.W.; Tomlinson, C.A.; Matijczak, A.; McDonald, S.E.; Zsembik, B.A. The Concerns, Difficulties, and Stressors of Caring for Pets during COVID-19: Results from a Large Survey of U.S. Pet Owners. Animals 2020, 10, 1882. [Google Scholar] [CrossRef]
- Ratschen, E.; Shoesmith, E.; Shahab, L.; Silva, K.; Kale, D.; Toner, P.; Mills, D.S. Human-animal relationships and interactions during the COVID-19 lockdown phase in the UK: Exploring links with mental health and loneliness. PLoS ONE 2020, 15, e0239397. [Google Scholar] [CrossRef]
- Kuehne, J.; Lieu, J.; Kotera, Y.; Taylor, E. Pets’ impact on people’s well-being in COVID-19: A quantitative study. J. Concurr. Disord. 2022. Available online: https://www.researchgate.net/profile/Yasuhiro-Kotera/publication/363663357_Pets’_impact_on_peoples_well-being_in_COVID-19_A_quantitative_study/links/6328d67d071ea12e364684ff/Pets-impact-on-people-s-well-being-in-COVID-19-A-quantitative-study.pdf (accessed on 20 February 2025).
- Mueller, M.K.; Richer, A.M.; Callina, K.S.; Charmaraman, L. Companion Animal Relationships and Adolescent Loneliness during COVID-19. Animals 2021, 11, 885. [Google Scholar] [CrossRef] [PubMed]
- Wells, D.L.; Clements, M.A.; Elliott, L.J.; Meehan, E.S.; Montgomery, C.J.; Williams, G.A. Quality of the Human–Animal Bond and Mental Wellbeing During a COVID-19 Lockdown. Anthrozoös 2022, 35, 847–866. [Google Scholar] [CrossRef]
- Grajfoner, D.; Ke, G.N.; Wong, R.M.M. The Effect of Pets on Human Mental Health and Wellbeing during COVID-19 Lockdown in Malaysia. Animals 2021, 11, 2689. [Google Scholar] [CrossRef] [PubMed]
- Rodriguez, K.E.; Herzog, H.; Gee, N.R. Variability in human-animal interaction research. Front. Vet. Sci. 2021, 7, 619600. [Google Scholar] [CrossRef]
- Krouzecky, C.; Emmett, L.; Klaps, A.; Aden, J.; Bunina, A.; Stetina, B.U. And in the middle of my chaos there was you?—Dog companionship and its impact on the assessment of stressful situations. Int. J. Environ. Res. Public Health 2019, 16, 3664. [Google Scholar] [CrossRef]
- Krouzecky, C.; Aden, J.; Bunina, A.; Hametner, K.; Klaps, A.; Kovacovsky, Z.; Ruck, N.; Stetina, B.U. “My companion through the pandemic”: The importance of the human-animal bond during COVID-19. People Anim. Int. J. Res. Pract. 2022, 5, 13. [Google Scholar]
- Krouzecky, C.; Aden, J.; Hametner, K.; Klaps, A.; Kovacovsky, Z.; Stetina, B.U. Fantastic beasts and why it is necessary to understand our relationship—Animal companionship under challenging circumstances using the example of Long-COVID. Animals 2022, 12, 1892. [Google Scholar] [CrossRef] [PubMed]
- Ellis, A.; Hawkins, R.D.; Stanton, S.C.E.; Loughnan, S. The Association Between Companion Animal Attachment and Depression: A Systematic Review. Anthrozoös 2024, 37, 1067–1105. [Google Scholar] [CrossRef]
- Scoresby, K.J.; Strand, E.B.; Ng, Z.; Brown, K.C.; Stilz, C.R.; Strobel, K.; Barroso, C.S.; Souza, M. Pet Ownership and Quality of Life: A Systematic Review of the Literature. Vet. Sci. 2021, 8, 332. [Google Scholar] [CrossRef] [PubMed]
- Holmes, T.H.; Rahe, R.H. The social readjustment rating scale. J. Psychosom. Res. 1967, 11, 213–218. [Google Scholar] [CrossRef]
- Beck, A.T.; Steer, R.A.; Brown, G.K. Manual for the Beck Depression Inventory-II; Psychological Corporation: San Antonio, TX, USA, 1996. [Google Scholar]
- Johnson, T.P.; Garrity, T.F.; Stallones, L. Psychometric evaluation of the Lexington attachment to pets scale (LAPS). Anthrozoös 1992, 5, 160–175. [Google Scholar] [CrossRef]
- Russell, D.W. UCLA Loneliness Scale (Version 3): Reliability, validity, and factor structure. J. Personal. Assess. 1996, 66, 20–40. [Google Scholar] [CrossRef] [PubMed]
- World Health Organization. The World Health Organization Quality of Life Assessment (WHOQOL): Development and general psychometric properties. Soc. Sci. Med. 1998, 46, 1569–1585. [Google Scholar] [CrossRef] [PubMed]
- Antonovsky, A. The structure and properties of the sense of coherence scale. Soc. Sci. Med. 1993, 36, 725–733. [Google Scholar] [CrossRef]
- Mitchell, P.H.; Powell, L.; Blumenthal, J.; Norten, J.; Ironson, G.; Pitula, C.R.; Froelicher, E.S.; Czajkowski, S.; Youngblood, M.; Huber, M.; et al. A short social support measure for patients recovering from myocardial infarction: The ENRICHD social support inventory. J. Cardiopulm. Rehabil. Prev. 2003, 23, 398–403. [Google Scholar] [CrossRef]
- Braun, V.; Clarke, V. Using thematic analysis in psychology. Qual. Res. Psychol. 2006, 3, 77–101. [Google Scholar] [CrossRef]
- Clarke, V.; Braun, V. Teaching thematic analysis: Overcoming challenges and developing strategies for effective learning. Psychol. 2013, 26, 120–123. [Google Scholar]
- Phillipou, A.; Tan, E.; Toh, W.; Van Rheenen, T.; Meyer, D.; Neill, E.; Sumner, P.; Rossell, S. Pet ownership and mental health during COVID-19 lockdown. Aust. Vet. J. 2021, 99, 423–426. [Google Scholar] [CrossRef] [PubMed]
- Martins, C.F.; Soares, J.P.; Cortinhas, A.; Silva, L.; Cardoso, L.; Pires, M.A.; Mota, M.P. Pet’s influence on humans’ daily physical activity and mental health: A meta-analysis. Front. Public Health 2023, 11, 1196199. [Google Scholar] [CrossRef]
- Gilbey, A.; Tani, K. Pets and loneliness: Examining the efficacy of a popular measurement instrument. Anthrozoös 2020, 33, 529–546. [Google Scholar] [CrossRef]
- Powell, L.; Edwards, K.M.; McGreevy, P.; Bauman, A.; Podberscek, A.; Neilly, B.; Sherrington, C.; Stamatakis, E. Companion dog acquisition and mental well-being: A community-based three-arm controlled study. BMC Public Health 2019, 19, 1428. [Google Scholar] [CrossRef] [PubMed]
- Bem, D.J. Self-perception theory. Adv. Exp. Soc. Psychol. 1972, 6, 1–62. [Google Scholar]
- Brooks, H.L.; Rushton, K.; Lovell, K.; Bee, P.; Walker, L.; Grant, L.; Rogers, A. The power of support from companion animals for people living with mental health problems: A systematic review and narrative synthesis of the evidence. BMC Psychiatry 2018, 18, 31. [Google Scholar] [CrossRef] [PubMed]
- Stanley, I.H.; Conwell, Y.; Bowen, C.; Van Orden, K.A. Pet ownership may attenuate loneliness among older adult primary care patients who live alone. Aging Ment. Health 2014, 18, 394–399. [Google Scholar] [CrossRef] [PubMed] [PubMed Central]
- Kretzler, B.; König, H.H.; Hajek, A. Pet ownership, loneliness, and social isolation: A systematic review. Soc. Psychiatry Psychiatr. Epidemiol. 2022, 57, 1935–1957. [Google Scholar] [CrossRef] [PubMed] [PubMed Central]

Disclaimer/Publisher’s Note: The statements, opinions and data contained in all publications are solely those of the individual author(s) and contributor(s) and not of MDPI and/or the editor(s). MDPI and/or the editor(s) disclaim responsibility for any injury to people or property resulting from any ideas, methods, instructions or products referred to in the content. |
© 2025 by the authors. Licensee MDPI, Basel, Switzerland. This article is an open access article distributed under the terms and conditions of the Creative Commons Attribution (CC BY) license (https://creativecommons.org/licenses/by/4.0/).