Performance Assessment of Five Different Soil Moisture Sensors under Irrigated Field Conditions in Oklahoma

 ,
,  ,
,
Abstract
:1. Introduction
2. Materials and Methods
2.1. Sensor Description
2.1.1. TDR315
2.1.2. CS655
2.1.3. GS1
2.1.4. SM100
2.1.5. CropX
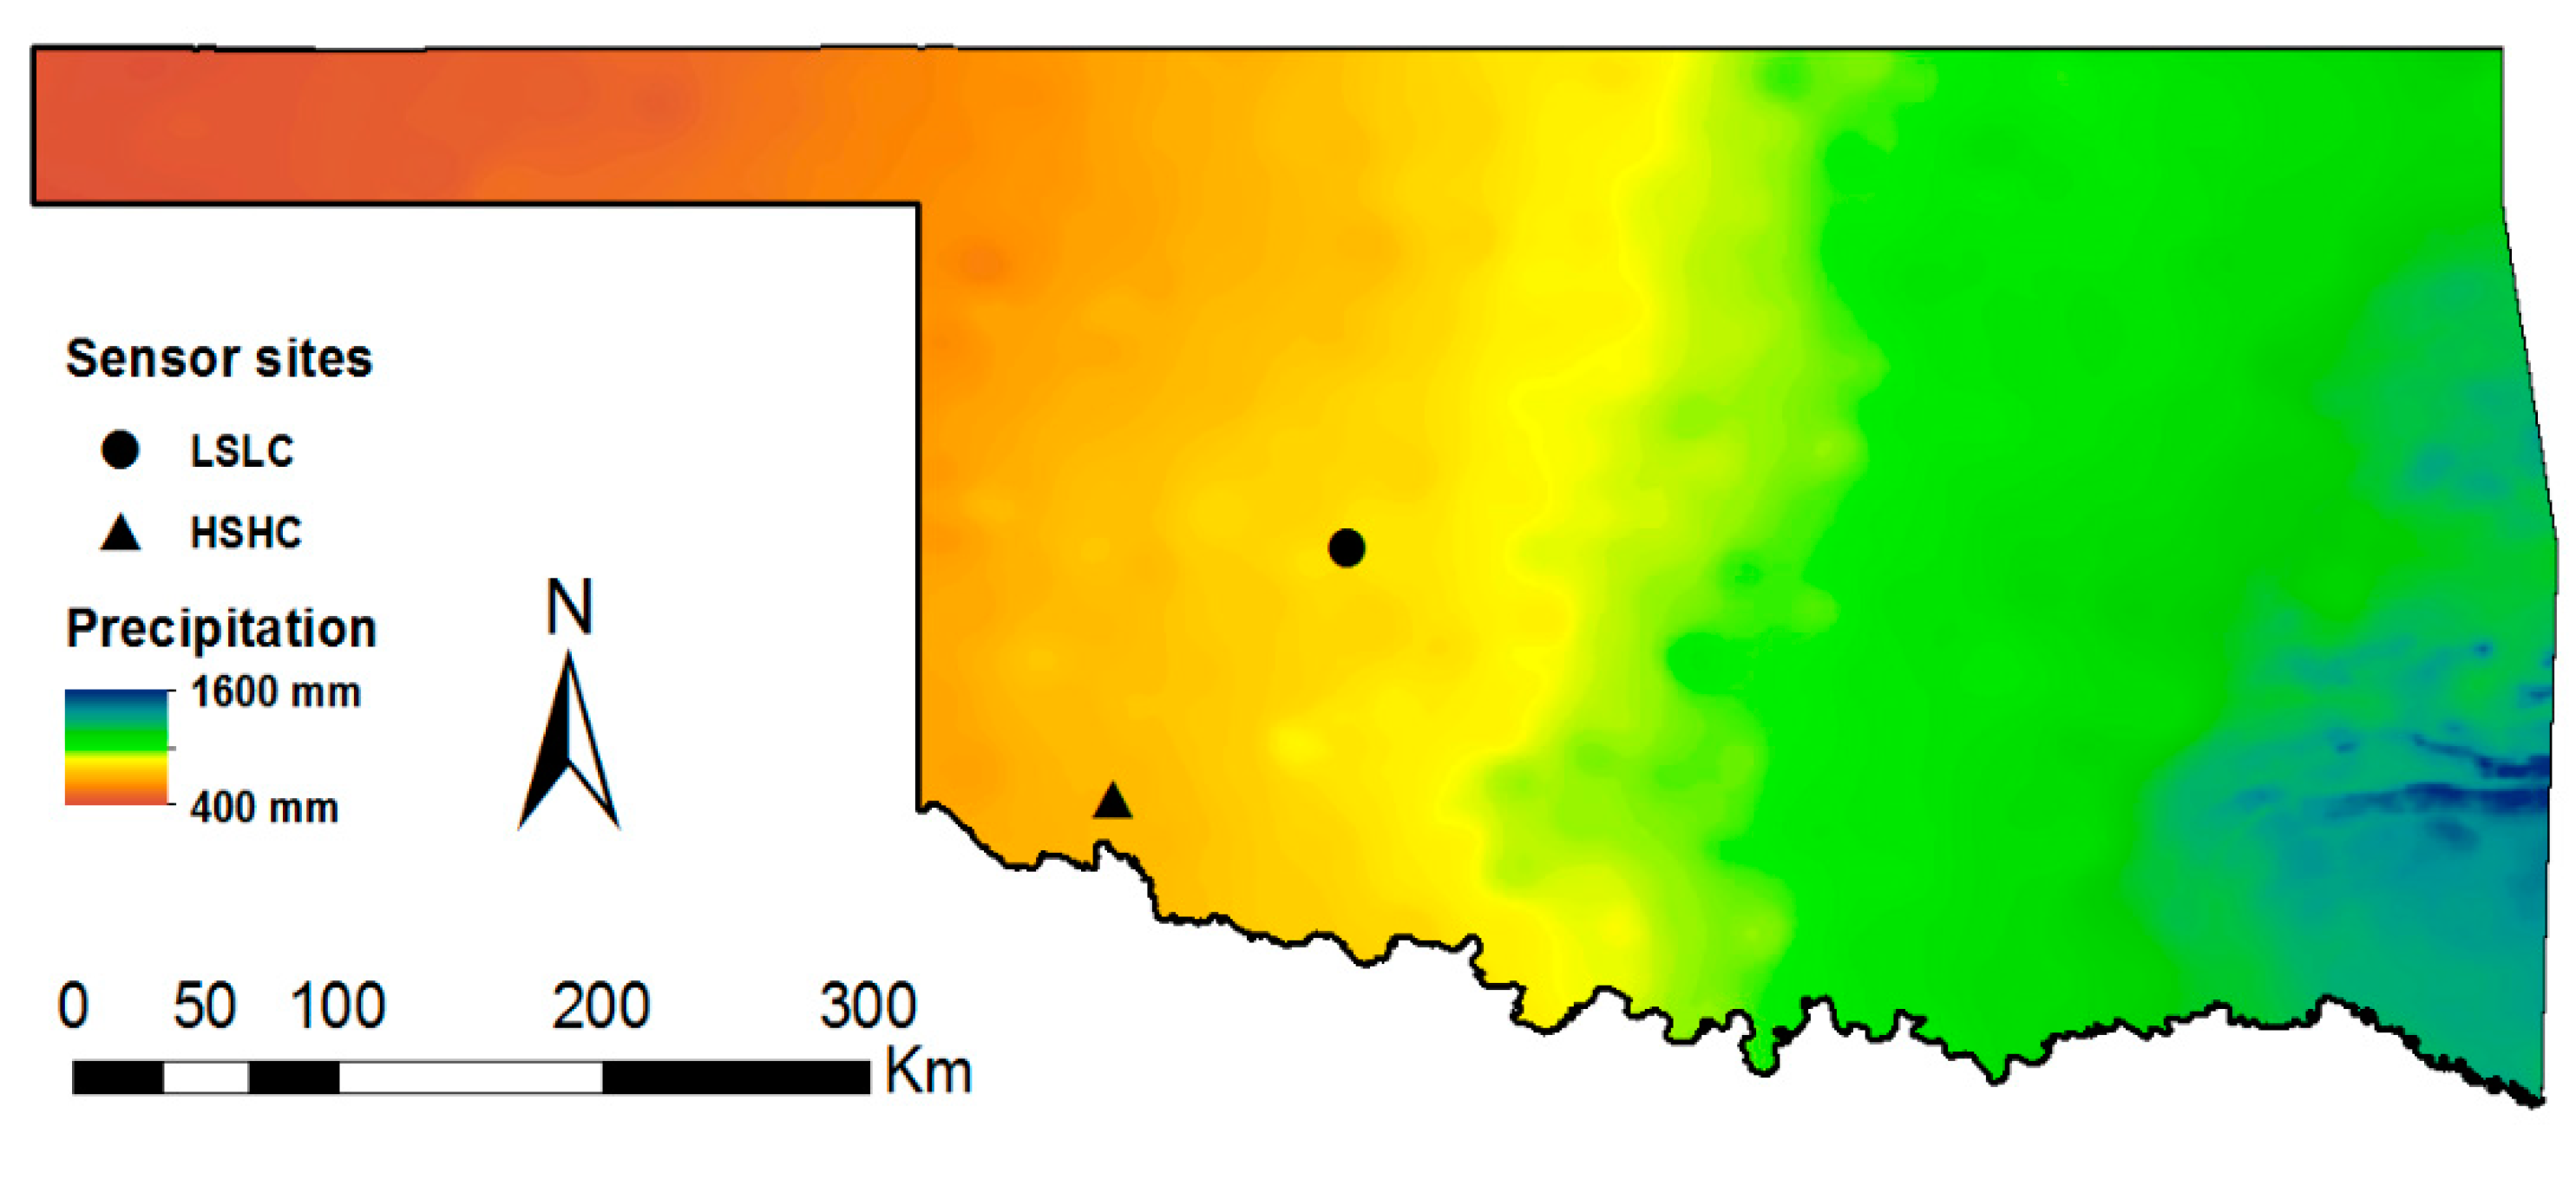
2.2. Study Sites
2.3. Experimental Setup
2.4. Soil Moisture Thresholds
2.5. Statistical Analysis
3. Results and Discussion
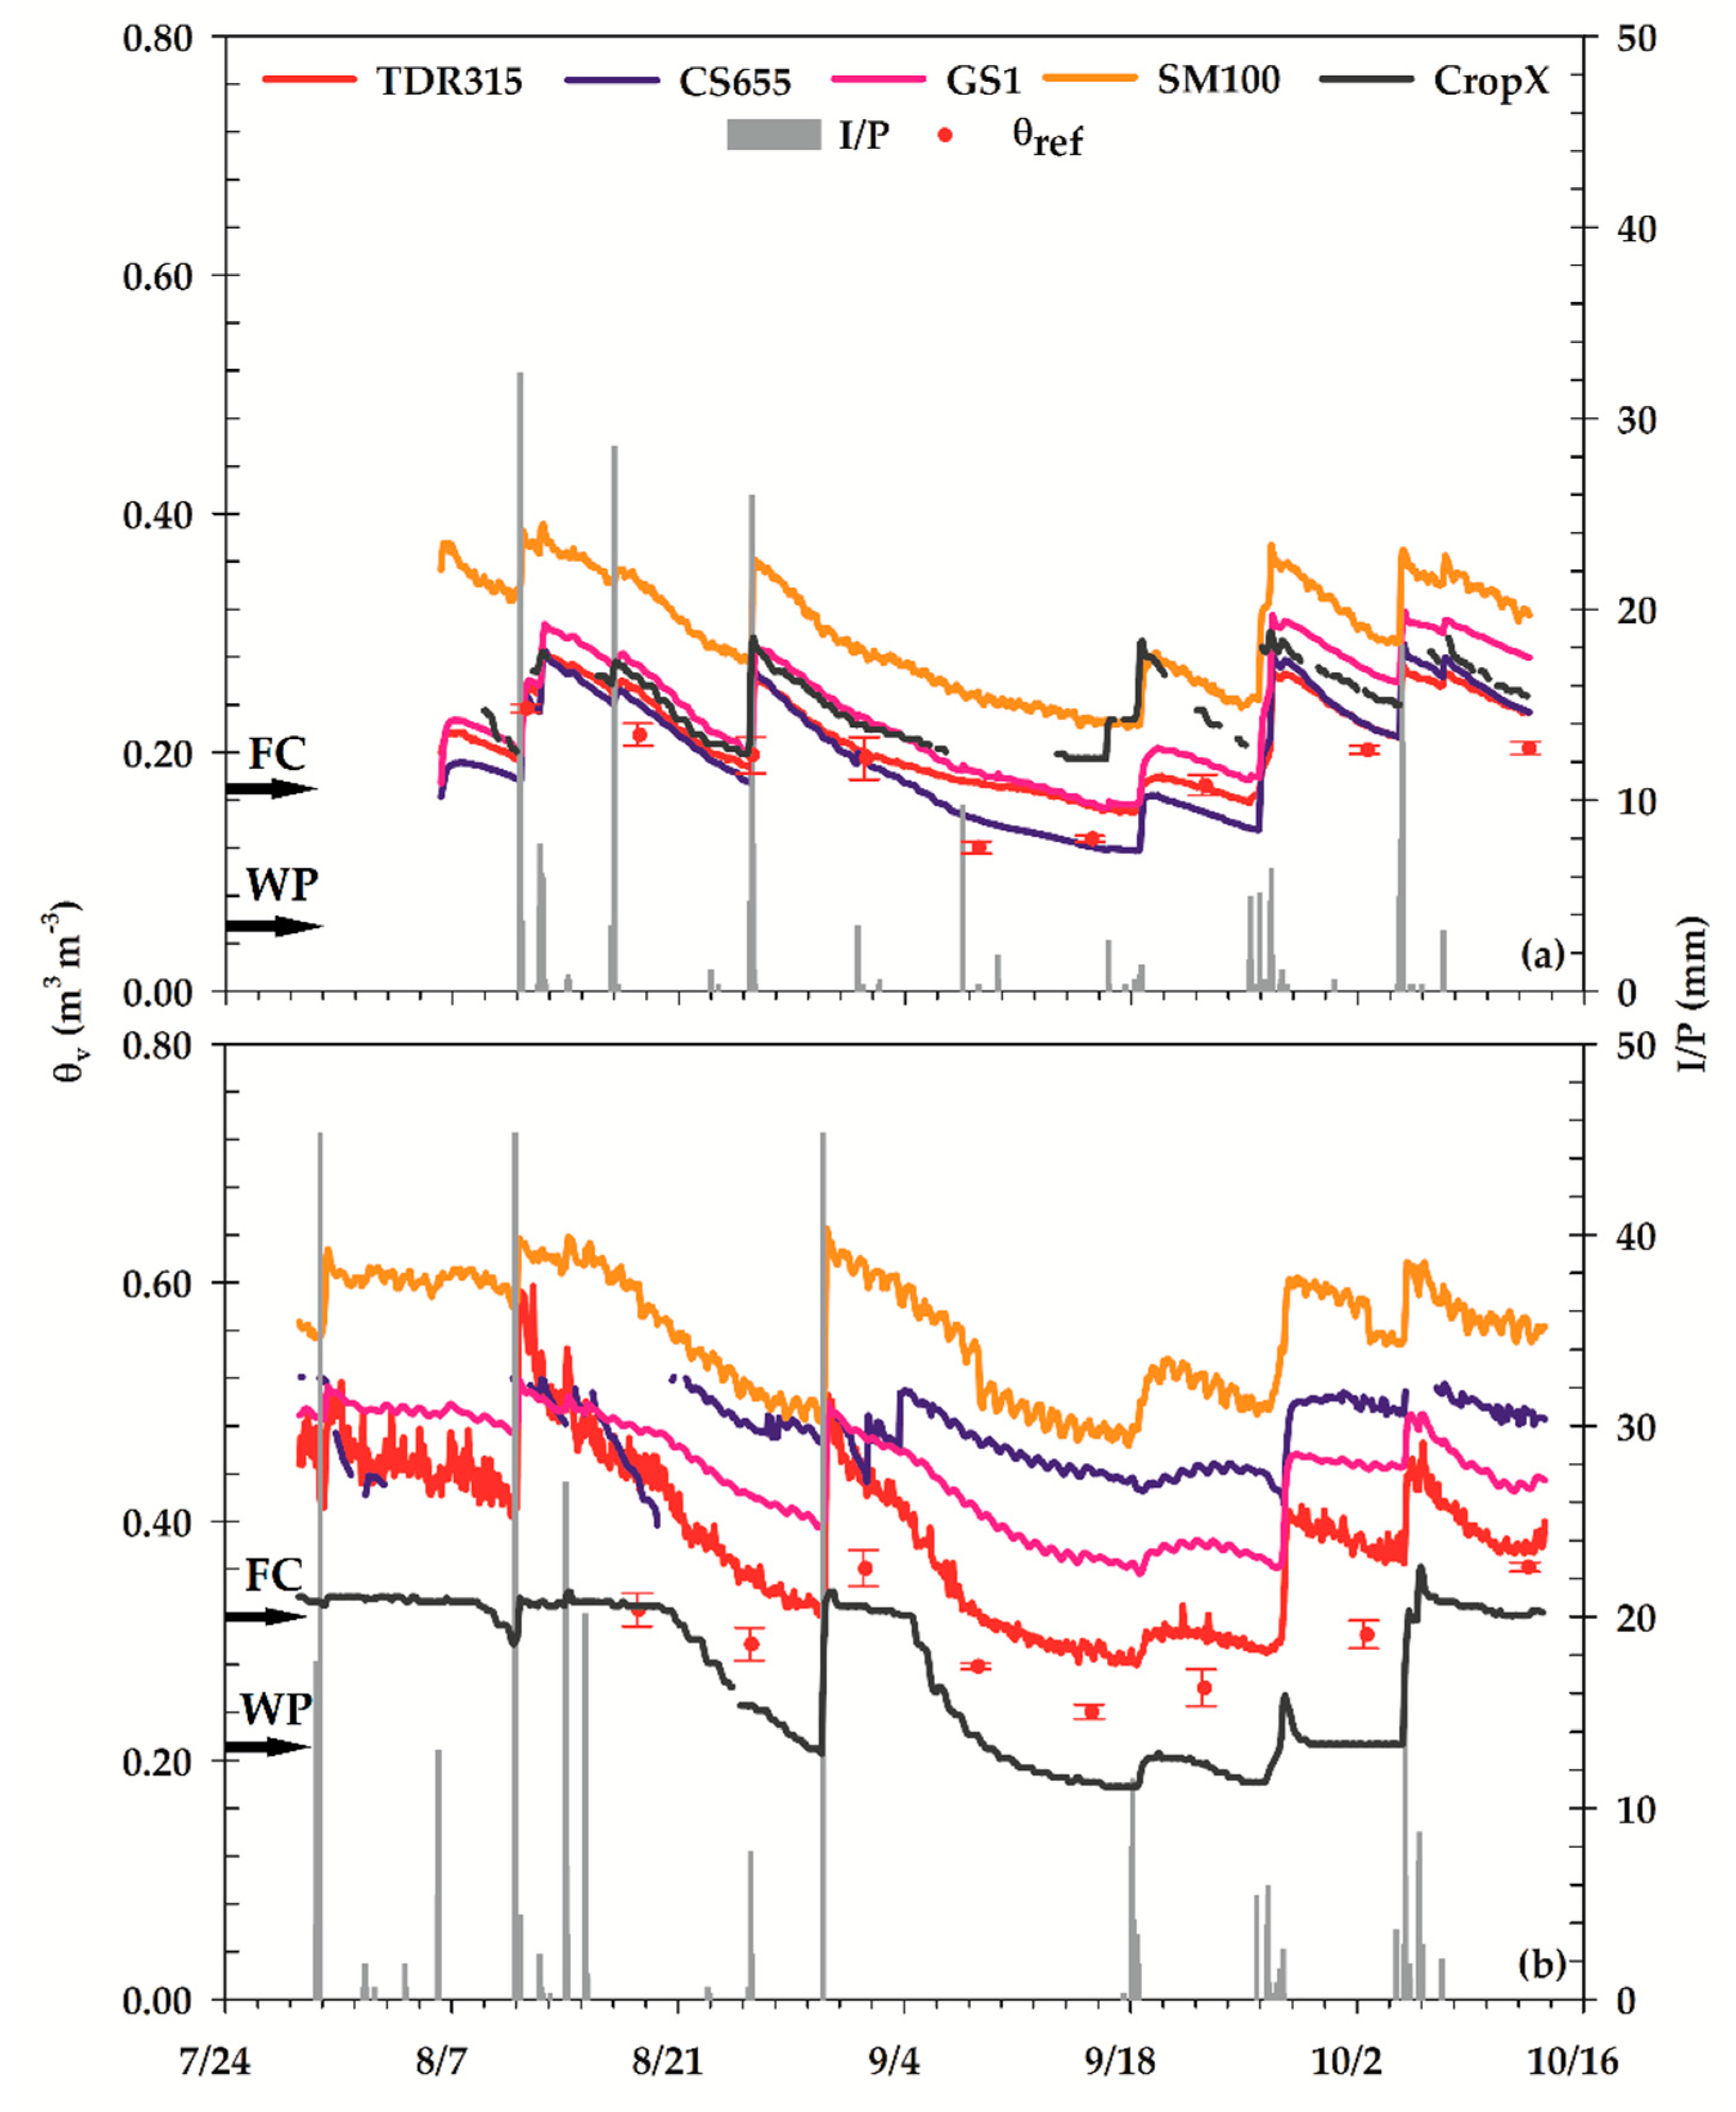
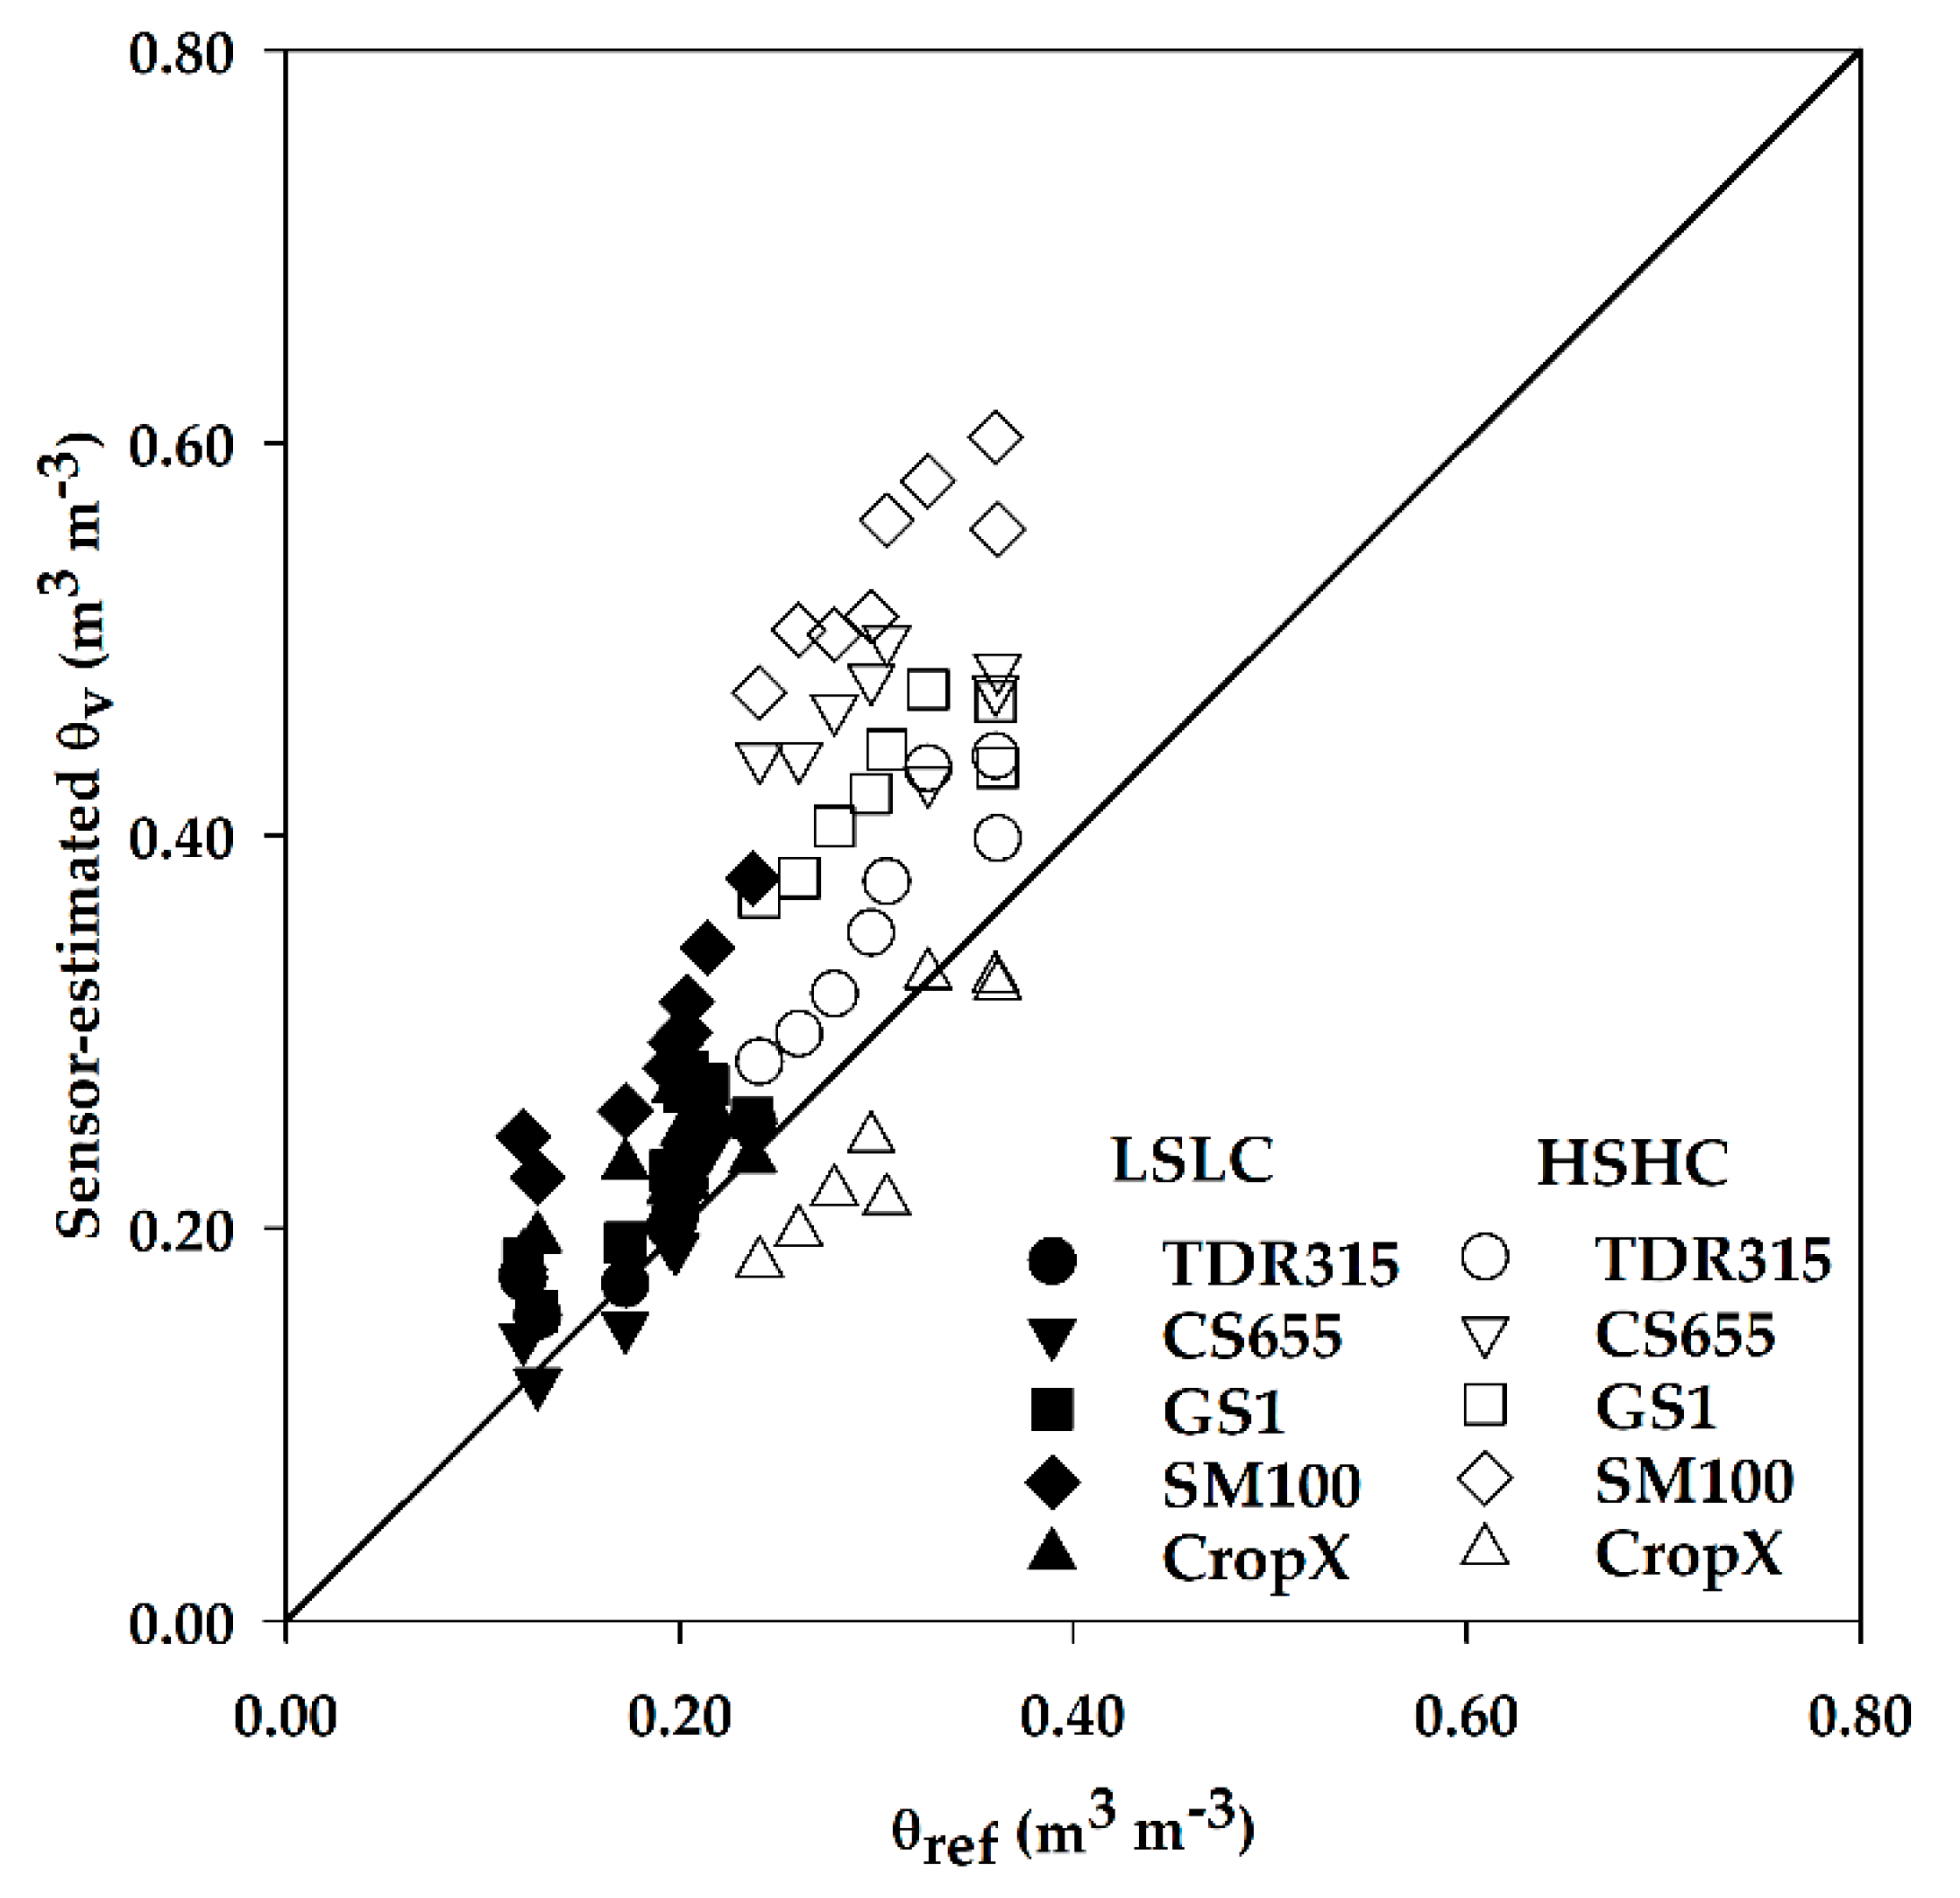
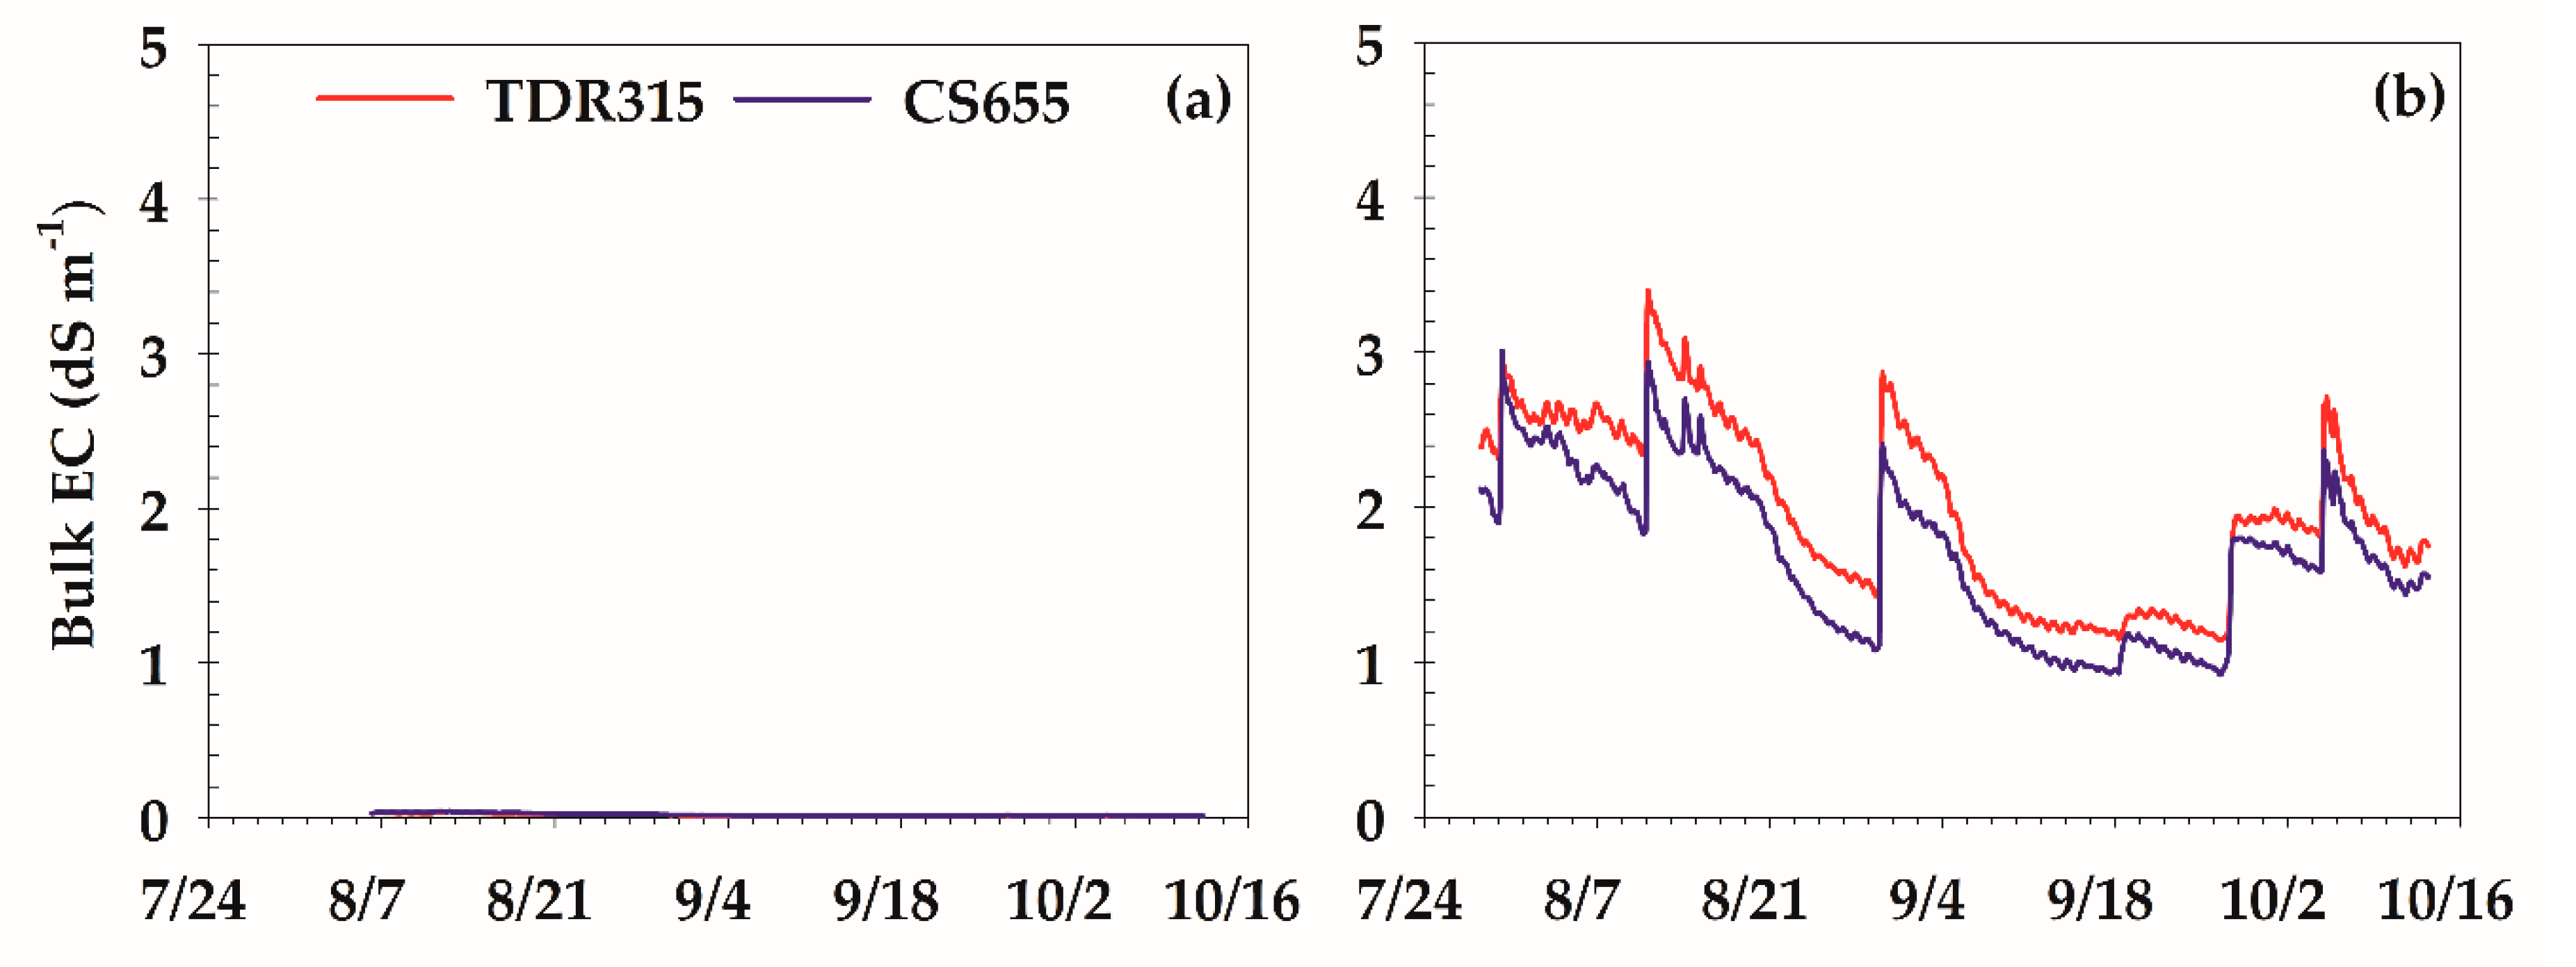
3.1. Sensor Performance
3.2. Correlations between Sensors
3.3. Soil Moisture Thresholds
4. Conclusions
Author Contributions
Funding
Commercial Endorsement Disclaimer
Conflicts of Interest
References
- United States Department of Agriculture (USDA). Farm and Ranch Irrigation Survey (2013); National Agricultural Statistics Service, Ed.; USDA: Washington, DC, USA, 2014; Volume 3, p. 266.
- Maupin, M.A.; Kenny, J.F.; Hutson, S.S.; Lovelace, J.K.; Barber, N.L.; Linsey, K.S. Estimated Use of Water in the United States in 2010; US Geological Survey: Reston, VA, USA, 2014.
- Fischer, G.; Tubiello, F.N.; Van Velthuizen, H.; Wiberg, D.A. Climate change impacts on irrigation water requirements: Effects of mitigation, 1990–2080. Technol. Forecast. Soc. Chang. 2007, 74, 1083–1107. [Google Scholar] [CrossRef] [Green Version]
- Fishman, R.M. Climate Change, Rainfall Variability, and Adaptation through Irrigation: Evidence from Indian Agriculture. Unpublished work. 2012.
- Datta, S.; Taghvaeian, S.; Stivers, J. Understanding Soil Water Content and Thresholds for Irrigation Management; Oklahoma Cooperative Extension Service: Stillwater, OK, USA, 2017. [Google Scholar]
- Broner, I. Irrigation scheduling. In Service in Action; No. 4.708; Colorado State University Extension: Fort Collins, CO, USA, 2005. [Google Scholar]
- Martin, E. Methods of Measuring for Irrigation Scheduling—WHEN; Arizona Cooperative Extension: Tucson, AZ, USA, 2009. [Google Scholar]
- Martin, E.C.; Pegelow, E.J.; Stedman, S. Comparison of Irrigation Scheduling Methods in Cotton Production; College of Agriculture, University of Arizona: Tucson, AZ, USA, 1995. [Google Scholar]
- Fisher, D.K.; Hanks, J.E.; Pringle, H.L., III. Comparison of Irrigation Scheduling Methods in the Humid Mid-South. Irrigation Association. 2009. Available online: https://www.irrigation.org/IA/FileUploads/IA/Resources/TechnicalPapers/2009/ComparisonOfIrrigationSchedulingMethodsInTheHumidMid-South.pdf (accessed on 21 August 2018).
- Sui, R. Irrigation Scheduling Using Soil Moisture Sensors. J. Agric. Sci. 2017, 10, 1. [Google Scholar] [CrossRef]
- Kebede, H.; Fisher, D.K.; Sui, R.; Reddy, K.N. Irrigation Methods and Scheduling in the Delta Region of Mississippi: Current Status and Strategies to Improve Irrigation Efficiency. Am. J. Plant Sci. 2014, 5, 50005. [Google Scholar] [CrossRef]
- Zotarelli, L.; Scholberg, J.M.; Dukes, M.D.; Muñoz-Carpena, R.; Icerman, J. Tomato yield, biomass accumulation, root distribution and irrigation water use efficiency on a sandy soil, as affected by nitrogen rate and irrigation scheduling. Agric. Water Manag. 2009, 96, 23–34. [Google Scholar] [CrossRef]
- Cardenas-Lailhacar, B.; Dukes, M. Precision of soil moisture sensor irrigation controllers under field conditions. Agric. Water Manag. 2010, 97, 666–672. [Google Scholar] [CrossRef]
- Yoder, R.; Johnson, D.; Wilkerson, J.; Yoder, D. Soilwater sensor performance. Appl. Eng. Agric. 1998, 14, 121–133. [Google Scholar] [CrossRef]
- Dalton, F. Development of time-domain reflectometry for measuring soil water content and bulk soil electrical conductivity. In Advances in Measurement of Soil Physical Properties: Bringing Theory into Practice; Topp, G.C., Daniel, W.D., Green, R.E., Eds.; Soil Science Society of America: Madison, WI, USA, 1992; pp. 143–167. [Google Scholar]
- Wyseure, G.; Mojid, M.; Malik, M. Measurement of volumetric water content by TDR in saline soils. Eur. J. Soil Sci. 1997, 48, 347–354. [Google Scholar] [CrossRef]
- Topp, G.C.; Davis, J.; Annan, A.P. Electromagnetic determination of soil water content: Measurements in coaxial transmission lines. Water Resour. Res. 1980, 16, 574–582. [Google Scholar] [CrossRef]
- Schwartz, R.C.; Evett, S.R.; Anderson, S.K.; Anderson, D.J. Evaluation of a Direct-Coupled Time-Domain Reflectometry for Determination of Soil Water Content and Bulk Electrical Conductivity. Vadose Zone J. 2016, 15, 8. [Google Scholar] [CrossRef]
- Rüdiger, C.; Western, A.W.; Walker, J.P.; Smith, A.B.; Kalma, J.D.; Willgoose, G.R. Towards a general equation for frequency domain reflectometers. J. Hydrol. 2010, 383, 319–329. [Google Scholar] [CrossRef]
- Fares, A.; Abbas, F.; Maria, D.; Mair, A. Improved calibration functions of three capacitance probes for the measurement of soil moisture in tropical soils. Sensors 2011, 11, 4858–4874. [Google Scholar] [CrossRef] [PubMed]
- Mittelbach, H.; Lehner, I.; Seneviratne, S.I. Comparison of four soil moisture sensor types under field conditions in Switzerland. J. Hydrol. 2012, 430, 39–49. [Google Scholar] [CrossRef]
- Robinson, D.; Jones, S.B.; Wraith, J.; Or, D.; Friedman, S. A review of advances in dielectric and electrical conductivity measurement in soils using time domain reflectometry. Vadose Zone J. 2003, 2, 444–475. [Google Scholar] [CrossRef]
- Chávez, J.L.; Varble, J.L.; Andales, A.A. Performance evaluation of selected soil moisture sensors. In Proceedings of the 23rd Central Plains Irrigation Conference, Burlington, CO, USA, 22–23 February 2011; pp. 29–38. [Google Scholar]
- Environment, M. GS1: Soil Moisture Sensor Operations Manual; METER Group, Inc.: Pullman, WA, USA, 2015; p. 22. [Google Scholar]
- Daly, C.; Halbleib, M.; Smith, J.I.; Gibson, W.P.; Doggett, M.K.; Taylor, G.H.; Curtis, J.; Pasteris, P.P. Physiographically sensitive mapping of climatological temperature and precipitation across the conterminous United States. Int. J. Climatol. 2008, 28, 2031–2064. [Google Scholar] [CrossRef] [Green Version]
- Leib, B.G.; Jabro, J.D.; Matthews, G.R. Field evaluation and performance comparison of soil moisture sensors. Soil Sci. 2003, 168, 396–408. [Google Scholar] [CrossRef]
- Brutsaert, W. Daily evaporation from drying soil: Universal parameterization with similarity. Water Resour. Res. 2014, 50, 3206–3215. [Google Scholar] [CrossRef]
- Ashworth, J.; Keyes, D.; Kirk, R.; Lessard, R. Standard procedure in the hydrometer method for particle size analysis. Commun. Soil Sci. Plant Anal. 2001, 32, 633–642. [Google Scholar] [CrossRef]
- Zhang, H.; Kress, M.F.; Johnson, G.V. Procedures Used by OSU Soil, Water, and Forage Analytical Laboratory; Division of Agricultural Sciences and Natural Resources, Oklahoma State University: Stillwater, OK, USA, 2002. [Google Scholar]
- Aguilar, J.; Rogers, D.; Kisekka, I. Irrigation Scheduling Based on Soil Moisture Sensors and Evapotranspiration. Kansas Agric. Exp. Stn. Res. Rep. 2015, 1, 20. [Google Scholar] [CrossRef] [Green Version]
- McPherson, R.A.; Fiebrich, C.A.; Crawford, K.C.; Kilby, J.R.; Grimsley, D.L.; Martinez, J.E.; Basara, J.B.; Illston, B.G.; Morris, D.A.; Kloesel, K.A. Statewide monitoring of the mesoscale environment: A technical update on the Oklahoma Mesonet. J. Atmos. Ocean. Technol. 2007, 24, 301–321. [Google Scholar] [CrossRef]
- Van Lier, Q.d.J. Field capacity, a valid upper limit of crop available water? Agric. Water Manag. 2017, 193, 214–220. [Google Scholar] [CrossRef]
- Tolk, J.A. Soils, Permanent Wilting Points. In Encyclopedia of Water Science; Taylor & Francis: New York, NY, USA, 2003. [Google Scholar]
- Schaap, M.G.; Leij, F.J.; Van Genuchten, M.T. Rosetta: A computer program for estimating soil hydraulic parameters with hierarchical pedotransfer functions. J. Hydrol. 2001, 251, 163–176. [Google Scholar] [CrossRef]
- Dane, J.H.; Hopmans, J.W. Water retention and storage—Introduction. In Methods of Soil Analysis Part 4; Dane, J.H., Topp, G.C., Eds.; Soil Science Society of America: Madison, WI, USA, 2002; pp. 671–717. [Google Scholar]
- Hunt, E.D.; Hubbard, K.G.; Wilhite, D.A.; Arkebauer, T.J.; Dutcher, A.L. The development and evaluation of a soil moisture index. Int. J. Climatol. 2009, 29, 747–759. [Google Scholar] [CrossRef] [Green Version]
- NRCS. Web Soil Survey. 2009. Available online: http://www.websoilsurvey.ncsc.usda.gov/app/ (accessed on 29 October 2017).
- Cassel, D.; Nielsen, D. Field Capacity and Available Water Capacity. In Methods of Soil Analysis Part 1; Klute, A., Ed.; Soil Science Society of America: Madison, WI, USA, 1986; pp. 901–926. [Google Scholar]
- Moriasi, D.N.; Arnold, J.G.; Van Liew, M.W.; Bingner, R.L.; Harmel, R.D.; Veith, T.L. Model evaluation guidelines for systematic quantification of accuracy in watershed simulations. Trans. ASABE 2007, 50, 885–900. [Google Scholar] [CrossRef]
- Addiscott, T.; Whitmore, A. Computer simulation of changes in soil mineral nitrogen and crop nitrogen during autumn, winter and spring. J. Agric. Sci. 1987, 109, 141–157. [Google Scholar] [CrossRef]
- Willmott, C.J. On the validation of models. Phys. Geogr. 1981, 2, 184–194. [Google Scholar] [CrossRef]
- Mishra, A.; Vu, T.; Veettil, A.V.; Entekhabi, D. Drought monitoring with soil moisture active passive (SMAP) measurements. J. Hydrol. 2017, 552, 620–632. [Google Scholar] [CrossRef]
- Cosh, M.H.; Jackson, T.J.; Bindlish, R.; Prueger, J.H. Watershed scale temporal and spatial stability of soil moisture and its role in validating satellite estimates. Remote Sens. Environ. 2004, 92, 427–435. [Google Scholar] [CrossRef]
- Montgomery, D.C.; Peck, E.A.; Vining, G.G. Introduction to Linear Regression Analysis; John Wiley & Sons: Hoboken, NJ, USA, 2012; Volume 821. [Google Scholar]
- Singh, J.; Lo, T.; Rudnick, D.R.; Dorr, T.J.; Burr, C.A.; Werle, R.; Shaver, T.M.; Muñoz-Arriola, F. Performance assessment of factory and field calibrations for electromagnetic sensors in a loam soil. Agric. Water Manag. 2018, 196, 87–98. [Google Scholar] [CrossRef]
- Adeyemi, O.; Norton, T.; Grove, I.; Peets, S. Performance evaluation of three newly developed soil moisture sensors. In Proceedings of the CIGR-AgEng Conference, Aarhus, Denmark, 26–29 June 2016; pp. 26–29. [Google Scholar]
- Kisekka, I.; Aguilar, J.; Lamm, F.; Rogers, D. Using Soil Water and Canopy Temperature to Improve Irrigation Scheduling for Corn. In Proceedings of the 2014 Irrigation Association Conference, Phoenix, AZ, USA, 3–6 November 2014. [Google Scholar]
- Michel, A.; Brown, H.; Gillespie, R.; George, M.; Meenken, E. Automated measurement of crop water balances under a mobile rain-exclusion facility. Agron. N. Z. 2015, 45, 39–46. [Google Scholar]
- Wyatt, B.M.; Ochsner, T.E.; Fiebrich, C.A.; Neel, C.R.; Wallace, D.S. Useful Drainage Estimates Obtained from a Large-Scale Soil Moisture Monitoring Network by Applying the Unit-Gradient Assumption. Vadose Zone J. 2017, 16, 16. [Google Scholar] [CrossRef]
- Sugita, M.; Kubota, A.; Higuchi, M.; Matsuno, A.; Tanaka, H. Continuous soil moisture monitoring under high salinity conditions by dielectric sensors: A reliability test. Tsukuba Geoenviron. Sci. 2016, 12, 17–22. [Google Scholar]


| Site | Soil Texture | Particle Size Distribution | EC ¥ | θv (m3 m−3) | Ksat † | ||||
|---|---|---|---|---|---|---|---|---|---|
| % Sand | % Silt | % Clay | (dS m−1) | Sat. ‡ | FC § | WP * | (mm day−1) | ||
| LSLC | Fine sandy loam | 72.2 | 14.4 | 13.4 | 1.2 | 0.34 | 0.17 | 0.05 | 390.0 |
| HSHC | Silty clay loam | 23.5 | 37.8 | 38.7 | 7.0 | 0.39 | 0.32 | 0.21 | 32.4 |
| Parameter | Annual | Study Period | ||
|---|---|---|---|---|
| LSLC | HSHC | LSLC | HSHC | |
| Total Prec. 1 (mm) | 752 | 616 | 451 | 340 |
| Mean Rs 2 (MJ m−2) | 17.1 | 17.7 | 19.9 | 21.8 |
| Minimum Tair 3 (°C) | 9.4 | 10.0 | 18.1 | 18.9 |
| Maximum Tair (°C) | 22.1 | 24.1 | 30.6 | 31.2 |
| Mean Tair (°C) | 15.4 | 16.8 | 23.9 | 24.8 |
| Minimum RH 4 (%) | 41.9 | 37.6 | 45.5 | 44.7 |
| Mean VPD 5 (kPa) | 0.9 | 1.0 | 1.0 | 1.1 |
| Mean U2 6 (m s−1) | 2.5 | 2.5 | 3.0 | 2.5 |
| Indicators | TDR315 | CS655 | GS1 | SM100 | CropX | |||||
|---|---|---|---|---|---|---|---|---|---|---|
| LSLC | HSHC | LSLC | HSHC | LSLC | HSHC | LSLC | HSHC | LSLC | HSHC | |
| RMSE (m3 m−3) | 0.028 | 0.064 | 0.019 | 0.165 | 0.048 | 0.122 | 0.110 | 0.233 | 0.051 | 0.055 |
| RSR | 0.76 | 1.55 | 0.53 | 3.99 | 1.31 | 2.97 | 3.00 | 5.66 | 2.53 | 1.34 |
| MBE (m3 m−3) | 0.020 | 0.053 | 0.008 | 0.160 | 0.042 | 0.121 | 0.108 | 0.233 | 0.045 | −0.049 |
| k | 0.85 | 0.69 | 0.94 | 0.30 | 0.69 | 0.41 | 0.44 | 0.26 | 0.58 | 0.75 |
| Site | Sensor | Intercept | Slope | r2 | p-Value |
|---|---|---|---|---|---|
| LSLC | TDR315 | −0.017 | 0.975 | 0.80 | 0.001 |
| CS655 | 0.036 | 0.771 | 0.85 | <0.001 | |
| GS1 | 0.017 | 0.737 | 0.70 | 0.005 | |
| SM100 | −0.033 | 0.747 | 0.84 | 0.001 | |
| CropX | −0.052 | 1.030 | 0.57 | 0.018 | |
| HSHC | TDR315 | 0.056 | 0.683 | 0.85 | 0.001 |
| CS655 | −0.056 | 0.774 | 0.20 | 0.267 Ŧ | |
| GS1 | −0.108 | 0.971 | 0.73 | 0.007 | |
| SM100 | −0.165 | 0.873 | 0.79 | 0.003 | |
| CropX | 0.137 | 0.656 | 0.85 | 0.001 |
| LSLC | |||||
| TDR315 | CS655 | GS1 | SM100 | CropX | |
| TDR315 | 1.00 | ||||
| CS655 | 0.99 | 1.00 | |||
| GS1 | 0.97 | 0.99 | 1.00 | ||
| SM100 | 0.95 | 0.95 | 0.92 | 1.00 | |
| CropX | 0.79 | 0.81 | 0.81 | 0.79 | 1.00 |
| HSHC | |||||
| TDR315 | CS655 | GS1 | SM100 | CropX | |
| TDR315 | 1.00 | ||||
| CS655 | 0.50 | 1.00 | |||
| GS1 | 0.97 | 0.57 | 1.00 | ||
| SM100 | 0.90 | 0.48 | 0.90 | 1.00 | |
| CropX | 0.86 | 0.42 | 0.85 | 0.78 | 1.00 |
| Method | LSLC | HSHC | ||||
|---|---|---|---|---|---|---|
| FC | WP | AWC | FC | WP | AWC | |
| Laboratory 1 | 0.17 | 0.06 | 0.11 | 0.32 | 0.21 | 0.09 |
| Rank-TDR315 2 | 0.27 | 0.16 | 0.11 | 0.49 | 0.29 | 0.20 |
| Rank-CS655 2 | 0.27 | 0.12 | 0.15 | 0.51 | 0.43 | 0.08 |
| Rank-GS1 2 | 0.31 | 0.16 | 0.15 | 0.50 | 0.37 | 0.13 |
| Rank-SM100 2 | 0.37 | 0.23 | 0.14 | 0.62 | 0.48 | 0.14 |
| Rank-CropX 2 | 0.28 | 0.17 | 0.11 | 0.34 | 0.18 | 0.16 |
| Rosetta-TC 3 | 0.17 | 0.06 | 0.11 | 0.31 | 0.12 | 0.19 |
| Rosetta-TI 4 | 0.17 | 0.07 | 0.10 | 0.29 | 0.14 | 0.15 |
| Rosetta-TBD 5 | 0.15 | 0.07 | 0.08 | 0.26 | 0.14 | 0.12 |
| USDA-WSS 6 | 0.21 | 0.12 | 0.09 | 0.29 | 0.21 | 0.08 |
© 2018 by the authors. Licensee MDPI, Basel, Switzerland. This article is an open access article distributed under the terms and conditions of the Creative Commons Attribution (CC BY) license (http://creativecommons.org/licenses/by/4.0/).
Share and Cite
Datta, S.; Taghvaeian, S.; Ochsner, T.E.; Moriasi, D.; Gowda, P.; Steiner, J.L. Performance Assessment of Five Different Soil Moisture Sensors under Irrigated Field Conditions in Oklahoma. Sensors 2018, 18, 3786. https://doi.org/10.3390/s18113786
Datta S, Taghvaeian S, Ochsner TE, Moriasi D, Gowda P, Steiner JL. Performance Assessment of Five Different Soil Moisture Sensors under Irrigated Field Conditions in Oklahoma. Sensors. 2018; 18(11):3786. https://doi.org/10.3390/s18113786
Chicago/Turabian StyleDatta, Sumon, Saleh Taghvaeian, Tyson E. Ochsner, Daniel Moriasi, Prasanna Gowda, and Jean L. Steiner. 2018. "Performance Assessment of Five Different Soil Moisture Sensors under Irrigated Field Conditions in Oklahoma" Sensors 18, no. 11: 3786. https://doi.org/10.3390/s18113786
APA StyleDatta, S., Taghvaeian, S., Ochsner, T. E., Moriasi, D., Gowda, P., & Steiner, J. L. (2018). Performance Assessment of Five Different Soil Moisture Sensors under Irrigated Field Conditions in Oklahoma. Sensors, 18(11), 3786. https://doi.org/10.3390/s18113786